
Exploring the Impacts of Urbanization on Eco-Efficiency in China


Abstract
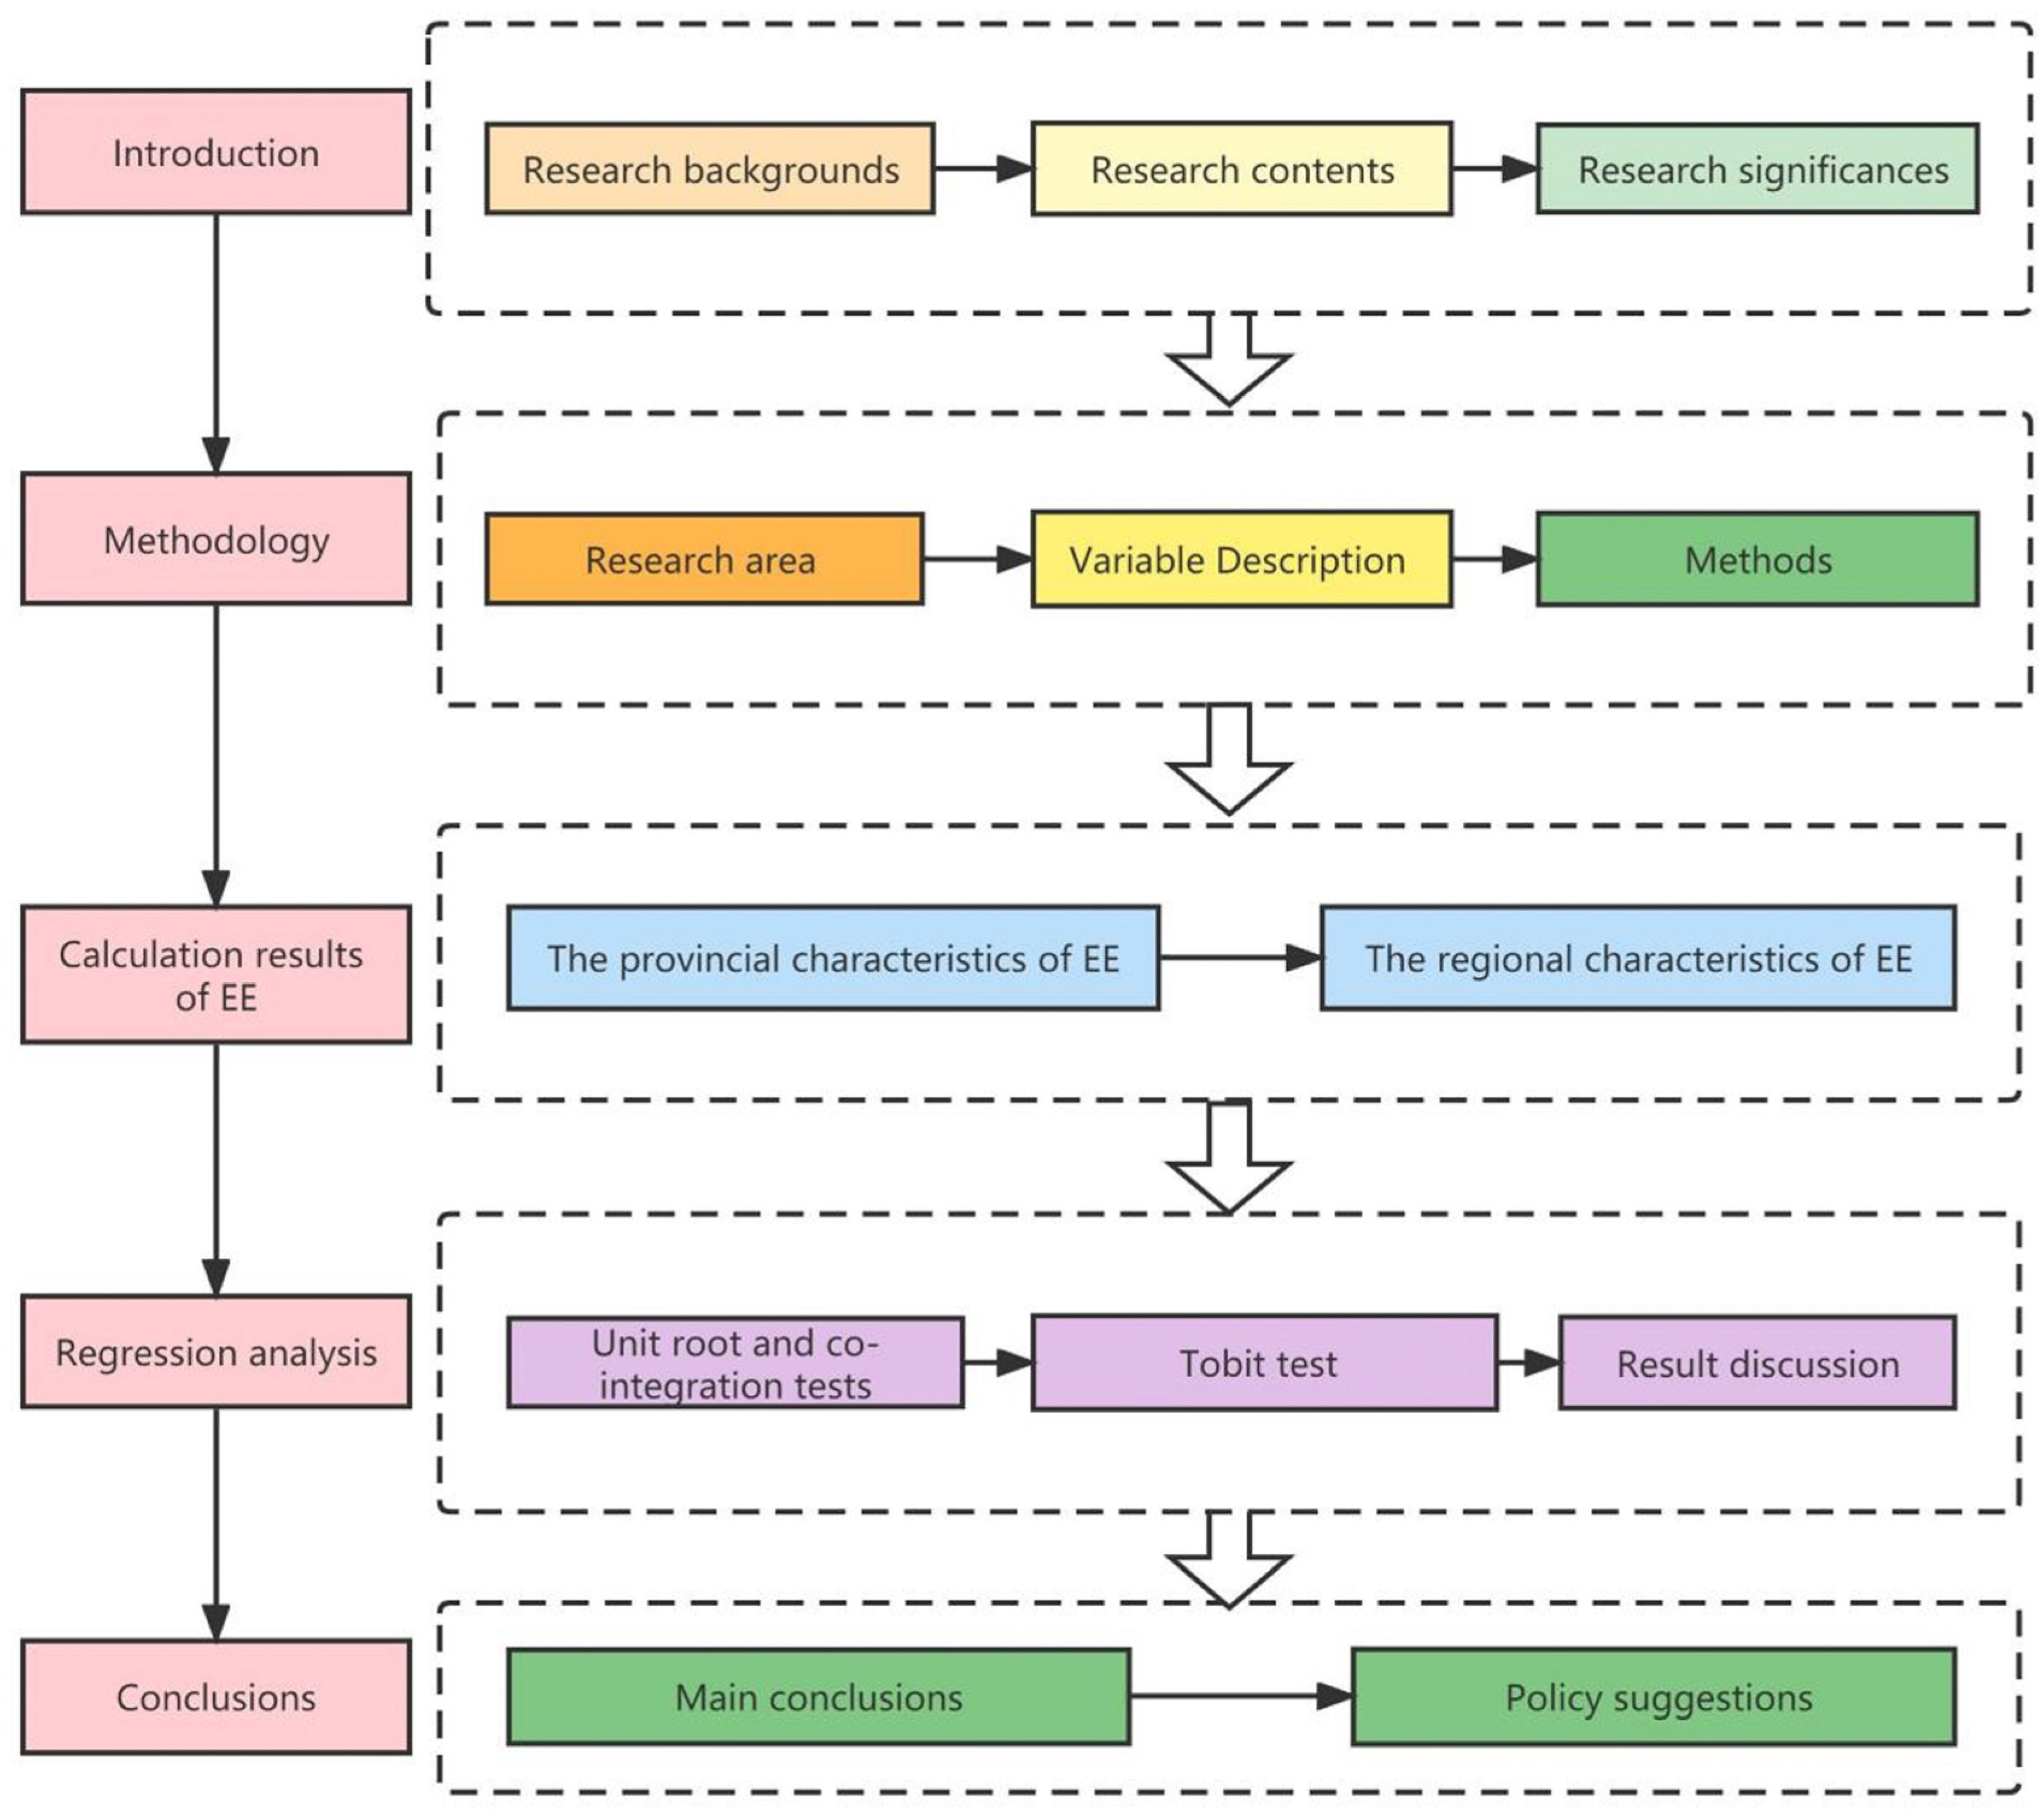
1. Introduction
2. Data and Methodology
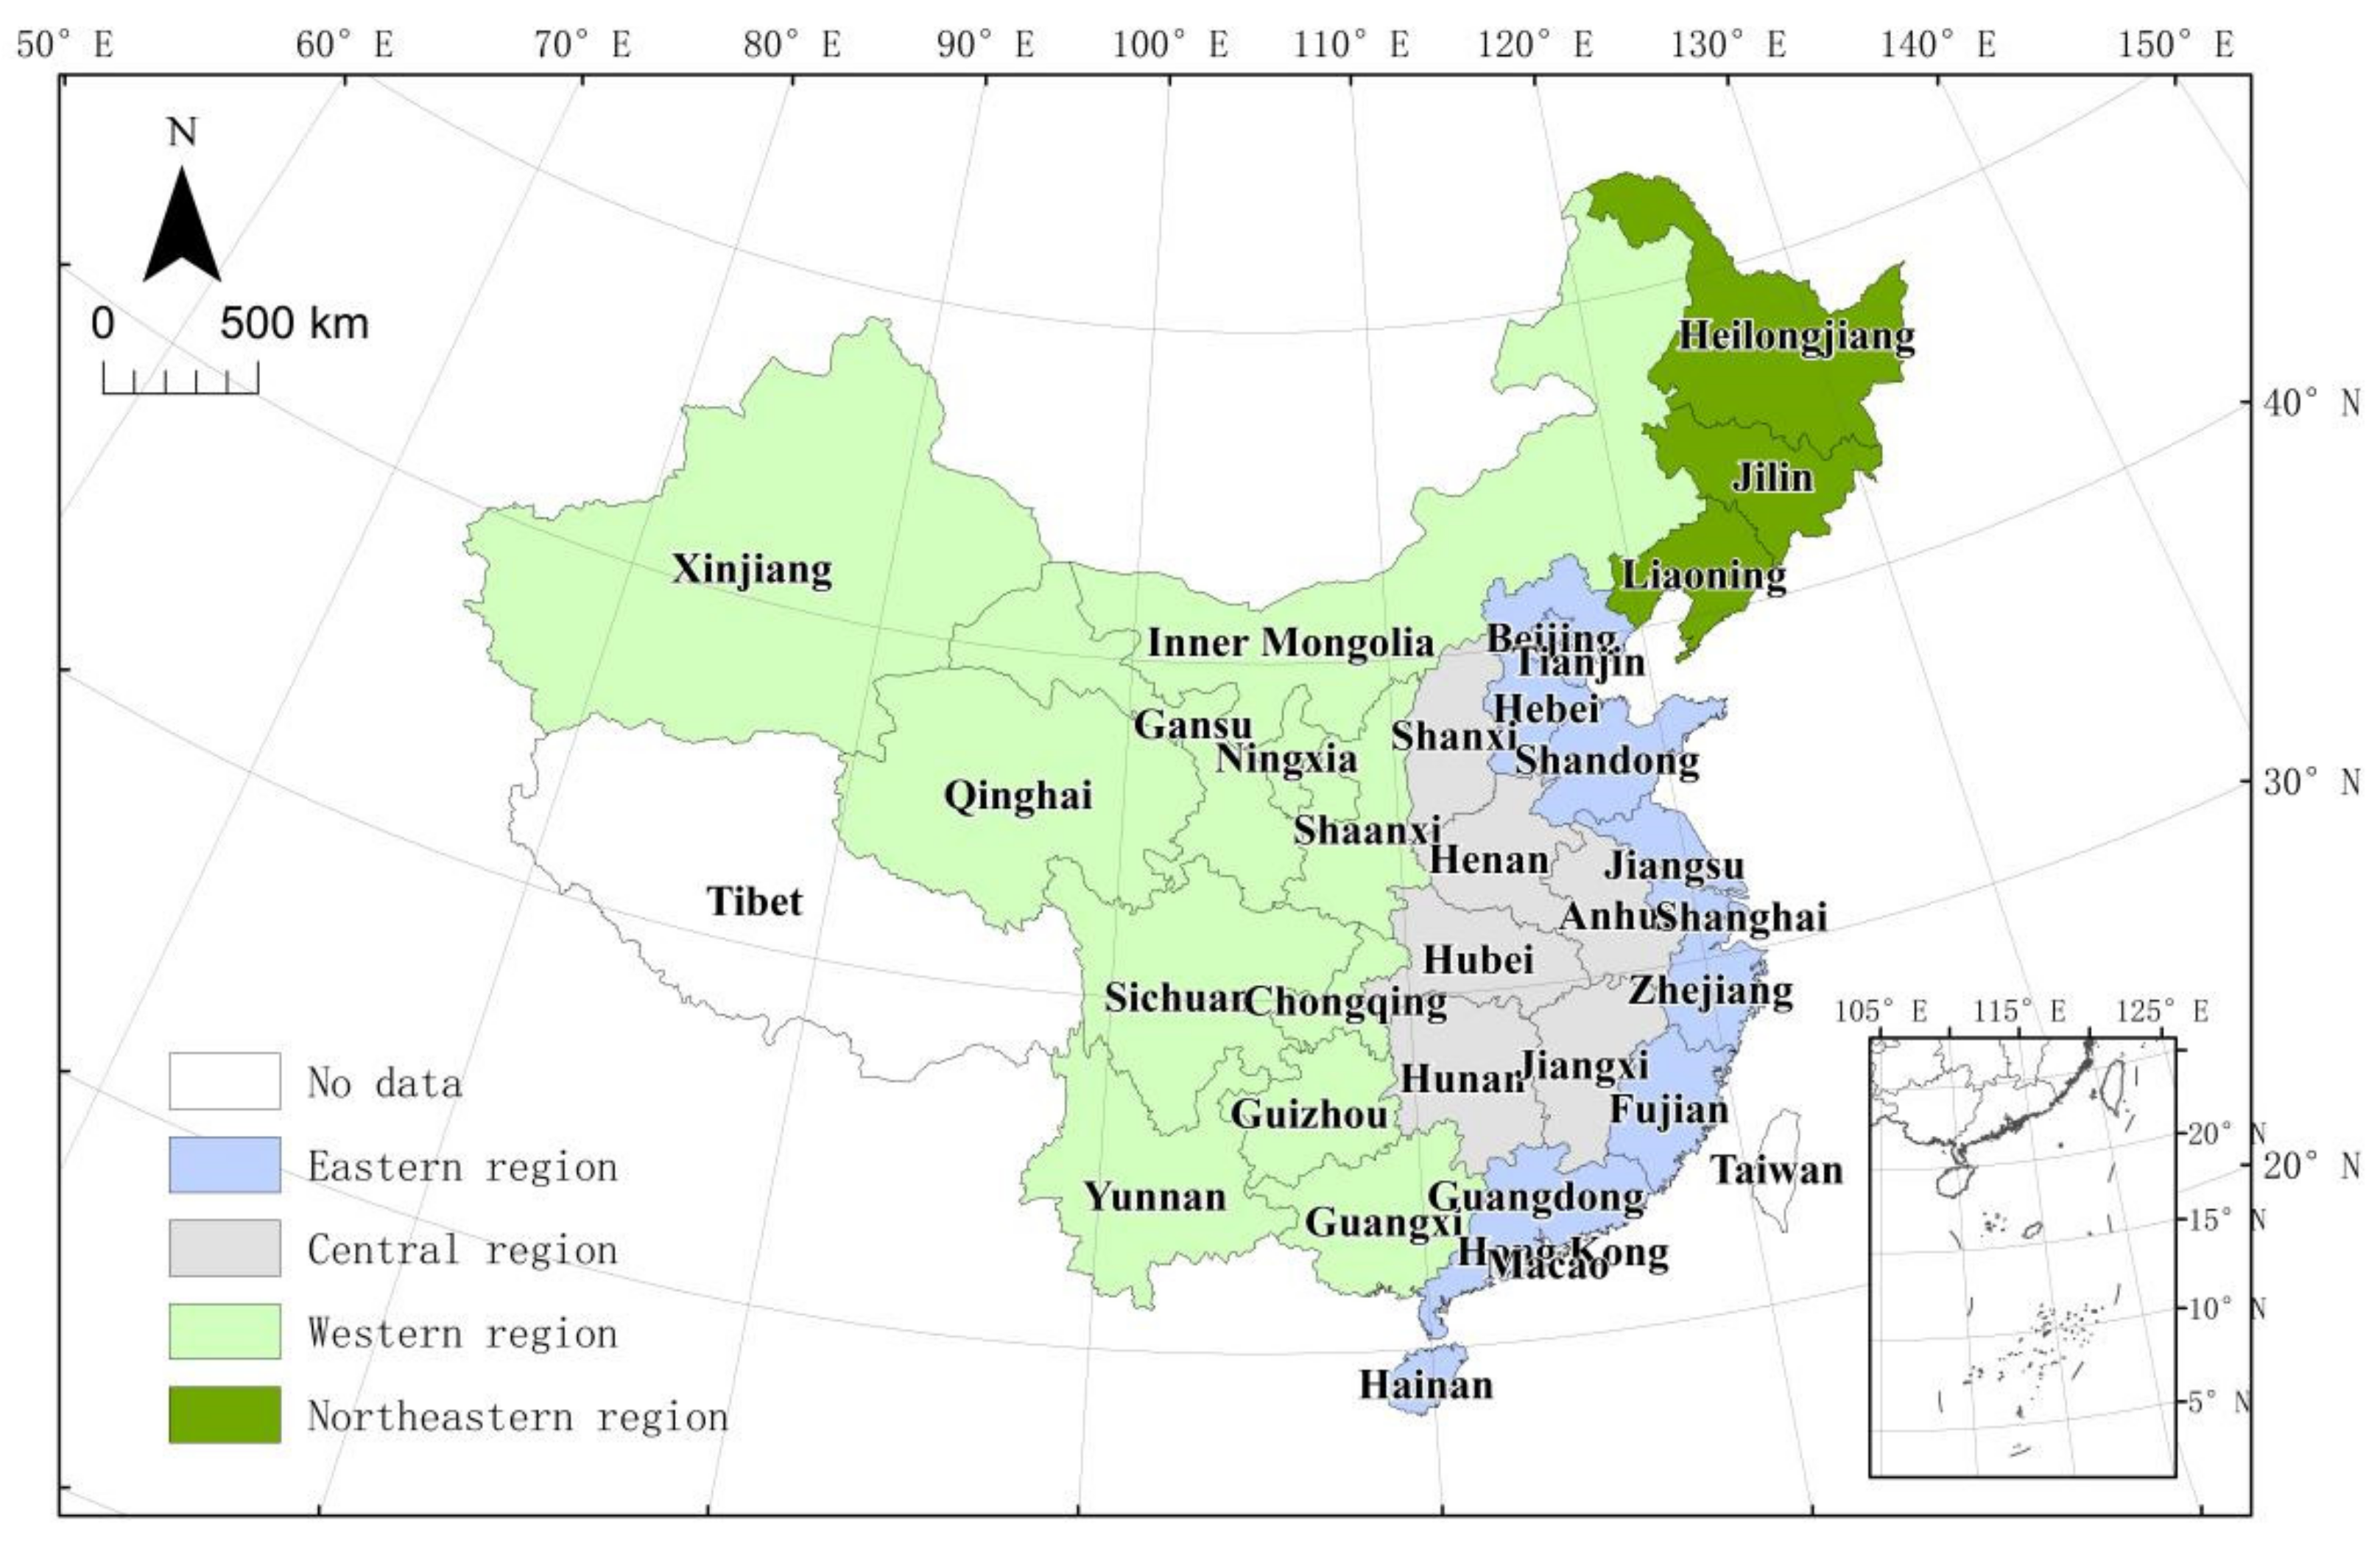
2.1. Research Area and Data
2.2. Variable Description
2.2.1. Explained Variable
2.2.2. Core Explanatory Variable
2.2.3. Control Variables
- (1)
- Economic development level (EDL). The theory of the environmental Kuznets curve holds that environmental degradation exacerbates with economic growth at the initial stage before reaching the peak, and then declines when the economy develops to a higher stage [19]. Economic growth offers strong support for technical development and newer, cleaner production, resulting in improved environmental quality [20]. However, according to the rebound effect, economic growth possibly induces more energy consumption and environmental pollution [21]. Therefore, it is essential to examine whether economic growth is a good thing for EE.
- (2)
- Technical progress level (TPL). The improvement of science and technology can increase economic output and reduce energy consumption [22]. This paper adopted the patent application granted per 100,000 people as the measurement indicator of the technical progress level, and expected that the technical progress level was positively correlated with EE.
- (3)
- Foreign direct investment (FDI). Previous studies show that FDI could lead to knowledge spillovers [23,24,25] and improved institutional quality in some regions in the host country [26]. However, according to the pollution haven hypothesis (PHH), the emissions of high pollution industries may be transferred to developing countries from developed countries due to weak environmental regulations in developing countries [27]. Hence, this paper selected FDI as an important control variable and took the proportion of total FDI to GDP as the proxy variable of the opening level. Nevertheless, the direction of FDI’s impact on EE remains uncertain.

| Explanatory Variable | Definition of the Variables | Pre-Judgment |
|---|---|---|
| Urbanization level (UL) | Proportion of the urban resident population to the total population (%) | Unknown |
| Economic development level (EDL) | GDP per capita (104 RMB) | Unknown |
| Technical progress level (TPL) | Patent application granted per 100,000 people (item) | Positive |
| Foreign direct investment (FDI) | Proportion of the foreign direct investments to GDP (%) | Unknown |
2.3. Methodology
2.3.1. The Epsilon-Based Measure (EBM) Model with Undesirable Outputs
2.3.2. Tobit
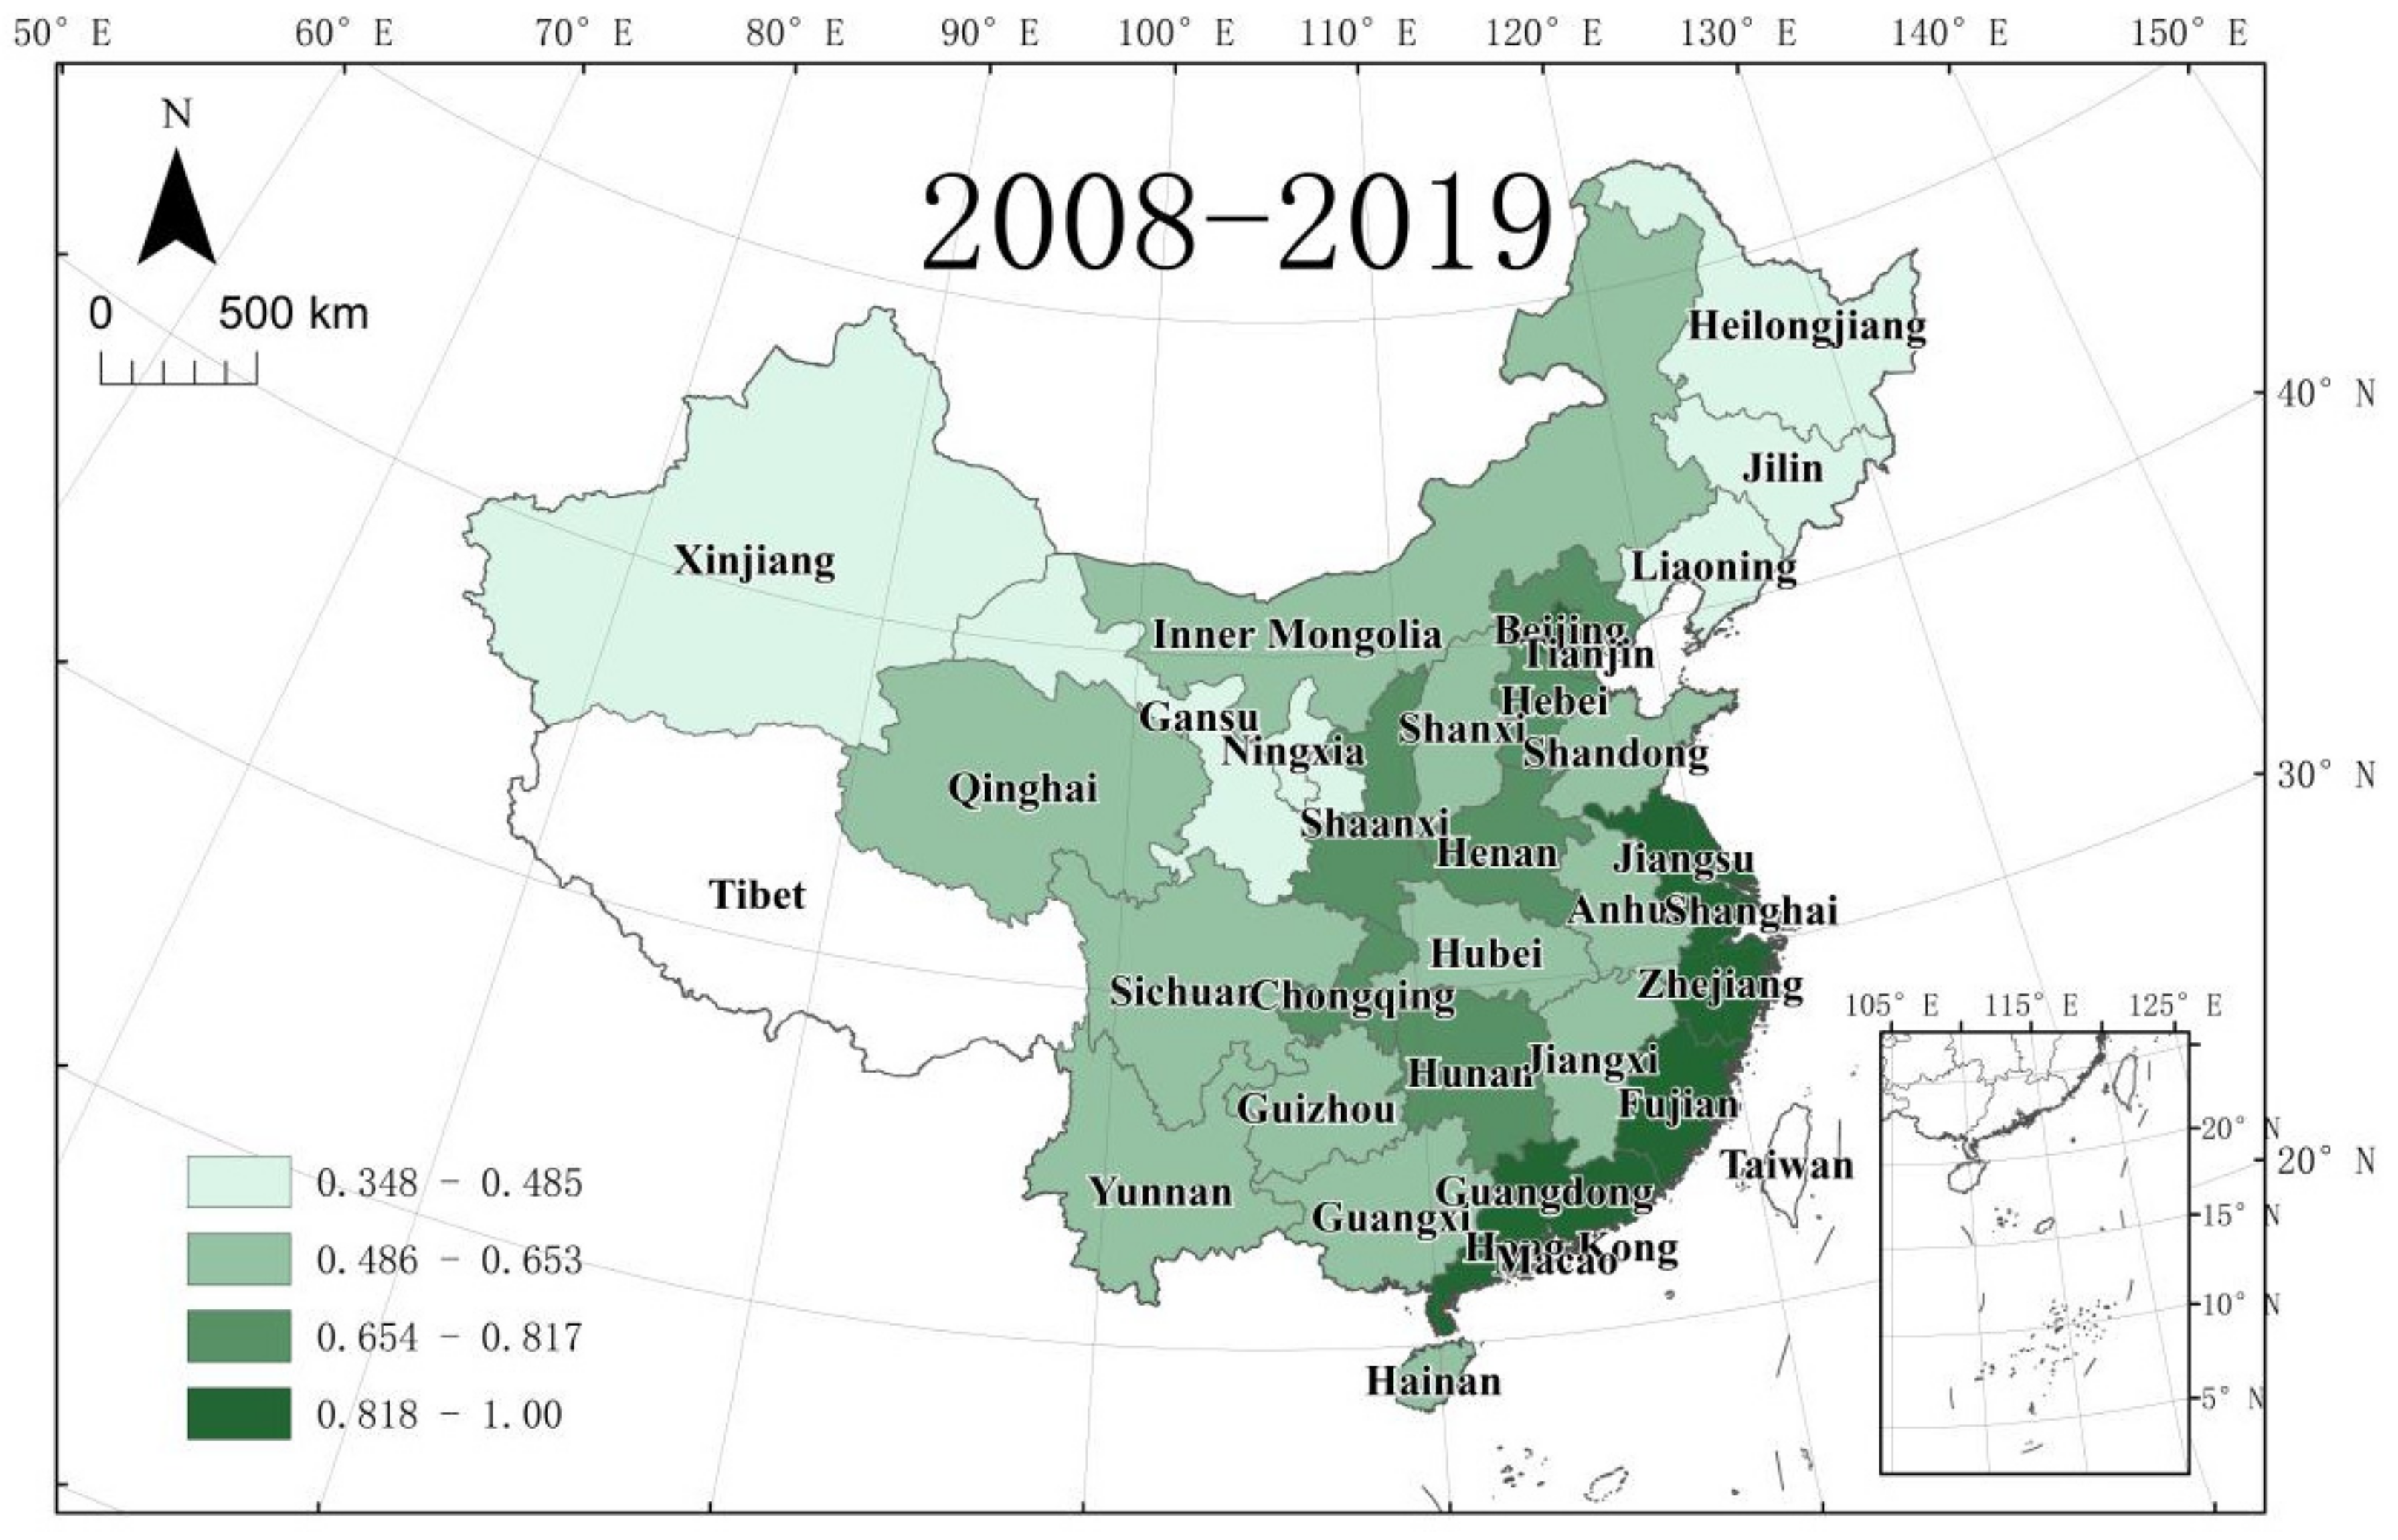
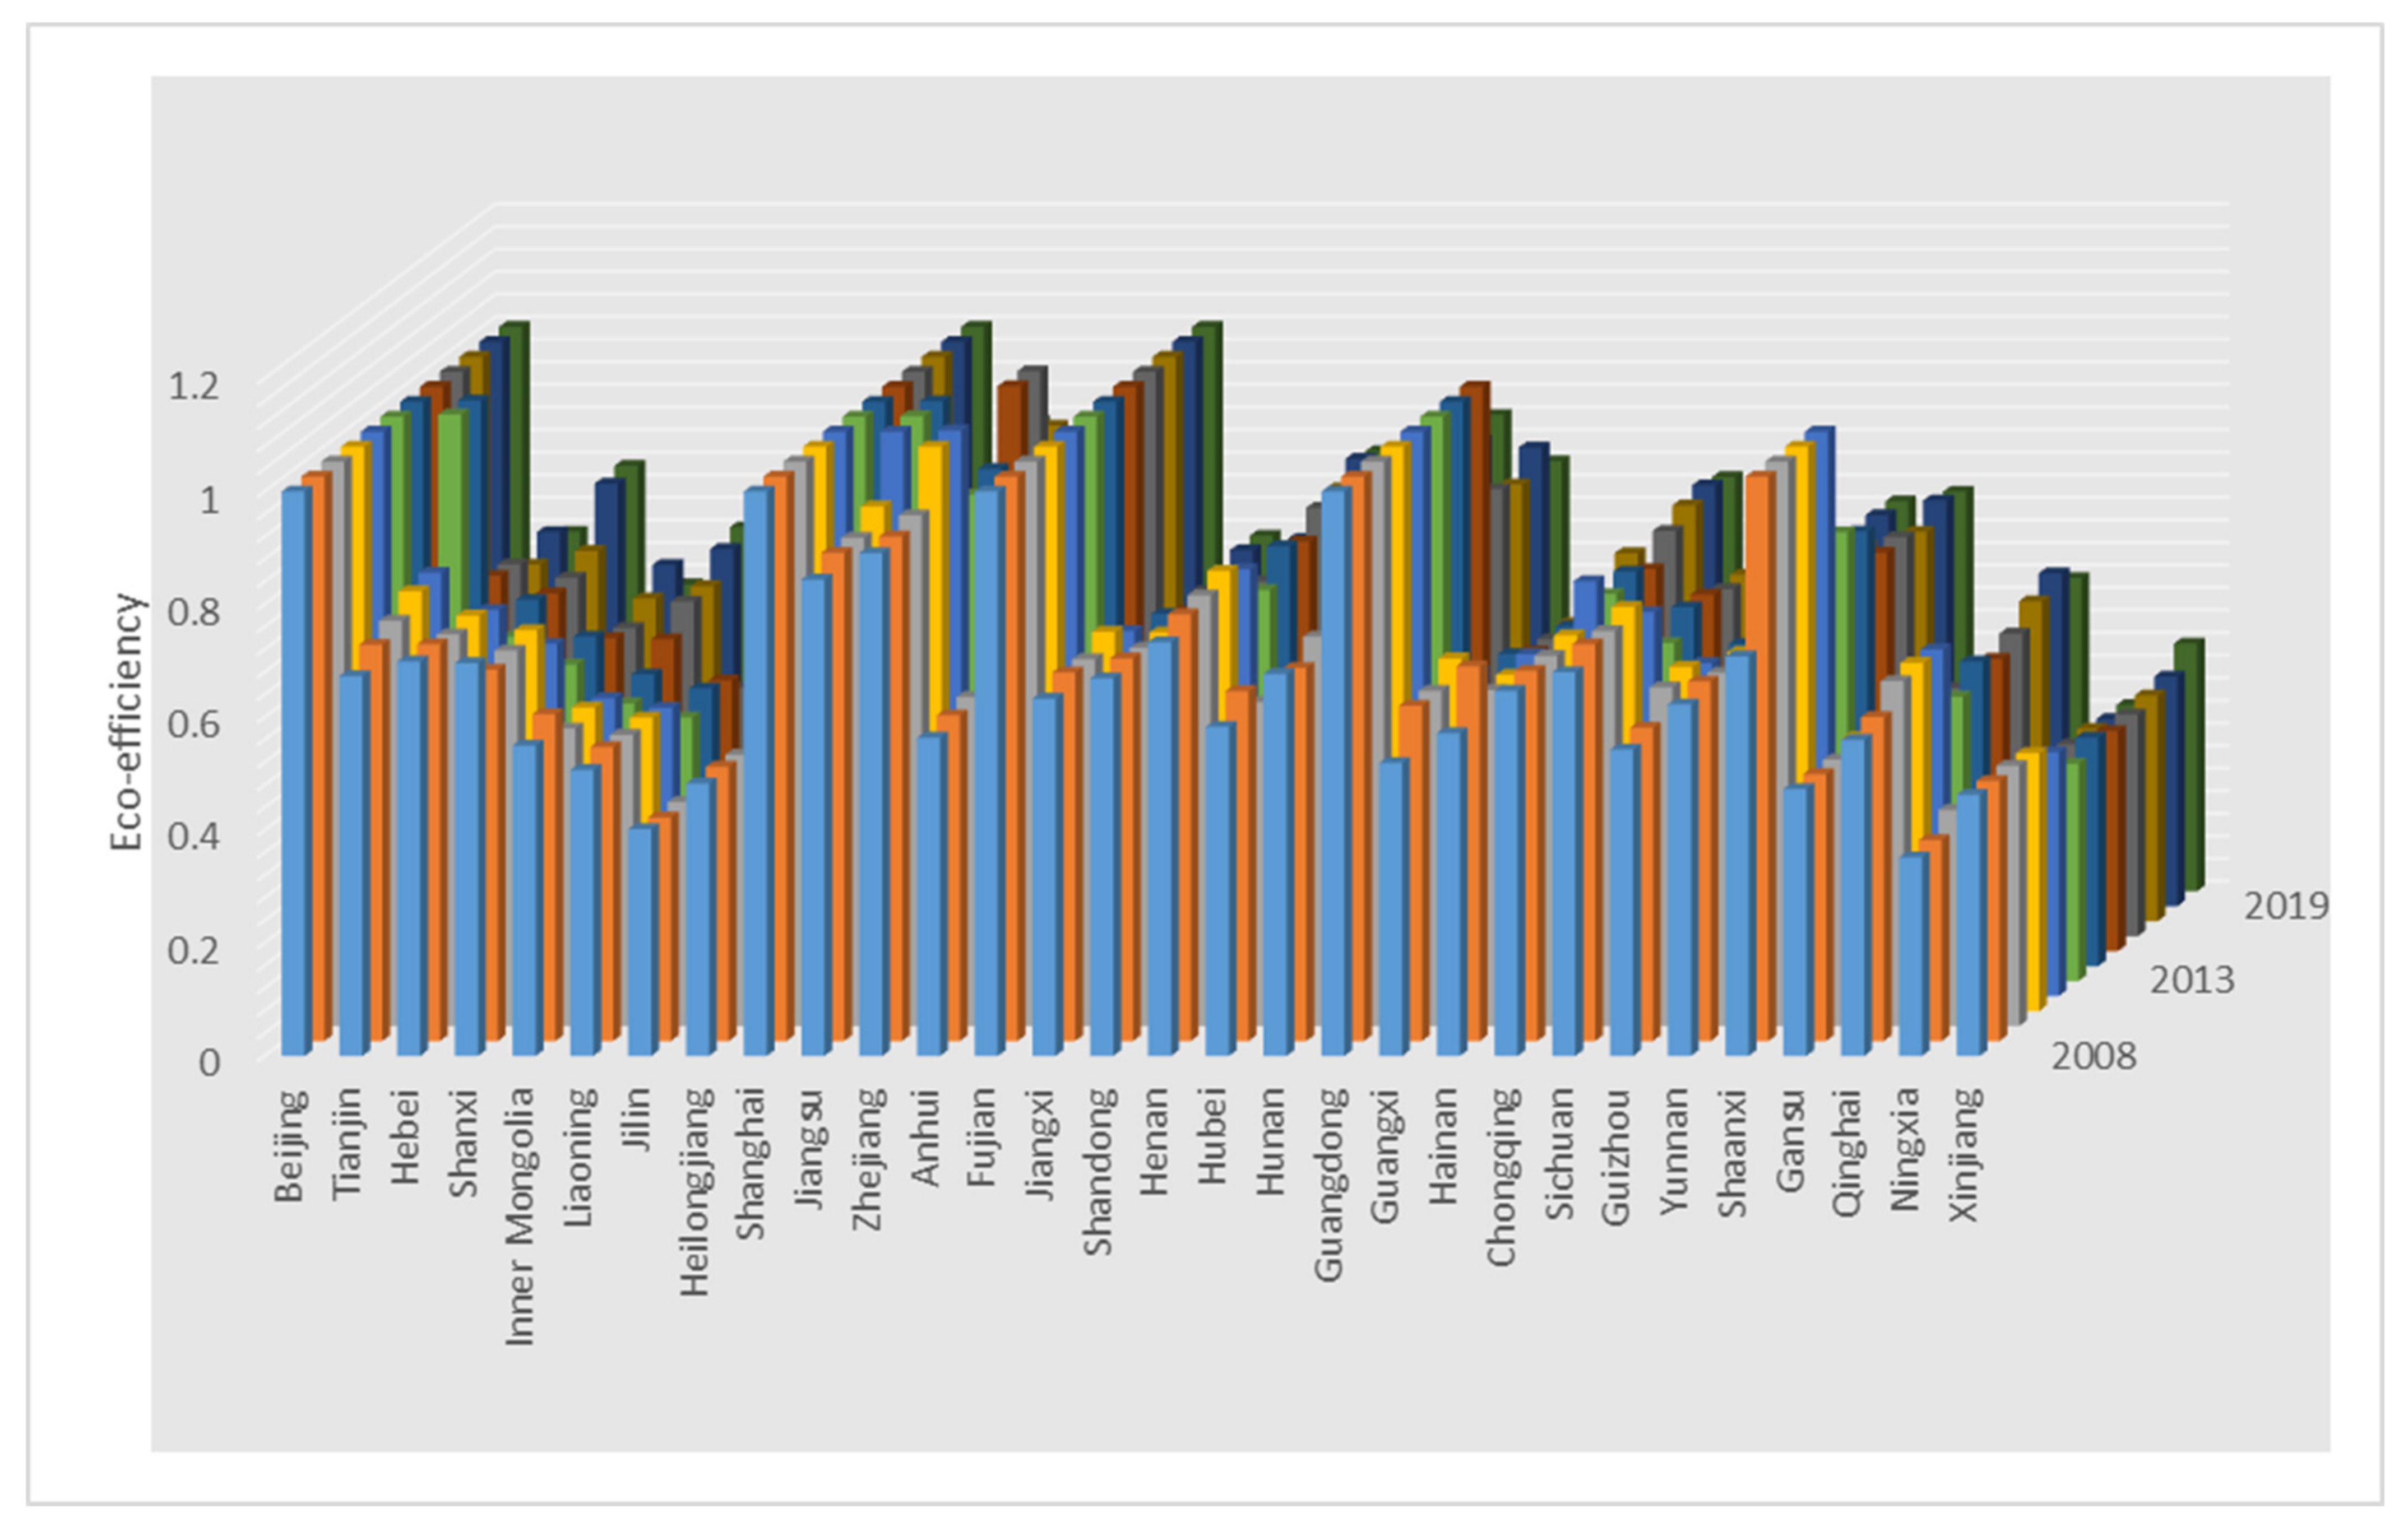
3. Calculation Results of EE
4. Regression Analysis
4.1. Unit Root and Co-Integration Tests
4.2. Tobit Test
5. Conclusions and Policy Suggestions
Author Contributions
Funding
Institutional Review Board Statement
Informed Consent Statement
Data Availability Statement
Conflicts of Interest
References
- Sun, D.; Zhou, L.; Li, Y.; Liu, H.; Shen, X.; Wang, Z.; Wang, X. New-type urbanization in China: Predicted trends and investment demand for 2015–2030. J. Geogr. Sci. 2017, 27, 943–966. [Google Scholar] [CrossRef]
- Mignamissi, D.; Djeufack, A. Urbanization and CO2 emissions intensity in Africa. J. Environ. Plan. Manag. 2021, 65, 1660–1684. [Google Scholar] [CrossRef]
- Zeng, L. China’s Eco-Efficiency: Regional Differences and Influencing Factors Based on a Spatial Panel Data Approach. Sustainability 2021, 13, 3143. [Google Scholar] [CrossRef]
- Sun, W.; Huang, C. How does urbanization affect carbon emission efficiency? Evidence from China. J. Clean. Prod. 2020, 272, 122828. [Google Scholar] [CrossRef]
- Guang, F. Electrical energy efficiency of China and its influencing factors. Environ. Sci. Pollut. Res. 2020, 27, 32829–32841. [Google Scholar] [CrossRef] [PubMed]
- Zhao, Z.; Yuan, T.; Shi, X.; Zhao, L. Heterogeneity in the relationship between carbon emission performance and urbanization: Evidence from China. Mitig. Adapt. Strat. Glob. Chang. 2020, 25, 1363–1380. [Google Scholar] [CrossRef]
- Zhang, J.; Yan, J.; Xue, L.; Yao, Y.; Shu, X. Is there a regularity: The change of arable land use pattern under the influence of human activities in the Loess Plateau of China? Environ. Dev. Sustain. 2021, 23, 7156–7175. [Google Scholar] [CrossRef]
- Yuan, Q.; Xu, X.; Pan, L.; Ni, Q. Eco-efficiency evaluation model: A case study of the Yangtze River Economic Belt. Environ. Monit. Assess. 2021, 193, 1–22. [Google Scholar] [CrossRef]
- The China Statistical Yearbooks (CSY); China Statistical Publishing House: Beijing, China, 2010–2021; Available online: http://tongji.oversea.cnki.net/oversea/engnavi/HomePage.aspx?id=N2017100312&name=YINFN&floor=1 (accessed on 13 June 2022).
- China Land and Resources Statistical Yearbook (CLRSY); China Statistical Publishing House: Beijing, China, 2010–2021; Available online: https://data.cnki.net/yearbook/Single/N2021050066 (accessed on 14 December 2022).
- Pan, X.; Wang, H.; Wang, L.; Chen, W. Decarbonization of China’s transportation sector: In light of national mitigation toward the Paris Agreement goals. Energy 2018, 155, 853–864. [Google Scholar] [CrossRef]
- Liu, T.-Y.; Su, C.-W. Is transportation improving urbanization in China? Socio-Econ. Plan. Sci. 2021, 77, 101034. [Google Scholar] [CrossRef]
- Xie, R.; Fang, J.; Liu, C. The effects of transportation infrastructure on urban carbon emissions. Appl. Energy 2017, 196, 199–207. [Google Scholar] [CrossRef]
- Ewing, R. Is Los Angeles-Style Sprawl Desirable? J. Am. Plan. Assoc. 1997, 63, 107–126. [Google Scholar] [CrossRef]
- Kenworthy, J.; Laube, F.B. Automobile dependence in cities: An international comparison of urban transport and land use patterns with implications for sustainability. Environ. Impact Assess. Rev. 1996, 16, 279–308. [Google Scholar] [CrossRef]
- Newman, P.W.G.; Kenworthy, J.R. Gasoline Consumption and Cities: A comparison of US cities with a global survey. J. Am. Plan. Assoc. 1989, 55, 24–37. [Google Scholar] [CrossRef]
- Matsuhashi, K.; Ariga, T. Estimation of passenger car CO 2 emissions with urban population density scenarios for low carbon transportation in Japan. IATSS Res. 2016, 39, 117–120. [Google Scholar] [CrossRef]
- Wang, W.-Z.; Liu, L.-C.; Liao, H.; Wei, Y.-M. Impacts of urbanization on carbon emissions: An empirical analysis from OECD countries. Energy Policy 2021, 151, 112171. [Google Scholar] [CrossRef]
- Grossman, G.; Krueger, A.B. Environmental impacts of a North American free trade agreement. Natl. Bur. Eco-Nomic Res. 1991. Available online: https://citeseerx.ist.psu.edu/viewdoc/download;jsessionid=05B1163C992F800B8AE8BE64CADC4F56?doi=10.1.1.320.5275&rep=rep1&type=pdf (accessed on 9 March 2023).
- Raihan, A.; Begum, R.A.; Nizam, M.; Said, M.; Pereira, J.J. Dynamic impacts of energy use, agricultural land expansion, and deforestation on CO2 emissions in Malaysia. Environ. Ecol. Stat. 2022, 29, 477–507. [Google Scholar] [CrossRef]
- Li, G.; Sun, J.; Wang, Z. Exploring the energy consumption rebound effect of industrial enterprises in the Beijing–Tianjin–Hebei region. Energy Effic. 2019, 12, 1007–1026. [Google Scholar] [CrossRef]
- Zhang, M.; Li, B. How to design regional characteristics to improve green economic efficiency: A fuzzy-set qualitative com-parative analysis approach. Environ. Sci. Pollut. Res. 2022, 29, 6125–6139. [Google Scholar] [CrossRef]
- Branstetter, L. Is foreign direct investment a channel of knowledge spillovers? Evidence from Japan’s FDI in the United States. J. Int. Econ. 2006, 68, 325–344. [Google Scholar] [CrossRef]
- Xu, X.; Sheng, Y. Productivity Spillovers from Foreign Direct Investment: Firm-Level Evidence from China. World Dev. 2012, 40, 62–74. [Google Scholar] [CrossRef]
- Paul, J.; Feliciano-Cestero, M.M. Five decades of research on foreign direct investment by MNEs: An overview and research agenda. J. Bus. Res. 2021, 124, 800–812. [Google Scholar] [CrossRef]
- Stef, N.; Ben Jabeur, S. Climate Change Legislations and Environmental Degradation. Environ. Resour. Econ. 2020, 77, 839–868. [Google Scholar] [CrossRef]
- Long, C.; Yang, J.; Zhang, J. Institutional Impact of Foreign Direct Investment in China. World Dev. 2015, 66, 31–48. [Google Scholar] [CrossRef]
- National Bureau of Statistics of China. Annual Data of the Province in China. 2022. Available online: http://data.stats.gov.cn/easyquery.htm?cn=E0103 (accessed on 1 August 2022).
- Tone, K.; Tsutsui, M. An epsilon-based measure of efficiency in DEA—A third pole of technical efficiency. Eur. J. Oper. Res. 2010, 207, 1554–1563. [Google Scholar] [CrossRef]
- Zhao, P.; Zeng, L.; Li, P.; Lu, H.; Hu, H.; Li, C.; Zheng, M.; Li, H.; Yu, Z.; Yuan, D.; et al. China’s transportation sector carbon dioxide emissions efficiency and its influencing factors based on the EBM DEA model with undesirable outputs and spatial Durbin model. Energy 2022, 238, 121934. [Google Scholar] [CrossRef]
- Zeng, L.; Li, P.; Yu, Z.; Nie, Y.; Li, S.; Gao, G.; Huang, D. Spatiotemporal Characteristics and Influencing Factors of Water Resources’ Green Utilization Efficiency in China: Based on the EBM Model with Undesirable Outputs and SDM Model. Water 2022, 14, 2908. [Google Scholar] [CrossRef]
- Zeng, L. The Driving Mechanism of Urban Land Green Use Efficiency in China Based on the EBM Model with Undesirable Outputs and the Spatial Dubin Model. Int. J. Environ. Res. Public Health 2022, 19, 10748. [Google Scholar] [CrossRef] [PubMed]
- Ren, Y.; Fang, C.; Li, G. Spatiotemporal characteristics and influential factors of eco-efficiency in Chinese prefecture-level cities: A spatial panel econometric analysis. J. Clean. Prod. 2020, 260, 120787. [Google Scholar] [CrossRef]
- Ning, L.; Zheng, W.; Zeng, L. Research on China’s Carbon Dioxide Emissions Efficiency from 2007 to 2016: Based on Two Stage Super Efficiency SBM Model and Tobit Model. Beijing Daxue Xuebao (Ziran Kexue Ban)/Acta Sci. Nat. Univ. Pekin. 2021, 57, 181–188. Available online: https://www.scopus.com/inward/record.uri?eid=2-s2.0-85101373648&doi=10.13209%2fj.0479-8023.2020.111&partnerID=40&md5=d948ef3627771ac2ca544cbf07fbc229 (accessed on 12 August 2022).
- Zeng, L.; Li, H.; Lao, X.; Hu, H.; Wei, Y.; Li, C.; Yuan, X.; Guo, D.; Liu, K. China’s Road Traffic Mortality Rate and Its Empirical Research from Socio-Economic Factors Based on the Tobit Model. Systems 2022, 10, 122. [Google Scholar] [CrossRef]
- Tobin, J. Estimation of relationships for limited dependent variables. Econometrica 1958, 26, 24–36. Available online: https://search.proquest.com/docview/214674441?OpenUrlRefId=info:xri/sid:baidu&accountid=13151 (accessed on 29 August 2022). [CrossRef]
- Qian, X.; Wang, D.; Nie, R. Assessing urbanization efficiency and its influencing factors in China based on Super-SBM and geographical detector models. Environ. Sci. Pollut. Res. 2021, 28, 31312–31326. [Google Scholar] [CrossRef] [PubMed]
- Zhao, P.-J.; Zeng, L.-E.; Lu, H.-Y.; Zhou, Y.; Hu, H.-Y.; Wei, X.-Y. Green economic efficiency and its influencing factors in China from 2008 to 2017: Based on the super-SBM model with undesirable outputs and spatial Dubin model. Sci. Total. Environ. 2020, 741, 140026. [Google Scholar] [CrossRef]
- Zeng, L.; Li, H.; Wang, X.; Yu, Z.; Hu, H.; Yuan, X.; Zhao, X.; Li, C.; Yuan, D.; Gao, Y.; et al. China’s Transport Land: Spatiotemporal Expansion Characteristics and Driving Mechanism. Land 2022, 11, 1147. [Google Scholar] [CrossRef]
- Zeng, L.; Li, C.; Liang, Z.; Zhao, X.; Hu, H.; Wang, X.; Yuan, D.; Yu, Z.; Yang, T.; Lu, J.; et al. The Carbon Emission Intensity of Industrial Land in China: Spatiotemporal Characteristics and Driving Factors. Land 2022, 11, 1156. [Google Scholar] [CrossRef]
- Wang, G.; Salman, M. The impacts of heterogeneous environmental regulations on green economic efficiency from the perspective of urbanization: A dynamic threshold analysis. Environ. Dev. Sustain. 2022, 1–32. [Google Scholar] [CrossRef]
- Tang, J.; Tang, L.; Li, Y.; Hu, Z. Measuring eco-efficiency and its convergence: Empirical analysis from China. Energy Effic. 2020, 13, 1075–1087. [Google Scholar] [CrossRef]


| Primary Indicators | Secondary Indicators | Unit |
|---|---|---|
| Inputs | Capital stock | 100 million Renminbi (RMB) |
| Employees | 10,000 people | |
| Construction land area | Sq.km | |
| Energy consumption | 10,000 tons of standard coal | |
| Water consumption | 108 L | |
| Desired outputs | Gross domestic product | 100 million RMB |
| Undesired outputs | Sulfur dioxide emissions | 10,000 tons |
| Carbon dioxide emissions | 10,000 tons | |
| Chemical oxygen demand emissions | 10,000 tons |
| Provinces | 2008 | 2009 | 2010 | 2011 | 2012 | 2013 | 2014 | 2015 | 2016 | 2017 | 2018 | 2019 | Mean |
|---|---|---|---|---|---|---|---|---|---|---|---|---|---|
| Beijing | 1.000 | 1.000 | 1.000 | 1.000 | 1.000 | 1.000 | 1.000 | 1.000 | 1.000 | 1.000 | 1.000 | 1.000 | 1.000 |
| Tianjin | 0.673 | 0.702 | 0.718 | 0.744 | 0.750 | 1.000 | 1.000 | 0.665 | 0.659 | 0.632 | 0.663 | 0.637 | 0.738 |
| Hebei | 0.699 | 0.703 | 0.694 | 0.701 | 0.684 | 0.610 | 0.649 | 0.634 | 0.635 | 0.656 | 0.749 | 0.754 | 0.681 |
| Shanxi | 0.696 | 0.658 | 0.665 | 0.675 | 0.624 | 0.561 | 0.584 | 0.555 | 0.546 | 0.572 | 0.605 | 0.544 | 0.607 |
| Inner Mongolia | 0.550 | 0.579 | 0.527 | 0.538 | 0.528 | 0.492 | 0.517 | 0.553 | 0.593 | 0.594 | 0.633 | 0.645 | 0.562 |
| Liaoning | 0.507 | 0.521 | 0.516 | 0.520 | 0.511 | 0.467 | 0.492 | 0.480 | 0.441 | 0.445 | 0.456 | 0.465 | 0.485 |
| Jilin | 0.402 | 0.396 | 0.397 | 0.403 | 0.398 | 0.373 | 0.394 | 0.379 | 0.383 | 0.380 | 0.383 | 0.373 | 0.388 |
| Heilongjiang | 0.483 | 0.486 | 0.481 | 0.477 | 0.449 | 0.403 | 0.423 | 0.415 | 0.411 | 0.419 | 0.423 | 0.430 | 0.442 |
| Shanghai | 1.000 | 1.000 | 1.000 | 1.000 | 1.000 | 1.000 | 1.000 | 1.000 | 1.000 | 1.000 | 1.000 | 1.000 | 1.000 |
| Jiangsu | 0.844 | 0.865 | 0.865 | 0.894 | 1.000 | 1.000 | 1.000 | 0.810 | 0.772 | 0.793 | 0.846 | 0.833 | 0.877 |
| Zhejiang | 0.891 | 0.894 | 0.905 | 1.000 | 1.000 | 0.862 | 0.881 | 1.000 | 1.000 | 0.878 | 0.834 | 0.826 | 0.915 |
| Anhui | 0.564 | 0.577 | 0.583 | 0.608 | 0.576 | 0.524 | 0.564 | 0.552 | 0.566 | 0.592 | 0.616 | 0.607 | 0.577 |
| Fujian | 1.000 | 1.000 | 1.000 | 1.000 | 1.000 | 1.000 | 1.000 | 1.000 | 1.000 | 1.000 | 1.000 | 1.000 | 1.000 |
| Jiangxi | 0.633 | 0.653 | 0.650 | 0.672 | 0.647 | 0.575 | 0.624 | 0.602 | 0.611 | 0.612 | 0.631 | 0.630 | 0.628 |
| Shandong | 0.669 | 0.678 | 0.670 | 0.671 | 0.640 | 0.603 | 0.620 | 0.610 | 0.629 | 0.643 | 0.651 | 0.629 | 0.643 |
| Henan | 0.733 | 0.756 | 0.763 | 0.780 | 0.756 | 0.693 | 0.744 | 0.726 | 0.759 | 0.767 | 0.793 | 0.780 | 0.754 |
| Hubei | 0.583 | 0.620 | 0.574 | 0.594 | 0.578 | 0.560 | 0.560 | 0.628 | 0.640 | 0.595 | 0.609 | 0.614 | 0.596 |
| Hunan | 0.677 | 0.661 | 0.690 | 0.727 | 0.746 | 0.690 | 0.759 | 0.809 | 0.841 | 0.829 | 0.825 | 0.844 | 0.758 |
| Guangdong | 1.000 | 1.000 | 1.000 | 1.000 | 1.000 | 1.000 | 1.000 | 1.000 | 0.792 | 0.774 | 0.813 | 0.762 | 0.928 |
| Guangxi | 0.519 | 0.594 | 0.594 | 0.625 | 0.577 | 0.515 | 0.553 | 0.531 | 0.526 | 0.528 | 0.534 | 0.524 | 0.552 |
| Hainan | 0.572 | 0.664 | 0.595 | 0.596 | 0.606 | 0.527 | 0.602 | 0.453 | 0.557 | 0.652 | 0.592 | 0.581 | 0.583 |
| Chongqing | 0.647 | 0.656 | 0.656 | 0.666 | 0.735 | 0.686 | 0.699 | 0.677 | 0.718 | 0.737 | 0.746 | 0.734 | 0.696 |
| Sichuan | 0.680 | 0.703 | 0.700 | 0.716 | 0.680 | 0.599 | 0.636 | 0.632 | 0.615 | 0.614 | 0.632 | 0.629 | 0.653 |
| Guizhou | 0.543 | 0.555 | 0.600 | 0.610 | 0.590 | 0.527 | 0.571 | 0.554 | 0.546 | 0.508 | 0.529 | 0.534 | 0.556 |
| Yunnan | 0.623 | 0.637 | 0.626 | 0.636 | 0.648 | 0.639 | 0.644 | 0.632 | 0.641 | 0.665 | 0.693 | 0.691 | 0.648 |
| Shaanxi | 0.708 | 1.000 | 1.000 | 1.000 | 1.000 | 0.795 | 0.770 | 0.706 | 0.707 | 0.690 | 0.719 | 0.708 | 0.817 |
| Gansu | 0.473 | 0.473 | 0.472 | 0.485 | 0.471 | 0.440 | 0.442 | 0.436 | 0.440 | 0.424 | 0.430 | 0.432 | 0.451 |
| Qinghai | 0.560 | 0.574 | 0.611 | 0.617 | 0.614 | 0.504 | 0.540 | 0.518 | 0.536 | 0.567 | 0.590 | 0.555 | 0.565 |
| Ningxia | 0.352 | 0.356 | 0.383 | 0.374 | 0.359 | 0.330 | 0.343 | 0.333 | 0.340 | 0.341 | 0.332 | 0.330 | 0.348 |
| Xinjiang | 0.463 | 0.461 | 0.461 | 0.457 | 0.432 | 0.385 | 0.405 | 0.390 | 0.393 | 0.400 | 0.407 | 0.439 | 0.424 |
| Eastern region | 0.835 | 0.851 | 0.845 | 0.861 | 0.868 | 0.861 | 0.876 | 0.817 | 0.805 | 0.803 | 0.815 | 0.802 | 0.837 |
| Central region | 0.648 | 0.654 | 0.654 | 0.676 | 0.655 | 0.601 | 0.639 | 0.645 | 0.661 | 0.661 | 0.680 | 0.670 | 0.653 |
| Western region | 0.556 | 0.599 | 0.603 | 0.611 | 0.603 | 0.537 | 0.556 | 0.542 | 0.550 | 0.552 | 0.568 | 0.566 | 0.570 |
| Northeast region | 0.464 | 0.468 | 0.465 | 0.467 | 0.453 | 0.414 | 0.436 | 0.425 | 0.412 | 0.415 | 0.421 | 0.423 | 0.438 |
| Mean | 0.658 | 0.681 | 0.680 | 0.693 | 0.687 | 0.646 | 0.667 | 0.643 | 0.643 | 0.644 | 0.658 | 0.651 | 0.662 |
| Levin, Lin, and Chu | Im, Pesaran, and Shin | Augmented Dickey-Fuller-Fisher | Phillips and Perron-Fisher | Conclusion | |
|---|---|---|---|---|---|
| ∆EE | −6.20717 *** | −4.54093 *** | 110.591 *** | 162.666 *** | Stationary |
| ∆UL | −2.67078 *** | 1.38798 | 82.4110 ** | 72.8774 | No stationary |
| ∆UL × 2 | 2.95207 | 5.79925 | 69.2863 | 53.6043 | No stationary |
| ∆EDL | 13.4973 | 17.495 | 35.3251 | 63.3909 | No stationary |
| ∆TPL | 7.67743 | 11.9316 | 8.2301 | 14.6013 | No stationary |
| ∆FDI | −4.35353 *** | 0.77825 | 62.7031 | 73.8788 | No stationary |
| ∆∆EE | −21.2810 *** | −15.5620 *** | 277.196 *** | 414.637 *** | Stationary |
| ∆∆UL | −25.6808 *** | −16.3227 *** | 237.875 *** | 226.108 *** | Stationary |
| ∆∆UL × 2 | −36.8898 *** | −19.2961 *** | 250.690 *** | 237.262 *** | Stationary |
| ∆∆DEL | −45.6869 *** | −23.2062 *** | 187.368 *** | 176.307 *** | Stationary |
| ∆∆TPL | −13.9890 *** | −9.34255 *** | 182.766 *** | 216.738 *** | Stationary |
| ∆∆FDI | −14.5359 *** | −7.83367 *** | 169.434 *** | 198.396 *** | Stationary |
| t-Statistic | Prob. | |
|---|---|---|
| Augmented Dickey-Fuller | −2.785106 | 0.0027 *** |
| Residual variance | 0.002205 | |
| HAC variance | 0.001852 |
| Coef. | St.Err. | t-Value | p-Value | |
|---|---|---|---|---|
| UL | −2.713 *** | 0.533 | −5.09 | 0.00 |
| UL × 2 | 1.853 *** | 0.439 | 4.22 | 0.00 |
| DEL | 0.063 *** | 0.016 | 3.93 | 0.00 |
| TPL | 1.907 *** | 0.531 | 3.59 | 0.00 |
| FDI | 1.243 *** | 0.153 | 8.12 | 0.00 |
| Constant | −2.713 *** | 0.533 | −5.09 | 0.00 |
Disclaimer/Publisher’s Note: The statements, opinions and data contained in all publications are solely those of the individual author(s) and contributor(s) and not of MDPI and/or the editor(s). MDPI and/or the editor(s) disclaim responsibility for any injury to people or property resulting from any ideas, methods, instructions or products referred to in the content. |
© 2023 by the authors. Licensee MDPI, Basel, Switzerland. This article is an open access article distributed under the terms and conditions of the Creative Commons Attribution (CC BY) license (https://creativecommons.org/licenses/by/4.0/).
Share and Cite
Yuan, X.; Nie, Y.; Zeng, L.; Lu, C.; Yang, T. Exploring the Impacts of Urbanization on Eco-Efficiency in China. Land 2023, 12, 687. https://doi.org/10.3390/land12030687
Yuan X, Nie Y, Zeng L, Lu C, Yang T. Exploring the Impacts of Urbanization on Eco-Efficiency in China. Land. 2023; 12(3):687. https://doi.org/10.3390/land12030687
Chicago/Turabian StyleYuan, Xinyue, Yang Nie, Liangen Zeng, Chao Lu, and Tingzhang Yang. 2023. "Exploring the Impacts of Urbanization on Eco-Efficiency in China" Land 12, no. 3: 687. https://doi.org/10.3390/land12030687
APA StyleYuan, X., Nie, Y., Zeng, L., Lu, C., & Yang, T. (2023). Exploring the Impacts of Urbanization on Eco-Efficiency in China. Land, 12(3), 687. https://doi.org/10.3390/land12030687