Article

Investigating the Factors Influencing the Intention to Adopt Long-Term Land Leasing in Northern Ireland

Economics Research Branch, Agri-Food and Biosciences Institute, 18a Newforge Lane, Belfast BT9 5PX, UK
*
Author to whom correspondence should be addressed.
Land 2023, 12(3), 649; https://doi.org/10.3390/land12030649
Submission received: 7 February 2023 / Revised: 5 March 2023 / Accepted: 7 March 2023 / Published: 9 March 2023
(This article belongs to the Section Land Socio-Economic and Political Issues)

Abstract

:
Short-term land rental agreements such as the traditional conacre system in Northern Ireland offer flexibility between the landowners and the farmers renting the land. However, the uncertainty of tenure linked to such short-term land rental systems does not allow for farmers renting the land to make longer-term investment planning and decisions, particularly around sustainable land management practices. Long-term tenancy agreements have been identified as a viable option to cope with short-term uncertainties and improve the environmental management of the land. In this study, we analysed the factors influencing farmers’ intention to adopt long-term land leasing with and without income tax incentives in Northern Ireland. To achieve our objective, we employed ordered logistic regression models complemented with qualitative analysis. The results of our analyses showed that varying factors including risk attitude, pro-environmental behaviour, profit consciousness, having a dairy enterprise, the area of farmland owned, the presence of a successor, and the age and education of the farmer influence farmers’ intention to adopt long-term land leasing. However, variability exists depending on the farmers’ rental status and availability of income tax incentives. It can be concluded from the study that policies aimed at encouraging long-term land leasing should take a holistic approach that incorporates environmental and socioeconomic factors.

1. Introduction

The form of land rental system plays an important role in shaping farmers’ land-use decisions in terms of providing sufficient incentives to increase their efficiencies, productivity, and environmental sustainability [1,2]. An insecure land rental system (inability of farmers to access and use land over a longer time frame) may tend to disincentivise farmers in relation to their decision making and investments in land, consequently resulting in reduced farm-level productivity. This is because farmers are often required to make long-term strategic decisions around enterprise type, investments around farm expansion, and land-use. On the other hand, agricultural land markets supported by policies that guarantee tenure arrangements for farmers contribute to the productive utilisation of land [3,4,5,6]. For example, a study by Muraoka, et al. [7] showed that the security of land rental (and ownership) have positive effects on productivity and long-term investments. Similarly, studies by Lovo [8] and Abdulai, et al. [9] also empirically showed that secured land tenure positively influences soil conservation investments. The efficient use of available land is particularly important given the increased competition for land as a finite resource for food production, housing developments, tree planting, energy production, net zero ambitions, reversing declines in biodiversity, amenities, water quality, and combating climate change [10,11]. Building a resilient and vibrant agricultural tenanted sector is seen as one way of coping with these challenges.
Northern Ireland farms are typically family owned with a very small, tenanted sector compared to other regions of the United Kingdom. The sale of land through open market sales is limited due to high prices and farms are mainly transferred through inheritance. For example, the price of agricultural land in Northern Ireland ranges between GBP 11,500 and GBP 20,000 per acre and less than one per cent of the total agricultural land area is offered for sale each year [12]. Apart from the very low percentage of land being offered for sale, access to land through leasing is also constrained by the type of short-term conacre land rental system predominant in the region [1,13]. The conacre land rental system is unique to the island of Ireland, and it involves the renting of land nominally for 11 months or 364 days and permits land to be let to other farmers without the need for either party to enter a long-term commitment. Currently, around one-third (about 300,000 hectares) of agricultural land in Northern Ireland is being farmed under conacre agreements [1,14]. Although, the conacre system in the past was considered to offer flexibility between a landowner and the farmer renting the land, the uncertainty of tenure linked to the system does not allow for a farmer renting the land to make longer-term investment planning and decisions, particularly around sustainable land management practices and productivity improvements. At an aggregate level, this ultimately impacts on the overall competitiveness of the region’s agri-food sector. For instance, the productivity growth of Northern Ireland’s farming industry lags behind other regions of the UK [15]. While there may be a number of other factors contributing to this low level of agricultural productivity, for example, the contribution and range of different farming enterprises within each region, the absence of an efficient land market and land rental system can also be regarded as a contributory factor [1,14,15,16]. Moreover, from an environmental perspective, there is a question as to whether the conacre system may be having a negative impact on the environmental stewardship of conacre land.
A long-term tenancy agreement has been identified as one of the viable options to increase farmers’ access to land and cope with short-term uncertainties. It allows the tenant to plan, knowing that they will still have access to the land for their farming business and that they can carry out environmental actions that require longer-term agreements [10]. The objective of this study is to analyse the factors influencing the future intention of farmers and farmland owners to embrace long-term land leasing with or without income tax incentives. The results of the study can inform the development of policy measures aimed at increasing the adoption of long-term land leasing. The study contributes to the existing literature in two distinct ways. Firstly, this study offers the first attempt to analyse factors influencing the intention to adopt long-term land leasing using a mixed methods approach. Secondly, in analysing our data, we went beyond just focusing on the influence of farm and farmer characteristics but also analysed the potential influence of farmers’ motivations, and behavioural and environmental orientation on the intention to take up long-term land leasing. This provides a better and broader understanding of the subject matter.
The remaining part of this paper is organised as follows: Section 2 describes the theoretical framework and Section 3 explains the study methodology. The study results are presented in Section 4, while a discussion of the results is contained in Section 5. Finally, we conclude in Section 6 by presenting an overview of the study outcomes alongside relevant policy recommendations.

2. Theoretical Framework
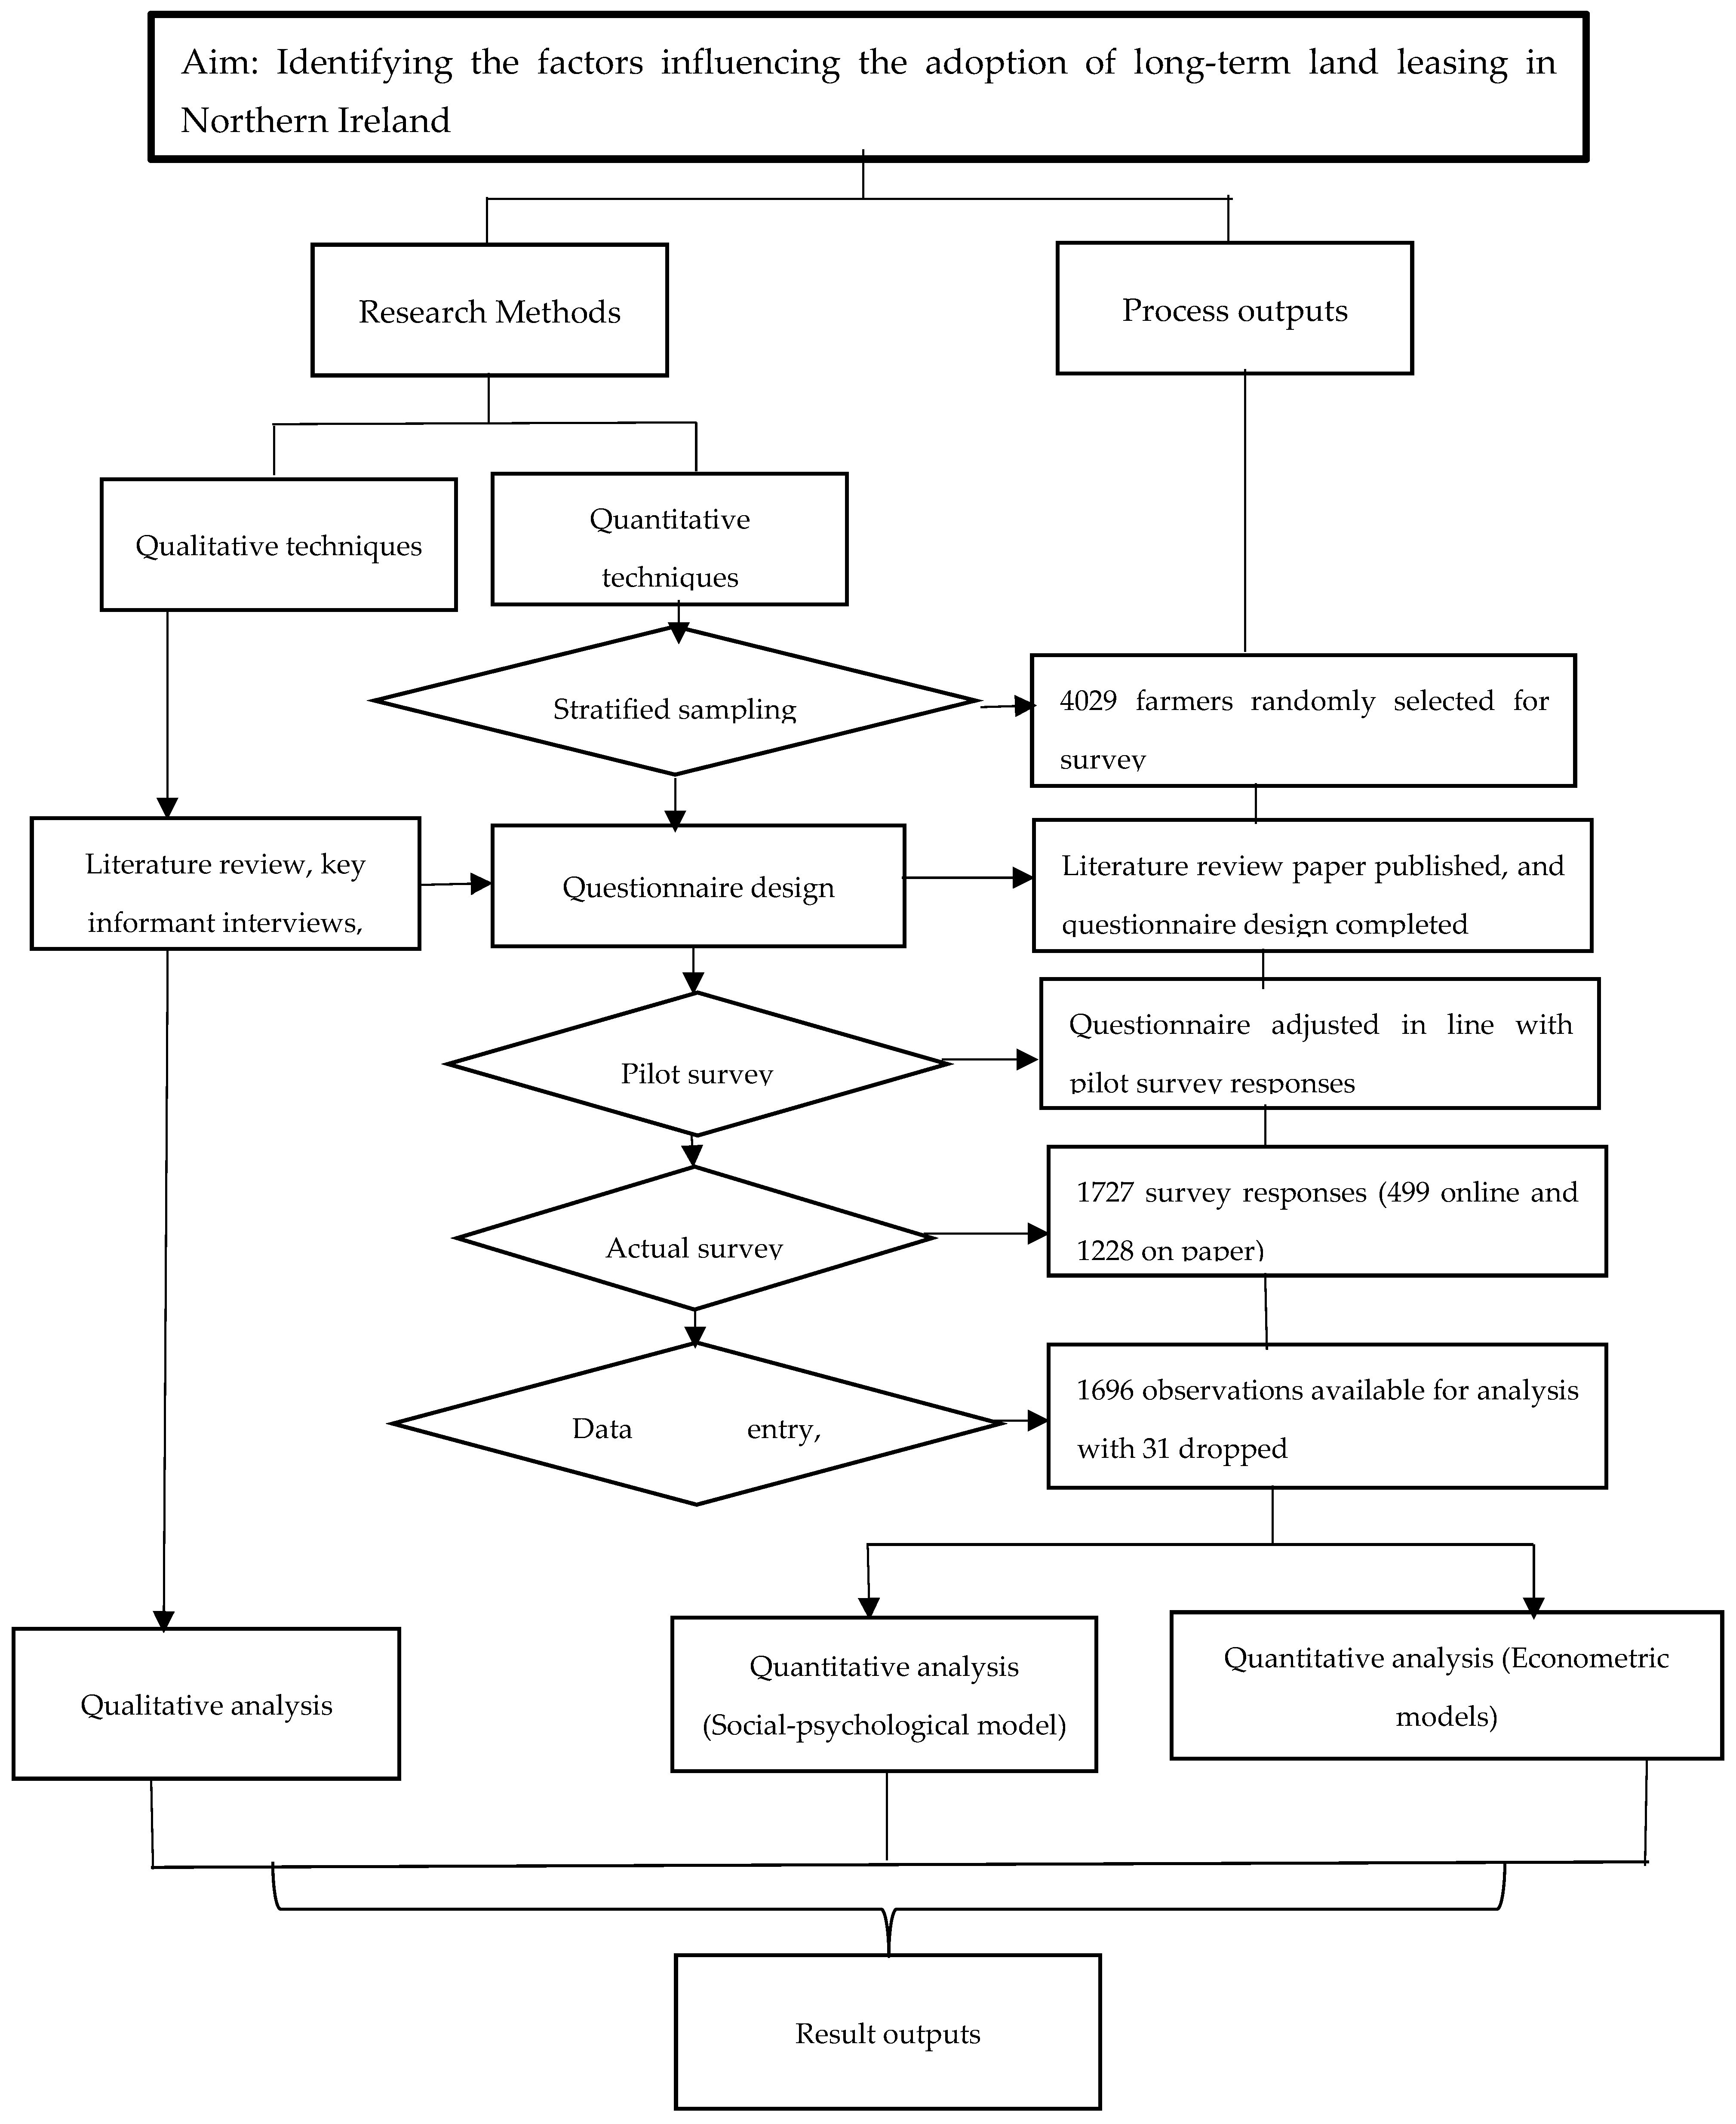
Farmers, in taking their decisions, are influenced by several factors. While some may place profit maximisation as an important yardstick for decision making, it might be of low priority for others. According to economic theory, farmers, in the same way as other individuals, make decisions on the basis of the changes they expect in their utility as a result of such decisions [17]. In this case, utility encompasses both monetary and non-monetary benefits, although it is often erroneously assumed that it represents only monetary benefits on the premise that all farmers are profit maximisers. Previous studies have shown that while economic and farm structural characteristics are important factors in farmers’ decision making, they also possess varying behavioural patterns that are driven by social, lifestyle, or family objectives that also influence their decisions [18,19]. In this study, we contribute to the literature by analysing not only the influence of farmers’ socioeconomic and farm structural characteristics on the likelihood of adopting long-term land leasing but also the effect of farming motivations and risk attitude on the decision to take up long-term land leasing.

3. Methodology

To achieve the study objectives, we employed a mixed methods approach in which we combine qualitative and quantitative analytical techniques. The qualitative aspect of the methodology involved key informant interviews with three important stakeholders in the Northern Ireland agricultural sector and two focus group discussions (FGD) with farmers in the region. The focus group participants were geographically dispersed across Northern Ireland, with the first group containing nine participants from the southwest region and the second group containing seven participants from the northeast region. The interviewees largely reflected Northern Ireland’s farming sector, where the majority (twelve participants) in both groups managed dairy, beef, or sheep enterprise, while the rest managed arable, poultry, or mixed farms. They were a mix of farmers that owned land, rented out land, or rented in land. The farmers received an invite to the meetings with the assistance of a representative of the farmers’ union. The purpose of the project was explained to the FGD participants before each meeting, and they were assured of the anonymity of the data to be collected. The FGDwas audio recorded with the agreement of the farmers involved and analysed alongside the key informant interviews. The quantitative aspect of the analysis combined principal component analysis (PCA) and ordered logit models. The flow chart for the study methodology is presented in Figure 1.

3.1. Study Sample and Data Collection

The sampling frame is the census data for Northern Ireland which consist of 25,000 farms. For the year 2020, 12,747 farmers completed the census survey. The farmers were grouped into six strata, and they include farmers that farm on owned land only, farmers that farm on owned and rented land, farmers that farm on owned and rented land but also let out land, farmers that farm on owned land only but also let out land, farmers that farm only on rented land and farmland owners that have let out all their land. Given the large number of farmers in the group of farmers that farm on owned land only and the farmers that farm on owned and rented land, we randomly selected 20% of farmers from the total number of farmers in these two groups. We included 100% of all remaining four strata in our sample. The sample stratification including their disaggregation by land types (LFA category which included: non-disadvantaged area (NDA); disadvantaged area (DA); and severely disadvantaged area (SDA)) are presented in Table 1. In total, our sample consist of 4029 farmers and farmland owners to which the study questionnaires were administered in a hybrid format.
Out of the 4029 questionnaires administered, 1228 paper questionnaires were returned in the pre-paid envelopes sent alongside the questionnaire before the deadline date set while 499 questionnaires were completed online. In total we received 1727 responses for analysis. Questionnaires in which data relating to renting-in or renting-out of land were not available were excluded from the analysis. Variables were checked for erroneous data. All blank entries from each questionnaire were cross referenced to identify invalid responses versus no response were possible. In the process of cleaning the data, 31 observations were dropped. As a result, we were left with 1696 observations for analysis although, with some missing data as some of the farmers did not completely fill out the questionnaires.

3.2. Questionnaire Design and Survey Development

The design of the questionnaire used for the quantitative analysis involved the conduct of a comprehensive literature review in relation to land leasing [1] and in-depth interviews of key informants in the Northern Ireland agricultural sector. The questionnaire comprised mainly of closed-ended questions and was developed in a hybrid format such that it can be completed both on paper and online. We developed the online version of the questionnaire using the SNAP survey software and a QR code was generated from it which was placed on the front page of the paper version of the questionnaire which consisted of 17 pages. The survey took place between 25 November 2021 and 28 February 2022. Two reminders were sent over this period with the first sent on the 6 of January 2022 and the second sent on the 31 of January 2022. The survey questionnaire took approximately 20 min to complete, and the data were checked for outliers before the analyses were undertaken. The survey was anonymous as farmers did not need to provide any personal information in completing the questionnaire. Farmers were assured of this anonymity in any subsequent reports or publications. To encourage the farmers to complete the questionnaire, each completed and returned questionnaire was entered into a prize draw for 1 of 10, £100 e-vouchers for farmers that indicated they were willing to participate by providing their contact details. This information was stored separately and was only used to contact the winners of the draw. The questionnaire was piloted to a group of farmers who owned land to improve internal consistency and validity of the questionnaire and ensure the wordings of the questions were easily understandable before the final administration of the questionnaire to the farmers.

3.3. Principal Component Analysis

The PCA is a statistical technique that examines the pattern of correlations amongst the explanatory variables and creates a smaller set of uncorrelated linear combinations of the original variables [20,21]. The higher a respondent’s score on each of these factor variables, the higher their associated level of agreement with the specific attitudinal component [20,22,23]. In line with previous literature, for example, Howley, Buckley, Donoghue and Ryan [18], in this study, we hypothesised that in additional to behavioural factors, farmers’ decision making is also influenced by motivational, socioeconomic and farm structural factors. Making use of 17 attitudinal statements, we derived five different farming motivations of farmers. They include component relating to profit maximisation which is termed “profit conscious”, component relating to the protection of the environment, termed “pro-environmental construct”, component relating to statements that does not support pro-environmental behaviour termed “environment neutral” construct, component relating to risk attitude termed “risk averse” construct and component relating to statement that support food production rather than the protection of the environment termed “food security” construct. By exploring the influence of these socioeconomic and motivational constructs on farmers’ likelihood of adopting long-term land leasing, we are able to get insight into the underlying farming motivations and environmental values that are capable of influencing farmers’ decisions in relation to adopting long-term land leasing.

3.4. Ordered Logistic Regression Model

As part of our quantitative analysis we explored the standard ordered response model in the form of the ordered logistic regression model and its generalizations including the partial proportional odds model to analyse our data [24,25]. The ordered logistic regression model is an econometric technique used when the dependent variable is measured in ordinal scale [26]. The gap among the various scales of the ordering are assumed to be equidistant from each other and the effect of each predictor across the categories of the ordinal dependent variable is the same [26]. Given that the aim of this study is to estimate and to predict the effect of farmers’ motivations, structural and socioeconomic characteristics on the likelihood of adopting long-term land leasing, the ordered logistic regression model is an appropriate model to use. Previous study, for example, Lapple and Kelley [21] employed a similar approach. An alternative approach would have been to use the structural equation modelling (SEM) approach. However, the SEM approach is more concerned with testing the theory as well as model confirmation.
The dependent variable for the regression analysis is the likelihood to adopt long-term land leasing with and without tax incentives with farm, socioeconomic and motivational characteristics as the explanatory variables. The variables included in the models were obtained from a comprehensive review of the literature [1,27]. The explanatory socioeconomic variables include: Membership of business Development groups (BDG membership), engaging in off-farm employment (Off-farm employment), the identification of a successor (Successor), the type of farm enterprise the farmer is undertaking (Dairy, beef, sheep and other enterprises), The area of farmland owned in hectares (Farmland owned(ha)), the educational qualification of the farmer (Less than 5 GCSEs, 5 GCSEs or equivalent,- A level or equivalent, Higher education-diploma or equivalent, Degree level or higher), the time committed to farming (Full-time or part-time), the age of the farmer (different age range), land types (LFA category which included: non-disadvantaged area (NDA); disadvantaged area (DA); and severely disadvantaged area (SDA)), agricultural qualification (Have formal agricultural qualification) and having diversification activities on the farm (Diversification activities). The farming motivations explanatory variables were obtained using the PCA as explained in Section 3.1. We measured the future intention to adopt long-term land leasing using a five-point Likert scale (1 = very unlikely, 2 = unlikely, 3 = Neutral, 4 = Likely, 5 = very likely). The ordered logistic regression model in terms of the likelihood of adopting long-term land leasing is specified in Equation (1).
Pr Y i > j = exp α j + X i β 1 + exp α j + X i β ,   j = 1 ,   2 ,   . , M 1  
where j is the response category, X i is a vector of independent variables, β is a vector of parameters to be estimated and α j   are cut off points for the thresholds of the ordered model, and M is the number of categories of the ordinal dependent variable, and it is equal to 5 given the five-point Likert scale with which the dependent variables are measured. Although, the results of the ordered logit regression model are usually relatively straightforward, intuitive, and easy to interpret, an important assumption of the methodology is the parallel-lines assumption in which it is assumed that β i is the same for each value of j . However, the parallel-lines assumption may sometimes be violated which can result in incorrect, incomplete, or misleading results [25]. To test if the parallel-lines assumption is violated, the Brant test is often employed. The test provides both a global test of whether any variable violates the parallel-lines assumption, as well as tests of the assumption for each variable separately [25,28]. The limitation of the parallel-lines assumption can be overcome by the generalised ordered logit regression model given in Equation (2) which relaxes the assumption. However, the fundamental issue of the generalised ordered logit regression model is that it not as straightforward and easy to interpret as the ordered logit regression model. This is because it tends to include many more parameters than the ordered logit model [25]. The approach tends to remove the parallel lines requirement from all variables, even if only one or a few of them break the assumption. Hence, the use of the generalised logit model is only necessary if the parallel-lines assumption is violated.
Pr Y i > j = exp α j + X i β j 1 + exp α j + X i β j ,   j = 1 ,   2 ,   . , M 1
Sometimes, the parallel-lines assumption may only be partially violated such that, some of the β i coefficients may differ only for some of the values of j . In such cases, the use of the partial proportional odds model is recommended [25]. The partial proportional odds model as the name implies is a blend between the ordered logit model and the generalised ordered logit model in that, it can constrain those variables that do not violate the parallel-lines assumption to the same coefficients, reducing the number of parameters estimated compared to the generalised ordered logit model. The specification of the partial proportional odds model is presented in Equation (3).
Pr Y i > j = exp α j X 1 i β 1 + X 2 i β 2 j 1 + exp α j + X 1 i β 1 + X 2 i β 2 j ,   j = 1 ,   2 , . ,   M 1 .  
where β1 is a vector of parameters that does not violate parael-lines assumption and is associated to a subset X 1 i of the independent variables, and β2j is a vector of parameters that vary according to the cut point of the ordered logit model and is associated to a subset X 2 i of the independent variables [24,25].
In this study the model parameters are estimated using the maximum likelihood method and a Brant test [29] was undertaken after the standard ordered logit regression model, to check if any of the independent variables violate the parallel-lines assumption. The partial proportional odds model is employed if the Brant test fails depending on the number of variables that violates the parallel-lines assumption. The analysis was undertaken separately for all the farmers on our sample and for farmers that currently rent out land.

4. Results and Discussion

4.1. Descriptive and Socioeconomic Characteristics

The result of the analysis shows that the majority of respondents (92.3%) own their land and the main mode of land acquisition is inheritance (56.6%) with only 14.1% reporting that they purchased their land. The average land owned by the farmers is 35.2 hectares and dairy farmers own the largest farm size at 57.6 hectares. Only 34.4% of farmers rent out land and 91% of those whose land is rented out are in conacre, only 5% is rented out on a long-term lease, and 4% is a combination of conacre and long-term lease. This is in contrast to the tenancy sector in the rest of the UK. For example, the average length of new Farm Business Tenancies (FBT) in 2021 in England was 3.03 years and nearly 60% of the land under FBT were for tenancies of two years. [10,30]. Moreover, in Scotland, there are different forms of agricultural leases permitted [1]. For example, the majority (56%) of all leases in Scotland are held under the secure 1991 Act agricultural tenancies (where a tenant farmer’s security of tenure is protected by the agricultural holdings legislation) [31]. The average area of owned farmland for those that rented out land in conacre is 39.2 hectares, while it is 50.4 hectares for those who rented out land on a long-term lease. Similarly, 78.4% of the respondents that rented in land in our study did so on conacre, while only 12% rented in their land on a long-term lease. Additionally, farmers that rent in land on a long-term lease own larger farms compared to farmers that rent in land in conacre. The average land rented out overall was 22.7 hectares, while the average land rented in was 23.8 hectares. A good proportion of the farmers (48.1%) consider that the closeness of the land rented to the main farm building was a very important factor in making their decision to rent in land, while only 6.5% consider it as not that important. An overview of the socioeconomic characteristics of the respondents shows that about 70% of the farmers in our sample are at least 55 years old and the modal age group is 55 to 64 years. The majority of the farmers are men (91.5%) and 33% of the farmers have no formal educational qualification, while about 20% have a degree or higher qualification. Sixty-seven per cent of the respondents have no formal agricultural qualification. The average years of farming experience is 35 years, which is relatively high, and 17.7% reported that they have diversified activities on their farm.

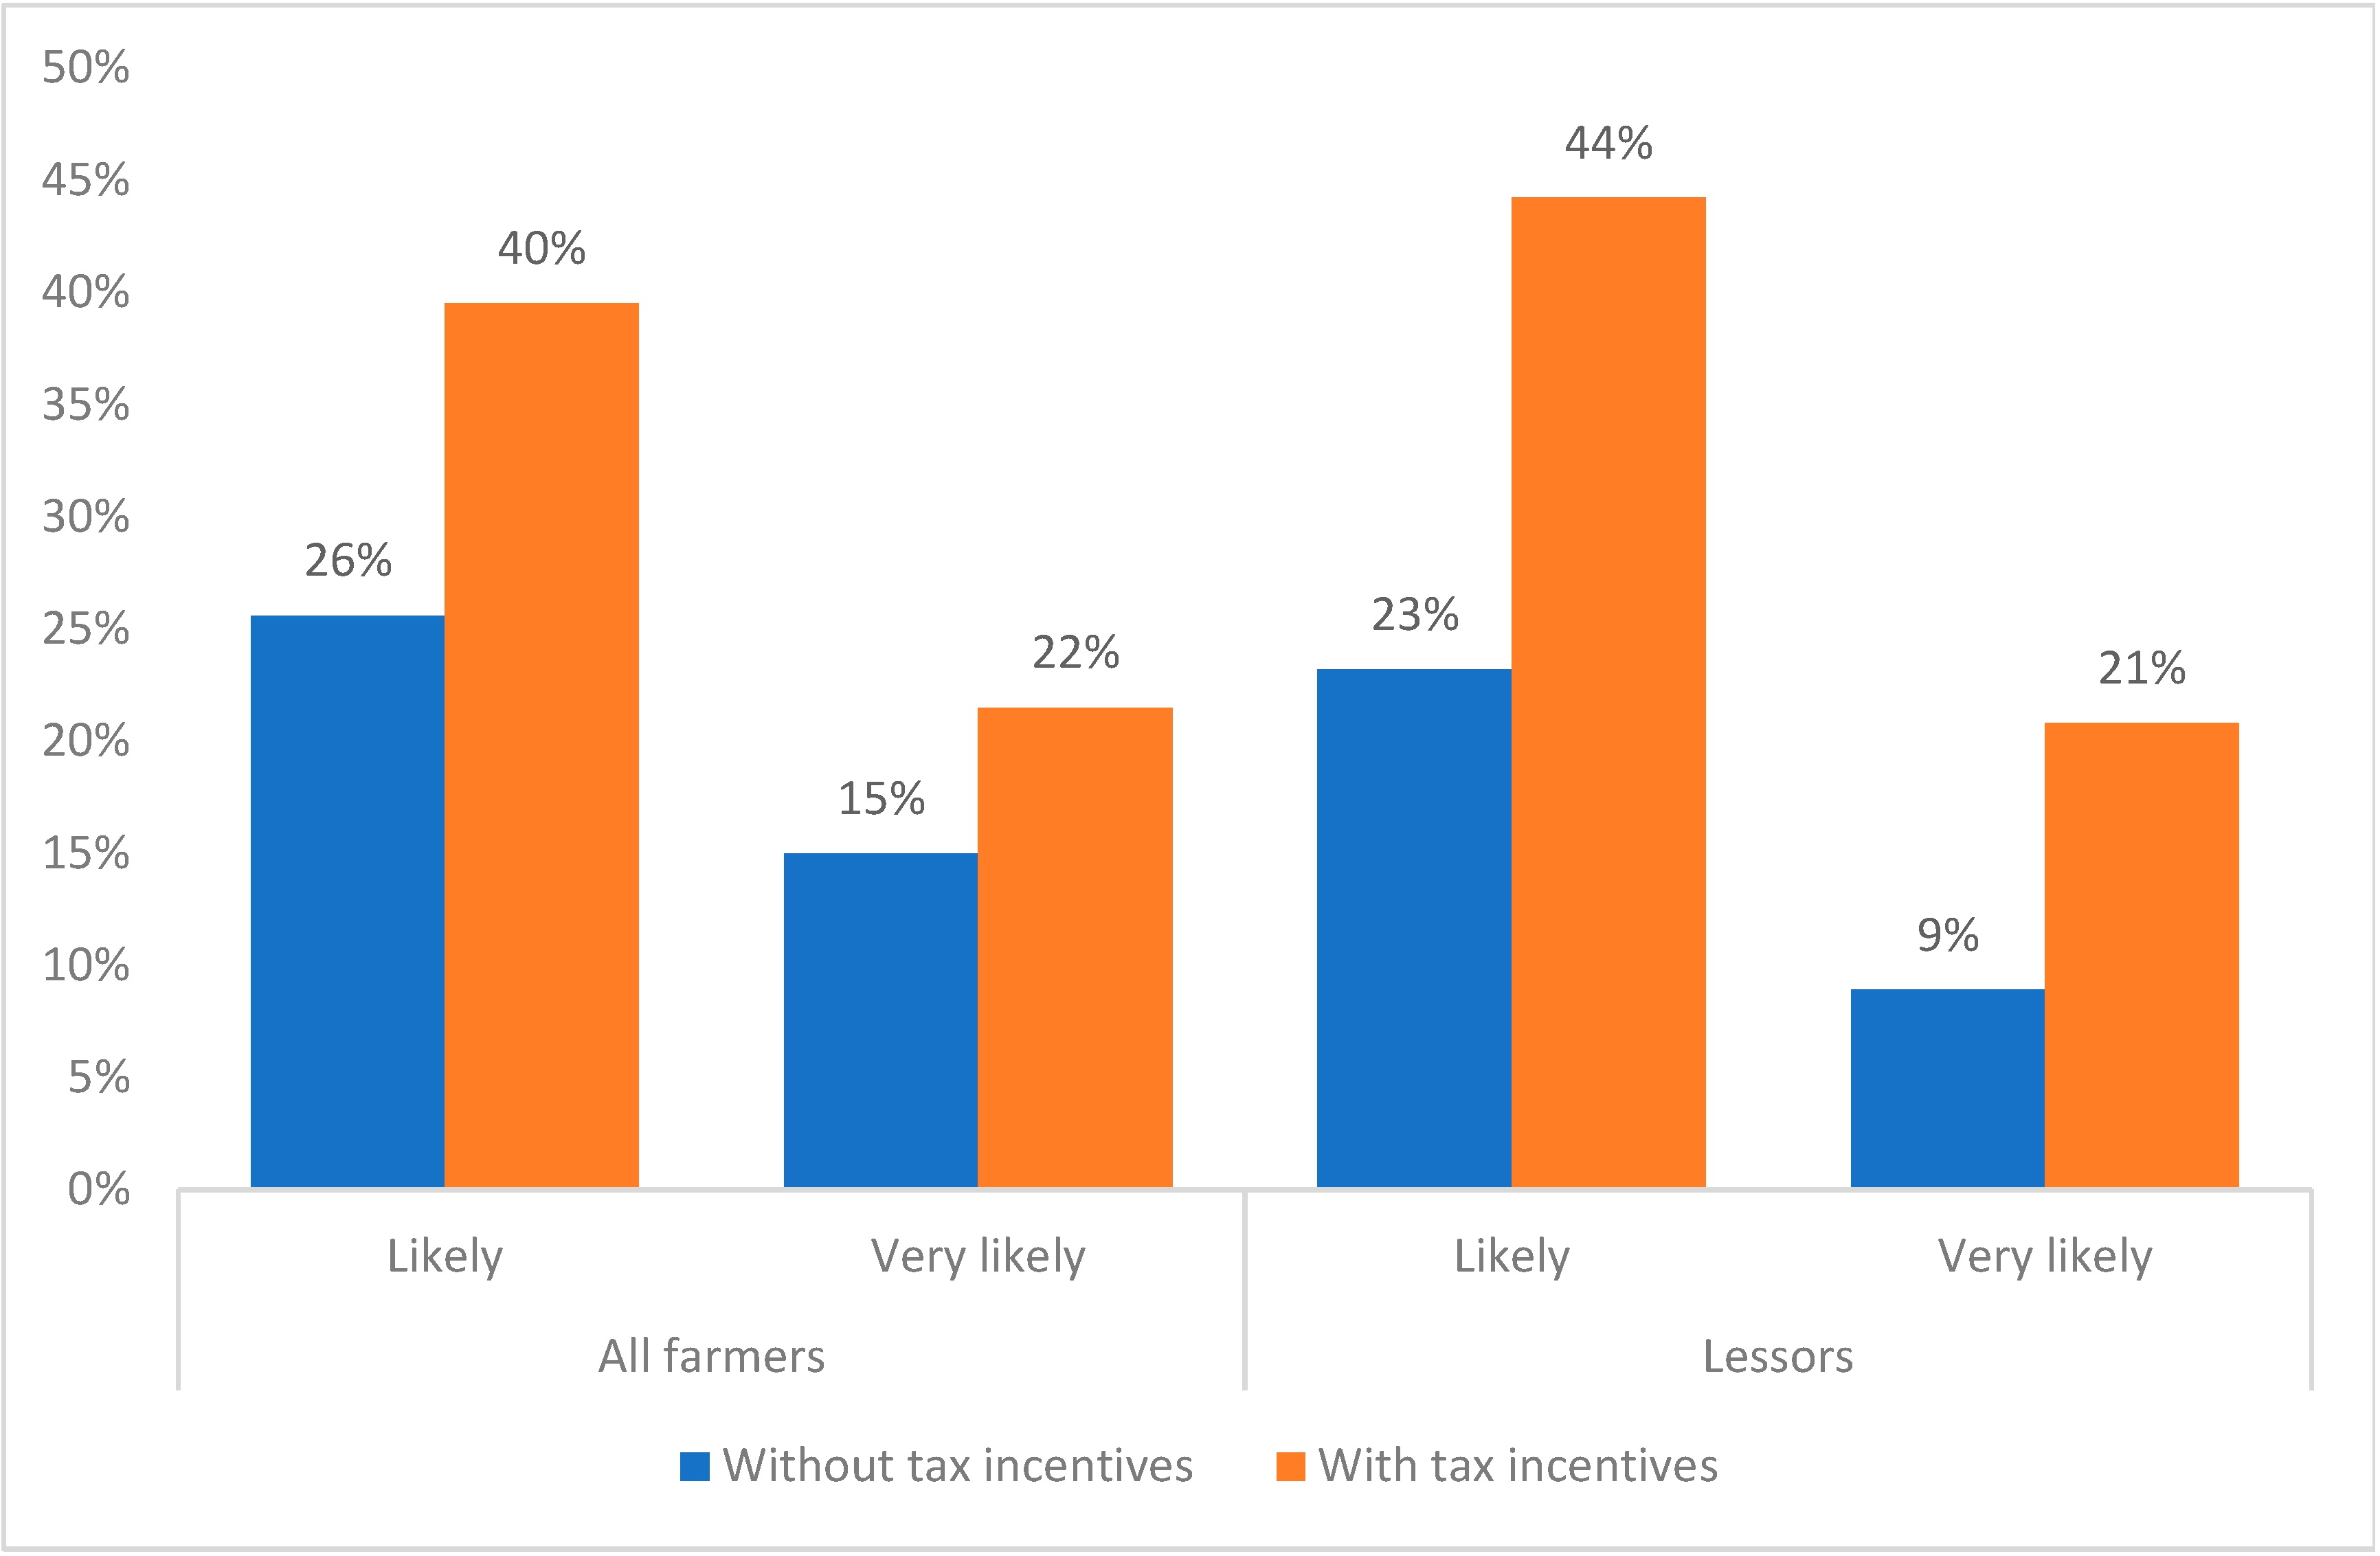
4.2. Intention to Engage in Long-Term Land Leasing

We analysed separately the responses of the farmers in relation to their intention to adopt long-term land leasing with and without tax incentives (income tax exemption to stimulate leasing of farmlands on long-term basis) for all the farmers in our sample and for farmers that currently rent out land (lessors). The results give an indication that farmers are more likely to adopt long-term land leasing with tax incentives compared to when there are no tax incentives. However, the effect of a tax incentive is more pronounced for farmers that currently rent out land (lessors) with the percentage of farmers who say they are likely or very likely to rent out land on a long-term contract increasing from 32% without tax incentives to 65% with tax incentives (Figure 2). The use of tax incentives to encourage long-term land leasing is likely to increase its adoption in Northern Ireland. However, other factors may also have to be taken into consideration.

4.3. Results of Principal Component Analysis

The result of the PCA analysis is presented in Table 2. The Kaiser–Meyer–Olkin measure of sampling adequacy was 0.763, which indicates that the five components derived from the 17 attitudinal statements explain a good proportion of the variance in the data [21]. Components with the eigenvalue of at least one were retained as is the usual practice and the promax rotation was applied to facilitate the interpretation of the components [20]. We retained statements with loadings greater than or equal to 0.3 on their target factor. Statements that did not load greater than or equal to 0.3 on any component were dropped. In total, the five components explain 55% of the total variance of the original variables. A previous study by Howley, Buckley, Donoghue and Ryan [18] also found a similar level of variation using PCA. Principal component (PC) 1 shows high loadings for items relating to profit maximisation such as “I try to find new ways of increasing profit on the farm” and was termed “profit conscious”, whereas PC 2 has high loadings on statements relating to the protection of the environment such as “In terms of what I produce on my farm, I think it is important to take the environment into consideration, even if it lowers profit” and was termed a “pro-environmental” construct, and PC3 loads highly on statements that do not support pro-environmental behaviour such as “It is more important to maximize profits than protect the environment” and was termed “environment neutral”. PC4 loads highly on statements that relate to risk attitude such as “I try to avoid taking risky farm business decisions” and was termed a “risk averse” construct, while PC5 relates to statements that support food production rather than the protection of the environment such as “It is a waste leaving farmland idle and not using it to produce food” and was termed a “food security” construct. We found a cross-factor loading for two of the measurement items “I take some actions to protect the environment when managing my farm” and “I believe society places too much emphasis on environmental issues”, which loaded on the “environment neutral” construct and the “food security” construct. The internal consistency of each component was assessed using Cronbach’s alpha coefficient and the inter-item correlations. Except for the “food security” component, which was 0.48, the value of Cronbach’s alpha coefficient for each of the remaining four components was at least 0.60, and the inter-item correlations range between 0.20 and 0.34 indicating that the components have sufficient internal consistency [20].

4.4. Results of Ordered Logit Model

To analyse the factors influencing the intention to adopt long-term land leasing, we employed an ordered logit model. The analysis was undertaken for all of the observations in the sample and for the subsample of farmers that currently rent out land with and without tax incentives, respectively, such that we ended with four models for analyses. Model 1 analysed the factors influencing the likelihood of adopting long-term land leasing for all the farmers in our sample without tax incentives. The dependent variable for this model was formulated based on the following question: “In the future, how likely are you to consider long-term land leasing as an option?” Model 2 was also undertaken for all the farmers in our sample, but the question for the dependent variable considers “with tax incentive”. The dependent variable for this model was formulated based on the following question: “In the future, if government introduced tax incentives for landowners engaging in longer-term land leasing, how likely are you to consider it as an option”. Model 3 and model 4 are, respectively, similar to model 1 and model 2 except that the analyses were undertaken only for farmers that currently rent out land. The analysis was undertaken for this group because by owning the land, they occupy an important position in the drive to encourage long-term land leasing in Northern Ireland, although we also conducted a separate analysis for farmers that currently rented in land to give an indication of the factors from the demand side. The results are presented in Table A1 in Appendix A. In conducting our analyses, we combined “very unlikely” and “unlikely” into one group and assigned a value of 1. We also combined “very likely” and “likely” into one group and assigned a value of 3 to it. We assigned the option neutral a value of 2. A previous study by [32] employed a similar approach. The selection of “not applicable” was excluded from the analyses. The explanatory variables comprise the farmers’ varying motivational factors, which were obtained using PCA and their demographic, socioeconomic, and farm structural characteristics as explained in Section 3.
The ordered logit regression model assumes that each explanatory variable has the same influence at each cumulative split of the ordered dependent variable (parallel lines assumption). The Brant [29] test was conducted to check if any of the variables violate the parallel lines assumption in each of the models to necessitate the use of either the partial proportional odds or the generalised ordered logit model. The Brant test results showed that the null hypothesis of the parallel lines assumption was rejected in only model 1 (for one variable, “profit-conscious variable” using a threshold of p < 0.1), (chi-square = 51.46, p-value = 0.003) but was not violated for the remaining three models; model 2 = (chi-square = 18.08, p-value = 0.901), model 3 = (chi-square = −29.02, p-value = 1.0), and model 4 (chi-square = −8.54, p-value = 1.0). The statistically insignificant results of the Brant test for these models indicate that the parallel lines assumption is true; hence, the ordinal logit regression is appropriate for analysing the data. The goodness-of-fit using the Hosmer–Lemeshow test [33], which were not statistically significant for all four models, also revealed that the models fitted well. Model 1 = (likelihood ratio statistic  =  20.60, degree of freedom  =  17, p-value  =  0.244); model 2 = (likelihood ratio statistic  =  21.35, degree of freedom  =  17, p-value  =  0.211); model 3 = (likelihood ratio statistic  =  15.43, degree of freedom  =  17, p-value  =  0.564); model 4 = (likelihood ratio statistic  =  16.02, degree of freedom  =  17, p-value  =  0.523). For completeness, we also fitted the partial proportional odds model to the data for model 1 in which the parallel lines assumption was violated for the profit conscious variable such that the parallel line constraint was relaxed only for the variable that violated the parallel lines assumption.
Overall, we found some level of variability in the results across the four models in respect of the likelihood of adopting long-term land leasing with or without tax incentives both for the average famer and for farmers that currently rent out land. The results of each model are presented separately in the following subsections.
The coefficients for the ordered logit model as with other logistic regression models are not in themselves interpretable with any substantive meaning [22,28]. This is because, with these models, one assumes that the outcome (future adoption of long-term land leasing) is a manifestation of an underlying latent variable, here interpreted as the intention to adopt long-term land leasing in the future. Hence, they are rather interpreted in terms of the standardized change in odds for the model holding all other variables constant. The implementation of the listcoef post-estimation command from the Stata package SPost13 [28] allows the coefficients to be interpreted more easily by looking at the coefficients in terms of the percentage change in odds for a unit change in the explanatory variable [18,34]. Examining the effect of a standard deviation change is particularly beneficial when variables have heterogeneous scales as it can be used to compare the effect of all the explanatory variables [18].

4.5. Determinant of Intention to Engage in Long-Term Land Leasing without Tax Incentives (Model 1)

The results of the factors influencing the likelihood of farmers to adopt long-term land leasing without tax incentive is presented in Table 3. In terms of farming motivations, our results show that the profit conscious orientation has a positive and statistically significant effect (β = 0.199, p < 0.01) on the likelihood of engaging in long-term land leasing without tax incentives. A standard deviation increase in the profit conscious orientation factor increases the odds of the average farmer engaging in long-term land leasing by 35%. On the other hand, the risk averse variable has a negative and statistically significant relationship with the intention to engage in long-term land leasing (β = −0.218, p < 0.01) such that a standard deviation increase in the variable decreases the odds of engaging in long-term land leasing by 25%. In terms of the farmers socioeconomic and farm characteristics, having a dairy enterprise (β = 0.933, p < 0.01) and the size of farmland owned (β = 0.002, p < 0.1) both have a positive and statistically significant relationship with the intention to engage in long-term land leasing. In addition, farming on land classified as disadvantaged (β = 0.221, p < 0.1) has a positive and statistically significant relationship with the intention to engage in long-term land leasing. On the other hand, the age of the farmer has a negative and statistically significant relationship with the intention to engage in long-term land leasing. For example, for the average farmer without tax incentives, having a dairy enterprise increases the odds of engaging in long-term land leasing by 154% relative to other enterprises. Older farmers are also less likely to engage in long-term land leasing compared to younger farmers. For example, being in the age bracket of (65–74) reduces the odds of engaging in long-term land leasing by 71% compared to farmers of other age groups. The parameter estimates for age tend to be suggestive of a non-linear relationship between age and the likelihood of engaging in long-term land leasing. This is because, in terms of the odds of engaging in long-term land leasing, as the age increases, the odds of engaging in long-term land leasing reduces, but for the age group (75 and older), the odds is reduced but not as much as the preceding age groupings for the average farmer.

4.6. Determinant of Intention to Engage in Long-Term Land Leasing with Tax Incentives (Model 2)

The result of the ordered logit model when the dependent variable is based on the future intention to engage in long-term land leasing with tax incentives for the average farmer in our sample is presented in Table 4. The result of the analysis show that in terms of the motivational constructs, the profit conscious orientation (β = 0.199, p < 0.01) has a positive and statistically significant relationship with future intention to adopt long-term land leasing as one standard deviation increase in this factor increases the odds of a farmer reporting future intention to adopt long-term land leasing by 24%. On the other hand, the risk averse construct is negatively associated with future intention to adopt long-term land leasing (β = −0.145, p < 0.01) as a one standard deviation increase in the factor decreases the odds of a farmer reporting future intention to adopt long-term land leasing by 14%. The other attitudinal constructs of food security and environment neutral, and the pro-environmental construct were not statistically significant as in model 1, which considers the future intention to adopt long-term land leasing without incentives. Generally, in terms of the motivational factors, the results for model 1 (without tax incentives) and model 2 (with tax incentives) are qualitatively similar, although with higher odds in model 1 compared to model 2. For the socioeconomic and demographic factors, we found membership of business development groups (BDG) (β = 0.429, p < 0.05), having a dairy enterprise (β = 0.563, p < 0.1), the size of the farmland owned (β = 0.003, p < 0.05), and having a higher education, diploma or equivalent (β = 0.500, p < 0.05), to be statistically significant and positively associated with a farmer reporting a future intention to adopt long-term land leasing. For example, having a dairy enterprise increases the odds of a farmer reporting a future intention to adopt long-term land leasing by 76% relative to other enterprises. Unlike model 1 (without tax incentives), the age of the farmer and having land designated as a “disadvantaged area” was not statistically significant. Generally, in terms of the socioeconomic and demographic factors, there is some level of variability in the results of model 1 compared to model 2. The results in both models, however, give an indication that for the average farmer, both motivational and socioeconomic factors have the potential to predict the intention to adopt long-term land leasing.

4.7. Determinant of Intention to Engage in Long-Term Land Leasing with and without Tax Incentives for Lessors (Model 3 and 4)

In addition to undertaking our analyses for all the farmers in our sample, we also analysed the data for only farmers that currently rent out land (lessors) without tax incentives (model 3) and with tax incentives (model 4). The results of the analyses are presented in Table 5. The results show that in model 3, only the pro-environmental construct (β = 0.270, p < 0.01) has a positive and statistically significant relationship with a lessor reporting a future intention to adopt long-term land leasing. Specifically, a standard deviation change in the factor increases the odds of a lessor reporting the intention to engage in long-term land leasing by 44%. All other explanatory variables in the model were not statistically significant, implying that socioeconomic and demographic factors do not influence the future intention of the lessors to engage in long-term land leasing without tax incentives. In model 4, in addition to the pro-environmental construct, which has a positive and statistically significant relationship with a lessor reporting future intention to engage in long-term land leasing, we also found a positive and statistically significant relationship for the profit conscious construct, although, compared to model 3, the constructs are only slightly significant at the 10% level and the odds are slightly lower for the pro-environmental construct. In terms of the socio-demographic variables for model 4, only the identification of a successor was found to have a negative and statistically significant relationship with a lessor reporting a future intention to engage in long-term land leasing. Specifically, having a successor identified reduces the odds of a lessor reporting a future intention to adopt long-term land leasing by 45%. All other explanatory variables in model 4 were not statistically significant, implying that socio-demographic factors have limited influence in predicting the future intention of the lessors to engage in long-term land leasing. In terms of the overall magnitude, the pro-environmental construct has the greatest influence on the likelihood of engaging in long-term land leasing for farmers that currently rent out land. However, looking at the results from the demand side, that is for farmers that currently rent in land (Table A1 in the Appendix A), the pro-environmental construct was not statistically significant both with and without tax incentives.

5. Discussion

The results of our analyses showed that varying factors influence farmers’ intention to adopt long-term land leasing, and variability also exists depending on the farmers’ rental status. For the average farmer in the region, we found their future intention to engage in long-term land leasing to be influenced by motivational and socio-demographic factors. However, when the analysis was conducted for farmers that currently rent out land, only the pro-environmental factor was statistically significant without tax incentives. In addition to the pro-environmental factor, only the presence of a successor and the profit conscious factor were statistically significant with tax incentives for the farmers that currently rent out land. One big difference in the results is the fact that we found the pro-environmental factor to be statistically significant for farmers that currently rent out land but was not statistically significant for the average farmer in our sample. This is an indication that variability exists between farmers that currently rent out land and the average farmer in terms of the relationship between the environmental management of the land and the likelihood of adopting long-term land leasing. It implies that farmland owners take into consideration the environmental management of their land in making a decision on the type of land rental arrangement they want to be involved in. This result is in line with that of the previous study by Ruxton, et al. [35] in which they found variability in decision making relating to conservation practices among farmer types based on their land ownership status. The positive and significant effect of the pro-environmental construct for the farmers that currently rent out land may also be attributed to the fact that farmland owners do have strong connections to their land. This is in line with previous studies by Myyrä, et al. [36] and Leonhardt, et al. [37] in which it was found that owned land is often better managed than rented land in terms of soil fertility management. This suggests that farmers invest more into owned land compared to rented or short-term leases. This was also pointed out in our qualitative analysis in which participants suggested that landowners are often fearful of tenants not taking good care of the agricultural land that is leased to them. In the words of one of the farmers who currently rents out land “It has been my experience that, in general, they (tenants) do not take care of the land as I would myself. At times, ground has been tramped, fences damaged, buildings left in a mess, weeds, and verbal agreements not respected. If the letting period is short, then you can minimise the damage and try letting to a different farmer.” Another farmer emphasizing the environmental aspect of long-term land leasing stated that “I would consider long-term land leasing if: environmental issues were addressed (reduced slurry/sprays)”. The implication of this is that, to encourage farmland owners to engage in long-term land leasing, emphasis should be placed on good practice around the management of the land, including environmental management.
We also found that, for farmers that currently rent out land, having a successor identified reduces the likelihood of engaging in long-term land leasing in the model with tax incentives. This may be seen from the perspective of the farmers not wanting to rent out their land on a long-term lease such that it is easily available for use by the identified successor, whereas for those that do not have an identified successor, they may be willing to rent out their land on long-term lease to take advantage of tax incentives. Given the positive relationship between the pro-environmental construct and the future intention to engage in long-term land leasing, it may imply that lessors may be wary of letting out their land on a long-term lease without the assurance that the land will be properly managed and kept in a satisfactory condition for use by their successor. A previous study by Zhang, et al. [38] showed that with the presence of a successor, farmers are encouraged to invest in land improvement and put a lot of emphasis on the environmental management of the land. Our model also indicates that being a member of the business development group is a significant predictor of long-term land leasing adoption when it is accompanied with tax incentives. A peer-to-peer learning platform such as the BDG is particularly important and has been identified in the literature as an effective medium to encourage farmers to adopt new and best practices [27,39].

6. Conclusions

In this study, we analysed the factors influencing the intention of farmers to adopt long-term land leasing with and without income tax incentives in Northern Ireland using a mixed methods approach. We found from our analyses that farmers are likely to adopt long-term land leasing with the introduction of tax incentives. We estimated four models to analyse the factors associated with the likelihood of adopting long-term land leasing. First, we analysed our data for all the observations in our sample. We then undertook a separate analysis for farmers that currently rent out land. We found that factors associated with the likelihood of adopting long-term land leasing are different in these models. Our empirical results show that while pro-environmental behaviour was significantly associated with the likelihood of adopting long-term land leasing for farmers that currently rent out land, it was not statistically significant for the average farmer in our total sample.
Our study results have some policy implications. It can be suggested from the results that when designing policies aimed at encouraging long-term land leasing, a holistic approach should be adopted. For example, while tax incentives should be considered as an option to encourage long-term land leasing, there is also the need to explore other means such as linking it to accessing government grant schemes and environmental regulation given that the environmental management of the land was considered a very important factor to the farmers that currently rent out land. The need to protect the environment and limit the loss of biodiversity are important considerations when devising policies to encourage long-term land leasing. While this study was undertaken in Northern Ireland with a unique form of short-term land rental system, the findings apply to other regions where short-term land leasing is prevalent. Further research focusing on the influence of behavioural factors on the intention to adopt long-term land leasing would be valuable in providing clarification on the extent to which behavioural factors influence farmers’ decisions in relation to long-term land leasing. Future research can also analyse the relationship between long-term land leasing and farm productivity.
A possible limitation of this study is the risk of social desirability bias due to the self-reported nature of the data collection process. This is because the farmers may have responded to the questions in a way that they may be viewed favourably by researchers or by others. They may have overestimated their positive disposition towards long-term land leasing in a bid to impress the research team. However, it is our belief that that the assurance given to the famers in terms of the anonymity of the survey may have mitigated this source of bias. In designing our questionnaire, we also explained in detail the focus of the study and the need for the farmers to be as objective as possible in answering the questions.

Author Contributions

Conceptualization, A.H.A. and C.J.; methodology, A.H.A., C.J., and R.M.; software, A.H.A.; formal analysis, A.H.A.; investigation, A.H.A., C.J., and R.M; writing—original draft preparation, A.H.A.; writing—review and editing, A.H.A., C.J., and R.M; project administration, A.H.A. and C.J.; funding acquisition, A.H.A. and C.J. All authors have read and agreed to the published version of the manuscript.

Funding

This research was funded by the Department of Agriculture, Environment and Rural Affairs (DAERA) as part of the Evidence and Innovation Programme (DAERA E&I), grant number 19-1-05”.

Institutional Review Board Statement

Not Applicable.

Informed Consent Statement

Informed consent was obtained from all participants involved in the study.

Data Availability Statement

The data that support the findings of this study were provided solely for the purpose of this project under a data sharing agreement with the funders, DAERA and are not publicly available.

Conflicts of Interest

The authors declare no conflict of interest.

Appendix A

Table A1. Estimates of determinants of intention to adopt long-term land leasing for lessee (N = 409).
Without IncentiveWith Incentive
VariablesCoef.Std. Err.%%StdXCoef.Std. Err.%%StdX
Food security−0.0540.107−5.2−6.1−0.1450.117 −13.5−15.6
Risk averse−0.387 ***0.101−32.1−42.6−0.351 ***0.106−29.6−39.5
Environment neutral0.0820.0998.611.2−0.0070.104−0.7−0.9
Pro-environment−0.0570.094−5.5−7.7−0.0280.097−2.8−3.9
Profit conscious0.454 ***0.09157.599.30.227 **0.09525.441.1
BDG membership0.4820.30962.022.40.687 **0.35098.733.4
Off-farm employment0.3740.28845.420.2−0.1000.317−9.5−4.8
Successor0.734 ***0.244108.444.00.1280.25913.76.6
Dairy enterprise0.0240.5032.41.0−0.1310.557−12.3−5.1
Beef enterprise−0.1810.449−16.5−8.6−0.0730.501−7.1−3.6
Sheep enterprise−0.4460.503−36.0−15.1−0.977 *0.549−62.4−30.2
Farmland owned (ha)0.0000.0020.02.2−0.0000.002−0.0−1.4
Fewer than 5 GCSEs0.0380.3953.91.10.0890.4279.32.6
5 GCSEs or equivalent−0.3780.354−31.4−13.3−0.3670.368−30.7−12.9
A level or equivalent−0.3120.473−26.8−7.20.7230.628106.018.9
Higher education—diploma or equivalent0.3240.39138.314.10.755 *0.453112.835.9
Degree level or higher0.3850.47047.014.5−0.0230.461−2.3−0.8
Full-time0.3090.27436.216.60.1560.29716.98.0
30–40−1.3581.132−74.3−34.90.5760.76377.820.0
41–54−1.4421.103−76.4−46.6−0.0700.699−6.8−3.0
55–64−2.107 *1.107−87.8−61.90.2030.72422.59.7
65–74−2.837 **1.128−94.1−67.8−0.4930.749−38.9−17.9
75 or older−1.8611.175−84.4−41.40.0090.8360.90.3
Disadvantaged0.4300.27053.7−21.7−0.0270.292−2.7−1.2
Severely Disadvantaged0.655 **0.29992.533.20.3270.32538.715.4
Have formal agricultural qualification0.1940.30721.410.00.2490.33328.313.0
Diversification activities−0.3190.305−27.3−12.2−0.2970.308−25.7−11.4
Note: % is the percent change in odds for unit increase in our explanatory variable; %StdX is the percent change in odds for a standard deviation change in our explanatory variable; single, double, and triple asterisks (*, **, ***) indicate significance at the 10%, 5%, and 1% level, respectively. The Hosmer–Lemeshow goodness-of-fit test with tax incentive model (likelihood ratio statistic = 17.42, degree of freedom = 17, p-value = 0.426); without tax incentive model = (likelihood ratio statistic = 9.65, degree of freedom = 17, p-value = 0.918).

References

  1. Adenuga, A.H.; Jack, C.; McCarry, R. The Case for Long-Term Land Leasing: A Review of the Empirical Literature. Land 2021, 10, 238. [Google Scholar] [CrossRef]
  2. Zhang, L.; Cao, Y.; Bai, Y. The impact of the land certificated program on the farmland rental market in rural China. J. Rural Stud. 2019, 93, 165–175. [Google Scholar] [CrossRef]
  3. Awasthi, M.K. Dynamics and resource use efficiency of agricultural land sales and rental market in India. Land Use Policy 2009, 26, 736–743. [Google Scholar] [CrossRef]
  4. Bradfield, T.; Butler, R.; Dillon, E.J.; Hennessy, T. The factors influencing the profitability of leased land on dairy farms in Ireland. Land Use Policy 2020, 95, 104649. [Google Scholar] [CrossRef]
  5. Deininger, K.; Jin, S.; Nagarajan, H.K. Determinants and Consequences of Land Sales Market Participation: Panel Evidence from India; The World Bank: Washington, DC, USA, 2007. [Google Scholar]
  6. Gao, L.; Sun, D.; Huang, J. Impact of land tenure policy on agricultural investments in China: Evidence from a panel data study. China Econ. Rev. 2017, 45, 244–252. [Google Scholar] [CrossRef]
  7. Muraoka, R.; Jin, S.; Jayne, T.S. Land access, land rental and food security: Evidence from Kenya. Land Use Policy 2018, 70, 611–622. [Google Scholar] [CrossRef] [Green Version]
  8. Lovo, S. Tenure insecurity and investment in soil conservation. Evidence from Malawi. World Dev. 2016, 78, 219–229. [Google Scholar] [CrossRef] [Green Version]
  9. Abdulai, A.; Owusu, V.; Goetz, R. Land tenure differences and investment in land improvement measures: Theoretical and empirical analyses. J. Dev. Econ. 2011, 96, 66–78. [Google Scholar] [CrossRef]
  10. Rock, K.; Clark, A.; Smith, S.D.; Martin, A.; Norton, E.; Cowap, C.; Dunn, G.; Morris, M. Working Together for a Thriving Agricultural Tenanted Sector; Tenancy Working Group: London, UK, 2022. [Google Scholar]
  11. Forbord, M.; Bjørkhaug, H.; Burton, R.J. Drivers of change in Norwegian agricultural land control and the emergence of rental farming. J. Rural Stud. 2014, 33, 9–19. [Google Scholar] [CrossRef] [Green Version]
  12. Harris, L. Mixed fortune for Wales and NI land despite high demand. In Farmers Weekly; Mark Allen Group: London, UK, 2022. [Google Scholar]
  13. Milne, G.; Byrne, A.W.; Campbell, E.; Graham, J.; McGrath, J.; Kirke, R.; McMaster, W.; Zimmermann, J.; Adenuga, A.H. Quantifying Land Fragmentation in Northern Irish Cattle Enterprises. Land 2022, 11, 402. [Google Scholar] [CrossRef]
  14. Adenuga, A.H.; Davis, J.; Hutchinson, G.; Donnellan, T.; Patton, M. Modelling regional environmental efficiency differentials of dairy farms on the island of Ireland. Ecol. Indic. 2018, 95, 851–861. [Google Scholar] [CrossRef]
  15. Jordan, D.; Turner, J. Northern Ireland’s Productivity Challenge: Exploring the Issues; The Productivity Institute: New York, NY, USA, 2021. [Google Scholar]
  16. DAERA. Statistical Review of Northern Ireland Agriculture, 56th ed.; Policy Economics and Statistics Division, Ed.; Department of Agriculture, Environment and Rural Affairs Belfast: Belfast, UK, 2021. [Google Scholar]
  17. Edwards-Jones, G. Modelling farmer decision-making: Concepts, progress and challenges. Anim. Sci. 2006, 82, 783–790. [Google Scholar] [CrossRef]
  18. Howley, P.; Buckley, C.; Donoghue, C.O.; Ryan, M. Explaining the economic ‘irrationality’of farmers’ land use behaviour: The role of productivist attitudes and non-pecuniary benefits. Ecol. Econ. 2015, 109, 186–193. [Google Scholar] [CrossRef]
  19. Vanclay, F. Social principles for agricultural extension to assist in the promotion of natural resource management. Aust. J. Exp. Agric. 2004, 44, 213–222. [Google Scholar] [CrossRef]
  20. O’Kane, H.; Ferguson, E.; Kaler, J.; Green, L. Associations between sheep farmer attitudes, beliefs, emotions and personality, and their barriers to uptake of best practice: The example of footrot. Prev. Vet. Med. 2017, 139, 123–133. [Google Scholar] [CrossRef]
  21. Lapple, D.; Kelley, H. Understanding Farmers’ Uptake of Organic Farming: An Application of the Theory of Planned Behaviour. In Proceedings of the Agricultural Economics Society, 84th Annual Conference, Edinburgh, Scotland, 29–31 March 2010. [Google Scholar]
  22. Howley, P. The happy farmer: The effect of nonpecuniary benefits on behavior. Am. J. Agric. Econ. 2015, 97, 1072–1086. [Google Scholar] [CrossRef]
  23. Fakayode, S.B.; Adenuga, A.H.; Yusuf, T.; Jegede, O. Awareness of and demand for private agricultural extension services among small-scale farmers in Nigeria. J. Agribus. Rural Dev. 2016, 4, 521–531. [Google Scholar]
  24. Kaplan, S.; Prato, C.G. Risk factors associated with bus accident severity in the United States: A generalized ordered logit model. J. Saf. Res. 2012, 43, 171–180. [Google Scholar] [CrossRef]
  25. Williams, R. Generalized ordered logit/partial proportional odds models for ordinal dependent variables. Stata J. 2006, 6, 58–82. [Google Scholar] [CrossRef] [Green Version]
  26. Deneke, T.T.; Bekele, A.; Moore, H.L.; Mamo, T.; Almaw, G.; Mekonnen, G.A.; Mihret, A.; Tschopp, R.; Yeheyis, L.; Hodge, C. Milk and meat consumption patterns and the potential risk of zoonotic disease transmission among urban and peri-urban dairy farmers in Ethiopia. BMC Public Health 2022, 22, 222. [Google Scholar] [CrossRef]
  27. Adenuga, A.H.; Jack, C.; Ashfield, A.; Wallace, M. Assessing the Impact of Participatory Extension Programme Membership on Farm Business Performance in Northern Ireland. Agriculture 2021, 11, 949. [Google Scholar] [CrossRef]
  28. Long, J.S.; Freese, J. Regression Models for Categorical Dependent Variables Using Stata; Stata Press: College Station, TX, USA, 2006; Volume 7. [Google Scholar]
  29. Brant, R. Assessing proportionality in the proportional odds model for ordinal logistic regression. Biometrics 1990, 46, 1171–1178. [Google Scholar] [CrossRef] [PubMed]
  30. Central Association of Agricultural Valuers. The Annual Agricultural Land Occupation Surveys For Great Britain 2021; Central Association of Agricultural Valuers: Gloucestershire, UK, 2022. [Google Scholar]
  31. Shaw, L.; Stafford, R. Tenant Farming Rent Review Survey: Final Report; Agriculture, E.A.M., Ed.; The Scottish Government: Edinburgh, Scotland, 2021. [Google Scholar]
  32. Li, L.; Zheng, Y.; Ma, S. Indoor Air Purification and Residents’ Self-Rated Health: Evidence from the China Health and Nutrition Survey. Int. J. Environ. Res. Public Health 2022, 19, 6316. [Google Scholar] [CrossRef] [PubMed]
  33. Fagerland, M.W.; Hosmer, D.W. How to test for goodness of fit in ordinal logistic regression models. Stata J. 2017, 17, 668–686. [Google Scholar] [CrossRef]
  34. Armstrong, J.; White-Lewis, E.; Nicole Farris, D.; Edwards, W.J. Reevaluating factors associated with negative attitudes toward police: Capturing information from college students. J. Ethn. Crim. Justice 2021, 19, 73–100. [Google Scholar] [CrossRef]
  35. Ruxton, M.M.; Heiden, E.O.; Begum, N.; Losch, M.E. Understanding Farmer and Landowner Decision-Making and Message Preference Concerning Conservation Practice Adoption in the Clear Creek Watershed; Iowa State University: Ames, IA, USA, 2019. [Google Scholar]
  36. Myyrä, S.; Ketoja, E.; Yli-Halla, M.; Pietola, K. Land improvements under land tenure insecurity: The case of pH and phosphate in Finland. Land Econ. 2005, 81, 557–569. [Google Scholar] [CrossRef] [Green Version]
  37. Leonhardt, H.; Penker, M.; Salhofer, K. Do farmers care about rented land? A multi-method study on land tenure and soil conservation. Land Use Policy 2019, 82, 228–239. [Google Scholar] [CrossRef]
  38. Zhang, Q.; Tian, J.; Zheng, J.; Abdullahi, N.M.; Huo, X. How Does Land Tenure Security Affect Farm Succession? Evidence from Apple Growers in China. Land 2022, 11, 1036. [Google Scholar] [CrossRef]
  39. Tensi, A.F.; Ang, F.; van der Fels-Klerx, H.J. Behavioural drivers and barriers for adopting microbial applications in arable farms: Evidence from the Netherlands and Germany. Technol. Forecast. Soc. Chang. 2022, 182, 121825. [Google Scholar] [CrossRef]
Figure 1. Flow chart of study’s research components and methods.
Land 12 00649 g001
Figure 2. Intention to take up long-term land leasing with and without tax incentives.
Land 12 00649 g002
Table 1. Sample distribution across strata.
Farmland Ownership and Rental StatusTotal Number in PopulationPercentage of
Total
Land TypesTotal Number in Sample
NDADASDA
Farmers that farm on owned land only605248.11601175726941210
Farmers that farm on owned and rented land462536.8155114021672924
Farmers that farm on owned and rented land but also let out land2612.11138761261
Farmers that farm on owned land only but also let out land10428.34773212441042
Farmers that farm only on rented land4463.5148132166446
Farms that have let out all their land1461.2605267146
Total12,5721003950375149044029
NDA = non-disadvantaged area; DA = disadvantaged area; SDA = severely disadvantaged.
Table 2. Principal components (component loadings) for farming motivations (values > 0.3 are highlighted in bold).
VariablesPC1PC2PC3PC4PC5
Profit
Conscious
(α = 0.68)
Pro-Environment (α = 0.60)Not-for-
Environment
(α = 0.63)
Risk Averse
(α = 0.66)
Food Security (α = 0.48)
I am generally keen to adopt new technologies0.53600.0302−0.0362−0.23080.0429
I try to find new ways of increasing profit on the farm0.5113−0.01160.0202−0.0744−0.0036
Good farming is about maximising profits from the farm business0.3187−0.06560.25660.06650.0731
I find farming rewarding from a quality-of-life perspective0.34600.0213−0.00880.1408−0.1343
I think good record keeping is very important in managing a farm business0.42180.0288−0.10920.04230.0020
I take some actions to protect the environment when managing my farm because I feel it is the right thing to do0.04030.3953−0.12070.03520.3456
Farmers should receive subsidies for protecting the environment and not for the total amount of land farmed−0.02370.57100.26620.0483−0.1470
In terms of what I produce on my farm, I think it is important to take the environment into consideration, even if it lowers profit−0.02850.4532−0.1470−0.01590.1447
I am concerned about the loss of biodiversity in our farmed environment0.05570.53960.0532−0.0397−0.0729
It is more important to maximize profits than protect the environment0.01730.10620.6611−0.0601−0.0589
I believe society places too much emphasis on environmental issues−0.06460.01820.33480.01840.4525
I am not that concerned about environmental issues−0.07690.00640.5179−0.03830.0708
I try to avoid taking risky farm business decisions−0.1111−0.0097−0.02450.65020.0192
I try to keep debt levels as low as possible−0.07340.0188−0.07930.63560.0338
I think the media exaggerate the negative impact of agricultural activities on the environment0.0112−0.0404−0.05910.00500.6774
It is a waste leaving farmland idle and not using it to produce food0.1630−0.11410.03970.12040.3407
I think it is difficult to make a living just from farming alone0.10880.06160.05410.2990−0.1401
Initial eigenvalues2.351.871.751.701.56
Table 3. Estimates of determinants of intention to adopt long-term land leasing without tax incentives (N = 1196).
Ordered Logit ModelPartial Ordered Logit Model
VariablesCoef.Std. Err.%%StdXCoef. (1)Std. Err.Coef. (2)Std. Err.
Food security−0.0190.054−1.9−2.3−0.018 ***0.054
Risk averse−0.218 ***0.052−19.6−24.8−0.2240.052
Environment neutral0.0340.0503.44.60.0360.050
Pro-environment0.0460.0484.76.70.0470.048
Profit conscious0.199 ***0.04522.034.70.122 **0.0480.278 ***0.049
BDG membership0.2130.16723.88.10.2100.167
Off-farm employment0.1390.14514.97.10.1540.146
Successor0.1870.12120.69.70.1870.121
Dairy enterprise0.933 ***0.261154.330.50.945 ***0.261
Beef enterprise0.1450.16915.77.50.1410.169
Sheep enterprise−0.0120.192−1.2−0.5−0.0210.193
Farmland owned (ha)0.002 *0.0010.212.50.002 *0.001
Fewer than 5 GCSEs0.0350.2203.51.00.0260.220
5 GCSEs or equivalent−0.0610.185−6.0−2.2−0.0610.185
A level or equivalent0.0250.2412.50.60.0140.242
Higher education—diploma or equivalent0.2670.19530.610.70.2750.195
Degree level or higher0.1850.18520.37.70.1920.186
Full-time0.1580.13917.18.00.1500.139
30–40−0.0200.454−2.0−0.50.0160.455
41–54−0.6410.414−47.3−23.4−0.6060.415
55–64−0.778 *0.415−54.0−29.7−0.738 *0.416
65–74−1.229 ***0.426−70.7−41.4−1.189 ***0.426
75 or older−1.140 **0.445−68.0−32.5−1.099 **0.446
Disadvantaged0.221 *0.13224.710.90.220 *0.132
Severely Disadvantaged0.2060.15322.98.90.2090.153
Have formal agricultural qualification0.0640.1446.63.10.0610.145
Diversification activities0.2360.14632.610.10.2330.147
Note: % is the percent change in odds for unit increase in our explanatory variable; %StdX is the percent change in odds for a standard deviation change in our explanatory variable; single, double, and triple asterisks (*, **, ***) indicate significance at the 10%, 5%, and 1% level, respectively. The Hosmer–Lemeshow goodness-of-fit test (likelihood ratio statistic  =  20.60, degree of freedom  =  17, p-value  =  0.244).
Table 4. Estimates of determinants of intention to adopt long-term land leasing with tax incentives (N = 1196).
VariablesCoef.Std. Err.%%StdX
Food security−0.0300.057−2.9−3.5
Risk averse−0.145 ***0.055−13.5−17.3
Environment neutral−0.0830.053−8.0−10.5
Pro-environment0.0210.0512.13.0
Profit conscious0.143 ***0.04715.423.9
BDG membership0.429 **0.19453.617.0
Off-farm employment0.2450.15427.713.0
Successor−0.1350.127−12.6−6.4
Dairy enterprise0.563 *0.28975.617.4
Beef enterprise0.0880.1809.24.5
Sheep enterprise−0.1970.204−17.9−7.7
Farmland owned (ha)0.003 **0.0020.316.2
Fewer than 5 GCSEs0.0330.2263.30.9
5 GCSEs or equivalent−0.1540.189−14.3−5.5
A level or equivalent0.4070.27350.210.6
Higher education—diploma or equivalent0.500 **0.21564.921.0
Degree level or higher0.2220.19624.99.4
Full-time−0.0010.147−0.10.0
30–400.2480.49828.26.5
41–54−0.1340.452−12.5−5.4
55–640.0950.4559.94.4
65–74−0.0960.462−9.1−4.1
75 or older−0.1380.482−12.9−4.6
Disadvantaged0.0330.1423.41.6
Severely Disadvantaged−0.0340.160−3.3−1.4
Have formal agricultural qualification0.2160.15624.210.9
Diversification activities0.0260.1562.61.6
Note: % is the percent change in odds for unit increase in our explanatory variable; %StdX is the percent change in odds for a standard deviation change in our explanatory variable; single, double, and triple asterisks (*, **, ***) indicate significance at the 10%, 5%, and 1% level, respectively. The Hosmer–Lemeshow goodness-of-fit test (likelihood ratio statistic  =  21.35, degree of freedom  =  17, p-value  =  0.211).
Table 5. Estimates of determinants of intention to adopt long-term land leasing for lessors (N = 397).
Without IncentiveWith Incentive
VariablesCoef.Std. Err.%%StdXCoef.Std. Err.%%StdX
Food security0.0100.0941.01.2−0.0640.109−6.2−7.7
Risk averse−0.0840.090−8.1−10.1−0.0130.102−1.3−1.6
Environment neutral0.0740.0917.710.6−0.0090.104−0.9−1.2
Pro-environment0.270 ***0.09631.043.90.200 *0.10722.230.9
Profit conscious−0.0170.079−1.7−2.50.170 *0.09118.528.6
BDG membership−0.1630.300−15.1−5.50.4730.37460.517.9
Off-farm employment0.0560.2505.82.80.4690.28659.926.5
Successor−0.0250.212−2.5−1.2−0.588 **0.234−44.5−24.8
Dairy enterprise0.4060.72650.16.21.2860.915261.721.1
Beef enterprise0.2150.24724.011.40.1960.28021.710.3
Sheep enterprise−0.0380.287−3.7−1.60.0470.3204.82.0
Farmland owned (ha)0.0030.0020.316.20.0020.0030.212.6
Fewer than 5 GCSEs0.4880.45962.912.6−0.0830.493−8.0−2.0
5 GCSEs or equivalent0.0340.3453.51.2−0.0460.378−4.5−1.6
A level or equivalent0.1180.40212.53.30.2390.44927.06.8
Higher education—diploma or equivalent0.3600.34143.314.60.2800.39132.311.2
Degree level or higher0.3690.30944.718.10.0530.3455.52.4
Full-time0.1080.24811.45.1−0.0420.274−4.1−1.9
30–400.6371.09789.111.51.1381.601212.221.6
41–540.0440.9284.51.6−0.1961.226−17.8−6.8
55–640.0480.9294.92.30.1571.22617.07.7
65–74−0.1740.943−16.0−7.50.6291.24587.532.7
75 or older−0.3740.973−31.2−13.8−0.0591.267−5.8−2.3
Disadvantaged0.3070.22636.015.10.2070.26323.010.0
Severely Disadvantaged0.0920.3039.73.2−0.0790.343−7.6−2.7
Have formal agricultural qualification0.1730.24118.98.60.2890.28033.614.8
Diversification activities0.2780.24232.112.8−0.2080.276−18.8−8.6
Note: % is the percent change in odds for unit increase in our explanatory variable; %StdX is the percent change in odds for a standard deviation change in our explanatory variable; single, double, and triple asterisks (*, **, ***) indicate significance at the 10%, 5%, and 1% level, respectively. The Hosmer–Lemeshow goodness-of-fit test with tax incentive model (likelihood ratio statistic  =  15.43, degree of freedom  =  17, p-value  =  0.564); without tax incentive model (likelihood ratio statistic  =  16.02, degree of freedom  =  17, p-value  =  0.523).
Disclaimer/Publisher’s Note: The statements, opinions and data contained in all publications are solely those of the individual author(s) and contributor(s) and not of MDPI and/or the editor(s). MDPI and/or the editor(s) disclaim responsibility for any injury to people or property resulting from any ideas, methods, instructions or products referred to in the content.

