Abstract
The variability in soil properties and crop yield can be overcome by adoption of smart farming practices through interpolation and mapping of spatial variability patterns. Geospatial technologies can be utilized to determine the cause of spatial variability in fields for site-specific application of fertilizer. This study was designed to quantify and identify the spatial variation in soil properties and wheat (Triticum aestivum L.) yield and to delineate prescription maps for precise application of fertilizer in a semi-arid subtropical region of Pakistan. To examine the variability in soil properties on the production of the considered crop, this study comprised two different fields and each field was divided into (20 × 20 m) grids. The samples of soil were collected at 15 cm and 30 cm soil depths before the fertilization to analyze the different soil characteristics i.e., nitrogen (N), electrical conductivity (EC), potassium (K), soil organic matter (SOM), phosphorus (P), and pH. The boundaries of selected fields and grid points were established with a real-time kinematics-global positioning system (RTK-GPS). The soil data were acquired with a soil proximal sensor at a depth of 7 cm after fertilization. The statistical analysis coefficient of variation (CV), geostatistical-analysis-nugget-to-sill ratio (N:S), and the interpolated maps (ArcGIS pro 2.3) were used to characterize the least to moderate variability of soil parameters and yield, demanding site-specific management of fertilizer application. Cluster analysis was conducted using Minitab 21, which classified soil and yield characteristics into five categories: “very good”, “very low”, “good”, “poor”, and “medium”, with an external heterogeneity and internal homogeneity both more than 60%. Significant relationships (p < 0.05) between soil and crop properties were used to develop the management zones (MZs) for the precise application of fertilizer in wheat fields. Significant differences (p < 0.05) in soil nutrients were found in the very high and very low productivity zones at both sampling times, which suggest delineating the MZs for precise application of fertilizer according to the need of crop and soil properties. The results revealed that the optimum number of MZs for the wheat fields was five and there was heterogeneity in the soil nutrients in five MZs. The findings of this study also highlight the necessity of predicting the crop and soil factors by using precision technologies to develop the prescription maps, because sampling and analysis of soil are expensive and time-consuming. Based on the demand of the soil and crops, site-specific fertilization can increase economic and environmental efficiency.
1. Introduction
The world population is projected to increase by 35% in 2050, which increases food production demand; therefore, sustainable agricultural production systems must be developed to feed the growing population [1]. Wheat (Triticum aestivum L.) is the major crop grown globally and the most consumed staple crop in Pakistan with an annual production of approximately 26 million tons in 2021 [2,3]. Pakistan’s economy strongly depends on the wheat crop as it contributes 9.6% of the value added in agriculture and 1.9% of the gross domestic product (GDP) [4]. However, farmers are still adherent to use traditional farming practices of fertilizer application without considering the soil and crop variability within the field that can reduce crop performance and yield, especially in the arid areas (dry). Fertilizer consumption has been significantly increased in the last few decades in order to increase productivity and meet production goals [5,6]. However, excessive fertilization cannot only increase the cost of farm inputs, but it can also pollute the environment. Fertilizer application rates are dependent on soil condition, field moisture, crop types, and other factors [7]. Soil texture variability plays an important role in controlling within-field moisture variability and nutrients holding capacity especially in the arid regions [8]. Therefore, site-specific crop and soil management plays a crucial role in nutrients use efficiency (NUE), profitability, and environmental protection [9].
In Pakistan, fertilizers are applied uniformly without consideration of the spatial variability in soil properties and crop parameters that could result in yield variation. Therefore, the soil and crop variability issues can be addressed by precise application of fertilizer [10]. However, proper characterization, quantification, identification, and development of the management zones (MZs) for site-specific applications of fertilizers are the basic steps for addressing spatial variability using precision agriculture technologies [11,12,13].
The physicochemical properties of soil have a great effect on plant growth and the variability of yield [14,15]. Nitrogen (N), phosphorus (P), and potassium (K) are three primary macronutrients [16] essential for plant growth. In an arid cropping system, due to unpredictable rainfall, in terms of both amount and intensity, the unavailability of water, excessive use of fertilizer, and soil erosion can decrease the availability of macronutrients in the soil and increase the environmental risks [17]. Soil in Pakistan is unable to support significant levels of productivity due to low organic matter that is essential for water holding capacity and nutrients, and improves soil structure [18,19]. Recently, soil maps have been developed for all the districts of Pakistan that is a feasible strategy for enhancing crop production and improving soil health [20]. The variable-rate (VR) fertilization could control the main factors, which are responsible for this variation [21].
Digital mapping is an easy and practical method to classify the soil parameters into low to high ranges, which can be visualized easily using different color patterns. These soil properties are used to develop the productivity zones for the precise application of fertilizer. Site-specific nutrient management (SSNM) has been developed on the bases of crop and soil properties requirements. SSNM is the main component of PA as it is used to improve NUE, especially in crops such as rice, maize, and wheat. Soil proximal sensors, GIS, remote sensing, simulation models, decision support systems, and machine learning for variable application of nutrients play an important role in SSNM [22]. This is consistent with SSNM, which promotes the 4R’s of nutrient stewardship (Right product, Right time, Right place, and Right rate), as shown in Figure 1. Studies have revealed that 40% of agrochemicals can be saved by correctly distinguishing variability based on the MZs, and by using these MZ zones, 75% of pesticides can also be saved [23,24].
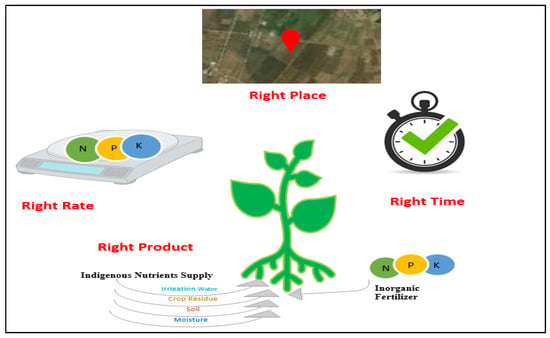
Figure 1.
4Rs Nutrient Stewardship: Promoting the use of fertilizer at the right source, right rate, right place, and the right time.
The fertility of the soil is decreasing due to conventional management and agricultural intensification in the last few decades. Many studies have reported the effects of spatial variation on crop production. However, there is very little work conducted on addressing the issue of spatial variability through management zone delineation especially in wheat crop. It is necessary to provide the right amount of fertilizer according to the need of the crop and it can be applied using prescription maps, which represents the variation within the field. These precision technologies are much needed in developing countries such as Pakistan. However, the spatial variability in soil and crop and its impact on yield need to be studied in arid regions. Therefore, the objective of this research was to characterize, quantify, and identify the spatial variability in soil properties and crop yield and to delineate the MZs for precise application of fertilizer. These developed MZs would help in avoiding the over- and under-application of fertilizer. The crop production will be enhanced in the Potohar region by applying fertilizer according to developed MZs.
2. Materials and Methods
2.1. Study Area
Two wheat (Triticum aestivum L.) fields were selected in (33°11′66″ N, 73°01′11″ E) Koont Research Farm, in PMAS-Arid Agriculture University Rawalpindi, Pakistan. The selected fields with two different varieties of wheat were Field 1—Barani 17 (0.4 ha, 33°6′54″ N, 73°0′50.4″ E) and Field 2—Fakhae e Bhkkar (0.4 ha, 33°6′58″ N, 73°0′59″ E) during the wheat growing season 2021–2022 to assess the variation in crop yield and soil properties (Figure 2). The study area was located in an arid region, which only depends on rainfall as the source for crop water requirement. The wheat has been growing in the selected fields for the past few years. The soils at the selected sites are sandy loam with a low organic matter and the pH ranges between 7.0 and 8.27, which is optimum for maximum crop growth [25]. The field boundaries and grid were demarked by a real-time kinematics global positioning system (RTK-GPS) (SinoG NSS® T30 IMU, ComNav Technology Ltd., Shanghai, China) at each experimental site to collect soil and crop yield samples (Figure 2).
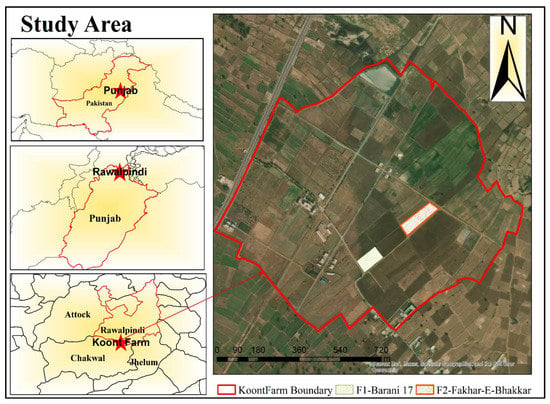
Figure 2.
Layout and sampling points of the selected wheat Fields in URF.
2.2. Sampling and Analysis
The grid pattern (20 m × 20 m) of sampling points was established at the selected fields to collect the soil and yield samples (n = 13 and n = 21 for Field 1 and Field 2 sites, respectively). The samples were collected twice before fertilization (November 2021) at 15 cm and 30 cm depths, and after fertilization (February 2022) at 7 cm depth. The first sampling before fertilization was performed using a hand auger from each georeferenced point and collected soil samples were placed in bags and labeled. The collected samples were first air-dried and then oven-dried for 24 h at 65 °C and sieved through a 2 mm polyethylene sieve to remove large particles. The collected samples were analyzed for Total Nitrogen (TN) [26], available phosphorus (P) [27], available potassium (K) [28], pH [29], EC [30], and soil organic matter [31]. The Hydrometer 152H [32] was used to measure the texture of the soil. Soil texture and pH do not frequently change, so these parameters were measured only once at the initiation of an experiment. However, for 2nd sampling, the proximal sensor was used for the analysis of soil, and it gives the value of pH, N, P, K, EC, humidity, and temperature with great accuracy, quick response speed, and stable output [10,33]. The MZs were developed for the crop’s need after these analyses were used to evaluate the variation in soil characteristics.
2.3. Yield Estimation
The wheat crop was harvested in the last week of April with the help of georeferenced coordinates at each grid by using a hand sickle of a quadrant of 1 m × 1 m. Grains from the debris were separated, including leaves, spikes, and spikelets from each grid, and weighed at the time of harvesting. Yield was obtained from each grid of crop fields and the total average yield was estimated.
2.4. Statistical and Geostatistical Analysis
The normality test was conducted by using the 5% significant level of the Shapiro–Wilk test and non-normal data were normalized by the z-score method. The minimum, maximum, mean, coefficient of variance (CV), standard deviation (SD), and skewness were computed by statistical software (Minitab, LLC 21.1.0) for descriptive statistics. The result of descriptive statistics provided details about the field’s soil variability but did not provide any information about spatial trends or patterns. Wilding et al. [34] classified the variability based on the CV values of soil properties: if CVs were <15%—least variation; from 15 to 35%—moderate variation; >35%—high variation. A semivariogram was used in ArcGIS pro 2.3 to perform geostatistical analysis for the investigation of spatial patterns. The author [35] assessed the variability pattern by using Equation (1) to calculate the semivariograms.
where ϒ (h) denotes the semi-variance at a particular distance h; V (Xi) denotes the variable V value at the Xi location; n (h) is the number of pairs of sample points separated by the lag distance h. The semivariograms were used as indicators in this investigation, and the anisotropy of semivariogram parameters was calculated as described by using semivariogram modeling [36,37]. Therefore, anisotropy models were fitted theoretically by using ArcGIS pro software. The coefficient of (r) between soil parameters and crop yield was determined by using a correlation matrix.
2.5. Spatial Variability Mapping
The variability in the collected soil and crop data was analyzed using the Kriging interpolation technique in the ArcGIS environment. Exponential, Gaussian, linear, spherical, and circular models were used for the identification of the optimum Kriging model used for characterizing and quantifying the soil parameters, and crop yield data, the spatial correlation were represented using the root-mean-square error (RMSE) method [38]. The residual sum of squares (RSS) and coefficient of determination (R2) were used to confirm the best-fitted model according to the soil parameters. The RMSE was calculated using Equation (2).
The prediction of the spatial values in soil properties of an un-sampled location was estimated by Equation (3) [39].
Z(X0) = n∑i = 1 λ i Z (Xi)
The spatial dependency in the soil parameter was defined by the nugget-to-sill ratio (N:S). If the (N:S) < 25%, the parameter was considered strongly spatially dependent; if the (N:S) was between 25 and 75%, the parameter was considered moderately spatially dependent; if the (N:S) was >75%, the variable was considered weakly spatially dependent [40]. The Kriging interpolated maps were produced to allow easier comparison and to observe the pattern of variability in the fields. The collected soil and crop data were arranged into natural clusters/groupings with prior knowledge of productivity potential [18].
The cluster analysis results were displayed using dendrograms, where the hierarchical relationship among the parameters is based on similarity levels and depicts the various groups as well as the differences between them and their nearest neighbors. For the comparison of the mean average of distinct productivity zones, the analysis of variance (ANOVA) statistical method was used to compare the mean with the least significant difference (LSD) at the 5% significance level. The results were used to organize yield data and spatial soil properties into naturally occurring clusters, to minimize the variation within each cluster and maximize the variance between clusters and ultimately developing MZs in ArcGIS pro-2.3.
3. Results and Discussion
3.1. Descriptive Statistics of Soil Properties and Wheat Yield
Results of the Shapiro–Wilk normality test of collected soil properties data for both sampling datasets (before and after fertilization) showed that all the collected parameters were normally distributed (p > 0.05) except EC, SOM, and total N. These parameters can be normalized by z-score, which is the deviation in data points that would lie above or below the mean [41]. The overall variation within the field assessed using the coefficient of variation (CV) [34] and the statistical analysis showed the least to a higher variation in yield and soil properties. The pH of the soil had a low variation (CV < 15%) for both sampling rounds. The SOM, N, and P showed high variations (CV > 35%) at the 30 cm sampling depth, as shown in Table 1, and N showed high variability for Field 2 for 15 cm and 30 cm depths. Mean values of M.C and available forms of N, P, and K values were higher in Field 1 as compared to Field 2 that might be due to the variation in soil properties and crop’s physiological growth parameters amid different varieties of wheat. The total N mean value was higher at 15 cm than 30 cm for both fields. The results of this study are supported by other studies conducted in wheat and wild blueberry cropping systems, where the spatial variation also found moderate to high CVs for these soil properties except pH [35,42], which may be due to the logarithmic nature of pH.

Table 1.
Descriptive Statistics of Soil Properties and Crop Yield for Field 1.
Soil EC at 30 cm depth (before fertilization) and 7 cm depth (after fertilization) showed high variations while, on the other hand, M.C showed moderate variation before and after fertilization. SOM at 15 and 30 cm depths showed moderate variation (Table 2). The EC showed high variation at 15 cm and 7 cm depths before and after fertilization (Table 2). The total N and SOM showed high variations at 30 cm (Table 1). The wheat yield in Table 1 and Table 2 had a CV between 2.4% and 14.2% that showed a weak variation. The average yield was poor in both fields due to the presence of more weeds and dry areas, different varieties of wheat, or less nutrient availability for plant growth and development. The main problem in the arid region is a lack of water availability, and water stress might have reduced the crop yield [43]. This study investigated the spatial variations in soil properties and yields. The M.C showed a similar pattern of change at both stages indicated by their CVs. All the parameters showed positive skewness for all depths except EC and K at 15 cm, pH and K at 30 cm, and N from 7 cm, while P results showed the same level of data skewness at both sampling rounds (Table 1). The EC was highly skewed at 30 cm for Field 2 and pH was highly skewed at 7 cm as depicted in Table 2. The SOM at the sampling depth of 0–30 cm showed a high variation (CV = 53.2%) in Field 1 and Field 2, and P was highly variable (CV = 55.6%) at the 0–30 cm depth. The temporal variation also affected the results, but this research focused on spatial variation in the arid region.

Table 2.
Summary of Statistics of Soil Properties and Crop Yield for Field 2.
3.2. Geostatistical Variation in Soil Properties and Grain Yield
Geostatistical analysis was used to represent the spatial autocorrelation between crop yield and soil properties. The results of geostatistical analysis revealed that the low value of RSS and high value of R2 were used to consider the best models as the literature suggested that the best-fit models for soil properties are exponential, circular, spherical, and Gaussian. The theoretical models for different soil properties and grain yield with the best-fit models were estimated as shown in Figure 3 and Figure 4, while the results are presented in Table 3 and Table 4. The variation in soil properties and yield might occur due to extrinsic and intrinsic sources. The intrinsic variation occurred naturally due to parent material but extrinsically occurred due to different management practices used within the field [44,45].
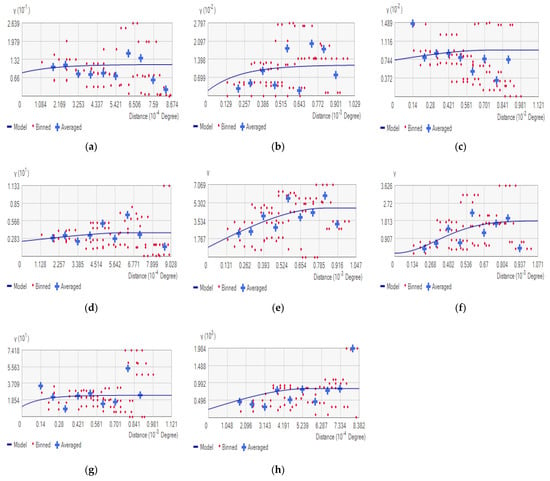
Figure 3.
Best-fit semivariogram models for wheat Field 1 soil properties: (a) pH, (b) EC, (c) SOM, (d) N, (e) phosphorus, (f) potassium, (g) M.C, (h) Yield.
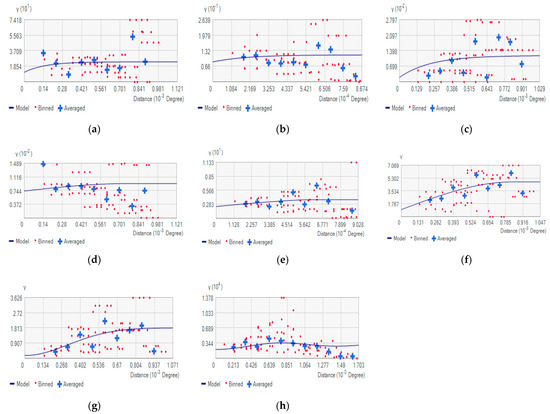
Figure 4.
Best-fit semivariogram models for wheat Field 2 soil properties: (a) pH, (b) EC, (c) SOM, (d) N, (e) phosphorus, (f) potassium (g) M.C, (h) Yield.

Table 3.
Semivariogram Parameters of Soil Properties and Grain Yield for wheat Field 1.

Table 4.
Semivariogram Parameters of Soil Properties and Grain Yield for wheat Field 2.
The geostatistical analysis showed that semivariogram models were exponential, spherical, and Gaussian models for Field 1, and for Field 2, exponential, spherical, linear, and Gaussian were found the best-fit models for their soil properties and yield. The properties of soil were inconsistent because the range of influence was greater than the distance of the grid interval. The results indicate that there were moderate to large variations within the field except pH, EC, and SOM for Field 1 (Table 3), and EC, SOM, and M.C for Field 2 (Table 4). The (N:S) ratio indicated the spatial dependency for the (0–15 cm) depth of soil samples, and that all parameters showed moderate spatial dependence (N:S > 25%) for Field 1 except P, as shown in Table 3. Total N from the first sampling (November 2021) and N from the second sampling (February 2022) exhibited medium spatial dependence, and this variation could be controlled by applying the fertilizer via a variable-rate application. The second sampling showed a moderate spatial dependence within the field as indicated by N: S except for SOM, which indicated a high variability as the N:S ratio was less than 25% and the range of influence was 46.56 m, as indicated in Table 3 for Field 1. The soil properties including EC, SOM, and K had less than 25% N:S, indicating high spatial dependence for Field 2 (Table 4). Total N and M.C both were moderately variable, and pH and P showed a weak dependence indicated by the N: S ratio for Field 2 (Table 4). The same pattern of variation in soil and yield was observed for the 30 cm and 7 cm depths. The yield showed moderate spatial dependence because N:S was greater than 25%, and the yield could be controlled by managing the spatial variation in soil properties.
The variation in soil properties occurred due to applications of fertilizer by the broadcast method. The distance (h) at which the semivariance reached its highest value (sill), which equated to the sample variance, was the semivariograms “range.” The high spatially dependent factors were controlled by intrinsic soil properties and the moderate and low spatial dependences were controlled by extrinsic soil properties. The yield represented high spatial dependency (N:S 29.09%), as depicted in Table 3 for Field 1, and moderate spatial dependency (N:S 65.25%), as shown in Table 4 for Field 2, of the selected area of the experimental site.
The soil variability was the major factor that affected the regional yield variation within the fields and the sampling technique and interpolated maps determined their spatial dependency. The sampling interval should be less than the range of the semivariogram [46] but sampling intervals in this study were more than the semivariogram range. Field 2 showed a large variation and had a low yielding value as compared to Field 1, indicated by their CVs.
3.3. Correlation of Soil Properties and Grain Yield
The significant relation between the grain yield and soil properties of the selected fields is presented in Table 5 and Table 6. The soil properties were significantly correlated with yields except for the soil pH of both fields. The correlation results indicated a linear trend between EC with P, K, and N that indicates that the EC values were influenced by the soil properties. The EC negatively correlated with M.C (r = −0.54) for Field 1, whereas the relationship of EC with M.C was non-significantly correlated for Field 2. There was a positive correlation between EC and yield, which indicates that higher values of EC had high yielding areas and vice versa. Mann et al. [47] investigated that the spatial variation in soil physiochemical properties affects the citrus yield and the finding of this research article agrees of this study.

Table 5.
Correlation Matrix among the Soil Properties (0–15 cm) and Grain Yield for Field 1.

Table 6.
Correlation Matrix among the Soil Properties (0–15 cm) and Grain Yield for Field 2.
The yield was significantly related to EC (r = 0.39 to 0.47), N (r = 0.68 to 0.78), P (r = 0.74 to 0.81), K (r = 0.58 to 0.68), Total N (r = 0.41 to 0.49), and M.C (r ~0.30–0.31) for both fields. The relationship indicated that the yield of crop depends on the abovementioned soil parameters. The pH had a non-significant relation with other soil properties for Field 2 and pH had a positive correlation with N in Field 1. However, the correlations of soil parameters revealed that N, P, and K could be used to evaluate the soil’s fertility status, perceive how they affect yield, and improve both productive and unproductive areas within the field. Based on the variations in soil parameters that could be quantified, identified anddelineated the prescription maps for variable-rate fertilizer application, which will improve farm profitability and lower environmental contamination. The correlation matrix results indicated that soil properties are one of the main components that limits the yield, while many other factors also affect the yield; for example, climate change and damage from disease and insects are two clear instances that are not discussed in this research. Crop yield can also be negatively impacted by weed competition and bare spots in wheat fields, seasonal variability, winter kill, and water scarcity.
The interpolated maps were generated using Kriging interpolation techniques in Arc GIS pro 2.3 software as the literature suggested that the Kriging interpolation is more accurate than inverse distance weighting (IDW) due to the nature of soil sampling variations within the field and its application for the generation of prescription maps [48]. The interpolated maps showed a variation with significantly different values across the field. The N, P, and K maps for Field 1 (Figure 5a–c) showed almost similar variation patterns with high values in the northwest region, lower values in the southern region, and medium values in the center of the field. The M.C, pH, EC, SOM, Total N, P, and K maps indicated the large spatial variability within Field 1 (Figure 5). The semivariogram results of these soil properties showed the large spatial dependency on other soil properties (Table 3). The matrix of correlation among these soil properties also explained the similar pattern of variations within the field (Table 5). The EC and total N showed high values in the southeast region. The interpolated maps of pH revealed less variation as compared to the other soil properties. The low values of pH were observed in the western part of the field, higher values were observed in the southwest region, and medium values were observed in the center of the field. The pH map showed that most of the wheat crop had a pH ranging from 7.3 to 7.36 (Figure 5d). A similar pattern of variation was observed for 30 cm and 7 cm depths. The statistics, geostatistical analysis, correlation matrix (Figure 5, Table 1 and Table 3), and the interpolated maps of soil attributes and yield all demonstrated that there is spatial variability in the selected fields.
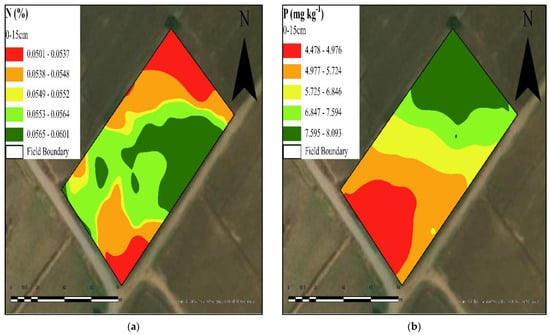
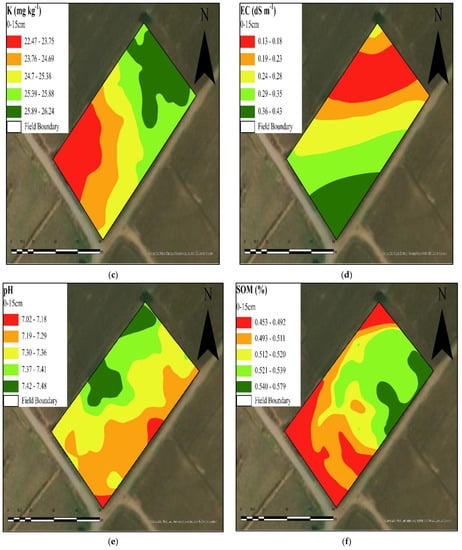
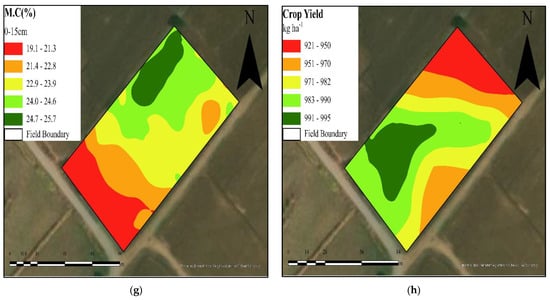
Figure 5.
Krigged maps of soil properties for Wheat Field 1. (a) N, (b) P, (c) K, (d) EC, (e) pH, (f) SOM (g) M.C, (h) Yield.
The soil properties and grain yield Krigged maps as shown in Figure 6 suggested substantial variability within Field 2. The spatial patterns of variation showed higher values in the north-central and north regions and moderate values in the southeastern region of the field, except N, which showed a high value on the south side. The low values were in the center of the field and some were in the south region side. A map of the soil pH shown in Figure 5d showed the substantial variability across the field, and grain yield showed its lower values on the north side. Most Field 2 sites had a pH ranging from 7.09 to 7.41.
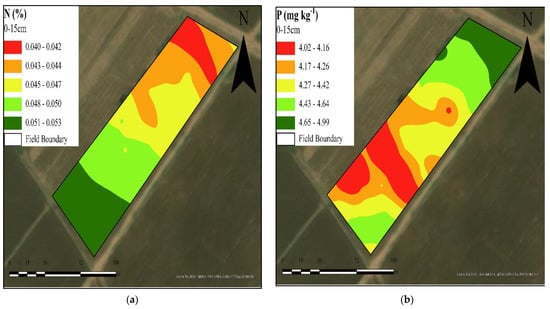
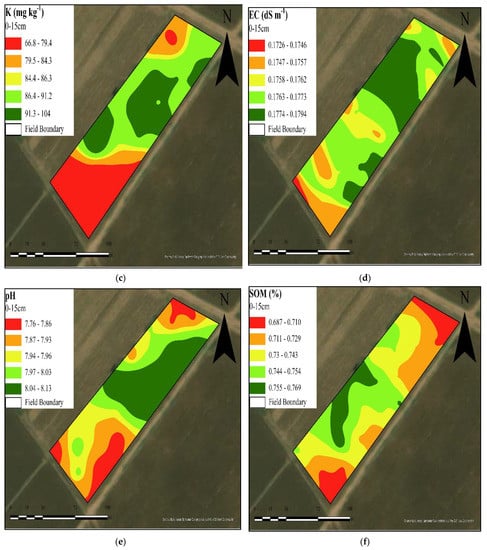
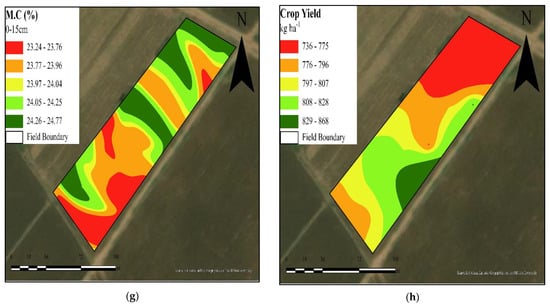
Figure 6.
Krigged maps of soil properties for Wheat Field 2. (a) N, (b) P, (c) K, (d) EC, (e) pH (f) SOM (g) M.C, (h) Yield.
The Krigged maps of the yield indicated substantial variation across the field (Figure 5h and Figure 6h). The low-yielding areas were on the north side, as shown in Figure 5h, and high-yielding areas were on the south side of Field 1. The high-yielding areas were in the southeast, and medium-yielding areas were in the center of Field 2. The fields inspection revealed that the low yielding was due to weeds, grass, and shortage of M.C. According to CVs, the combined findings of traditional statistics suggested that there was a moderate to high degree of variation in soil characteristics and crop yield. Except for soil pH, the geostatistical analysis also showed moderate to high spatial dependence in soil characteristics and crop production, which varied significantly within the fields. The findings of the descriptive and geostatistical analyses were consistent with the maps of soil characteristics and grain yield, indicating significant variance within the field. The significant relationships between the variables M.C., EC, SOM, Total N, N, P, and K, and grain production agreed with the relationships illustrated on the maps.
3.4. Cluster Analysis and Delineation of MZs for Wheat Crop
The interpolated maps showed large variations in soil properties and crop yield in the selected fields of wheat that requires site-specific nutrient management. The cluster analysis (Figure 7) was used to develop MZs (Figure 8) that reflect areas of very good, good, medium, low, and very low productivity. The results of clustered analysis grouped the soil properties and yield into the same class on the basis of similarity level. The dendrograms were created by performing observation cluster analysis on the field’s natural productive potentials. The soil properties and crop yield data were categorized into five classes based on their degree of similarity (Figure 6). Crop yield data were used to determine productivity levels for management zones, which included very good yield (>990 kg ha−1), good yield (983 to 990 kg ha−1), medium yield (971 to 982 kg ha−1), low yield (951 to 970 kg ha−1), and very low yield (<970 kg ha−1). Crop yield had substantial relationships with soil parameters, which was supported by these developed zones. Most of the wheat crop yield fell in each productivity potential evenly, according to the grouping of the developed management zones (Figure 7), with a few data points falling in medium-productivity zones indicating average yielding areas.
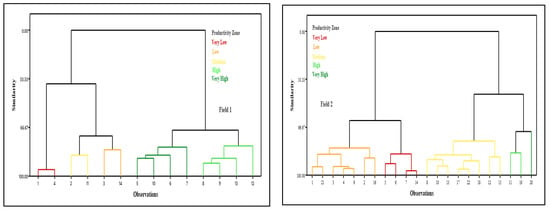
Figure 7.
Dendrogram of soil properties and Wheat yield for both Fields.
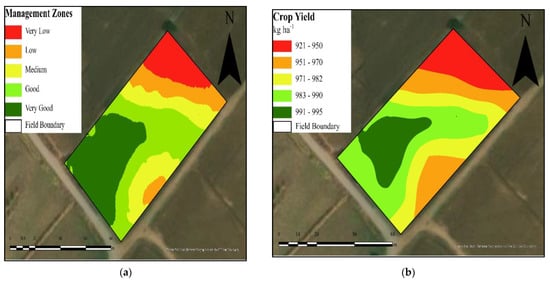
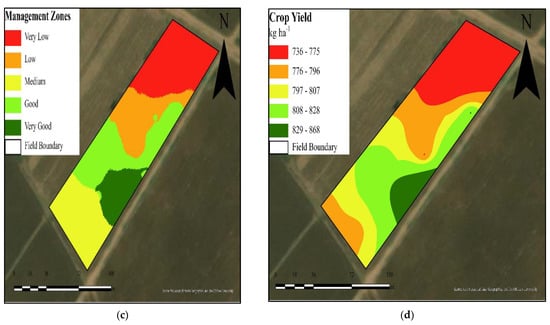
Figure 8.
Comparison of delineated productivity zones for Field 1: (a) Management Zones and (b) Crop Yield; for Field 2: (c) Management Zones and (d) Crop Yield.
The clustered observations in each group had internal homogeneity and external heterogeneity at a similarity level of more than 60%. The analysis was used to describe the difference between the developed MZs, which defined the status of soil properties in the selected fields. Soil properties and yield were higher in the very good zone, moderate levels in the medium zones, and low in the poor zones.
The wheat production might be low due to the insufficient application of fertilizer. The grasses and weeds in low-lying locations may worsen the water quality and also encouraged the weed development. These weeds limit the nutrients availability to the wheat crop, which will ultimately diminish output and raise production costs [49]. The yield, soil properties, and topographic features data were used to delineate MZs, and these developed MZs depend on spatial information that is stable or predictable over time and is related to crop yield [50].
The cluster analysis results were imported into ArcGIS software for the delineation of MZs (Figure 7). The means comparison in prescribed zones (Figure 8) for both fields of wheat based on soil properties and crop yield revealed that the highest yield and nutrient value was in the good zone and the lowest levels were in the low-productivity zones (Table 7 and Table 8). The rate of application will be modified as per developed management zones, and in this way, an excess amount of fertilizer will be saved. The cluster analysis, mean comparison, and interpolated maps of soil and yield revealed that there is a need of development of these prescription maps. These findings also suggested that these developed MZs could be used for the variable rate of fertilizer application.

Table 7.
Comparison of mean crop yield and soil properties for management zone of Field 1.

Table 8.
Comparison of mean crop yield and soil properties for management zone of the Field 2.
The statistical and geostatistical results revealed the existence of variability in the selected fields and, with the help of interpolated maps, the pattern was identified. A moderate to high variation was shown with the help of all statistical results. The ANOVA and mean comparison were used to develop the zones. The MZs could be used to implement site-specific nutrient management with the help of a variable spreader, thus helping improve crop yield, reduce the cost of farms, and save the environment.
4. Conclusions
The focus of this research was to characterize and quantify the variations among the soil properties and crop yield in the selected fields of wheat that can be the basis of delineating the MZs for VR fertilizer application in arid regions. The statistical results indicated that (CV > 15%) medium to high variability exists in selected fields of wheat, which required site-specific fertilization application to improve productivity. Moreover, the analysis of geostatistical indicated (N:S < 25%) that large spatial dependency and the soil sampling grid selection should be based on the sampling interval suggested by the semivariogram range of the easily measured soil properties. Results of geostatistical showed that the 15 to 20 m grid size would provide reliable predictions suggested by the range of influence. The interpolated maps of soil properties and wheat grain yield were used to understand the fertility status in the monitoring fields. The correlation matrix results showed a significant relation (p < 0.05) between M.C, EC, SOM, N, P, K, and crop yield. The characterization and quantification of variations in soil properties would help us in the future for planning soil sampling in the fields that have soil and crop variability. Hence, the identification of factors that are responsible for a lower yield in certain areas may increase our understanding of soil properties relationships with crop yield. Based on the results, the selected fields were grouped into five different classes on the basis of internal homogeneity and external heterogeneity >60%. The development of MZs provided the pattern to group and manage the spatial variability in the selected fields of wheat, and the results showed that soil N, P, K, and EC were influential factors to develop MZs in wheat yield. The soil properties can be easily measured by a proximal sensor such as N, P, and K for VR fertilization application, and this would help to avoid the over and under-application of fertilizers to improve the productivity of crop and reduce environmental risks in wheat fields. In future studies, it would be good to link these variations among different soil and crop properties with climate change and develop the MZs according to the requirement. A web-based application can be developed to automatically delineate the MZs in the arid regions for site-specific nutrient management.
Author Contributions
Conceptualization, M.J.M.C.; methodology, Z.H.; software, M.J.M.C.; validation, Z.H. and S.S. formal analysis, Z.H.; investigation, S.S., M.A. and S.H.; resources, M.N.T. and M.J.M.C.; data curation, Z.H. and F.K.; writing—original draft preparation, Z.H. and S.S., writing—review and editing, S.S., S.H., U.Z. and Z.H.; visualization, M.N.A. and S.S.; supervision, S.S., M.N.A. and M.J.M.C.; project administration, funding acquisition, M.J.M.C. All authors have read and agreed to the published version of the manuscript.
Funding
The study is part of a pilot project for the Data-Driven Smart Decision Platform for Increased Agriculture Productivity (DDSDP) PSDP-funded project No. 332.
Institutional Review Board Statement
Not applicable.
Informed Consent Statement
Not applicable.
Data Availability Statement
The data can be available on request.
Acknowledgments
The authors would like to thank the Faculty of Agricultural Engineering and Technology, PMAS-Arid Agriculture University Rawalpindi, Pakistan, and the DDSDP project team for providing facilities.
Conflicts of Interest
The authors declare no conflict of interest.
References
- Van Wart, J.; Kersebaum, K.C.; Peng, S.; Milner, M.; Cassman, K.G. Estimating crop yield potential at regional to national scales. Field Crop. Res. 2013, 143, 34–43. [Google Scholar] [CrossRef]
- Van Frank, G.; Rivière, P.; Pin, S.; Baltassat, R.; Berthellot, J.F.; Caizergues, F.; Goldringer, I. Genetic diversity and stability of performance of wheat population varieties developed by participatory breeding. Sustainability 2020, 12, 384. [Google Scholar] [CrossRef]
- Shaheen, S.; Almas, L.K.; Usman, M. Wheat Consumption Determinants and Food Security Challenges: Evidence from Pakistan. WSEAS Trans. Environ. Dev. 2022, 18, 427–441. [Google Scholar] [CrossRef]
- Mahpara, S.; Bashir, M.S.; Ullah, R.; Bilal, M.; Kausar, S.; Latif, M.I.; Alfagham, A. Field screening of diverse wheat germplasm for determining their adaptability to semi-arid climatic conditions. PLoS ONE 2022, 17, e0265344. [Google Scholar] [CrossRef] [PubMed]
- Grzebisz, W.; Gaj, R.; Sassenrath, G.F.; Halloran, J.M. Fertilizer use and wheat yield in Central and Eastern European countries from 1986 to 2005 and its implication for developing sustainable fertilizer management practices. Commun. Soil Sci. Plant Anal. 2012, 43, 2358–2375. [Google Scholar] [CrossRef]
- Stewart, W.M.; Roberts, T.L. Food security and the role of fertilizer in supporting it. Procedia Eng. 2012, 46, 76–82. [Google Scholar] [CrossRef]
- Burnett, A.L.; Chang, A.G.; Crone, J.K.; Huang, P.L.; Sezen, S.F. Noncholinergic penile erection in mice lacking the gene for endothelial nitric oxide synthase. J. Androl. 2002, 23, 92–97. [Google Scholar] [CrossRef]
- Rudolph, S.; Van der Kruk, J.; Von Hebel, C.; Ali, M.; Herbst, M.; Montzka, C.; Weihermüller, L. Linking satellite derived LAI patterns with subsoil heterogeneity using large-scale ground-based electromagnetic induction measurements. Geoderma 2015, 241, 262–271. [Google Scholar] [CrossRef]
- Srinivasan, R.; Shashikumar, B.N.; Singh, S.K. Mapping of soil nutrient variability and delineating site-specific management zones using fuzzy clustering analysis in eastern coastal region, India. J. Indian Soc. Remote Sens. 2022, 50, 533–547. [Google Scholar] [CrossRef]
- Khan, H.; Farooque, A.A.; Acharya, B.; Abbas, F.; Esau, T.J.; Zaman, Q.U. Delineation of Management Zones for Site-Specific Information about Soil Fertility Characteristics through Proximal Sensing of Potato Fields. Agronomy 2020, 10, 1854. [Google Scholar] [CrossRef]
- Diacono, M.; Rubino, P.; Montemurro, F. Precision nitrogen management of wheat. A review. Agron. Sustain. Dev. 2013, 33, 219–241. [Google Scholar] [CrossRef]
- He, P.; Yang, L.; Xu, X.; Zhao, S.; Chen, F.; Li, S.; Johnston, A.M. Temporal and spatial variation of soil available potassium in China (1990–2012). Field Crop. Res. 2015, 173, 49–56. [Google Scholar] [CrossRef]
- Simmonds, M.B.; Plant, R.E.; Pena-Barragán, J.M.; van Kessel, C.; Hill, J.; Linquist, B.A. Underlying causes of yield spatial variability and potential for precision management in rice systems. Precis. Agric. 2013, 14, 512–540. [Google Scholar] [CrossRef]
- Bharteey, P.K.; Deka, B.; Dutta, M.; Parit, R.K.; Maurya, P.K. Remote sensing application in precision agriculture: A review. Remote Sens. 2019, 6, 233–241. [Google Scholar]
- Jin, J.; Jiang, C. Spatial variability of soil nutrients and site-specific nutrient management in the PR China. Comput. Electron. Agric. 2002, 36, 165–172. [Google Scholar] [CrossRef]
- Lipczynska-Kochany, E. Effect of climate change on humic substances and associated impacts on the quality of surface water and groundwater: A review. Sci. Total Environ. 2018, 640, 1548–1565. [Google Scholar] [CrossRef]
- Jat, R.A.; Wani, S.P.; Sahrawat, K.L. Conservation agriculture in the semi-arid tropics: Prospects and problems. Adv. Agron. 2012, 117, 191–273. [Google Scholar]
- Fridgen, J.J.; Kitchen, N.R.; Sudduth, K.A.; Drummond, S.T.; Wiebold, W.J.; Fraisse, C.W. Management zone analyst (MZA) software for subField management zone delineation. Agron. J. 2004, 96, 100–108. [Google Scholar]
- OldField, E.E.; Wood, S.A.; Bradford, M.A. Direct effects of soil organic matter on productivity mirror those observed with organic amendments. Plant Soil 2018, 423, 363–373. [Google Scholar] [CrossRef]
- Rehman, A.; Jingdong, L.; Shahzad, B.; Chandio, A.A.; Hussain, I.; Nabi, G.; Iqbal, M.S. Economic perspectives of major Field crops of Pakistan: An empirical study. Pac. Sci. Rev. B Humanit. Soc. Sci. 2015, 1, 145–158. [Google Scholar] [CrossRef]
- Iticha, B.; Takele, C. Digital soil mapping for site-specific management of soils. Geoderma 2019, 351, 85–91. [Google Scholar] [CrossRef]
- Sarkar, D.; Meena, V.S.; Haldar, A.; Rakshit, A. Site-specific nutrient management (SSNM): A unique approach towards maintaining soil health. In Adaptive Soil Management: From Theory to Practices; Springer: Singapore, 2017; pp. 69–88. [Google Scholar]
- Farooque, A.A.; Zaman, Q.U.; Schumann, A.W.; Madani, A.; Percival, D.C. Response of wild blueberry yield to spatial variability of soil properties. Soil Sci. 2012, 177, 56–68. [Google Scholar] [CrossRef]
- Haroon, Z.; Cheema, M.J.M.; Saleem, S.; Anjum, M.N.; Amin, M.; Tahir, M.N.; Khan, F. Development of Management Zones for Site-Specific Fertilization in Mustard fields. Environ. Sci. Proc. 2022, 23, 1. [Google Scholar]
- Ullah, M.A.; Afzal, M.U.; Siddique, M.T.; Saleem, M.Z. Soil Fertility Status of Research Farm Koont fields, Rawalpindi, Punjab. Int. J. Res. Agric. Food Sci. 2019, 5, 17–21. [Google Scholar]
- Vendrell, P.F.; Zupancic, J. Determination of soil nitrate by transnitration of salicylic acid. Commun. Soil Sci. Plant Anal. 1990, 21, 1705–1713. [Google Scholar] [CrossRef]
- Olsen, S.R. Phosphorus. Methods Soil Anal. 1982, 2, 403–430. [Google Scholar]
- Mc Lean, E.O.; Watson, M.E. Soil measurements of plant-available potassium. In Potassium in Agriculture; Munson, R.D., Ed.; ASA, CSSA, SSSA: Madison, WI, USA, 1985; pp. 277–308. [Google Scholar]
- McLean, E.O. Soil pH and lime requirement. Methods Soil Anal. Part 2 Chem. Microbiol. Prop. 2015, 9, 199–224. [Google Scholar]
- Smith, J.L.; Doran, J.W. Measurement and use of pH and electrical conductivity for soil quality analysis. Methods Assess. Soil Qual. 1997, 49, 169–185. [Google Scholar]
- Storer, D.A. A simple high sample volume ashing procedure for determination of soil organic matter. Commun. Soil Sci. Plant Anal. 1984, 15, 759–772. [Google Scholar] [CrossRef]
- Ashworth, J.; Keyes, D.; Kirk, R.; Lessard, R. Standard procedure in the hydrometer method for particle size analysis. Commun. Soil Sci. Plant Anal. 2001, 32, 633–642. [Google Scholar] [CrossRef]
- Padilla, F.M.; Gallardo, M.; Peña-Fleitas, M.T.; De Souza, R.; Thompson, R.B. Proximal optical sensors for nitrogen management of vegeTable crops: A review. Sensors 2018, 18, 2083. [Google Scholar] [CrossRef]
- Wilding, L.P. Spatial variability: Its documentation, accomodation and implication to soil surveys. In Proceedings of the Soil Spatial Variability, Workshop of the ISSS and the SSA, Las Vegas, NV, USA, 30 November–1 December 1985; pp. 166–194. [Google Scholar]
- Ameer, S.; Cheema, M.J.M.; Khan, M.A.; Amjad, M.; Noor, M.; Wei, L. Delineation of nutrient management zones for precise fertilizer management in wheat crop using geo-statistical techniques. Soil Use Manag. 2022, 38, 1430–1445. [Google Scholar] [CrossRef]
- Bogunovic, I.; Mesic, M.; Zgorelec, Z.; Jurisic, A.; Bilandzija, D. Spatial variation of soil nutrients on sandy-loam soil. Soil Tillage Res. 2014, 144, 174–183. [Google Scholar] [CrossRef]
- Vasu, D.; Singh, S.K.; Sahu, N.; Tiwary, P.; Chandran, P.; Duraisami, V.P.; Kalaiselvi, B. Assessment of spatial variability of soil properties using geospatial techniques for farm level nutrient management. Soil Tillage Res. 2017, 169, 25–34. [Google Scholar] [CrossRef]
- Asa, E.; Saafi, M.; Membah, J.; Billa, A. Comparison of linear and nonlinear kriging methods for characterization and interpolation of soil data. J. Comput. Civ. Eng. 2012, 26, 11–18. [Google Scholar] [CrossRef]
- Chiles, J.P.; Delfiner, P. Geostatistics: Modeling Spatial Uncertainty; John Wiley & Sons: Hoboken, NJ, USA, 2009; Volume 497. [Google Scholar]
- Moharana, P.C.; Jena, R.K.; Pradhan, U.K.; Nogiya, M.; Tailor, B.L.; Singh, R.S.; Singh, S.K. Geostatistical and fuzzy clustering approach for delineation of site-specific management zones and yield-limiting factors in irrigated hot arid environment of India. Precis. Agric. 2020, 21, 426–448. [Google Scholar] [CrossRef]
- Paccioretti, P.; Córdoba, M.; Balzarini, M. FastMapping: Software to create field maps and identify management zones in precision agriculture. Comput. Electron. Agric. 2020, 175, 105556. [Google Scholar] [CrossRef]
- Farooque, A.A.; Zaman, Q.U.; Schumann, A.W.; Madani, A.; Percival, D.C. Delineating management zones for site specific fertilization in wild blueberry fields. Appl. Eng. Agric. 2012, 28, 57–70. [Google Scholar] [CrossRef]
- Zhao, W.; Liu, L.; Shen, Q.; Yang, J.; Han, X.; Tian, F.; Wu, J. Effects of water stress on photosynthesis, yield, and water use efficiency in winter wheat. Water 2020, 12, 2127. [Google Scholar] [CrossRef]
- Deb, S.K.; Shukla, M.K. Variability of hydraulic conductivity due to multiple factors. Am. J. Environ. Sci. 2012, 8, 489. [Google Scholar] [CrossRef]
- Oumenskou, H.; El Baghdadi, M.; Barakat, A.; Aquit, M.; Ennaji, W.; Karroum, L.A.; Aadraoui, M. Multivariate statistical analysis for spatial evaluation of physicochemical properties of agricultural soils from Beni-Amir irrigated perimeter, Tadla plain, Morocco. Geol. Ecol. Landsc. 2019, 3, 83–94. [Google Scholar] [CrossRef]
- Kerry, R.; Oliver, M.A. Average variograms to guide soil sampling. Int. J. Appl. Earth Obs. Geoinf. 2004, 5, 307–325. [Google Scholar] [CrossRef]
- Mann, K.K.; Schumann, A.W.; Obreza, T.A. Delineating productivity zones in a citrus grove using citrus production, tree growth and temporally sTable soil data. Precis. Agric. 2011, 12, 457–472. [Google Scholar] [CrossRef]
- Sekulić, A.; Kilibarda, M.; Heuvelink, G.; Nikolić, M.; Bajat, B. Random forest spatial interpolation. Remote Sens. 2020, 12, 1687. [Google Scholar] [CrossRef]
- Roberts, T.L.; Slaton, N.A. Wheat fertilization and liming practices. In Arkansas Wheat Production Handbook; MP 197; University of Arkansas System, Cooperative Extension Service: Little Rock, AR, USA, 2014; pp. 1–20. [Google Scholar]
- Córdoba, M.A.; Bruno, C.I.; Costa, J.L.; Peralta, N.R.; Balzarini, M.G. Protocol for multivariate homogeneous zone delineation in precision agriculture. Biosyst. Eng. 2016, 143, 95–107. [Google Scholar] [CrossRef]
Disclaimer/Publisher’s Note: The statements, opinions and data contained in all publications are solely those of the individual author(s) and contributor(s) and not of MDPI and/or the editor(s). MDPI and/or the editor(s) disclaim responsibility for any injury to people or property resulting from any ideas, methods, instructions or products referred to in the content. |
© 2023 by the authors. Licensee MDPI, Basel, Switzerland. This article is an open access article distributed under the terms and conditions of the Creative Commons Attribution (CC BY) license (https://creativecommons.org/licenses/by/4.0/).