Abstract
Broad-base agricultural terraces can be difficult to delineate in flat landscapes, particularly when covered by crops, due to subtle changes in elevation over relatively wide distances. In northeastern Oklahoma, these terraces are usually less than half a meter high and 15 to 20 m wide. The objective of this research was to develop and test a technique for identifying and classifying terraces using computer vision applied to terrain derivatives calculated from digital elevation models at five sites. We tested 38 terrain-derivative grid combinations or sets that represented 19 terrain characteristics, calculated from elevation models after two Gaussian smoothing strategies to provide some degree of generalization and a removal of excess noise. The best subsets achieved a 98% classification accuracy (kappa 0.96) and consisted of derivatives representing hydrology, morphometry, and visibility categories. Inaccuracies occurred primarily at the edges of some of the study sites, where agricultural fields bordered incised drainage areas where changes in elevation were similar to those for the terraces. Further study will elucidate the relationships between terrace “borrow” and “deposition” areas in the terrace areas and their relationships to yield and salinity issues. This work seeks to automate terrace identification for digital soil mapping on terraced fields for the improved delivery of soil information for resource conservation and land use.
1. Introduction
Agricultural terraces are landscape features built to conserve soil and water that are usually designed to increase arable land surface area when slopes are a limiting factor [1]. They are effective in producing positive benefits including reducing surface erosion by slowing the speed of runoff and sediments, increasing groundwater infiltration through the obstruction of overland flow paths, reducing flood hazards, and decreasing the risk of gully erosion and ravine formation by lowering the kinetic energy of water as it moves over the surface [2]. Not all terraces are built the same way or with the same purpose and the term “terrace” refers to a range of structures that can address different problems [3].
Terraces built in Ottawa County in northeast Oklahoma are somewhat unusual because the landscapes in which they occur are predominantly flat, rather than sloping. The typical need for terracing to increase arable land area on otherwise highly sloping hillsides, for instance, does not apply. Terraces in this region can be characterized as contour or parallel terraces, rather than the bench terraces more commonly found in steep areas, and are sometimes called broad-base terraces [4,5]. As with other terrace types, they are designed to disrupt natural overland flow to conserve water by reducing slope length and intercept runoff, thereby conserving soil and water throughout a growing season that often has periods when evapotranspiration exceeds rainfall [4,5,6]. Because of the relatively flat landscape in which these terraces occur, the height needed to provide a disruption of overland flow is much less than terraces typical in more sloping areas.
Partly because of their low profile, the broad-base terraces in Ottawa County, Oklahoma, are subtle and sometimes difficult to identify. They feature no retaining walls and are constructed of adjacent soil mounded in an elongated ridge shape. In many cases, they follow the contour lines of the slopes, though the slopes are nearly flat (less than 1 percent). Terraces may be difficult to identify across the landscape as they may be covered by crops, have relatively low elevation differences from the surrounding landscape, and have a broad and low relief.
Some authors have applied edge detection and image analysis to identify terraces using digital elevation models (DEM) and land reflectance imagery [7]. However, these methods were developed in areas with sloping landscapes and terraces built with treads and risers and do not function adequately in the flat landscapes with broad-base terraces as found in NE Oklahoma. In this study, we attempted to use computer vision applied to terrain derivatives extracted from DEMs to increase our understanding of the spatial locations and patterns of terraces in several study areas.
Terrain derivatives are mathematically derived raster or gridded objects calculated from DEMs through the application of algorithms [8,9]. Terrain derivatives highlight aspects of relative changes in elevation. Perhaps the most familiar terrain derivative is slope, which is a first derivative and quantifies the rate of change in elevation over distance [9]. It can be calculated for every grid cell or pixel in an elevation model based on the cell’s relationship to neighboring cells. Curvature, another example of a terrain derivative, is the rate of change in the tangent vector over a curved surface, moved for some distance [8]. Many terrain derivatives have been developed and tested to describe and quantify features of landscapes [9]. These include line-of-site of neighborhood algorithms, solar radiance and incidence simulations, hydrologic simulations, local morphometry, and others [9,10].
The purpose of the current study is to develop a technique using high-resolution DEMs to delineate terraces in flat landscapes so they can be efficiently identified. Automatically delineating terraces will facilitate the study of their influence on agricultural productivity and soil and water conservation. We sought to automate terrace identification through the supervised classification of terrain derivatives calculated from a DEM. We attempted to classify and delineate terraces throughout the Ottawa County farm field areas through the segmentation of elevation models of the area into terrace space and non-terrace space using neural networks and random forest algorithms in a supervised classification approach applied to terrain derivatives. The algorithms were trained with known terrace areas and verified using known terrace and non-terrace areas in similar fields. Terrain derivatives were then assessed and ranked according to their usefulness in the classification algorithms for the study sites. The goal was to develop a technique for identifying terraces in predominantly flat landscapes that can be transferred to any agricultural site for quick terrace delineation, for applications such as the assessment of conservation best management practices, terrace maintenance, and yield monitoring. The hypothesis was that artificial intelligence (AI) computer vision applied to digital elevation derivatives can delineate terrace features that are otherwise difficult to find and laborious to delineate by hand. To our knowledge, no one has attempted to use computer vision techniques applied to terrain derivatives to delineate terraces in flat landscapes.
2. Materials and Methods
2.1. Study Sites
The study sites are in northeast Oklahoma (centered at approximately 36.95 latitude, −94.79 longitude) (Figure 1). The climate is humid subtropical with a mean annual precipitation of around 1150 mm and a mean annual temperature of 14.6 °C. The major land use of the area is the production of hay and grain crops, with soybeans and corn dominating.
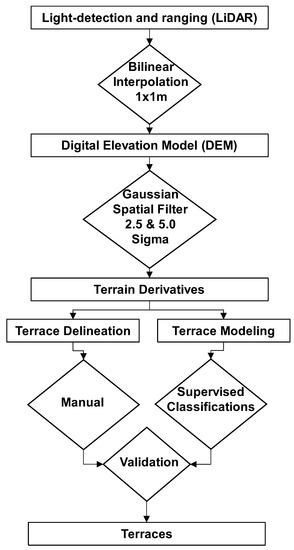
Figure 1.
A schematic diagram for the analysis and production of terrace location classifications used in the paper.
2.2. Data Sources and Processing
We obtained a 1 m resolution digital elevation model made with laser altimetry for five agricultural research sites in northeast Oklahoma from the United States Geological Survey 3DEP program [11]. Data were acquired between 23 October and 8 November 2018, during leaf-off conditions using a light-detection and ranging (LiDAR) AP60 220-channel dual-frequency global navigation satellite system (GNSS) receiver mounted on a Cessna 401 aircraft [11]. The nominal pulse spacing for acquisition was 0.7 m and the fundamental vertical accuracy was tested at 8 cm. LiDAR, or air-borne laser altimetry bare-earth returns, were converted to 1 m digital elevation model (DEM) grids through bilinear interpolation [12]. The DEM is freely available to the public through the USGS website [11].
Elevation model preparation and terrain derivatives were calculated with SAGA–GIS software (v. 8.0.1). Prior to terrain analysis the elevation model was filtered with Gaussian low-frequency spatial filtration to remove noise, excessive surface detail, and any spurious values through averaging. The filtration was undertaken at 2.5 sigma and 5.0 sigma to represent minimal or mild smoothing and strong smoothing, respectively. Sigma is expressed in meters and represents the standard deviation of the imposed Gaussian curve for calculating the mean of the central pixel. Low-frequency spatial filtering was chosen to minimize high-frequency noise in the original DEM and has been shown to improve relationships between terrain derivatives and ground truth [8,9,13,14]. The elevation models to be used for calculating terrain derivatives related to hydrologic simulations were further processed to remove spurious pits and peaks [15]. The terrain derivatives that were tested for their usefulness for identifying agricultural terraces in flat landscapes are indicated in Table 1. Each terrain derivative was evaluated twice, once on the mild smoothing DEM (2.5 sigma) and once on the strong smoothing DEM (5.0 sigma) (Figure 1).

Table 1.
The terrain derivatives calculated from the digital elevation model and used to classify the terraces.
To test the effectiveness of the terrain derivatives for classification, subset areas of the known terraces were identified in the field and delineated by hand in SAGA–GIS after on-site investigation and corroboration between imagery, measurements, and elevation models. One hundred and twenty five digital polygons were hand-drawn to indicate portions of known and visited terrace areas and non-terrace areas in the five test sites. Terraces included disturbed land both upslope and downslope of the terrace, including “borrow” areas from which soil was taken in the construction process, and “deposition” areas where soil was mounded. Land uses other than agriculture, such as riparian zones, constructed areas, and strip mines adjacent to the sites did not influence the classifications within the agricultural areas and were ignored. Half of the 125 hand-delineated polygons were assigned to a training group and half were assigned to a validation group using a random number selection criterion. The training group was used to train the image classification algorithms and the validation group was used to assess the success of the classification algorithms and the usefulness of the terrain derivatives.
2.3. Terrace Modeling
In the first iteration of the classification task, a full suite of terrain derivatives was used to train the random forest classifier using the program ViGRA (Computer Vision Library Version 1.11.1) [18,27] within the SAGA-GIS environment. Random forest is a non-parametric, machine learning approach where ensembles of classification decision trees are optimized to make the final prediction model [28]. Thirty-eight iterations or sets of terrain derivative combinations, including each of the 19 derivatives from Table 1, were calculated using the two elevation models after the Gaussian filtration levels were applied. Permutation-based feature importance scores were assigned by the program to each terrain derivative for each of the 28 iterations (model runs). Permutation-based feature importance is a measure of how much the removal of any given feature influences model performance and is used in feature selection to find the most important subsets of variables [29,30]. RF models were run with the terrain derivatives with the best importance score, that is, the derivatives with the highest permutation importance values. In each iteration, the derivatives from the previous run with the lowest permutation importance scores were removed. The following numbers of terrain derivatives were used successively: 38 (full model), 32, 27, 22, 17, 12, 10, 8, 6, 5, 4, 3, 2, and 1.
2.4. Model Evaluation
Each model run was assessed using a confusion matrix approach, whereby the validation set of terraces and non-terrace areas were used as ground truth to determine the number of image pixels correctly and incorrectly classified by the random forest model. The optimum number and type of terrain derivatives were determined to maximize the kappa score and the overall accuracy of prediction [31]. The kappa score reflects the accuracy of categorization while accounting for the accuracy expected by random chance selection [31].
Other supervised classification methods were then tested with the top-performing suite of terrain derivatives. The tested classification methods were artificial neural networks, boosting, k-nearest neighbors, decision tree, normal Bayes, and support vector machines. These algorithms were run in the OpenCV library within SAGA-GIS [18,27]. Their accuracy was assessed in the same way as the random forest algorithm, with kappa and overall accuracy.
3. Results
3.1. Terrace Characteristics
At the five research sites, the average change from the highest elevation to the lowest was less than one percent, indicating a predominantly flat landscape for all sites (Table 2, Figure 1). Elevation highs sometimes occurred mid-field and sometimes at field edges, with elevation lows typically at the field edges most distal from the high areas, approaching natural drainageways (Figure 2).

Table 2.
Elevation and average slope of study sites.
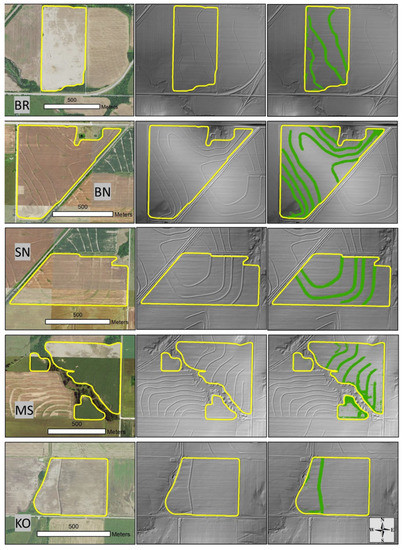
Figure 2.
The five research sites used for this study in Ottawa County, Oklahoma. The images in the first column are visible reflectance data taken from the National Agricultural Imagery Program dataset [32], showing some indication of terracing patterns. Site boundaries are outlined in yellow and site identification codes are given in black letters on a gray background. The center column shows a hillshade model derived from the digital elevation model [11] for each site, with terrace features faintly visible as shaded linear regions. Higher relative elevations are given a lighter shade of gray, and lower elevations are darker. The third column shows the results of the top performing classification algorithm as green linear features covering the predicted regions of terraces, their “borrow” zones from the uphill side, and their “deposition” zones on the downhill side.
Elevation differences influenced by terraces can be seen in the elevation transect for the BN site (Figure 3). Here, the elevation decreases from the high point near the middle of the field to the low point at the southwest portion. Along the transect, we see localized elevation differences, or bumps, of approximately 50 cm over approximately 20 m. This range in local elevation varies slightly from one terrace to another, but in all cases the uphill side of the terrace is lower than the trend of elevation immediately uphill, indicating a “borrow” zone from which soil was taken to be mounded on the area immediately downhill. Several terrain derivatives showed changes in magnitude related to these bumps. The most visually obvious pattern was seen with the topographic wetness index [22,23] where simulated overland flow is disrupted by the presence of the elevation bumps, leading to a spike in TWI values immediately upstream from the terrace, and a sharp decline on the terrace itself (Figure 3). These value spikes, both positive and negative, were indicative of terrace presence. The negative openness algorithm [24] likewise showed spikes at the terrace locations, but this time in the negative direction (Figure 3), indicating micro-troughs in which sky visibility is obstructed by surrounding terrain.
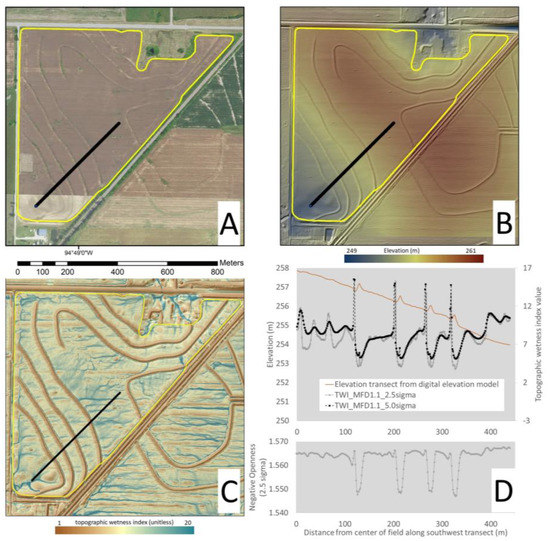
Figure 3.
The black line in image (A) indicates an elevation transect from the highest elevation at the BN site to the area of lowest elevation. Image (B) shows a color ramp for elevation at the site. Image (C) shows an iteration of the topographic wetness index (TWI), with higher values given in blue and lower values in red. Image (D) shows the variation in values of selected terrain derivatives along the transect, including topographic wetness index at both levels of smoothing, and the negative openness algorithm after DEM Gaussian smoothing to 2.5 sigma.
3.2. Terrace Delineation Accuracy
Terrain derivatives were useful for delineating terraces with up to 98.4% accuracy and kappa of 0.961 with the random forest algorithm (Figure 4 and Figure 5). Random forest was the best performing algorithm, but others also provided a good performance (Figure 4). The optimum number of terrain derivatives for classifying terraces in the area varied from three to seven, with five performing the best (Figure 5). This indicates that the complexity of the terrace features is relatively easy to classify with a limited number of terrain derivatives if they are chosen carefully. When the number of terrain derivatives was optimized to classify the terraces, terrace delineation showed strong cohesion and adherence to the field-observed locations of terraces, as indicated in the green-colored areas in the third column of Figure 2. Model performance decreased slightly in the field sites when 10, 22, and 38 derivative calculations were included, likely indicating some potential problems with overfitting (Figure 5). Likewise, when only 1 or 2 derivatives were included, performance decreased, probably because the terrace features are complex enough (with micro-highs on the terraces themselves and micro-lows in the borrow zones) that a very small number of derivatives are unable to capture the complete dynamics of the terrace complexity.
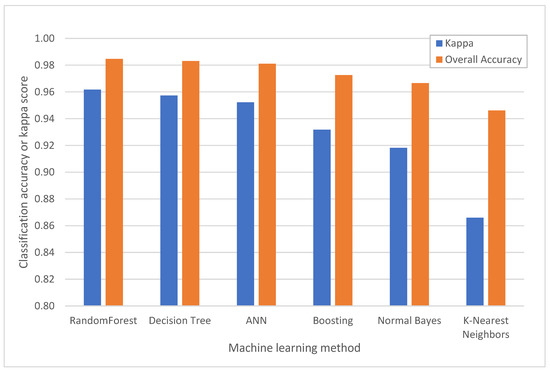
Figure 4.
Model accuracy for identifying terraces using the best performing subset of five terrain attributes.
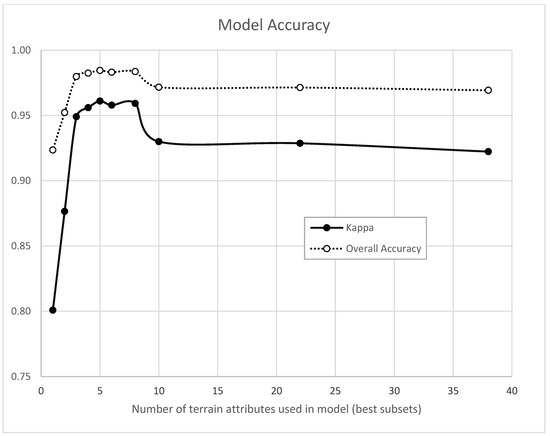
Figure 5.
Accuracy of terrace classification using supervised classification random forest algorithm with full model and subsequent subsets after eliminating terms with lowest importance scores.
3.3. Terrace Delineation Response to Smoothing and Terrain Derivative Parameters
The five derivatives in the best model were the topographic wetness index applied to the minimally smoothed DEM (2.5 sigma) and strongly smoothed DEM (5.0 sigma), the negative openness algorithm minimally smoothed, the profile curvature minimally smoothed, and general curvature minimally smoothed (Figure 6). This optimization shows that terrain derivatives of various types are useful, with visibility, morphometric, and hydrologic derivatives all playing a role in terrace delineation. The best performances included all three categories of terrain derivative. When one or more derivatives from these categories were omitted, the performance of the classifying algorithm suffered. This makes sense as each category provides a somewhat unique lens with which to examine landscapes. Hydrologic derivatives examine the connectivity of pixels; visibility derivatives relate to the ways in which a landscape is hidden or exposed by surrounding land features; and morphometric derivatives provide a direct mathematical measure of the relation of a pixel to its immediate neighbors. All these aspects of analysis apparently contribute to the accurate identification and delineation of terraces.
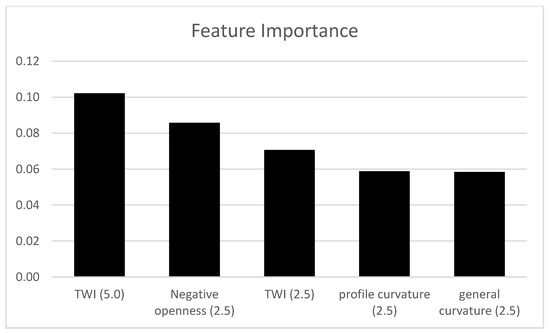
Figure 6.
Permutation importance in random forest classification for top-performing set of terrain attributes. The numbers in parentheses indicate the degree of DEM smoothing (sigma in meters) prior to terrain-derivative algorithm application. TWI values are calculated with the multiple-flow-direction algorithm and convergence factor equal to 1.1 [22]. Negative openness is from [24]. Curvature calculations are from [16].
4. Discussion
The identification of terraces in NE Oklahoma is important for several reasons. The maintenance and assessment of terrace function is periodically needed as improperly maintained terraces can increase soil and water loss through erosion, increase surface runoff, and decrease infiltration rates [1,32,33,34]. Terracing can also influence crop yields, usually increasing yields, but in some cases decreasing them [35,36,37,38,39,40,41]. Further research on the effectiveness of terracing as a conservation tool is required as the extent to which terraces improve ecosystem services is not well established [36]. Therefore, the identification and assessment of terrace effectiveness is needed.
The terraces in Ottawa County, Oklahoma, usually rise less than half a meter in a ridge shape over a profile that can be 20 m in cross-section from the edge of the zone from which soil is taken on the uphill side of the terrace to the edge of the disturbed zone on the downhill side of the terrace [4,5]. When crops are covering agricultural fields, a terrace feature of this scale in this landscape is not obviously identifiable. Even in a bare field, the subtlety of the rise over the length of the run can make identification challenging.
In Ottawa County, Oklahoma, anecdotal evidence suggests that terrace areas and areas immediately adjacent to terraces on the uphill and downhill sides had increased yield variability in some years of observation. This is not surprising as the soil on both the uphill and downhill sides of a broad-base terrace, as well as the soil on the terrace itself, are in a disturbed state because of the terrace construction dynamics [4,5]. The construction involves heavy machinery, such as bulldozers or other earth-moving equipment and requires the scraping or removal of surface soil from an uphill borrow zone to a downhill deposition zone [4,5]. Compaction from machinery and the removal of A-horizon material can negatively influence yield [42]. Other researchers reported trends in yield variability on terraces in various landscape positions in Rwanda [41]. To test the hypotheses relating terraces to yield in Ottawa County, Oklahoma, terrace locations first had to be delineated for crop fields where yield monitoring data was available throughout the region. The influence of terraces on yield in Ottawa County is covered in a separate paper.
A few areas within the study sites were clearly misclassified, such as the northeastern edge of the lower MS field (Figure 2). This misclassification was likely due to the change in elevation over short distances associated with the incised stream channel immediately downhill from the field edge. To a lesser extent, the same shortcomings in classification accuracy are seen in the western boundary of the KO site, ostensibly for the same reason, namely proximity to natural incised drainageways. Furthermore, when the model was applied to areas that were clearly not agricultural fields, it failed to delineate meaningfully and provided irrelevant output. It should be noted, however, that when used strictly in agricultural fields, the accuracy of the random forest method with the best-performing terrain derivative suite provided sufficient accuracy for delineating the terrace features of the agricultural fields.
5. Conclusions
In this study, we developed a step-by-step process for delineating terraces in flat terrain. The results of this study highlight the usefulness of terrain derivatives for identifying and delineating terrace features in flat landscapes. Computer vision, most particularly the random forest algorithm, is effective at classifying terraces and non-terrace areas when trained on terrain derivatives that are responsive to the sudden or subtle shifts in elevation associated with terrace features in flat landscapes.
Future work will examine the various zones within the terrace structure at the study sites to determine yield response and salinity issues in the uphill “borrow” zone vs. the downhill “deposition” zone. The broader landscape of the region contains many terrace features on other sites that can be studied after the terraces are identified and delineated with sufficient accuracy. This work is foundational for automating digital soil mapping for terraced fields to improve the delivery of spatial soil information to support soil resource conservation and water management at field and farm levels.
Author Contributions
Conceptualization, H.E.W. and P.R.O.; methodology, H.E.W. and T.K.; validation, H.E.W.; formal analysis, H.E.W.; investigation, H.E.W., P.R.O. and Z.L.; resources, A.A. and P.R.O.; data curation, H.E.W.; writing—original draft preparation, H.E.W.; writing—review and editing, H.E.W.; visualization, H.E.W.; supervision, P.R.O. and A.A.; project administration, H.E.W.; funding acquisition, A.A. All authors have read and agreed to the published version of the manuscript.
Funding
This research is supported by USDA-NRCS Conservation Innovation Grant from the On-farm Trials Program, titled “Improving the Economic and Ecological Sustainability of US Crop Production through On-Farm Precision Experimentation” (Award Number NR213A7500013G021).
Institutional Review Board Statement
Not applicable.
Informed Consent Statement
Not applicable.
Data Availability Statement
Data will be made available upon request to the lead author.
Acknowledgments
Michael Schmidt, Brent Rendel, and Kolby Chrz.
Conflicts of Interest
The authors declare no conflict of interest.
References
- Deng, C.; Zhang, G.; Liu, Y.; Nie, X.; Li, Z.; Liu, J.; Zhu, D. Advantages and disadvantages of terracing: A comprehensive review. Int. Soil Water Conserv. Res. 2021, 9, 344–359. [Google Scholar] [CrossRef]
- Baryła, A.; Pierzgalski, E. Ridged terraces—Functions, construction and use. J. Environ. Eng. Landsc. Manag. 2008, 16, 104–109. [Google Scholar]
- Ferro-Vázquez, C.; Lang, C.; Kaal, J.; Stump, D. When is a terrace not a terrace? The importance of understanding landscape evolution in studies of terraced agriculture. J. Environ. Manag. 2017, 202, 500–513. [Google Scholar] [CrossRef]
- Wheaton, R.Z.; Monke, E. Terracing as a “Best Management Practice” for Controlling Erosion and Protecting Water Quality. 1981. Available online: https://www.extension.purdue.edu/extmedia/AE/AE-114.html#:~:text=What%20is%20terracing%3F%20Terracing%20is%20a%20soil%20conservation,Terraces%20consist%20of%20ridges%20and%20channels%20constructed%20across-the-slope (accessed on 19 July 2022).
- FAO; United Nations. Watershed Management Field Manual: Slope Treatment Measures and Practices; FAO: Rome, Italy, 1988. [Google Scholar]
- Winzeler, H.E.; Owens, P.R.; Waltman, S.W.; Waltman, W.J.; Libohova, Z.; Beaudette, D. A Methodology for Examining Changes in Soil Climate Geography through Time: U.S. Soil Moisture Regimes for the Period 1971–2000. Soil Sci. Soc. Am. J. 2013, 77, 213–225. [Google Scholar] [CrossRef]
- Dai, W.; Na, J.; Huang, N.; Hu, G.; Yang, X.; Tang, G.; Xiong, L.; Li, F. Integrated edge detection and terrain analysis for agricultural terrace delineation from remote sensing images. Int. J. Geogr. Inf. Sci. 2020, 34, 484–503. [Google Scholar] [CrossRef]
- Florinsky, I.V. Digital Terrain Analysis in Soil Science and Geology, 2nd ed.; Elsevier: Amsterdam, The Netherlands, 2016. [Google Scholar]
- Wilson, J.P. Environmental Applications of Digital Terrain Modeling; Wiley Blackwell: Hoboken, NJ, USA, 2018. [Google Scholar]
- Böhner, J.; Selige, T. Spatial prediction of soil attributes using terrain analysis and climate regionalisation. Göttinger Geogr. Abh. 2004, 115, 16. [Google Scholar]
- U.S. Geological Survey. 3D Elevation Program 1-Meter Resolution Digital Elevation Model (Published 20200606). 2022. Available online: https://www.usgs.gov/3d-elevation-program (accessed on 1 July 2022).
- Arundel, S.T.; Archuleta, C.A.M.; Phillips, L.A.; Roche, B.L.; Constance, E.W. 1-Meter Digital Elevation Model Specification; U.S. Geological Survey: Reston, VA, USA, 2015. [Google Scholar]
- Erdbrügger, J.; van Meerveld, I.; Bishop, K.; Seibert, J. Effect of DEM-smoothing and -aggregation on topographically-based flow directions and catchment boundaries. J. Hydrol. 2021, 602, 126717. [Google Scholar] [CrossRef]
- Winzeler, H.E.; Owens, P.R.; Read, Q.D.; Libohova, Z.; Ashworth, A.; Sauer, T. Topographic Wetness Index as a Proxy for Soil Moisture in a Hillslope Catena: Flow Algorithms and Map Generalization. Land 2022, 11, 2018. [Google Scholar] [CrossRef]
- Lindsay, J.B.; Creed, I. Removal of artifact depressions from digital elevation models: Towards a minimum impact approach. Hydrol. Process. 2005, 19, 3113–3126. [Google Scholar] [CrossRef]
- Zevenbergen, L.W.; Thorne, C.R. Quantitative analysis of land surface topography. Earth Surf. Process. Landf. 1987, 12, 47–56. [Google Scholar] [CrossRef]
- Olaya, V. Basic Land-Surface Parameters. Developments in Soil Science; Elsevier: Amsterdam, The Netherlands, 2009; Chapter 6; pp. 141–169. [Google Scholar]
- Conrad, O.; Bechtel, B.; Bock, M.; Dietrich, H.; Fischer, E.; Gerlitz, L.; Wehberg, J.; Wichmann, V.; Böhner, J. System for Automated Geoscientific Analyses (SAGA) v. 2.1.4. Geosci. Model Dev. 2015, 8, 1991–2007. [Google Scholar] [CrossRef]
- Guisan, A.; Weiss, S.B.; Weiss, A.D. GLM versus CCA spatial modeling of plant species distribution. Plant Ecol. 1999, 143, 107–122. [Google Scholar] [CrossRef]
- Gallant, J.C.; Dowling, T.I. A multiresolution index of valley bottom flatness for mapping depositional areas: MULTIRESOLUTION VALLEY BOTTOM FLATNESS. Water Resour. Res. 2003, 39, 1347. [Google Scholar] [CrossRef]
- Adhikari, K.; Owens, P.R.; Ashworth, A.J.; Sauer, T.J.; Libohova, Z.; Richter, J.L.; Miller, D.M. Topographic Controls on Soil Nutrient Variations in a Silvopasture System. Agrosyst. Geosci. Environ. 2018, 1, 1–15. [Google Scholar] [CrossRef]
- Freeman, T.G. Calculating catchment area with divergent flow based on a regular grid. Comput. Geosci. 1991, 17, 413–422. [Google Scholar] [CrossRef]
- Beven, K.J.; Kirkby, M.J. A physically based, variable contributing area model of basin hydrology / Un modèle à base physique de zone d’appel variable de l’hydrologie du bassin versant. Hydrol. Sci. Bull. 1979, 24, 43–69. [Google Scholar] [CrossRef]
- Yokoyama, R.; Shirasawa, M.; Pike, R. Visualizing topography by Openness: A new application of image processing to digital elevation models. Photogramm. Eng. Remote Sens. 2002, 68, 257–265. [Google Scholar]
- Hantzschel, J.; Goldberg, V.; Bernhofer, C. GIS-based regionalisation of radiation, temperature and coupling measures in complex terrain for low mountain ranges. Meteorol. Appl. 2005, 12, 33–42. [Google Scholar] [CrossRef]
- Böhner, J.; Antonić, O. Land-Surface Parameters Specific to Topo-Climatology. Developments in Soil Science; Elsevier: Amsterdam, The Netherlands, 2009; Chapter 8; pp. 195–226. [Google Scholar]
- Pulli, K.; Baksheev, A.; Kornyakov, K.; Eruhimov, V. Real-time computer vision with OpenCV. Commun. ACM 2012, 55, 61–69. [Google Scholar] [CrossRef]
- Breiman, L. Random Forests. Mach. Learn. 2001, 45, 5–32. [Google Scholar] [CrossRef]
- John, G.H.; Langley, P. Static versus Dynamic Sampling for Data Mining. In Proceedings of the Second International Conference on Knowledge Discovery and Data Mining, Portland, OR, USA, 2–4 August 1996. [Google Scholar]
- Kharel, T.P.; Ashworth, A.J.; Owens, P.R.; Philipp, D.; Thomas, A.L.; Sauer, T.J. Teasing Apart Silvopasture System Components Using Machine Learning for Optimization. Soil Syst. 2021, 5, 41. [Google Scholar] [CrossRef]
- Cohen, J. Weighted kappa: Nominal scale agreement provision for scaled disagreement or partial credit. Psychol. Bull. 1968, 70, 213–220. [Google Scholar] [CrossRef] [PubMed]
- USDA. National Agricultural Imagery Program. Available online: https://naip-usdaonline.hub.arcgis.com/ (accessed on 1 January 2023).
- Arnáez, J.; Lana-Renault, N.; Lasanta, T.; Ruiz-Flaño, P.; Castroviejo, J. Effects of farming terraces on hydrological and geomorphological processes. A review. Catena 2015, 128, 122–134. [Google Scholar] [CrossRef]
- El Atta, H.A.; Aref, I. Effect of terracing on rainwater harvesting and growth of Juniperus procera Hochst. ex Endlicher. Int. J. Environ. Sci. Technol. 2010, 7, 59–66. [Google Scholar] [CrossRef]
- Lesschen, J.P.; Cammeraat, L.; Nieman, T. Erosion and terrace failure due to agricultural land abandonment in a semi-arid environment. Earth Surf. Process. Landf. 2008, 33, 1574–1584. [Google Scholar] [CrossRef]
- Wei, W.; Chen, D.; Wang, L.; Daryanto, S.; Chen, L.; Yu, Y.; Lu, Y.; Sun, G.; Feng, T. Global synthesis of the classifications, distributions, benefits and issues of terracing. Earth-Sci. Rev. 2016, 159, 388–403. [Google Scholar] [CrossRef]
- Hass, H.J.; Willis, W.O.; Boatwright, G.O. Moisture storage and spring wheat yields on level-bench terraces as influenced by contributing area cover and evaporation control. Agron. J. 1966, 58, 297–299. [Google Scholar] [CrossRef]
- Sharda, V.N.; Sena, D.R.; Shrimali, S.S.; Khola, O.P.S. Effects of an Intercrop-Based Conservation Bench Terrace System on Resource Conservation and Crop Yields in a Sub-Humid Climate in India. Trans. ASABE 2013, 56, 1411–1425. [Google Scholar] [CrossRef]
- Wickama, J.; Okoba, B.; Sterk, G. Effectiveness of sustainable land management measures in West Usambara highlands, Tanzania. Catena 2014, 118, 91–102. [Google Scholar] [CrossRef]
- Adgo, E.; Teshome, A.; Mati, B. Impacts of long-term soil and water conservation on agricultural productivity: The case of Anjenie watershed, Ethiopia. Agric. Water Manag. 2013, 117, 55–61. [Google Scholar] [CrossRef]
- Kagabo, D.M.; Stroosnijder, L.; Visser, S.M.; Moore, D. Soil erosion, soil fertility and crop yield on slow-forming terraces in the highlands of Buberuka, Rwanda. Soil Tillage Res. 2013, 128, 23–29. [Google Scholar] [CrossRef]
- Brady, N.C.; Weil, R.R. The Nature and Properties of Soils, 13th ed.; Prentice Hall: Upper Saddle River, NJ, USA, 2002. [Google Scholar]
Disclaimer/Publisher’s Note: The statements, opinions and data contained in all publications are solely those of the individual author(s) and contributor(s) and not of MDPI and/or the editor(s). MDPI and/or the editor(s) disclaim responsibility for any injury to people or property resulting from any ideas, methods, instructions or products referred to in the content. |
© 2023 by the authors. Licensee MDPI, Basel, Switzerland. This article is an open access article distributed under the terms and conditions of the Creative Commons Attribution (CC BY) license (https://creativecommons.org/licenses/by/4.0/).