Article

Using a Rainfall Simulator to Define the Effect of Soil Conservation Techniques on Soil Loss and Water Retention

1
Department of Landscape Water Conservation, Faculty of Civil Engineering, Czech Technical University in Prague, Thákurova 7, 16629 Prague, Czech Republic
2
Research Institute for Soil and Water Conservation, Žabovřeská 250, 15627 Prague, Czech Republic
3
Department of Crop Science, Breeding and Plant Medicine, Faculty of AgriSciences, Mendel University in Brno, Zemědělská 1665, 61300 Brno, Czech Republic
4
Crop Research Institute, Drnovská 507, 16100 Prague, Czech Republic
*
Author to whom correspondence should be addressed.
Land 2023, 12(2), 431; https://doi.org/10.3390/land12020431
Submission received: 6 January 2023 / Revised: 1 February 2023 / Accepted: 6 February 2023 / Published: 7 February 2023
(This article belongs to the Section Soil-Sediment-Water Systems)

Abstract

:
In the Czech Republic, the Universal Soil Loss Equation provides the basis for defining the soil protection strategy. Field rainfall simulators were used to define the actual cover-management factor values of the most extensively seeded crops in the Czech Republic. The second purpose was to assess rainfall-runoff ratio for different crops and management to contribute to the debate of water retention effectiveness during approaching climate change. The methodology focused on multi-seasonal measurements to cover the most important phenological phases. The rainfall intensity was 60 mm·h−1 for 30 min and a plot size of 16 m2. More than 380 rainfall simulation experiments provided data. Soil conservation techniques proved to have a significant effect on runoff reduction. Conventionally seeded maize can reduce the runoff ratio to around 50%. However, cover crops combined with reduced tillage or direct seeding can reduce the runoff ratio to 10–20% for ‘dry’ conditions and to 12–40% for ‘saturated’ conditions. Conventionally seeded maize on average loses 4.3 Mg·ha−1 per 30 min experiment. However, reduced tillage and direct seeding reduce soil loss to 0.6 and 0.16 Mg·ha−1, respectively. A comparison with the original USDA values for maize showed that it is desirable to redefine the crop cover factor.

1. Introduction

In the European Union and globally, soil erosion has been identified as a major threat to the environment [1]. Human interactions and agricultural practices act as clear accelerators of soil erosion processes in croplands [2]. In Europe, soil protection is harmonized mainly through Common Agriculture Policy (CAP) tools, especially by the requirements of ’Good Agricultural and Environmental Conditions’ (GAEC), as defined within the framework of so-called Cross-Compliance [3]. The Common Agricultural Policy (CAP) has a mitigating effect on soil erosion in Europe. Between 2010 and 2016, the average C-factor for the 28 states of the European Union decreased by 0.84% to 0.232 [4]. It has been reduced by conservation tillage and by combining cover crops and plant residues. The greatest reduction in the average C-factor has been in Estonia (−11%), France (−8%) and Portugal (−7%). In contrast, there has been an increase in Bulgaria (13%) and in Greece (5%), Poland (4%) and Ireland (3%). The Land Use and Management model estimates these numbers based on the Coordination of Information on the Environment database and Eurostat [4]. A reduction in the C-factor is also reflected in the decrease of 0.4% in the long-term average erosion rate. This small decrease is due to a small increase in applied soil conservation practices and small changes in land cover. A further decrease in soil loss was due to the greening of the CAP 2014–2020 [5]. Implementing key policies in CAP, such as climate-smart and nature-friendly agricultural technologies, measures to protect soil or to retain water in the landscape, can be expensive. A case study from the Czech Republic demonstrates how the monetary value of these externalities can help decision-making [6]. The feasibility and effectiveness of various best management practices (BMPs) are described by Ricci et al. [7]. In South-Central Italy, four management scenarios (contour farming, no tillage, reforestation, and a combination of contour farming and reforestation) were implemented using the calibrated SWAT model. In terms of erosion control, the most effective measures were contour farming and reforestation. In terms of the farmer return-production cost ratio, the results depend on the average slope in the area.
The Czech Republic has significant problems with soil erosion on crop land due to hilly environments with enormous field sizes, by European standards, as a result of the country’s agricultural collectivization history [8,9,10,11]. The average farm has 133 ha of agricultural land, compared to the EU average of 16.1 ha [12]. This leads to large areas of monocultures, low landscape biodiversity, high risk of soil erosion, and low ability to capture water in the landscape [13]. In addition, the Czech Republic has serious problems with row crops in hilly environments, due to the increasing reliance on maize production [14]. As with most European countries, in the Czech Republic the soil risk assessment and soil protection strategy within GAEC is based on USLE modelling [15,16].
Agricultural conservation practices have been extensively studied throughout the world and have been shown to significantly improve soil infiltration capacity. As a consequence, there is significantly decreased surface runoff and erosion [17,18,19,20,21,22]. Common agricultural conservation practices include reduced/no-tillage, mulch cover/crop residues, cover crops, and reduced application of herbicides [4,23]. However, only a small number of these studies have presented the effect of conservation techniques in row crops, supported by direct measurements [24]. Since the development of USLE [25] and RUSLE [26], the original crop factor values may have changed due to the use of new agriculture techniques and different crop varieties. In the Czech Republic (and in Europe), the original values are usually used without further validations and without any changes. National projects supported by the Ministry of Agriculture of the Czech Republic (QJ1530181 and QK1920224) were focused on the experimental derivation of USLE and runoff parameters of recent farming techniques that can be implemented in the GAEC to promote soil protection strategies.
The objectives of the research were to derive rainfall-runoff coefficients, soil loss ratios, and crop factors within USLE for missing crops, especially for no-till and reduced tillage in row crops, and for intercrops, since original USLE and RUSLE handbooks provide values valid for outdated machinery and tilling techniques. The hypothesis is that conservation techniques (shallow till and no-till combined with cover crop mulch residues) in row crops significantly reduce not only sediment transport, but also runoff during intensive summer storms of 1 mm per minute intensities. Therefore, it promotes water retention in landscape and soil water refilling.
The following research questions have been defined: (1) What intercomparability and variability can be expected among rainfall simulator experiments with an 8 m long plot, concerning the rainfall-runoff ratio? (2) What variability can be expected concerning soil loss and the soil loss ratio? (3) How effective are soil protection strategies concerning runoff and erosion in the case of maize (Zea mays)? (4) Do experimentally derived values of the C-factor differ from the values that are officially used in the Czech Republic?

2. Material and Methods

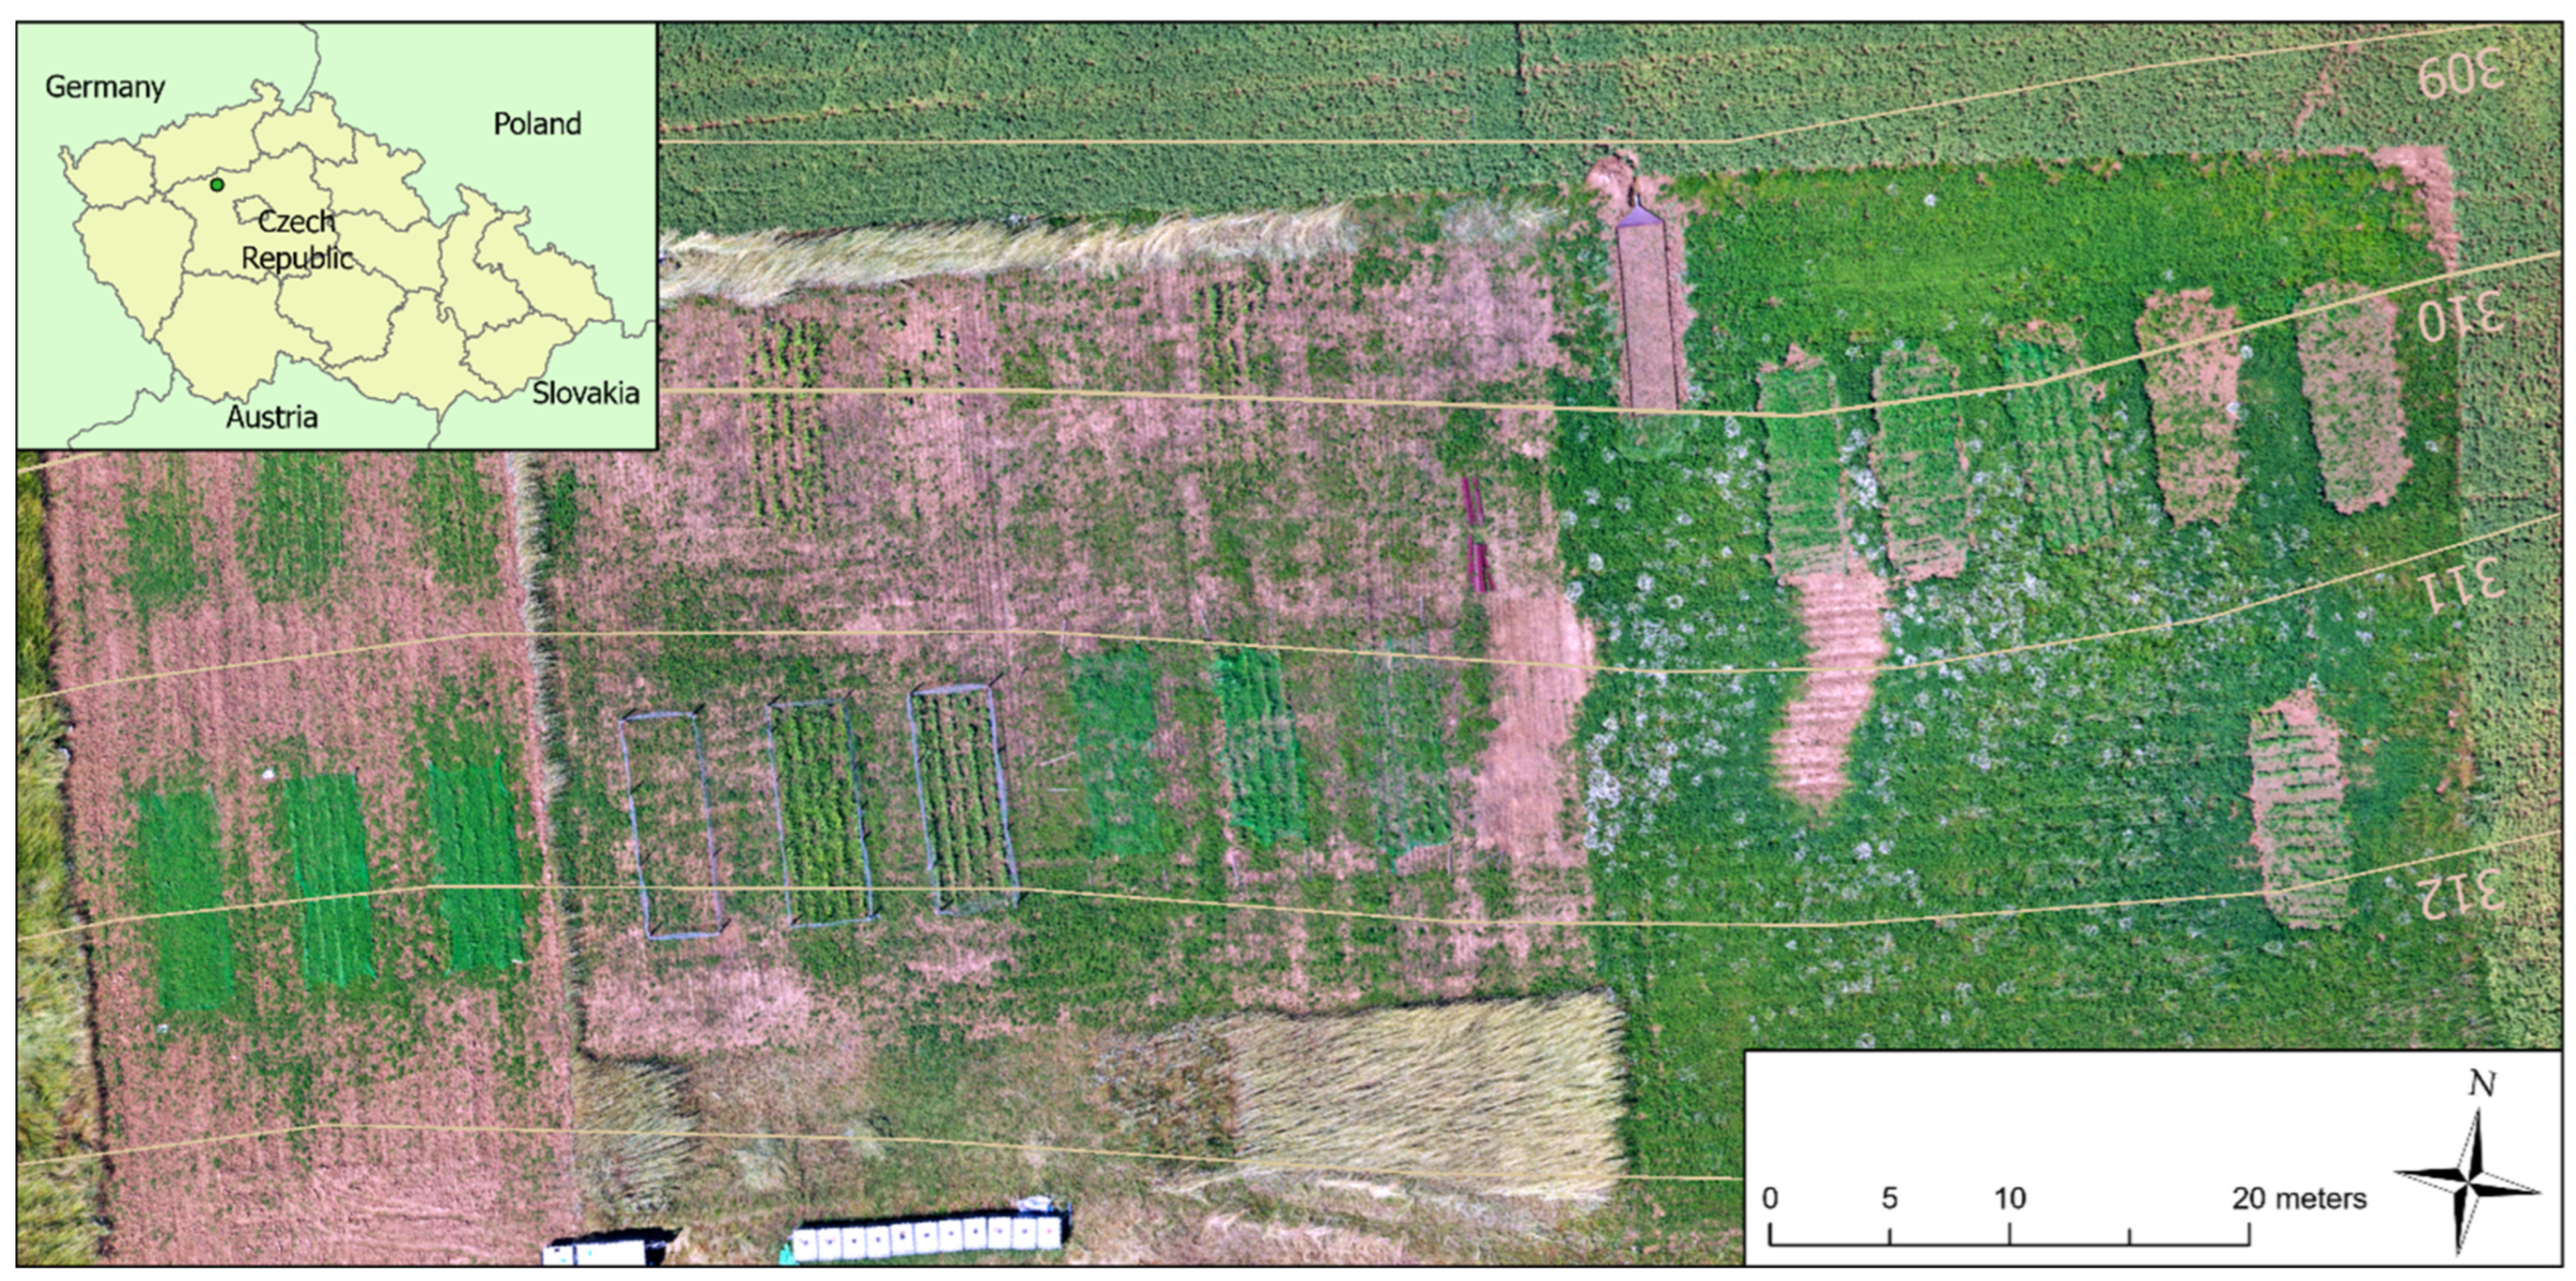
2.1. Experimental Plots and Tested Crops

The effect of different soil protection strategies was measured using a rainfall simulator as a direct method to quantify the runoff coefficient and the soil loss ratio [27]. The use of a rainfall simulator on a defined field crop is one way to obtain data on the effect of vegetation protection. Simulated rainfall is applied in the experimental field with a crop and with a bare soil as a reference. The plot size is 8 ✕ 2 m and the runoff and sediment transport are measured. Soil loss ratios are measured for three stages of crop development. The pre-sowing and post-harvest phases are also measured. All measured data provide information on soil protection throughout the season.
The experiments were conducted in an agricultural field operated by the private farm AGRA Řisuty (Figure 1), in central Czechia (50.2172 N, 14.0170 E), about 30 km northwest of Prague. The relief of the area is characterized by moderate slopes, and the entire experimental field is north oriented with a 9% uniform slope and at an elevation of 320 m asl. Concerning rainfall, the area has a mean annual rainfall rate of 500 mm and a very short winter snow period. The average annual temperature is 8.5 °C. From the geological point of view, the locality is characterized by subhorizontally deposited layers of Cretaceous and Permo-Carboniferous rather weakly strengthened pelitic sediments [28]. According to the taxonomy, the soil is loamic cambisol, which is the most common soil type on agricultural land in the Czech Republic [29]. The topsoil layer is strongly influenced by long-term intensive agricultural activity. The upper topsoil Ap horizon is relatively structural (aggregate stability 55–65%), with a rather low organic carbon content (1.49%). The top layer B of the horizon (depth 15–30 cm) is compacted by agricultural technology, low porous and unstructured. According to the USDA classification, the grain size distribution defines the soil as loam, but some samples indicate a shift to sandy clay loam.
The experimental plots were established using standard tillage typical for the area. The Crop Research Institute assisted with the seeding of row crops (maize, sorghum and sunflower) and monitored all crops during the vegetation season, including dealing with weeds and pests. For each campaign, the cultivated fallow was prepared according to the methodology defined by Kavka et al. [27]. This means that all vegetation is removed from the fallow plot, the plot is tilled to a depth of 10 cm by a rototiller in the slope direction and is compacted by a 50 kg rolling press. The press is 50 cm wide, and pressure is approximately 20 kPa. This ensures identical initial conditions for a comparison between experimental plots and bare soil plots in each experiment.
To represent the full scale of the vegetation and the changes in soil protection over time, it would be optimal to run experiments weekly, but such a strategy would significantly change the soil water regime and the crop conditions. In addition, it would be technically extremely demanding. Wischmeier defined 5 crop phases to represent the seasonal crop development [25]. The first phase is the seedbed condition, the following 3 phases are the rise of the crop, and the last phase is the post-harvest condition. We therefore agreed to follow the strategy of three experiments per crop and in each vegetation season to represent the initial growth phase, the main growth phase, and ripening. These phenological phases are optimally defined by the BBCH scale [30]. The BBCH scale is made up of two-digit codes 00-99, where 00 indicates pre-sowing and 99 indicates post-harvest. The scale is divided into 10 subgroups, each of which represents a major development stage (e.g., leaf development, stem elongation, flowering, ripening). The first experiment is carried out before BBCH 30, the second experiment is carried out before BBCH 61, and the last experiment is carried out before harvest.
In total, 384 experiments were performed in the Řisuty experimental area in six seasons between 2016–2021(Table 1). Of these, 29 experiments had to be removed during data processing due to technical problems with the evaluation of the experiment data. In total, 355 experiments were used for calculating the runoff, the sediment transport and the soil loss ratio. The dataset contained 71 successful measurements representing fallow plot conditions to gather base data for comparisons of soil protection effectiveness. Twenty-six supplementary experiments represented other conditions, such as various seedbed variants (for variable tillage systems), unmanaged fallow plots after rain, soil compaction during the season, and the post-harvest situations of grain and row crops.
As far as crops are concerned, this paper focuses on comparing conventional and protective scenarios of maize (Zea mays). We tested (i) classical deep ploughing and slope-oriented seeding, (ii) contour seeding, using winter protective cover crops such as winter rye (Secale cereale) and rapeseed (Brassica napus), followed by (iii) desiccation, mulching and shallow tillage seeding, or (iv) desiccation, mulching, and direct seeding into the cover crop.

2.2. Experimental Setup

The 8 m long field sprinkler system rainfall simulator of the Czech Technical University in Prague was built in 2011 and has been innovated several times after intensive field use [31]. Currently, a system is being developed for two-scale measurements, using a standardized rain and data collection method [27]. There are eight FullJet 40WSQ nozzles 2.0 m above the ground and 1.2 m apart. The plot is 2 ✕ 8 m with the longest edge along the slope, and the over-raining experimental areas ensure a Christiansen uniformity index of 80% and more for all field simulations. The experimental plot is framed by 30 cm high metal sheets hammered 15 cm below the soil surface to prevent overland flow entering or leaving the experimental area. The bottom edge is concentrated by a metal plate into the sample collection tube. All water leaks are carefully checked and sealed before each experiment. For the simulations, rainfall intensity of 60 mm per hour is used (1.0 mm per minute), characterized by kinetic energy of 10 J·m−2·mm−1. The precipitation intensity is checked during each simulation run using a tipping bucket rain gauge with a collection area of 200 mm2. The second continuously recorded variable is the water pressure at the first nozzle, which is monitored by the digital pressure sensor.
For each trial, a pair of simulation experiments are always performed. The first experiment at initial soil moisture conditions, always a period of at least 3 days without natural rainfall, was preferred for the simulation day. In the results, it is referred to as ‘dry’. Rainfall with intensity of 60 mm·h−1 is applied for 30 min if surface runoff starts immediately. Alternatively, rain is applied for 30 min after the initiation of surface runoff. This is followed by a 15 min pause, and the second experiment is started on a fully saturated soil using the same settings, also for 30 min following the initiation of surface runoff. In the results, this is referred to as ‘wet’.
For each of the experiments, 12 runoff samples are collected at intervals of 2.5 min from the moment of surface runoff initiation. The sample size is between 1 and 2 litres, depending on the runoff rate, the time of sample extraction (t) is measured with accuracy of 0.1 s, each sample is weighed, and the runoff (Q) is then calculated by a volumetric evaluation. Subsequently, each sample is filtered and air dried, and the sediment mass (m) and the sample volume (V) are defined. The sediment concentration (ρ) and the sediment flux (SF) are calculated using the following equations:
Q = V t
ρ = m V
SF = ( m V ) × ( V t )
Additionally, the following parameters and variables, which are not of the main concern of this manuscript, are measured during each simulation: initial soil bulk density; volumetric soil moisture; surface runoff velocity; organic carbon content and particle size distribution. The data from the experiments are collected and stored in the joint database [32,33].

2.3. Data Preparation

For each sample, the amount of transported sediment is calculated corresponding to each 2.5 min interval. In this way, the change in flow rate, sediment concentration, and sediment mass is monitored throughout the duration of the experiment. In the next step, obvious outliers are removed from the data, e.g., errors during sampling or during laboratory analyses.
The cumulative sediment transport value after 30 min of simulation is used to estimate the soil loss ratio (SLR) with the following equation:
SLR = G V ,   30 G F ,   30
where GV,30 and GF,30 are the amount of cumulative sediment transported up to the 30th minute of simulation for vegetation and for fallow (bare soil), respectively. The total amount of rainfall after 30 min of 60 mm·h−1 rainfall intensity is significant enough to assess the crop cover factor in the weather conditions of the Czech Republic [34]. This is carried out for each experiment (bare soil/vegetation and dry/wet conditions). Dry and wet conditions are averaged [35]. That way, SLR is derived for each phenological stage, represented by BBCH. Daily SLR values are derived from these data. The daily SLR values are then used to compute the C-factor within the Erosion Calculator [36]. The Erosion Calculator is a web application used by farmers and by the Ministry of Agriculture to assess erosion for the purposes of Cross Compliance in the Czech Republic. The annual C-factor (Cf) value is calculated according to the following equation:
C f = SLR i × R i ,
where SLRi is the partial soil loss ratio of the crop or the actual field condition, and Ri is the proportional percentage of the R-factor corresponding to the period in the total annual value of the R-factor (expressed as 100%) in accordance with the original USLE methodology. The duration of the period depends on the accuracy of the R-factor distribution for a given location. The monthly distribution of the R-factor [37] is mostly used for the Czech Republic (Table 2), and the same approach was used for our experimental data.

3. Results

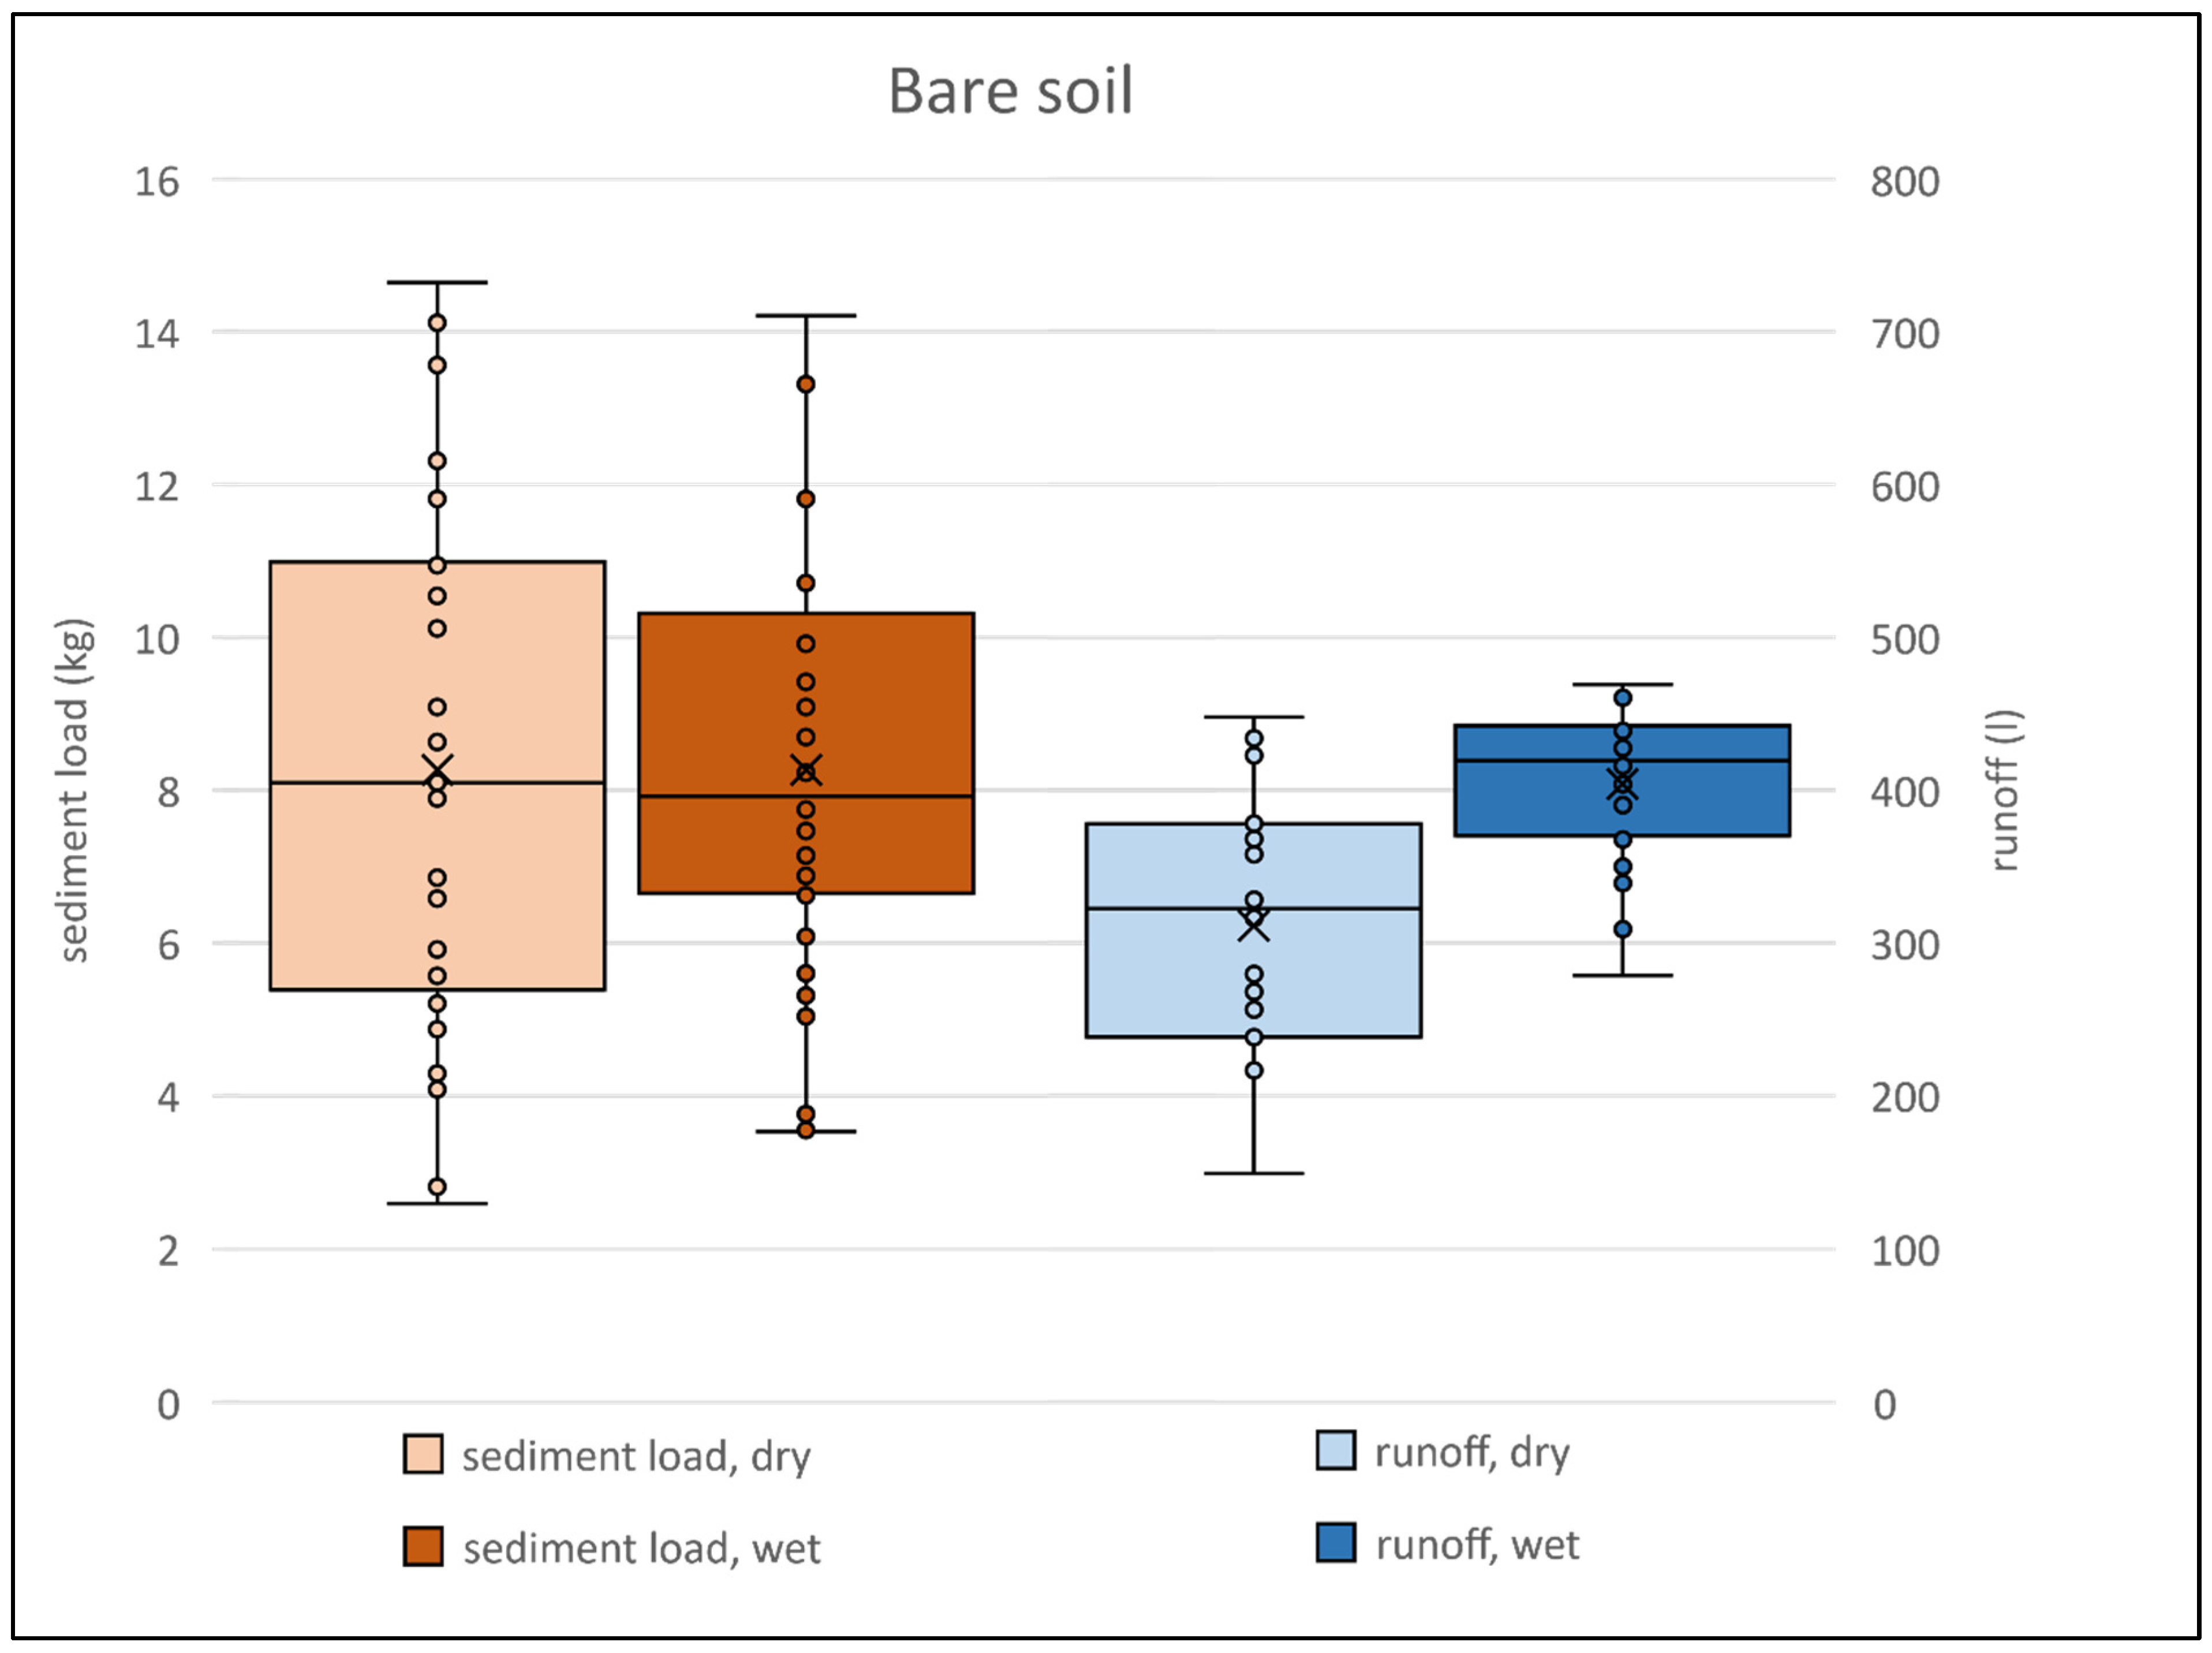
3.1. Bare Soil, Cumulative Values

The results of a total of 71 successful runs on bare soil, combined dry and wet conditions are presented in Figure 2. There is greater variability with dry soil in both sediment load and runoff. This can be explained by the different surface conditions (e.g., the initial water content) and can be confirmed by the coefficient of variation (see Table 3). Transported sediment has greater variability than surface runoff. The data have a normal distribution, according to the D’Agostino-Pearson test at α = 0.05. The average amount of sediment transported is 8.3 kg per experiment. The area of the experimental plot is 16 m2, which corresponds to a soil loss of 5.19 Mg·ha−1 after 30 min of rainfall. The average total runoff for wet soil conditions is 1.3 times higher than for dry soil. Erosive storms targeting pre-saturated bare soils after initial rainfall (or in wet weather periods) can therefore cause a significantly higher outflow response than in moderate soil conditions. However, as regards sediment transport, the risk of high soil loss is much the same, leading to similar sediment fluxes, regardless of the initial soil moisture. The sediment transport depends mainly on the initial soil surface status (bare surface and freshly tilled surface as the worst case). As shown in Figure 3 and Figure 4, the sharpest increase in runoff is reached for wet soil, and the runoff reaches a higher stable value than during the dry experiment.

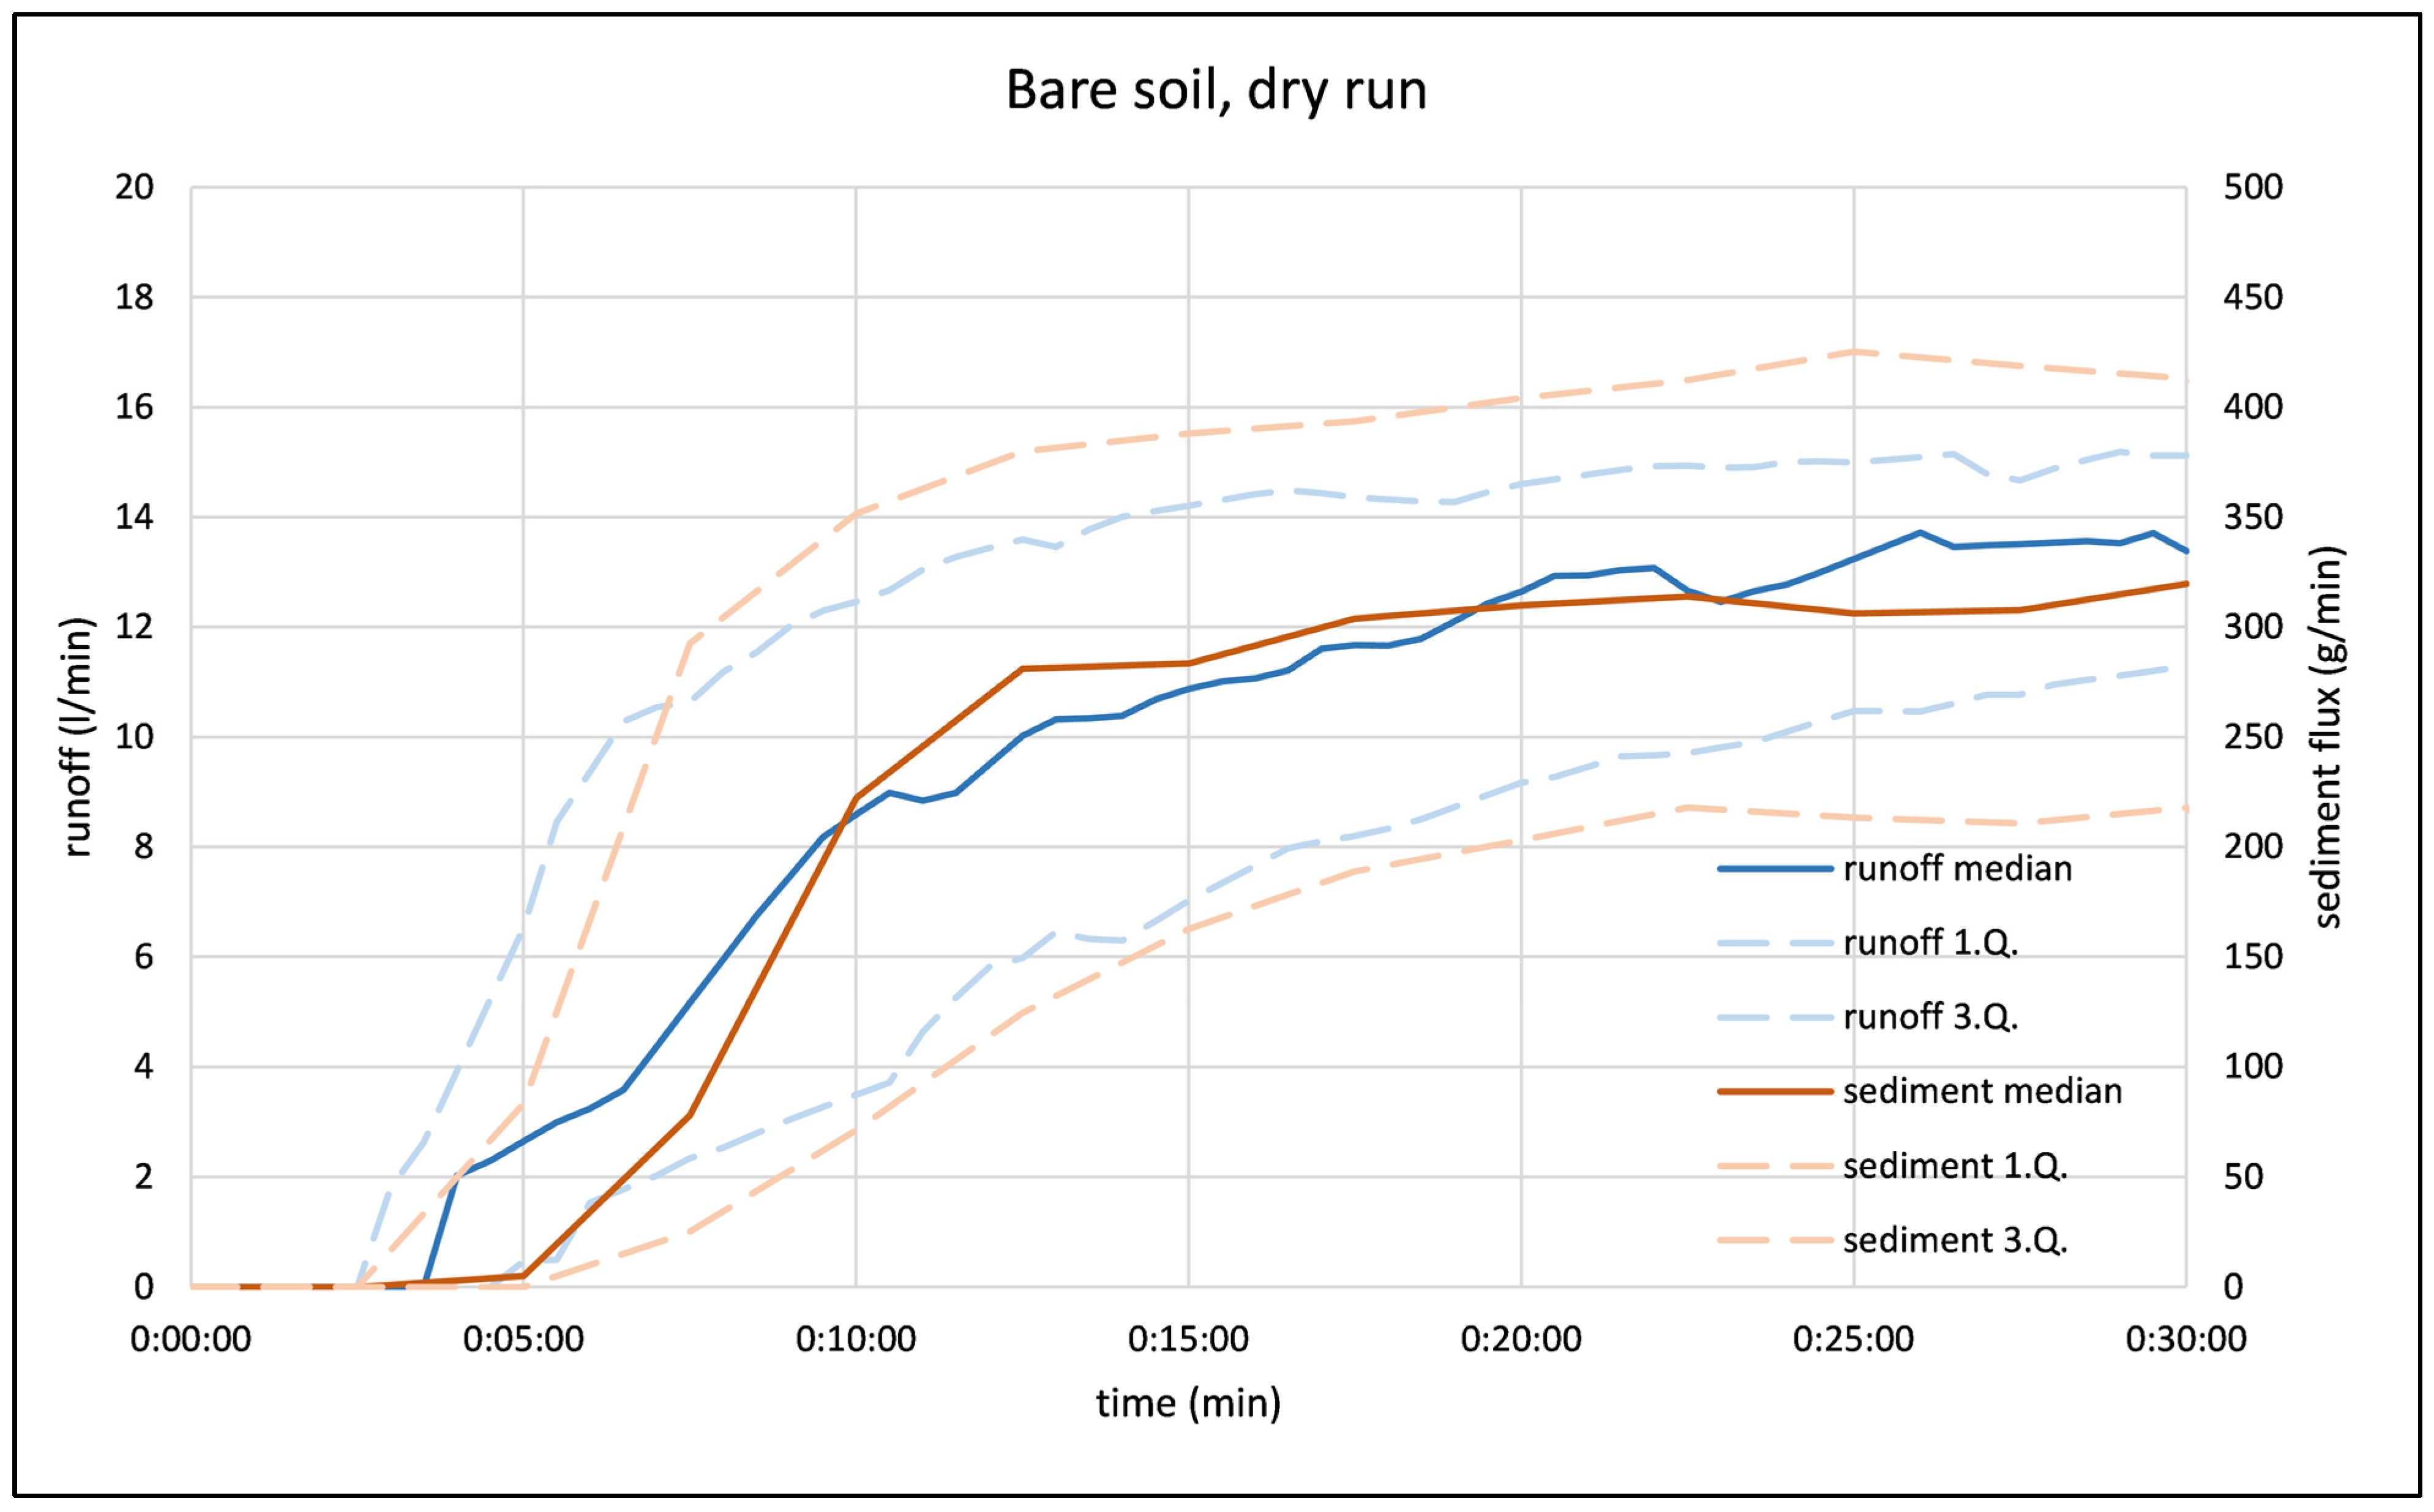
3.2. Bare Soil, Dry Run Waveforms

The runoff and sediment curves are presented as the medians of dry runs of 71 experiments (solid lines). The curves of the 1st and 3rd quartiles are drawn (dashed lines). Surface runoff begins in the fourth minute of simulation, and slowly climbs to a rate of 13.5 L·min−1 after 20 min. The standard deviation decreases from 4–5 L·min−1 to 2.5 L·min−1 at the end of the simulation. The amount of sediment transported increases more slowly than the runoff, and reaches a stable rate of 315 g·min−1 in the 17th minute. The slower rise is more visible in dry conditions, and can be explained by the delay between surface runoff and actual soil disturbance.

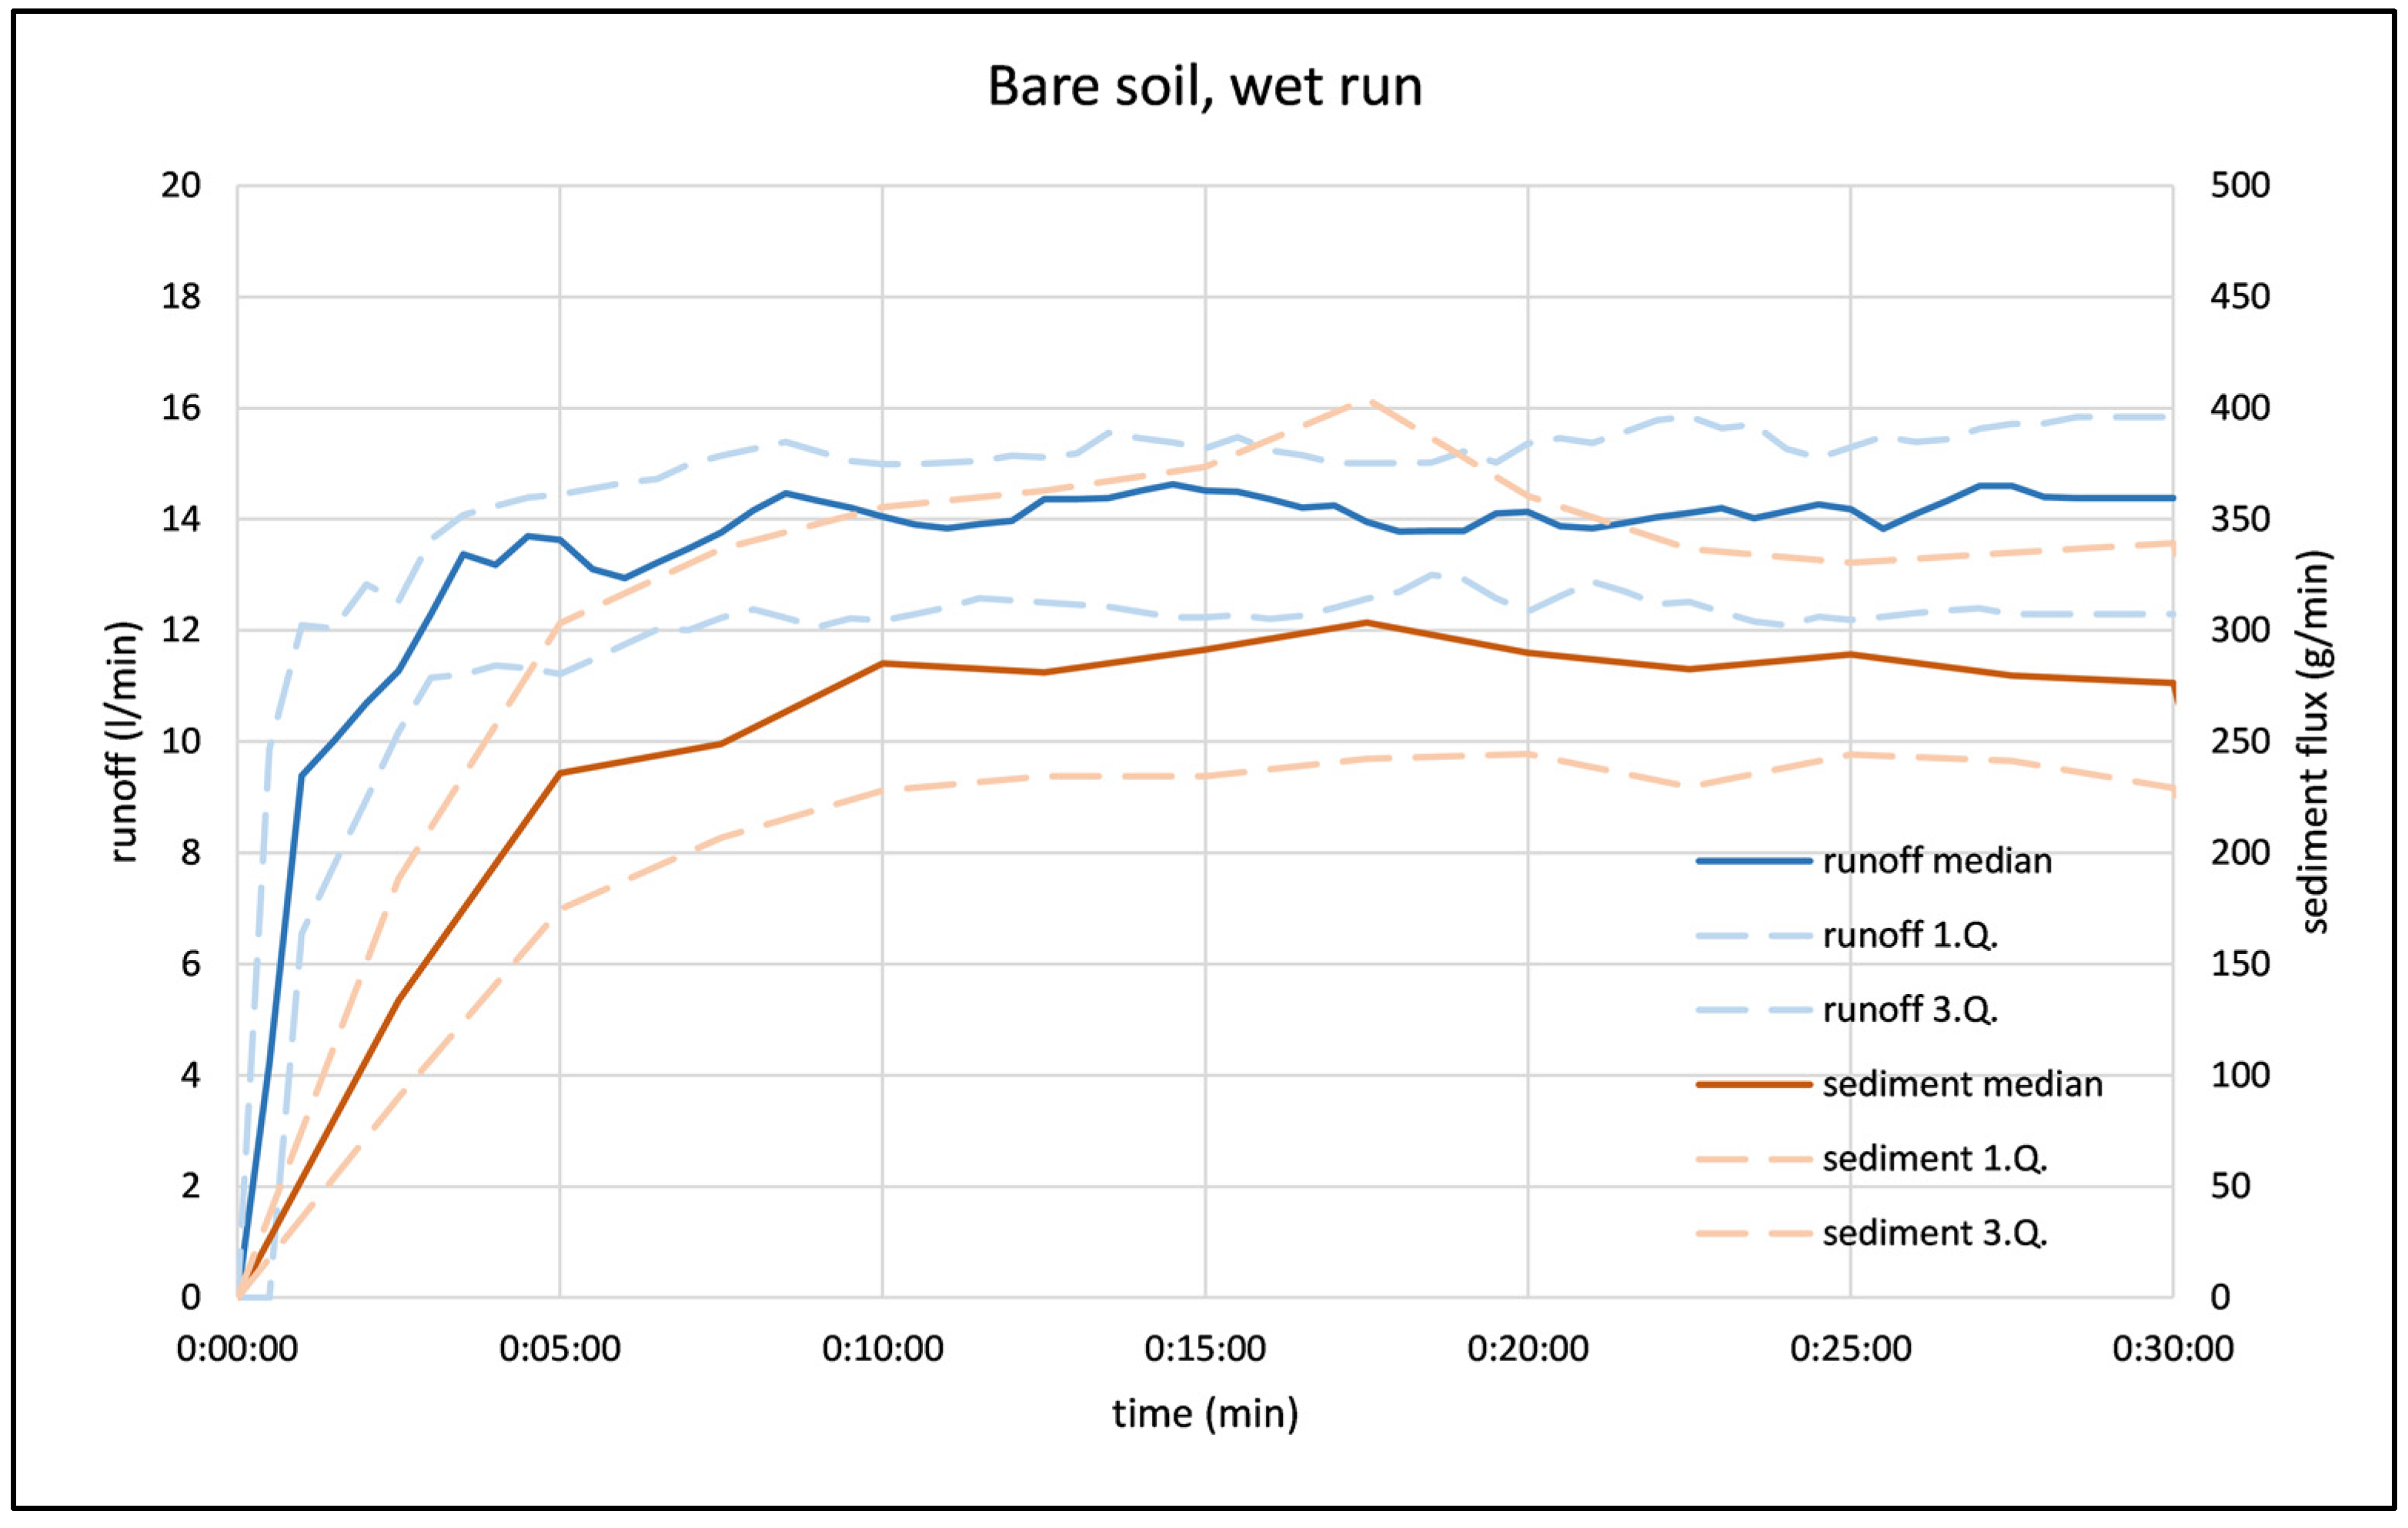
3.3. Bare Soil, Wet Run Waveforms

With fully saturated soil conditions (wet run), surface runoff starts during the first minute of rainfall simulation. The runoff rate rises sharply up to the fifth minute, when the stable runoff rate follows the previous dry run at a level of 13.5 L·min−1. Shortly after, the runoff stabilizes at 14 L·min−1. The standard deviation for the entire run is less than 2 L·min−1, which means that the conditions of every wet run are more consistent than the conditions of the dry runs. The rate of sediment transport increases with the start of runoff, but the rate is less steep. The sediment transport stabilizes in the 10th minute at a rate of 280 g·min−1, which is 10% less than for a dry run.

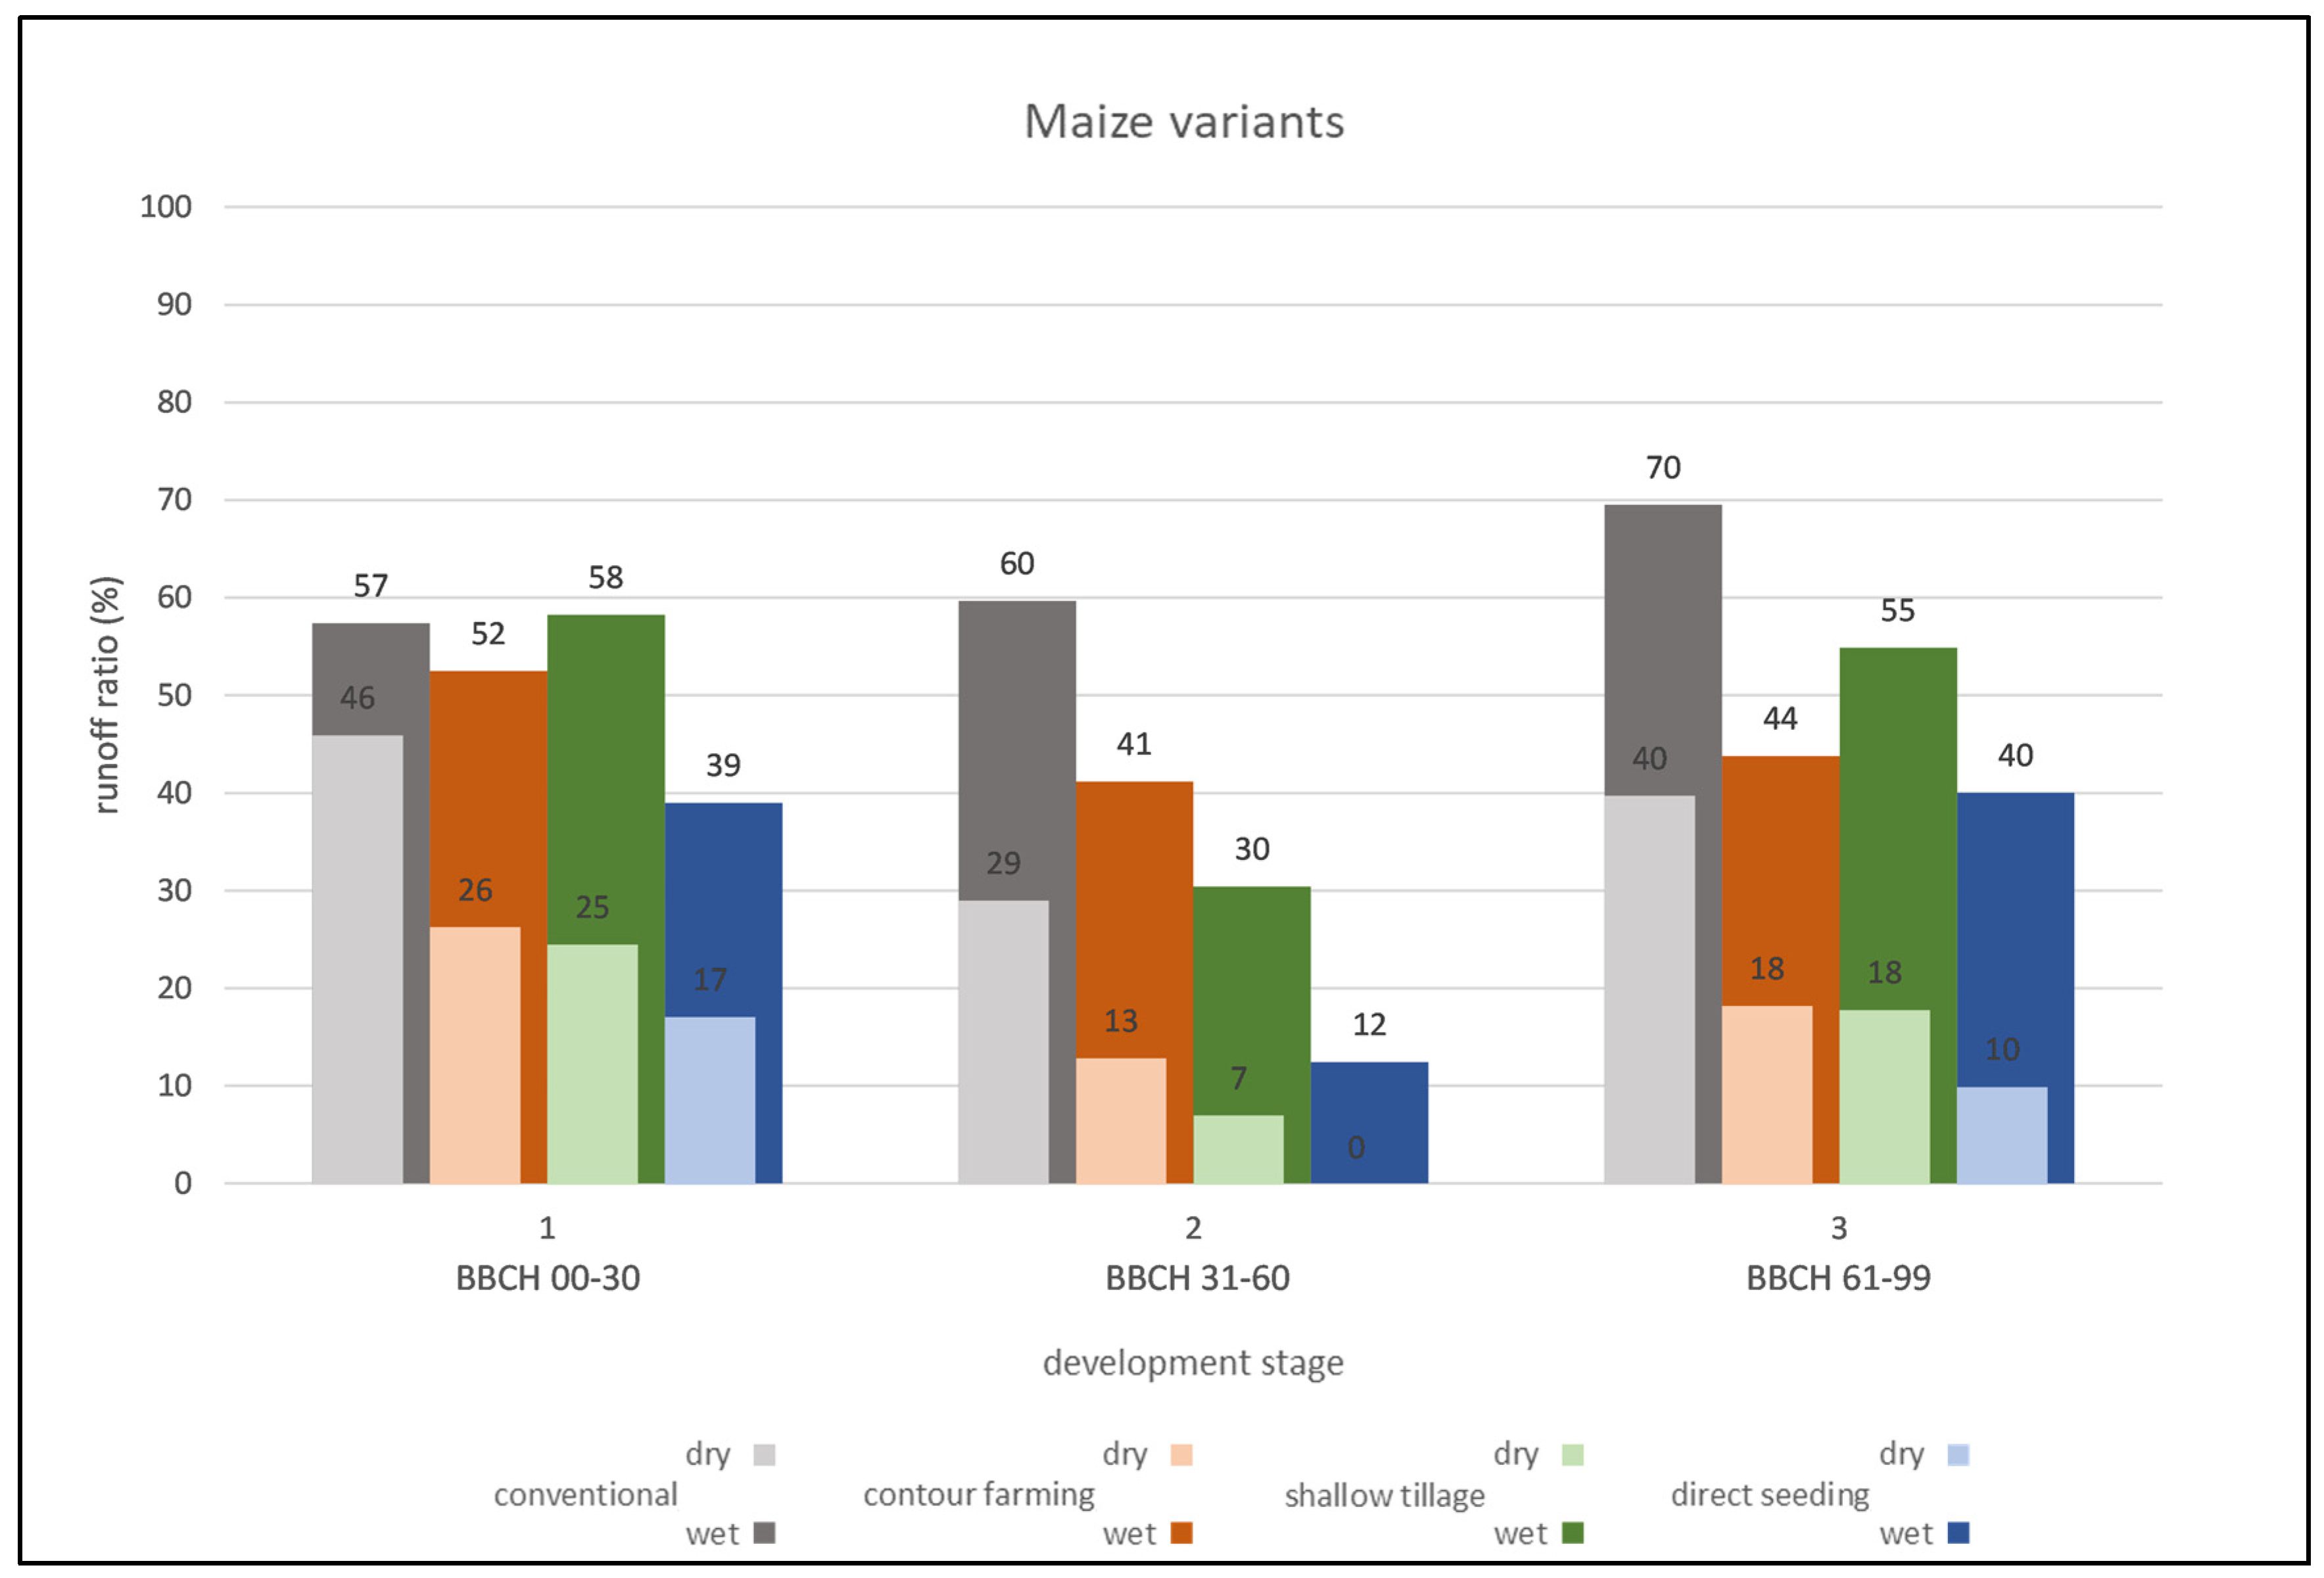
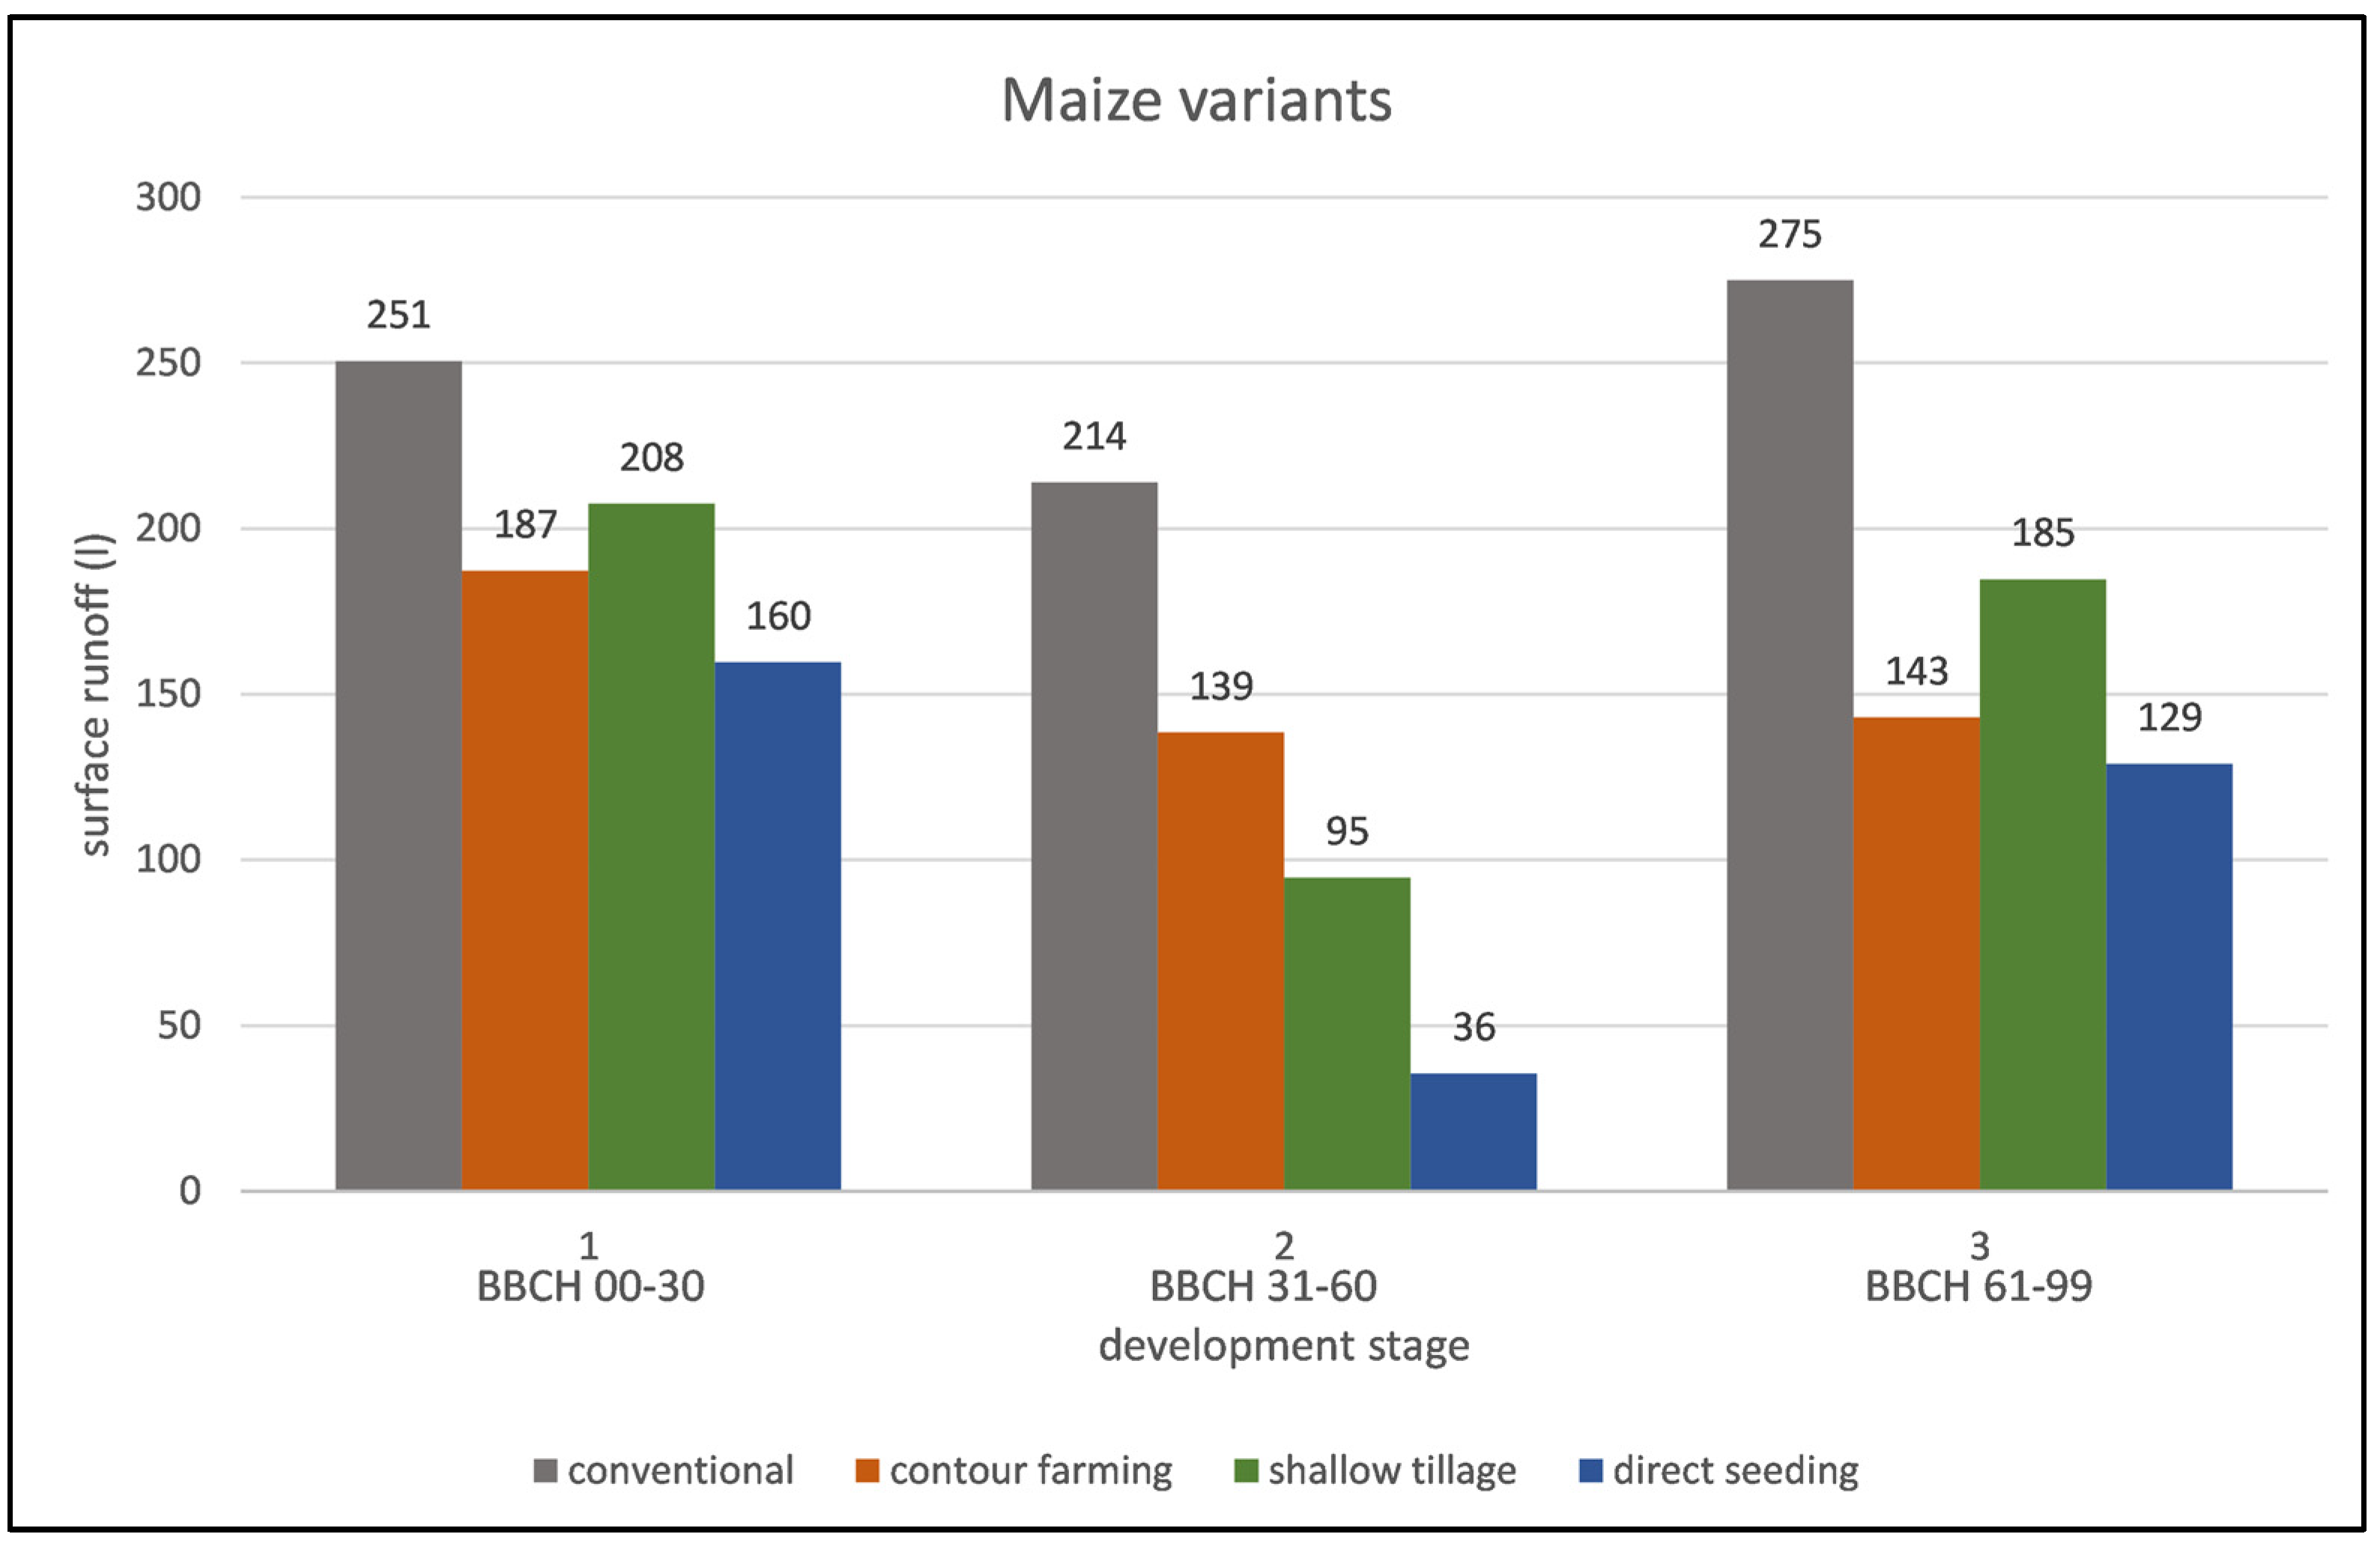
3.4. Maize Scenarios, Rainfall-Runoff Relations

Four variants were tested on maize: conventional farming, followed by three soil conservation scenarios. The results for 3 BBCH stages of plant development are presented. The length of the experiment varies depending on the initiation of surface runoff. The average length of an experimental run on a maize plot is 33 min. This means that roughly 500 L of rain is released on the 16 m2 experimental plot. The total runoff from the bare soil plot is 358 l, and even basic conventional maize farming reduces the runoff by 31% to a seasonal average of 247 L. The use of soil conservation technologies can reduce the runoff (compared with conventional technology) by 38% for contour farming and shallow tillage, and by 66% for direct seeding (Figure 5).
The runoff ratio is the ratio of the total surface runoff from the experimental area divided by the rainfall precipitation for the duration of the experiment. The rainfall intensity was set to 60 mm·h−1, which corresponds to 960 L·h−1 (the plot has an area of 16 m2). Figure 6 shows that the retention effect of soil conservation technology is most significant in dry soil conditions. The runoff ratio in direct seeding is only 20% by the dry/wet average, whereas contour farming and shallow tillage reach levels around 33%. Conventional technology has a runoff ratio of 50% and for bare soil the ratio is 50–65% in dry conditions and 80–90% in wet conditions.

3.5. Maize Scenarios, Soil Loss and Sediment Transport

In terms of sediment transport, the effect of soil conservation technology is more apparent. For conventional maize farming, there is an average of 2.7 kg of transported sediment. Contour farming reduces the amount of transported sediment by 70% to 0.9 kg, shallow tillage reduces the amount by 85% to 0.4 kg and direct seeding reduces the amount by 96% to 0.1 kg of transported sediment. Soil conservation technology mainly protects the soil from rainfall disturbance and has a lesser effect on reducing runoff. Lower runoff can be observed in Figure 5, and lower sediment transport can be observed in Figure 7, during the second BBCH stage (BBCH 31 to 61), related to the development of the maize plant. The plant has the biggest leaf area during this stage [30].
To derive the C-factor, we must first measure the SLR for each plant development stage (represented by BBCH). SLR values can also be compared with other experimental studies. The C-factor values officially used in design projects in the Czech Republic are similar to the results obtained by our experiments. Only the shallow tillage has a C-factor that is 2.5 times lower than the value currently used. Table 4 shows that there is a high standard deviation. This is common for nature-based experiments, because of the associated uncertainties and the small number of replications.

4. Discussion

4.1. Intercomparability of Rainfall Experiments on Bare Soil

The way to determine the crop cover factor is based on a comparison between a bare soil plot and a vegetation plot. There is a large dataset of measurements on bare soil, with very similar conditions. The only varying conditions are soil moisture, soil texture, temperature, and soil surface preparation. Soil moisture is measured during every experiment, but no correlation was found between soil moisture and soil loss or runoff [38]. Because of the mixing of the soil surface during plot preparation, the soil texture does not change during the season. Soil preparation also aims to produce similar sample compaction and surface roughness (using a roller), but is slightly affected by the initial soil moisture. Despite the difficulty of performing outdoor experiments, where the conditions are not controlled, we have achieved similar and stable results (see Table 3).
Our aim would be to create average runoff and average soil loss curves on bare soil. These values could be used as a standard with no need for further replication, or they could be used to replace a defective experiment [39]. Only a small number of published series of similar experiments focused on replicability are available for comparisons. A series of experiments was carried out on clementine plantations in Spain, and bare soil was used as a reference plot. In total, 20 runs were performed on a smaller plot (0.28 m2) with a lower rainfall intensity (38.8 mm·h−1). The variation coefficient was 26.8 for sediment transport and 9 for runoff [40]. There was therefore twice as much similarity as in the case of our result which was probably due to the smaller size of the plot. The plot area affects sediment yield and runoff generation as proved in rainfall experiment in vineyards [41].

4.2. Effectiveness of Soil Conservation Techniques

The use of soil conservation technologies in agriculture is one way to reduce runoff and soil erosion. All the data in this chapter compares a soil conservation technique with conventional farming practice. The technically easiest technique is contour farming. Our results showed that contour farming can reduce runoff by 38% compared to conventional farming in Czech conditions. Runoff reduction by 10% on maize has been reported by Carvalho et al. [42] and by Barbosa et al. [43]. Carvalho et al. [42] also observed a greater reduction effect with the crop growth, compared with our results (see Figure 5). Barbosa et al. [43] used several variants of crop residues, but without differences in runoff. Contour farming on oats and on vetch was tested by Luciano et al. [44]. They observed runoff reduction by a third on oats and by a half on vetch. All authors used a rainfall intensity similar to that used in our study. Contour farming can also delay the moment of surface runoff formation, as proven by Zhang et al. [45] and by Luciano et al. [44]. With this farming technology, we observed a significant reduction of 70% in the transported sediment. Carvalho et al. [42] did not observe differences between conventional and contour farming. However, Luciano et al. [44] reported a 52% sediment reduction in vetch, and a 10% reduction in oats.
Another group of soil conservation techniques is the use of cover crops. They are seeded before the main crop, usually with the intention of improving the soil quality, or as forage, or using the residues for soil protection. In this case, the crop is desiccated, mulched, and with shallow tillage it is mixed with the top layer of the soil. Finally, the main crop is seeded. In the paper presented here, this technique is referred to as ‘shallow tillage’. Shallow tillage reduces runoff by 38% compared to the conventional technique. Volk and Cogo [46] reported a 44% reduction in runoff. By contrast, Beniston et al. [47] did not observe any reduction in runoff on their plots. Shallow tillage is more efficient, and reduces sediment transport by 85% This is consistent with the work of Volk and Cogo [46], who reported a 90% reduction. Values similar to these have been reported by Beniston et al. [47], who reported a 58% reduction in sediment transport. Clymans et al. [48], by contrast, reported a 54% increase in transported sediment compared to conventional techniques. This is not ideal, but almost every result shows high standard deviation, due to the unpredictable conditions of outdoor measurements. This unpredictability is exemplified by experiments carried out by Hösl and Strauss [49] in two consecutive years. They used similar farming techniques, but for runoff they observed a 97% increase in the first year and an 81% reduction in the second year. In the case of transported sediment, they observed a 12% increase in the first year and a 93% reduction in the second year. Apparently, there was a problem with the mixture and the growth of the cover crop.
Alternatively, it is possible to skip mixing residues with soil, and instead seed directly into the terminated cover crop. In this paper, this is referred to as ‘direct seeding’, and it is comparable with the no-till plots referred to in the papers of other researchers. This technology proved to have the most reducing effect on runoff and sediment transport. In our case, it reduced runoff by 67%. This is similar to the values reported by others: 55% by Leite et al. [50], 66% by Beniston et al. [47], and 62% by Hösl and Strauss [49]. Volk and Cogo [46], however, reported a 38% reduction, or only 5% with the use of double-disk opener technology. Similarly, Boye and Albrecht [51] observed only 20% runoff reduction, in comparison with conventional technology. When direct seeding was applied, we reduced the sediment transport by 96%. Leite et al. [50], Beniston et al. [47], Volk and Cogo [46] and Hösl and Strauss [49] confirmed and proved that no-till technology has a greater effect on sediment transport than the amount of surface runoff. This contrasts with the findings by Boye and Albrecht [51], whose results showed a 20% increase in sediment transport on sandy loam soil and a 16% decrease on clay soil. These unexpected results may be due to the use of a smaller plot and more intense rainfall.

4.3. Experimentally Derived C-Factor Values

In the Czech Republic, the officially used C-factor was adopted by Janeček et al. [52] from the original values of Wischmeier and Smith [25]. For the case of maize, we have measured slightly lower values of the C-factor. Conventional farming has an ‘official’ value of 0.49 for maize, but we measured 0.36. For shallow tillage the official value would be 0.21 and we measured 0.09. In the case of other technologies, the results differ to a smaller extent. These values are valid if the soil conservation technology is applied properly, which is often difficult to achieve.
In other countries, C-factor values are also being updated. For maize farmed conventionally, Lima et al. [53] reported a higher SLR (0.535),while the calculation produced a very low C-factor of 0.08. Similar values for conventional farming were presented by Alberts, Wendt, and Burwell [54], followed by 0.04 for shallow tillage and 0.01 for no-till technology. However, both research teams calculated their C-factor values using the actual intensity of natural rainfall during the experimental season, and not the long-term averages.

5. Conclusions

The rainfall-runoff relation is much easier to replicate than the actual sediment transport, even in the bare soil conditions. The results of the 71 fallow plot experiments showed that in initial plot conditions (‘dry’ experiments) the runoff ratio is 62%, and the coefficient of variation is 25%. For saturated conditions (‘wet’ experiments) the runoff ratio increases to 81%. The coefficient of variation drops to 12%. From these values, it can be concluded that the intercomparability and variability of rainfall simulator experiments is better under more comparable conditions of ‘wet’ experiments.
Regarding soil loss and sediment transport, the variations are greater, due to the greater complexity of the soil erosion process [55,56]. The results of the 71 fallow plot experiments showed that soil loss after 30-33 min of intensive rainfall caused only by sheet erosion on an 8 m long plot is equivalent of 5.19 Mg·ha−1. The coefficients of variation were 42% and 32% for ‘dry’ and ‘wet’ conditions, respectively. This shows that the variability of soil loss is almost two times higher than the variability of runoff volume.
Our data have shown that soil protection techniques have a significant effect on runoff reduction. While conventionally seeded maize shows a runoff ratio of 50% on the ‘dry’ and ‘wet’ average, soil conservation techniques reduce it to 33%, 32% and 20% for contour farming, shallow tillage, and direct seeding, respectively. We must take into consideration the above-mentioned ca 25% variability of such results. The lower runoff ratio means less surface runoff and therefore lower stream power, leading to less soil erosion. This makes the reduction in soil loss by soil conservation techniques apparent. Conventionally seeded maize generated, on average, 2.7 kg of transported sediment, which is equivalent to 1.63 Mg·ha−1 (plot size 16 m2). The use of soil conservation techniques reduces it to 0.54 Mg·ha−1, 0.25 Mg·ha−1 and 0.09 Mg·ha−1 for contour farming, shallow tillage, and direct seeding, respectively.
Due to the greater variability, it is a challenge to compute the C-factor from a limited set of experiments. Nevertheless, analyses of soil loss ratios have proved the effectiveness of soil conservation techniques concerning sediment transport. The C-factor values derived in our experiments are lower than the officially used values by 25%, except for the shallow tillage variant, which is lower by 55%. In all these cases, we must take into account the approximately 40% uncertainty of the values based on the variability detected in the fallow plot experiments.
For many crops and for many tillage variants, we still do not have enough replications to avoid excessive uncertainties and to be able to prove the actual effectiveness of the tested techniques. Nevertheless, the experiments have given us much valuable experience, have helped us to develop our method and to improve our future crop factor evaluation techniques. Our experience indicates that rainfall-runoff measurements and experiments are the most practical available approach for evaluating agricultural management techniques.

Author Contributions

Conceptualization, J.S. and J.K.; methodology, J.S.; formal analysis, J.S.; investigation, J.S., J.K., M.M. and J.D.; data curation, J.S.; writing—original draft preparation, J.S. and J.K.; writing—review and editing, J.D., T.S. and J.M.; visualization, J.S.; supervision, T.D.; project administration, J.K.; funding acquisition, M.M. All authors have read and agreed to the published version of the manuscript.

Funding

This research presented here was funded by the Ministry of Agriculture of the Czech Republic (NAZV, Grant Number QK1920224 and QK22010261); by H2020 project TUdi (101000224); and by the Grant Agency of the Czech Technical University in Prague (SGS20/156/OHK1/3T/11).

Data Availability Statement

Not applicable.

Conflicts of Interest

The authors declare no conflict of interest.

References

  1. Panagos, P.; Imeson, A.; Meusburger, K.; Borrelli, P.; Poesen, J.; Alewell, C. Soil Conservation in Europe: Wish or Reality? Land Degrad. Dev. 2016, 27, 1547–1551. [Google Scholar] [CrossRef]
  2. Poesen, J. Soil erosion in the Anthropocene: Research needs. Earth Surf. Process. Landforms 2017, 43, 64–84. [Google Scholar] [CrossRef]
  3. GAEC Database—European Commission. Available online: https://marswiki.jrc.ec.europa.eu/gaec/index.php (accessed on 30 May 2022).
  4. Borrelli, P.; Panagos, P. An indicator to reflect the mitigating effect of Common Agricultural Policy on soil erosion. Land Use Policy 2020, 92, 104467. [Google Scholar] [CrossRef]
  5. Panagos, P.; Ballabio, C.; Poesen, J.; Lugato, E.; Scarpa, S.; Montanarella, L.; Borrelli, P. A Soil Erosion Indicator for Supporting Agricultural, Environmental and Climate Policies in the European Union. Remote. Sens. 2020, 12, 1365. [Google Scholar] [CrossRef]
  6. Macháč, J.; Trantinová, M.; Zaňková, L. Externalities in agriculture: How to include their monetary value in decision-making? Int. J. Environ. Sci. Technol. 2020, 18, 3–20. [Google Scholar] [CrossRef]
  7. Ricci, G.; Jeong, J.; De Girolamo, A.; Gentile, F. Effectiveness and feasibility of different management practices to reduce soil erosion in an agricultural watershed. Land Use Policy 2019, 90, 104306. [Google Scholar] [CrossRef]
  8. Van Rompaey, A.; Krasa, J.; Dostal, T. Modelling the impact of land cover changes in the Czech Republic on sediment delivery. Land Use Policy 2007, 24, 576–583. [Google Scholar] [CrossRef]
  9. Devátý, J.; Dostál, T.; Hösl, R.; Krása, J.; Strauss, P. Effects of historical land use and land pattern changes on soil erosion—Case studies from Lower Austria and Central Bohemia. Land Use Policy 2019, 82, 674–685. [Google Scholar] [CrossRef]
  10. Boardman, J.; Poesen, J. Soil Erosion in Europe: Major Processes, Causes and Consequences. In Soil Erosion in Europe; John Wiley & Sons, Ltd.: Chichester, UK, 2006; pp. 477–487. ISBN 9780470859100. [Google Scholar]
  11. Krasa, J.; Dostal, T.; Vrana, K.; Plocek, J. Predicting spatial patterns of sediment delivery and impacts of land-use scenarios on sediment transport in Czech catchments. Land Degrad. Dev. 2009, 21, 367–375. [Google Scholar] [CrossRef]
  12. Farms and Farmland in the European Union—Statistics. Available online: https://ec.europa.eu/eurostat/statistics-explained/index.php?title=Farms_and_farmland_in_the_European_Union_-_statistics (accessed on 30 May 2022).
  13. Knápek, J.; Vávrová, K.; Králík, T.; Outrata, D. Biomass potential—Theory and practice: Case example of the Czech Republic region. Energy Rep. 2020, 6, 292–297. [Google Scholar] [CrossRef]
  14. Maitah, M.; Malec, K.; Maitah, K. Influence of precipitation and temperature on maize production in the Czech Republic from 2002 to 2019. Sci. Rep. 2021, 11, 10467. [Google Scholar] [CrossRef]
  15. Novotný, I.; Žížala, D.; Kapička, J.; Beitlerová, H.; Mistr, M.; Kristenová, H.; Papaj, V. Adjusting the CPmax factor in the Universal Soil Loss Equation (USLE): Areas in need of soil erosion protection in the Czech Republic. J. Maps 2016, 12, 58–62. [Google Scholar] [CrossRef]
  16. Fiener, P.; Dostál, T.; Krása, J.; Schmaltz, E.; Strauss, P.; Wilken, F. Operational USLE-Based Modelling of Soil Erosion in Czech Republic, Austria, and Bavaria—Differences in Model Adaptation, Parametrization, and Data Availability. Appl. Sci. 2020, 10, 3647. [Google Scholar] [CrossRef]
  17. Auerswald, K.; Kainz, M.; Fiener, P. Soil erosion potential of organic versus conventional farming evaluated by USLE modelling of cropping statistics for agricultural districts in Bavaria. Soil Use Manag. 2003, 19, 305–311. [Google Scholar] [CrossRef]
  18. Morgan, R.P.C.; Nearing, M.A. Handbook of Erosion Modelling; Morgan, R.P.C., Nearing, M.A., Eds.; Wiley: Hoboken, NJ, USA, 2010; ISBN 9781405190107. [Google Scholar]
  19. Van Oost, K.; Van Rompaey, A.; Poesen, J.; Govers, G.; Verstraeten, G. Evaluating an integrated approach to catchment management to reduce soil loss and sediment pollution through modelling. Soil Use Manag. 2002, 18, 386–394. [Google Scholar] [CrossRef]
  20. Farhan, Y.; Nawaiseh, S. Spatial assessment of soil erosion risk using RUSLE and GIS techniques. Environ. Earth Sci. 2015, 74, 4649–4669. [Google Scholar] [CrossRef]
  21. Arsenault, É.; Bonn, F. Evaluation of soil erosion protective cover by crop residues using vegetation indices and spectral mixture analysis of multispectral and hyperspectral data. Catena 2005, 62, 157–172. [Google Scholar] [CrossRef]
  22. Maetens, W.; Poesen, J.; Vanmaercke, M. How effective are soil conservation techniques in reducing plot runoff and soil loss in Europe and the Mediterranean? Earth-Sci. Rev. 2012, 115, 21–36. [Google Scholar] [CrossRef]
  23. Strudley, M.W.; Green, T.R.; Ascough, J.C., II. Tillage effects on soil hydraulic properties in space and time: State of the science. Soil Tillage Res. 2008, 99, 4–48. [Google Scholar] [CrossRef]
  24. Menšík, L.; Kincl, D.; Nerušil, P.; Srbek, J.; Hlisnikovský, L.; Smutný, V. Water Erosion Reduction Using Different Soil Tillage Approaches for Maize (Zea mays L.) in the Czech Republic. Land 2020, 9, 358. [Google Scholar] [CrossRef]
  25. Wischmeier, W.H.; Smith, D.D. Predicting Rainfall Erosion Losses: A Guide to Conservation Planning; USDA, Science and Education Administration: Washington, SC, USA, 1978.
  26. Renard, K.; Foster, G.; Weesies, G.; McCool, D.; Yoder, D. Predicting Soil Erosion by Water: A Guide to Conservation Planning with the Revised Universal Soil Loss Equation (RUSLE); US Department of Agriculture: Washington, DC, USA, 1997; ISBN 0160489385.
  27. Kavka, P.; Strouhal, L.; Jáchymová, B.; Krása, J.; Báčová, M.; Laburda, T.; Dostál, T.; Devátý, J.; Bauer, M. Double size fulljet field rainfall simulator for complex interrill and rill erosion studies. Civ. Eng. J. 2018, 27, 183–194. [Google Scholar] [CrossRef]
  28. Czech Geological Survey Geological Map 1:25,000. Available online: https://mapy.geology.cz/geocr50/ (accessed on 10 December 2022).
  29. Zádorová, T.; Žek, V.P. Formation, morphology and classification of colluvial soils: A review. Eur. J. Soil Sci. 2018, 69, 577–591. [Google Scholar] [CrossRef]
  30. Meier, U.; Feller, C.; Bleiholder, H.; Frau, E.; Hess, M.; Wicke, H.; van den Boom, T.; Stauss, R.; Klose, R.; Hack, H.; et al. Growth Stages of Mono-and Dicotyledonous Plants. BBCH Monograph; Meier, U., Ed.; Open Agrar Repositorium: Quedlinburg, Germany, 2018; ISBN 978-3-95547-071-5. [Google Scholar]
  31. Davidová, T.; Dostál, T.; David, V.; Strauss, P. Determining the protective effect of agricultural crops on the soil erosion process using a field rainfall simulator. Plant Soil Environ. 2015, 61, 109–115. [Google Scholar] [CrossRef]
  32. Beitlerová, H.; Lenz, J.; Devátý, J.; Mistr, M.; Kapička, J.; Buchholz, A.; Gerndtová, I.; Routschek, A. Improved calibration of the Green–Ampt infiltration module in the EROSION-2D/3D model using a rainfall-runoff experiment database. Soil 2021, 7, 241–253. [Google Scholar] [CrossRef]
  33. Devátý, J.; Beitlerová, H.; Lenz, J. An Open Rainfall-Runoff Measurement Database. In Proceedings of the EGU General Assembly 2020, Online, 4–8 May 2020. [Google Scholar]
  34. Hanel, M.; Máca, P.; Bašta, P.; Vlnas, R.; Pech, P. The rainfall erosivity factor in the Czech Republic and its uncertainty. Hydrol. Earth Syst. Sci. 2016, 20, 4307–4322. [Google Scholar] [CrossRef]
  35. Mistr, M.; Dostál, T.; Krása, J.; Zumr, D.; Roudnická, A.; Stašek, J.; Strouhal, L.; Novotný, I.; Mistr, M.; Novotný, I. Faktor Ochranného Vlivu Vegetace Jako Významná Součást Protierozní Ochrany Zemědělské Půdy [Applied Certified Methodology]; Ministry of Agriculture: Prague, Czech Republic, 2018; ISBN 9788087361931.
  36. Novotný, I.; Holub, J.; Mistr, M.; Juřicová, A.; Drozen, M. Protierozní Kalkulačka. Available online: https://kalkulacka.vumop.cz/ (accessed on 24 April 2020).
  37. Mistr, M.; Krása, J.; Štrobach, J.; Janoušek, Z.; Novotný, I.; Žížala, D.; Kapička, J.; Stašek, J.; Dostál, T.; Roudnická, A.; et al. Metodika Ochrany Půdy Před Erozí Pomocí Zemědělských Postupů Příznivých pro Klima a Životní Prostředí; Výzkumný ústav meliorací a ochrany půdy, v.v.i.: Prague, Czech Republic, 2021. [Google Scholar]
  38. Roudnická, A.; Dostál, T.; Krása, J.; Mistr, M.; Novotný, I.; Zumr, D.; Kavka, P.; Neumann, M.; Stašek, J. Způsob Stanovení Ochranného Vlivu Vegetace Před Erozí Půdy Pomocí Mobilního Dešťového Simulátoru. Vodní Hospodářství 2018, 68, 22–27. [Google Scholar]
  39. Stašek, J. Řisuty Experimental Area—6 Years of Experiments. In Proceedings of the 3rd Workshop on Soil Physics and Landscape Hydrology; Faculty of Civil Engineering, CTU in Prague: Desná, Czech Republic, 2021. [Google Scholar]
  40. Keesstra, S.; Rodrigo-Comino, J.; Novara, A.; Giménez-Morera, A.; Pulido, M.; Di Prima, S.; Cerdà, A. Straw mulch as a sustainable solution to decrease runoff and erosion in glyphosate-treated clementine plantations in Eastern Spain. An assessment using rainfall simulation experiments. Catena 2019, 174, 95–103. [Google Scholar] [CrossRef]
  41. Neumann, M.; Kavka, P.; Devátý, J.; Stašek, J.; Strouhal, L.; Tejkl, A.; Kubínová, R.; Rodrigo-Comino, J. Effect of plot size and precipitation magnitudes on the activation of soil erosion processes using simulated rainfall experiments in vineyards. Front. Environ. Sci. 2022, 10. [Google Scholar] [CrossRef]
  42. De Carvalho, D.F.; Eduardo, E.N.; De Almeida, W.S.; Santos, L.A.F.; Sobrinho, T.A. Water erosion and soil water infiltration in different stages of corn development and tillage systems. Rev. Bras. Eng. Agrícola Ambient. 2015, 19, 1072–1078. [Google Scholar] [CrossRef]
  43. Barbosa, F.T.; Bertol, I.; Werner, R.D.S.; Ramos, J.C.; Ramos, R.R. Comprimento crítico de declive relacionado à erosão hídrica, em três tipos e doses de resíduos em duas direções de semeadura direta. Rev. Bras. Ciência Solo 2012, 36, 1279–1290. [Google Scholar] [CrossRef]
  44. Luciano, R.V.; Bertol, I.; Barbosa, F.T.; Vázquez, E.V.; Fabian, E.L. Perdas de água e solo por erosão hídrica em duas direções de semeadura de aveia e ervilhaca. Rev. Bras. Ciência Solo 2009, 33, 669–676. [Google Scholar] [CrossRef]
  45. Zhang, W.; Yu, D.-S.; Shi, X.-Z.; Tan, M.-Z.; Liu, L.-S. Variation of Sediment Concentration and Its Drivers Under Different Soil Management Systems. Pedosphere 2010, 20, 578–585. [Google Scholar] [CrossRef]
  46. Volk, L.B.D.S.; Cogo, N.P. Erosão hídrica, em três momentos da cultura do milho, influenciada por métodos de preparo do solo e semeadura. Rev. Bras. Ciência Solo 2014, 38, 565–574. [Google Scholar] [CrossRef]
  47. Beniston, J.W.; Shipitalo, M.J.; Lal, R.; Dayton, E.A.; Hopkins, D.W.; Jones, F.; Joynes, A.; Dungait, J.A.J. Carbon and macronutrient losses during accelerated erosion under different tillage and residue management. Eur. J. Soil Sci. 2014, 66, 218–225. [Google Scholar] [CrossRef]
  48. Clymans, W.; Struyf, E.; Putte, A.V.D.; Langhans, C.; Wang, Z.; Govers, G. Amorphous silica mobilization by inter-rill erosion: Insights from rainfall experiments. Earth Surf. Process. Landforms 2015, 40, 1171–1181. [Google Scholar] [CrossRef]
  49. Hösl, R.; Strauss, P. Conservation tillage practices in the alpine forelands of Austria—Are they effective? Catena 2016, 137, 44–51. [Google Scholar] [CrossRef]
  50. Leite, D.; Bertol, I.; Guadagnin, J.C.; Santos, E.J.; Ritter, S.R. Erosão hídrica em um Nitossolo Háplico submetido a diferentes sistemas de manejo sob chuva simulada. I—Perdas de solo e água. Rev. Bras. Ciência Solo 2004, 28, 1033–1044. [Google Scholar] [CrossRef]
  51. Boye, A.; Albrecht, A. Soil Erodibility Control and Soil Carbon Losses under Short-Term Tree Fallows in Western Kenya. Bull. Du Reseau Eros. 2005, 22, 181–196. [Google Scholar] [CrossRef]
  52. Janeček, M.; Dostál, T.; Kozlovsky-Dufková, J.; Dumbrovský, M.; Hůla, J.; Kadlec, V.; Konečná, J.; Kovář, P.; Krása, J.; Kubátová, E.; et al. Ochrana Zemědělské Půdy Před Erozí; Česká Zemědělská Univerzita: Praha, Czech Republic, 2012; ISBN 978-80-87415-42-9. [Google Scholar]
  53. Lima, P.L.T.; Silva, M.L.N.; Curi, N.; Quinton, J. Soil loss by water erosion in areas under maize and jack beans intercropped and monocultures. Ciência Agrotecnologia 2014, 38, 129–139. [Google Scholar] [CrossRef]
  54. Alberts, E.E.; Wendt, R.C.; Burwell, R.E. Corn and Soybean Cropping Effects on Soil Losses and C Factors. Soil Sci. Soc. Am. J. 1985, 49, 721–728. [Google Scholar] [CrossRef]
  55. Kinnell, P. A review of the design and operation of runoff and soil loss plots. Catena 2016, 145, 257–265. [Google Scholar] [CrossRef]
  56. Jetten, V.; Govers, G.; Hessel, R. Erosion models: Quality of spatial predictions. Hydrol. Process. 2003, 17, 887–900. [Google Scholar] [CrossRef]
Figure 1. Map of the experimental area, experimental plots visible (rectangles).
Land 12 00431 g001
Figure 2. Box plot of 71 experiments in dry and wet soil conditions.
Land 12 00431 g002
Figure 3. Simulation run under dry soil conditions.
Land 12 00431 g003
Figure 4. Simulation run under wet soil conditions.
Land 12 00431 g004
Figure 5. Surface runoff for different farming practices on maize, average of dry and wet conditions.
Land 12 00431 g005
Figure 6. Runoff ratio of maize variants.
Land 12 00431 g006
Figure 7. Transported sediment for different farming practices on maize, average of dry and wet conditions.
Land 12 00431 g007
Table 1. Overview of experiments throughout 2016–2021.
Crop201620172018201920202021Total
Maize0666202260
Sorghum0000261844
Sunflower626010832
Wheat010606022
Alfalfa212800022
Mustard44444020
Rapeseed212002016
pea60600416
Buckwheat08040012
Barley60400010
Lacy phacelia0044008
Rye0000404
Other 1041660026
Bare soil1420188161692
Total407878328868384
1 seedbed variants, unmanaged fallow plots after rain, and the post-harvest situations.
Table 2. Monthly distribution of the R-factor for the Czech Republic [37].
Month%R
April1.1
May13.2
June25.3
July30.4
August21.1
September6.6
October1.9
Table 3. Box plot data.
1.Q. 1Median3.Q. 2SD 3CV 4Average
sediment load, dry (kg)5.68.110.93.542.18.3
sediment load, wet (kg)6.77.99.92.732.38.3
runoff, dry (L)238.9322.5377.877.825.0311.1
runoff, wet (L)370.8419.2439.649.412.2404.1
1 first quartile, 2 third quartile, 3 standard deviation, 4 coefficient of variation.
Table 4. SLR values for maize farming variants, average of dry and wet conditions.
Maize VariantsPlant Development Stage C-Factor
BBCH (00-30)BBCH (31-60)BBCH (61-99)
SLRSD 1SLRSDSLRSD
conventional0.3850.3420.3730.2490.3870.3420.36
contour farming0.2060.2290.0330.0290.0510.0580.28
shallow tillage0.0450.0020.0310.0390.0270.0320.09
direct seeding0.0030.0040.0060.0060.011- 20.04
1 standard deviation, 2 SD is not available due to lack of simulations.
Disclaimer/Publisher’s Note: The statements, opinions and data contained in all publications are solely those of the individual author(s) and contributor(s) and not of MDPI and/or the editor(s). MDPI and/or the editor(s) disclaim responsibility for any injury to people or property resulting from any ideas, methods, instructions or products referred to in the content.

