
The Role of the Design of Public Squares and Vegetation Composition on Human Thermal Comfort in Different Seasons a Quantitative Assessment


Abstract
:1. Introduction
2. Materials and Methods
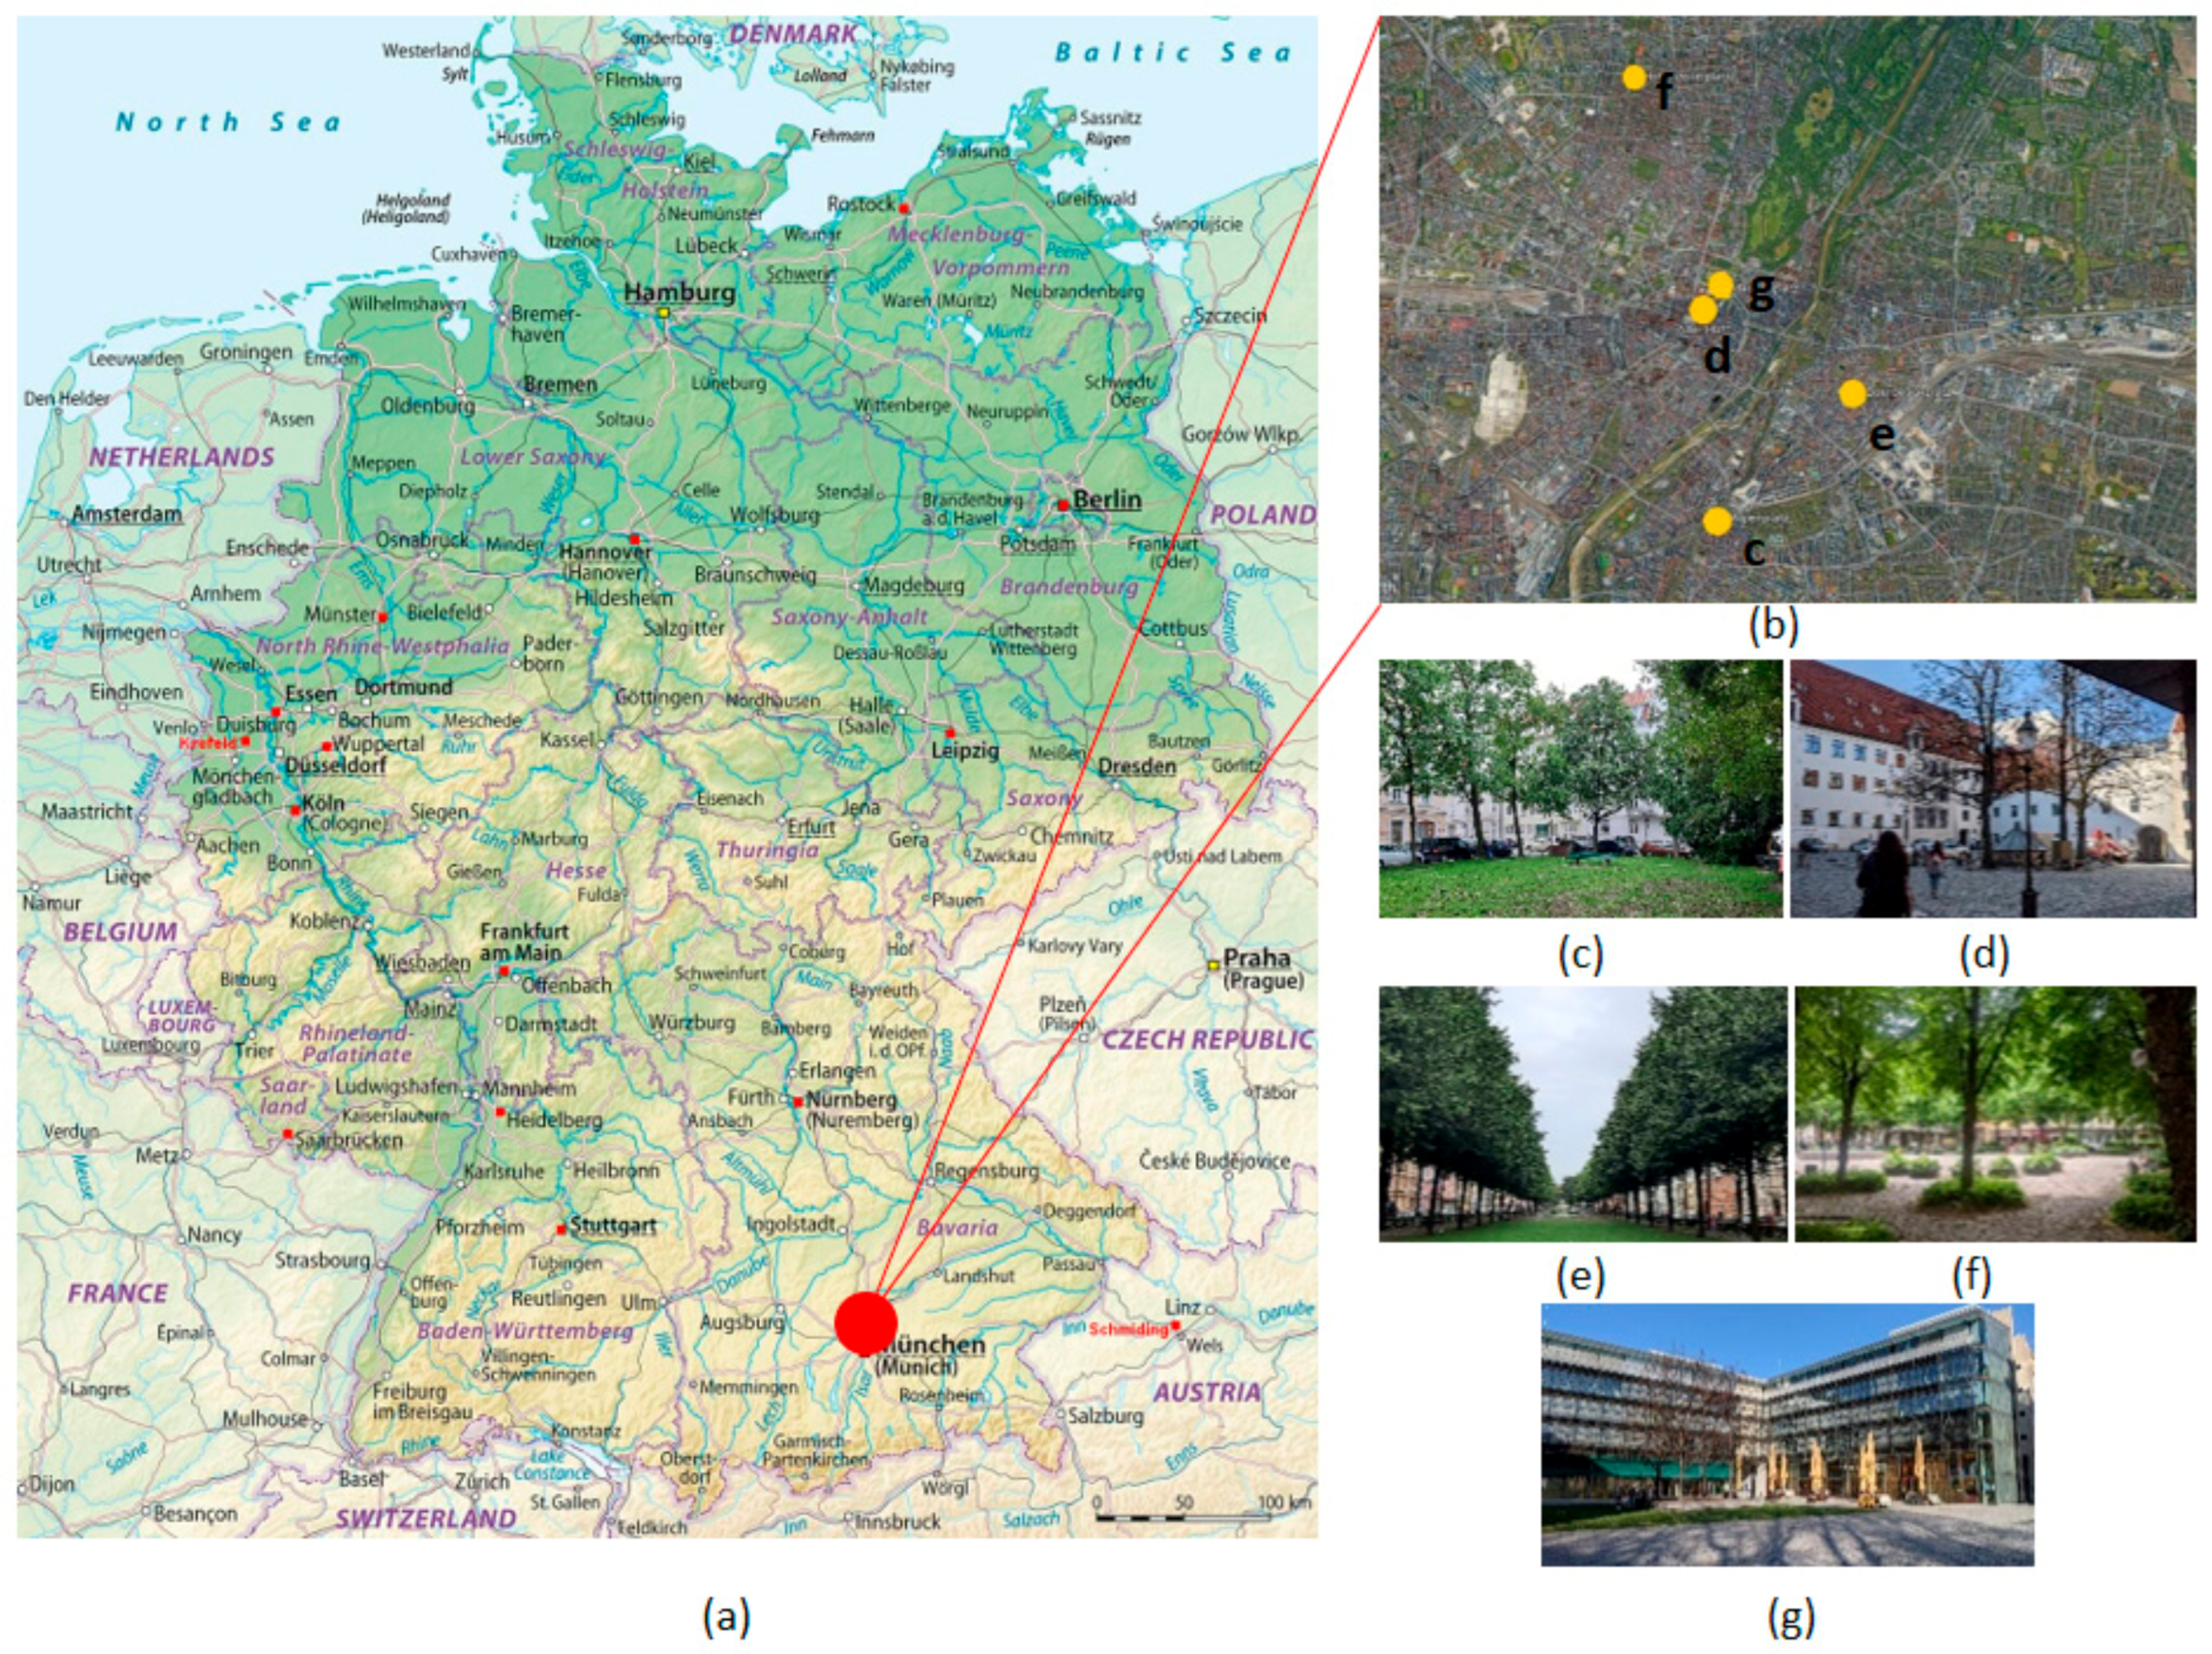
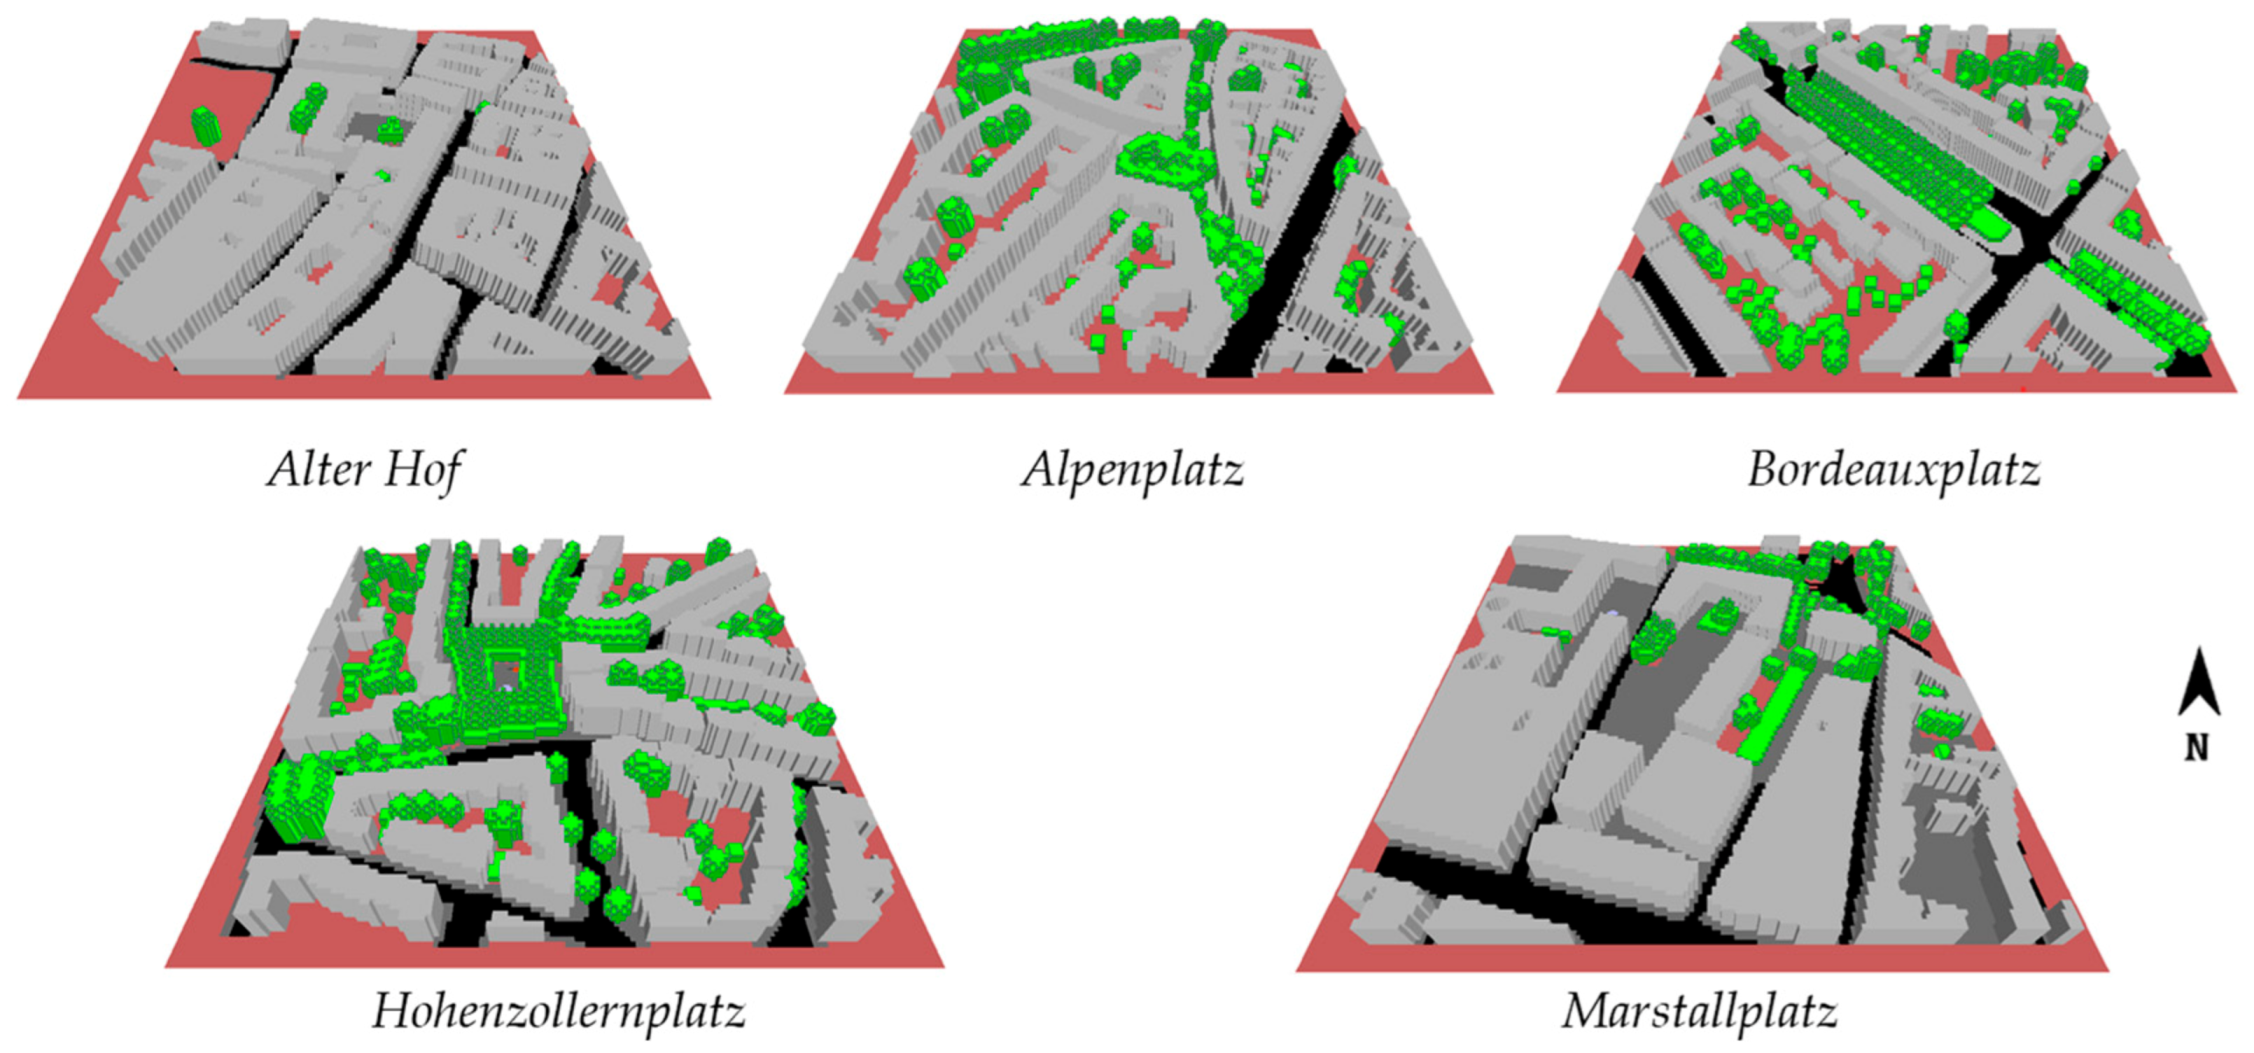
2.1. Study Area
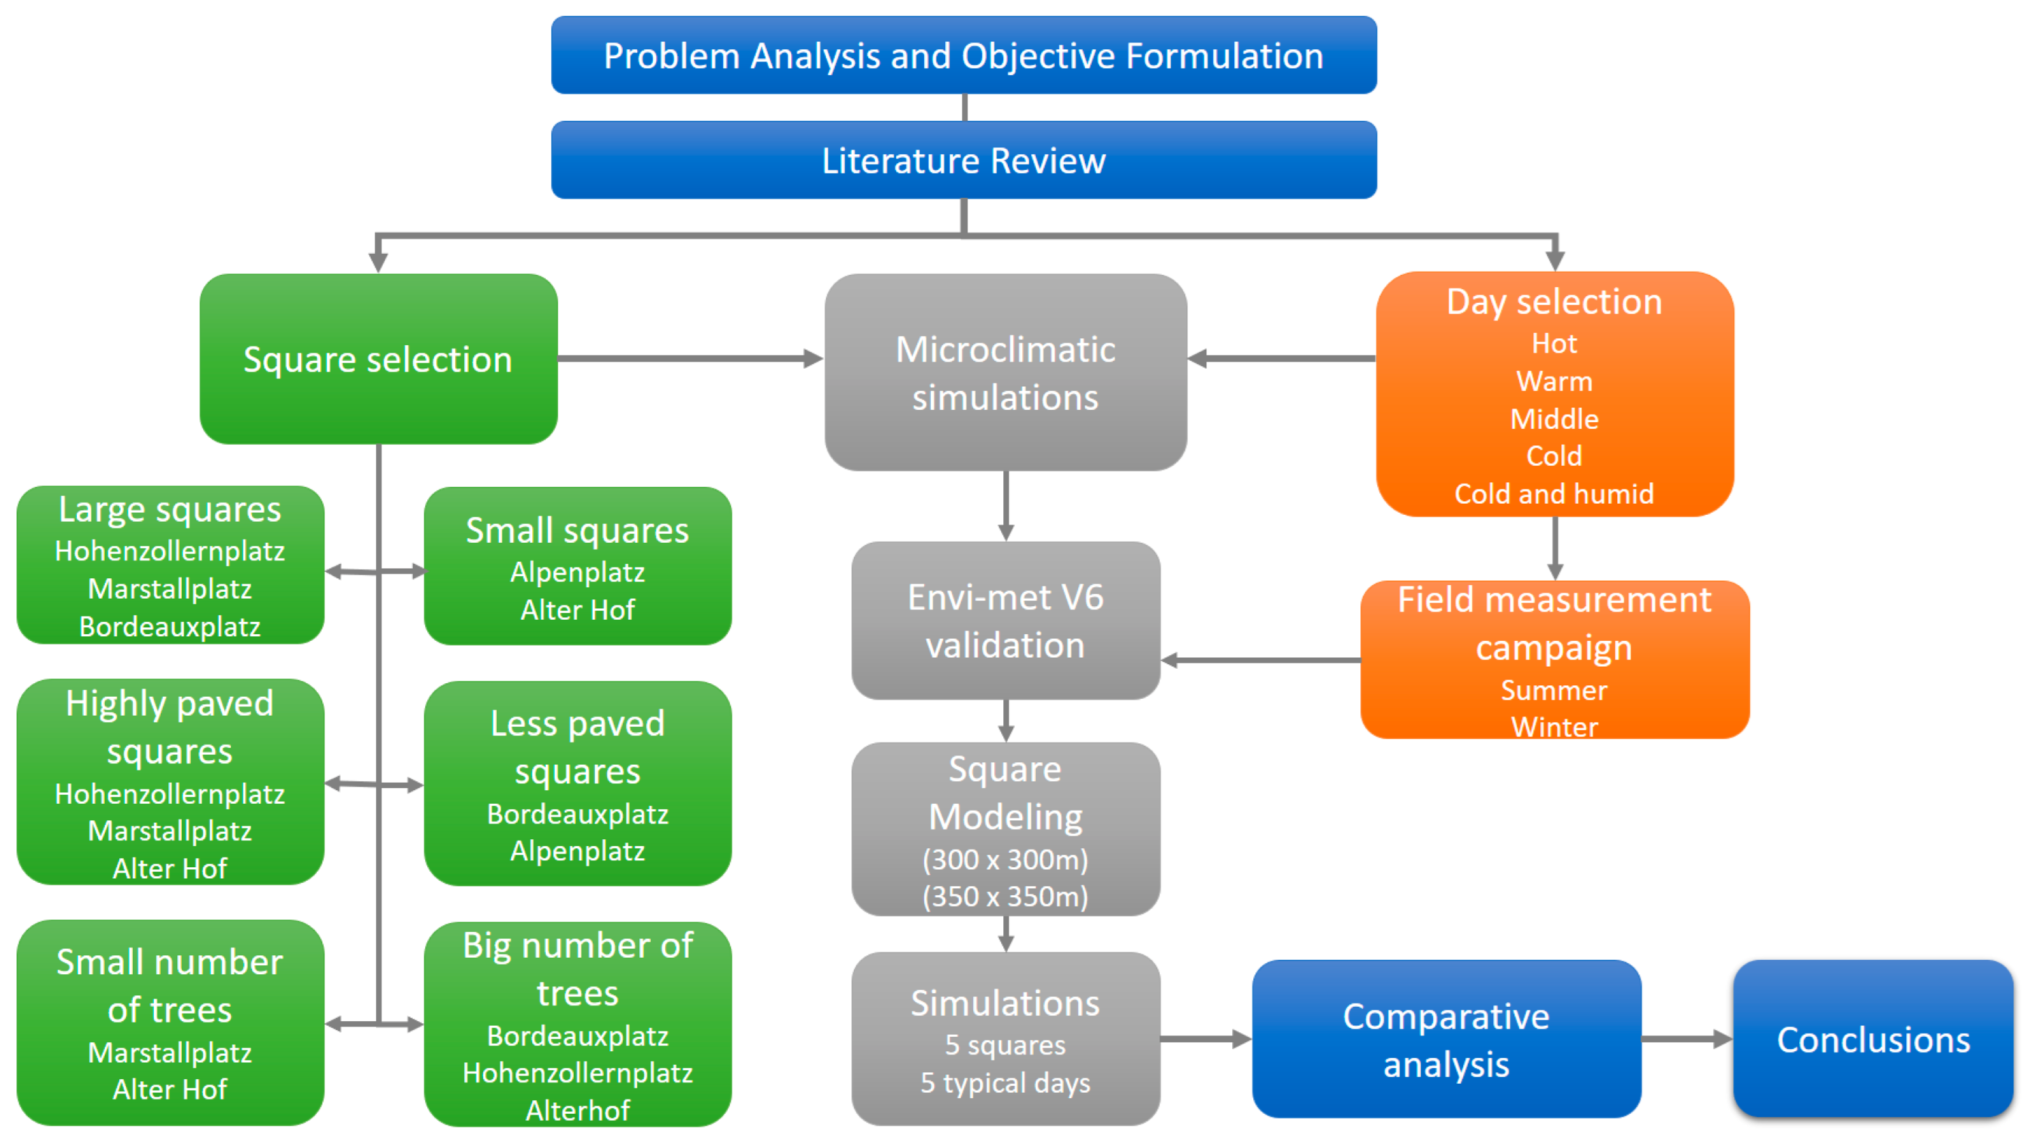
2.2. Methods
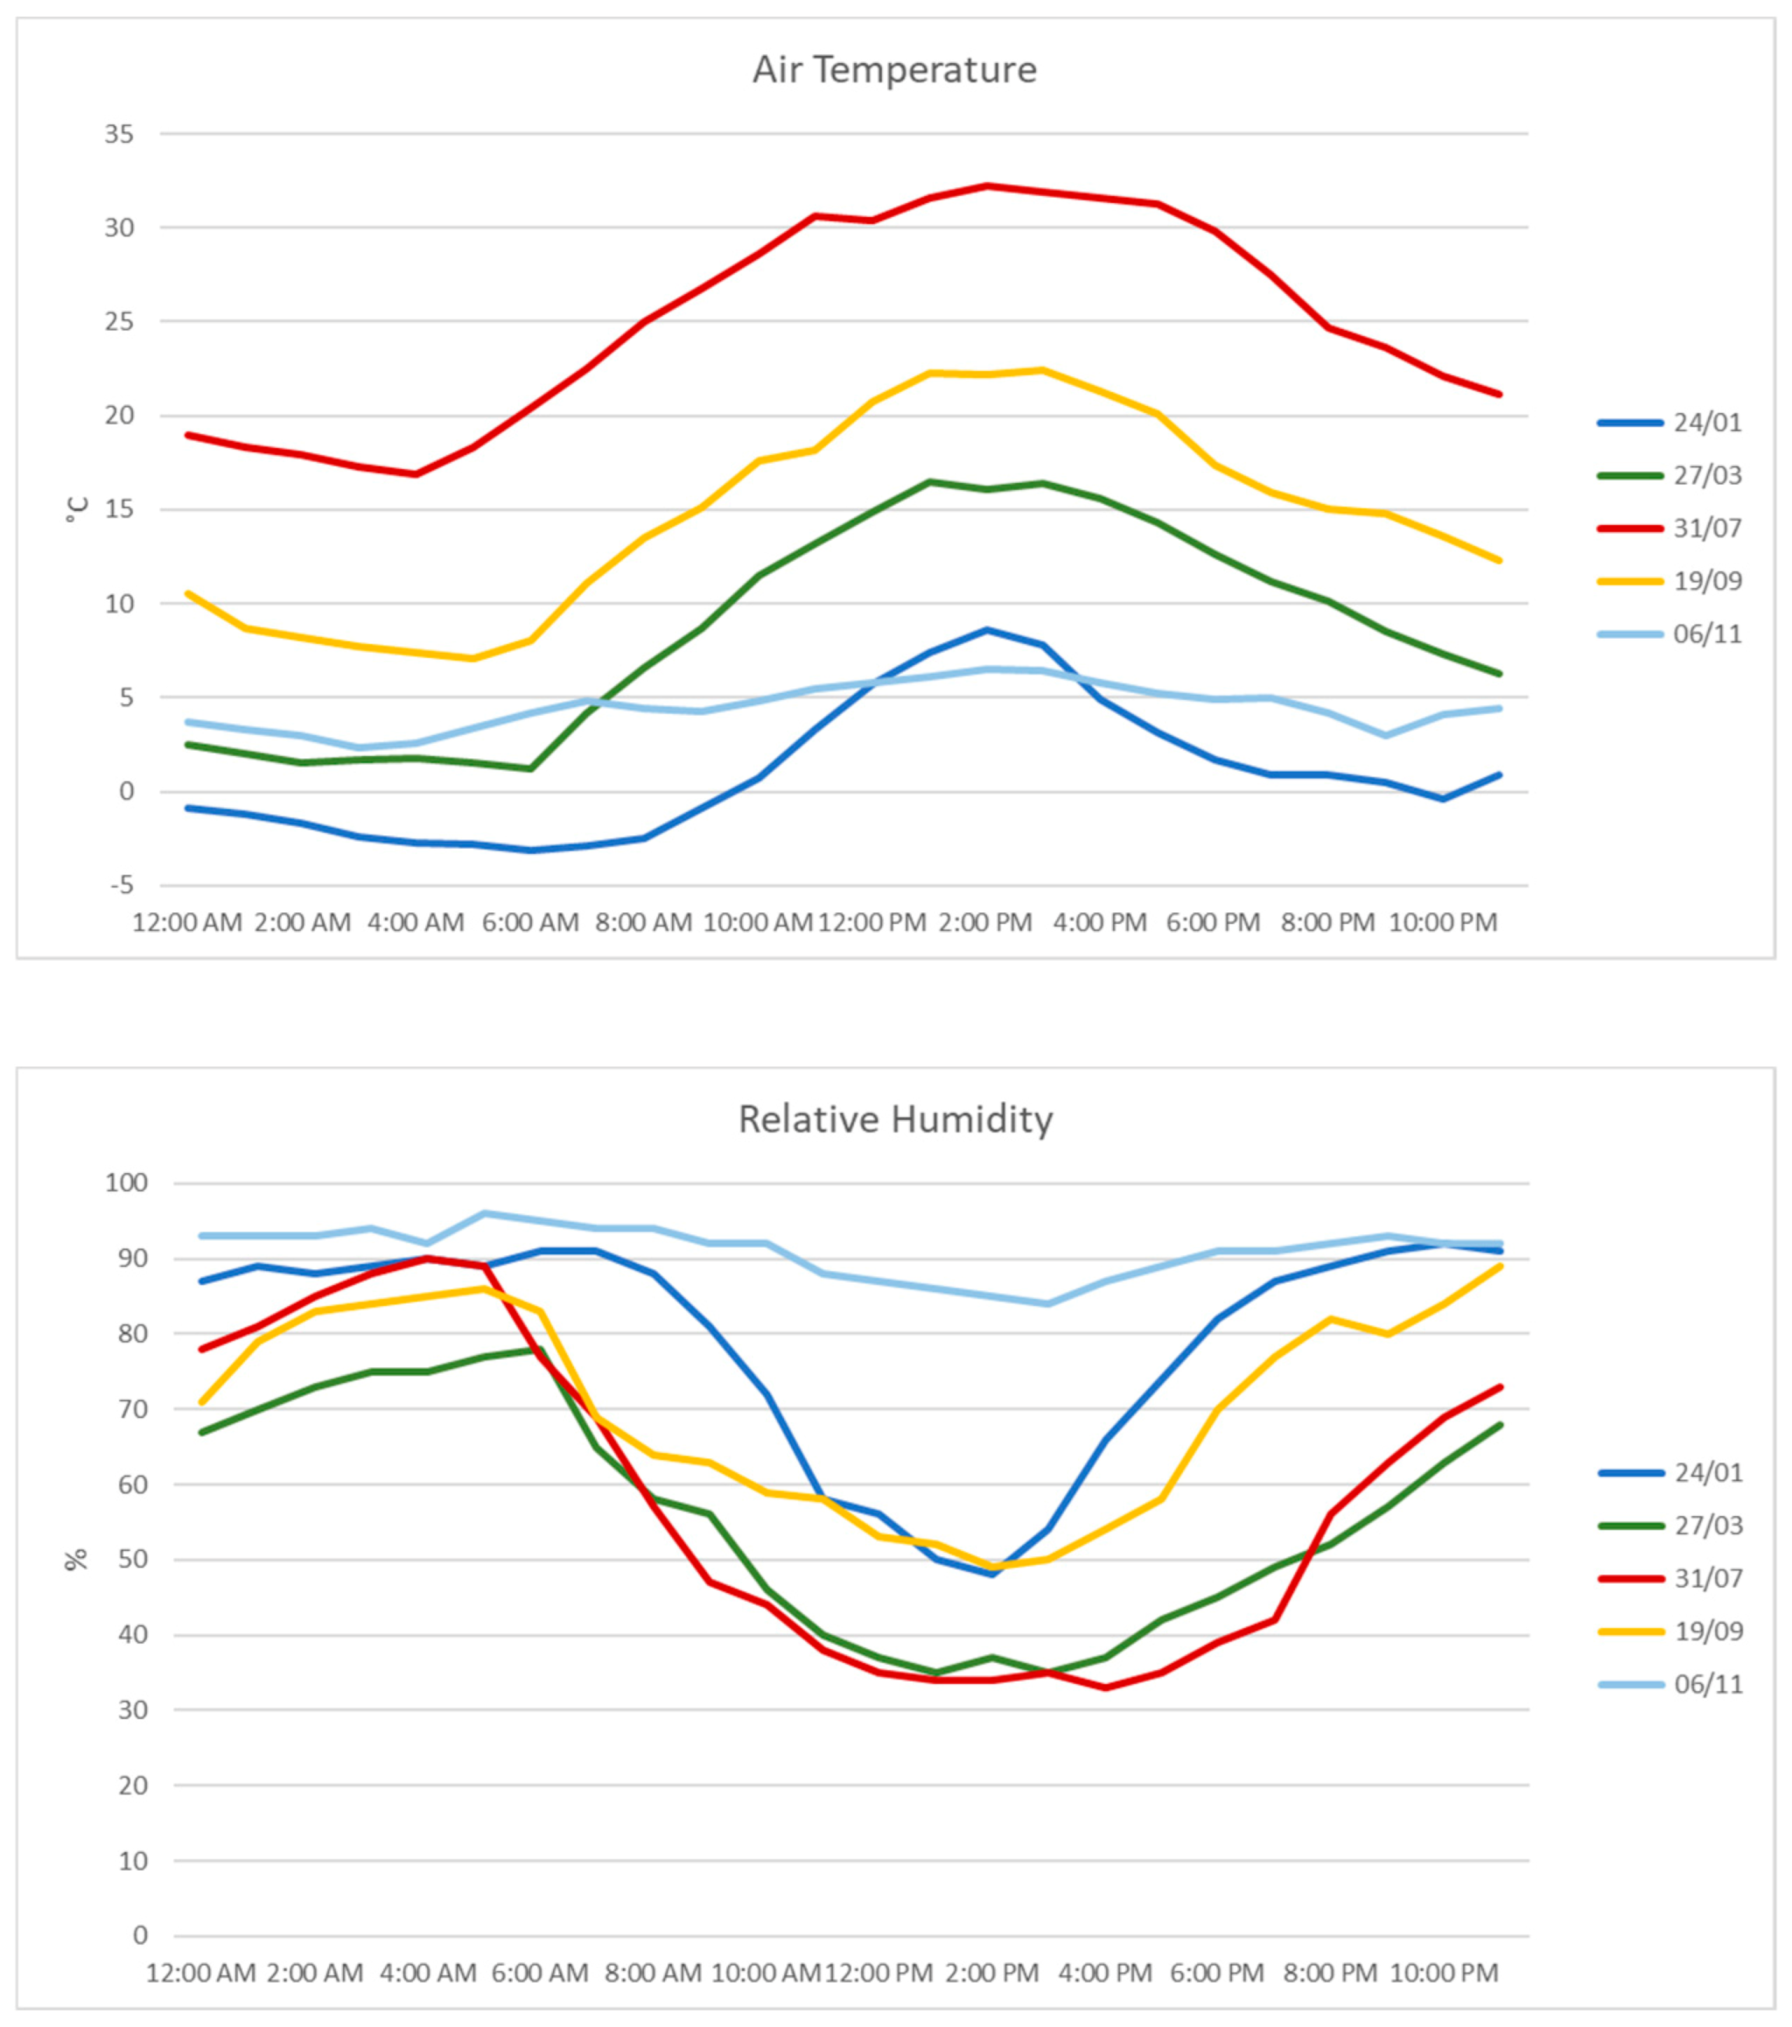
2.2.1. Day Selection
2.2.2. Micrometeorological Simulation of the Squares Using the ENVI-Met Model
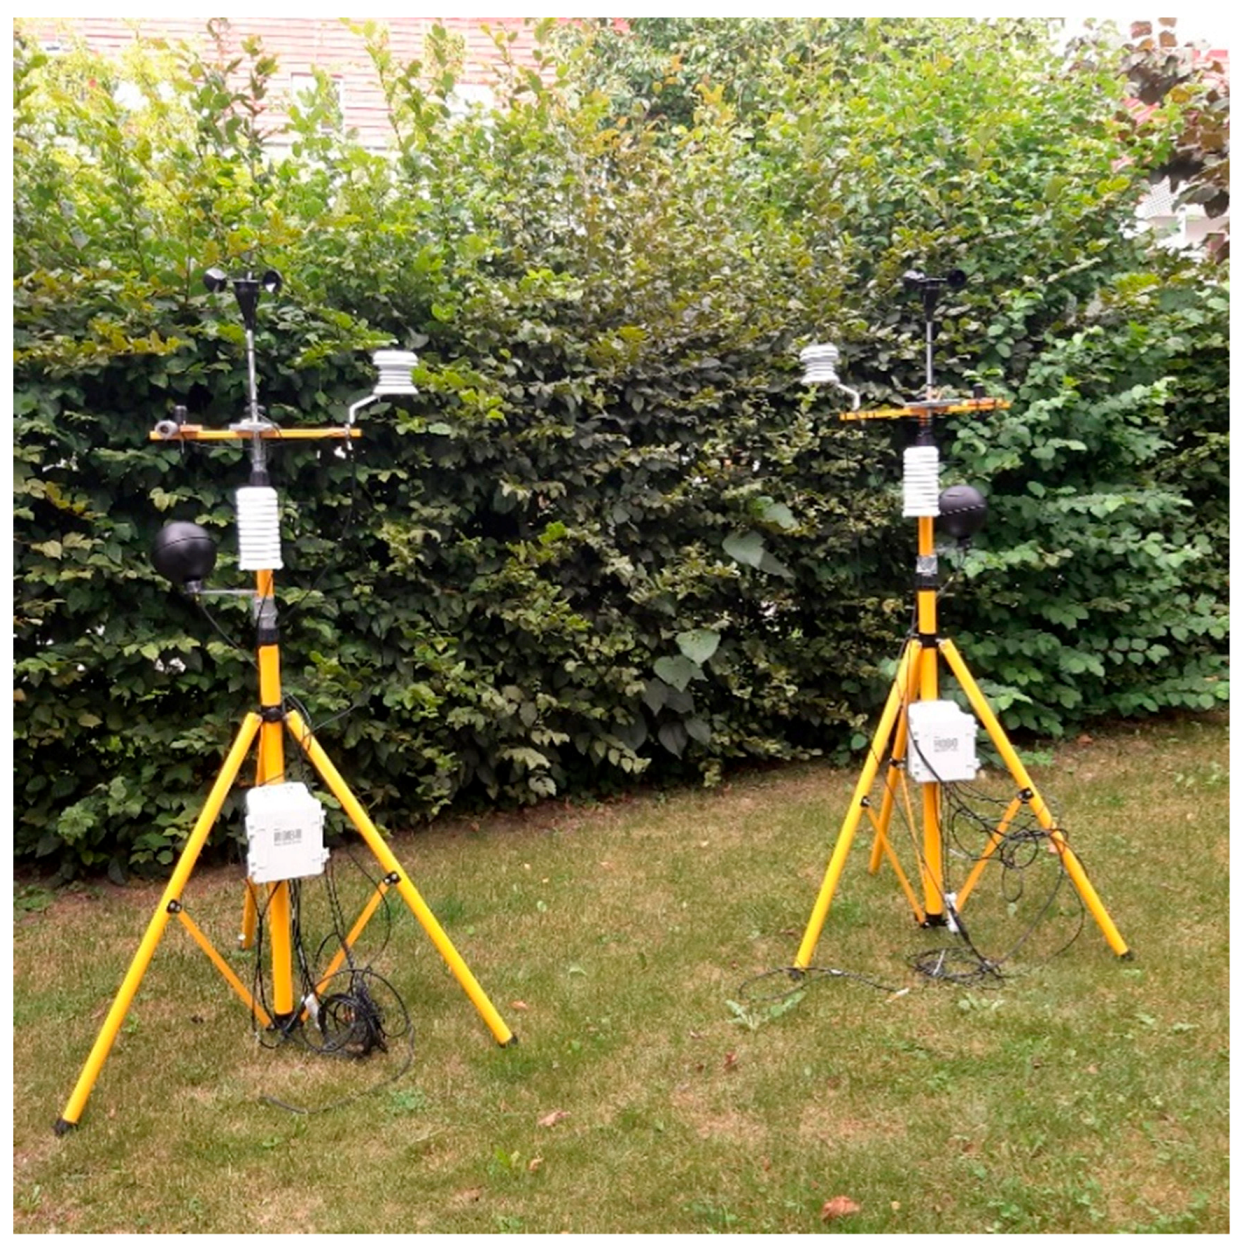
2.2.3. Model Validation
2.2.4. Statistical Analysis
3. Results
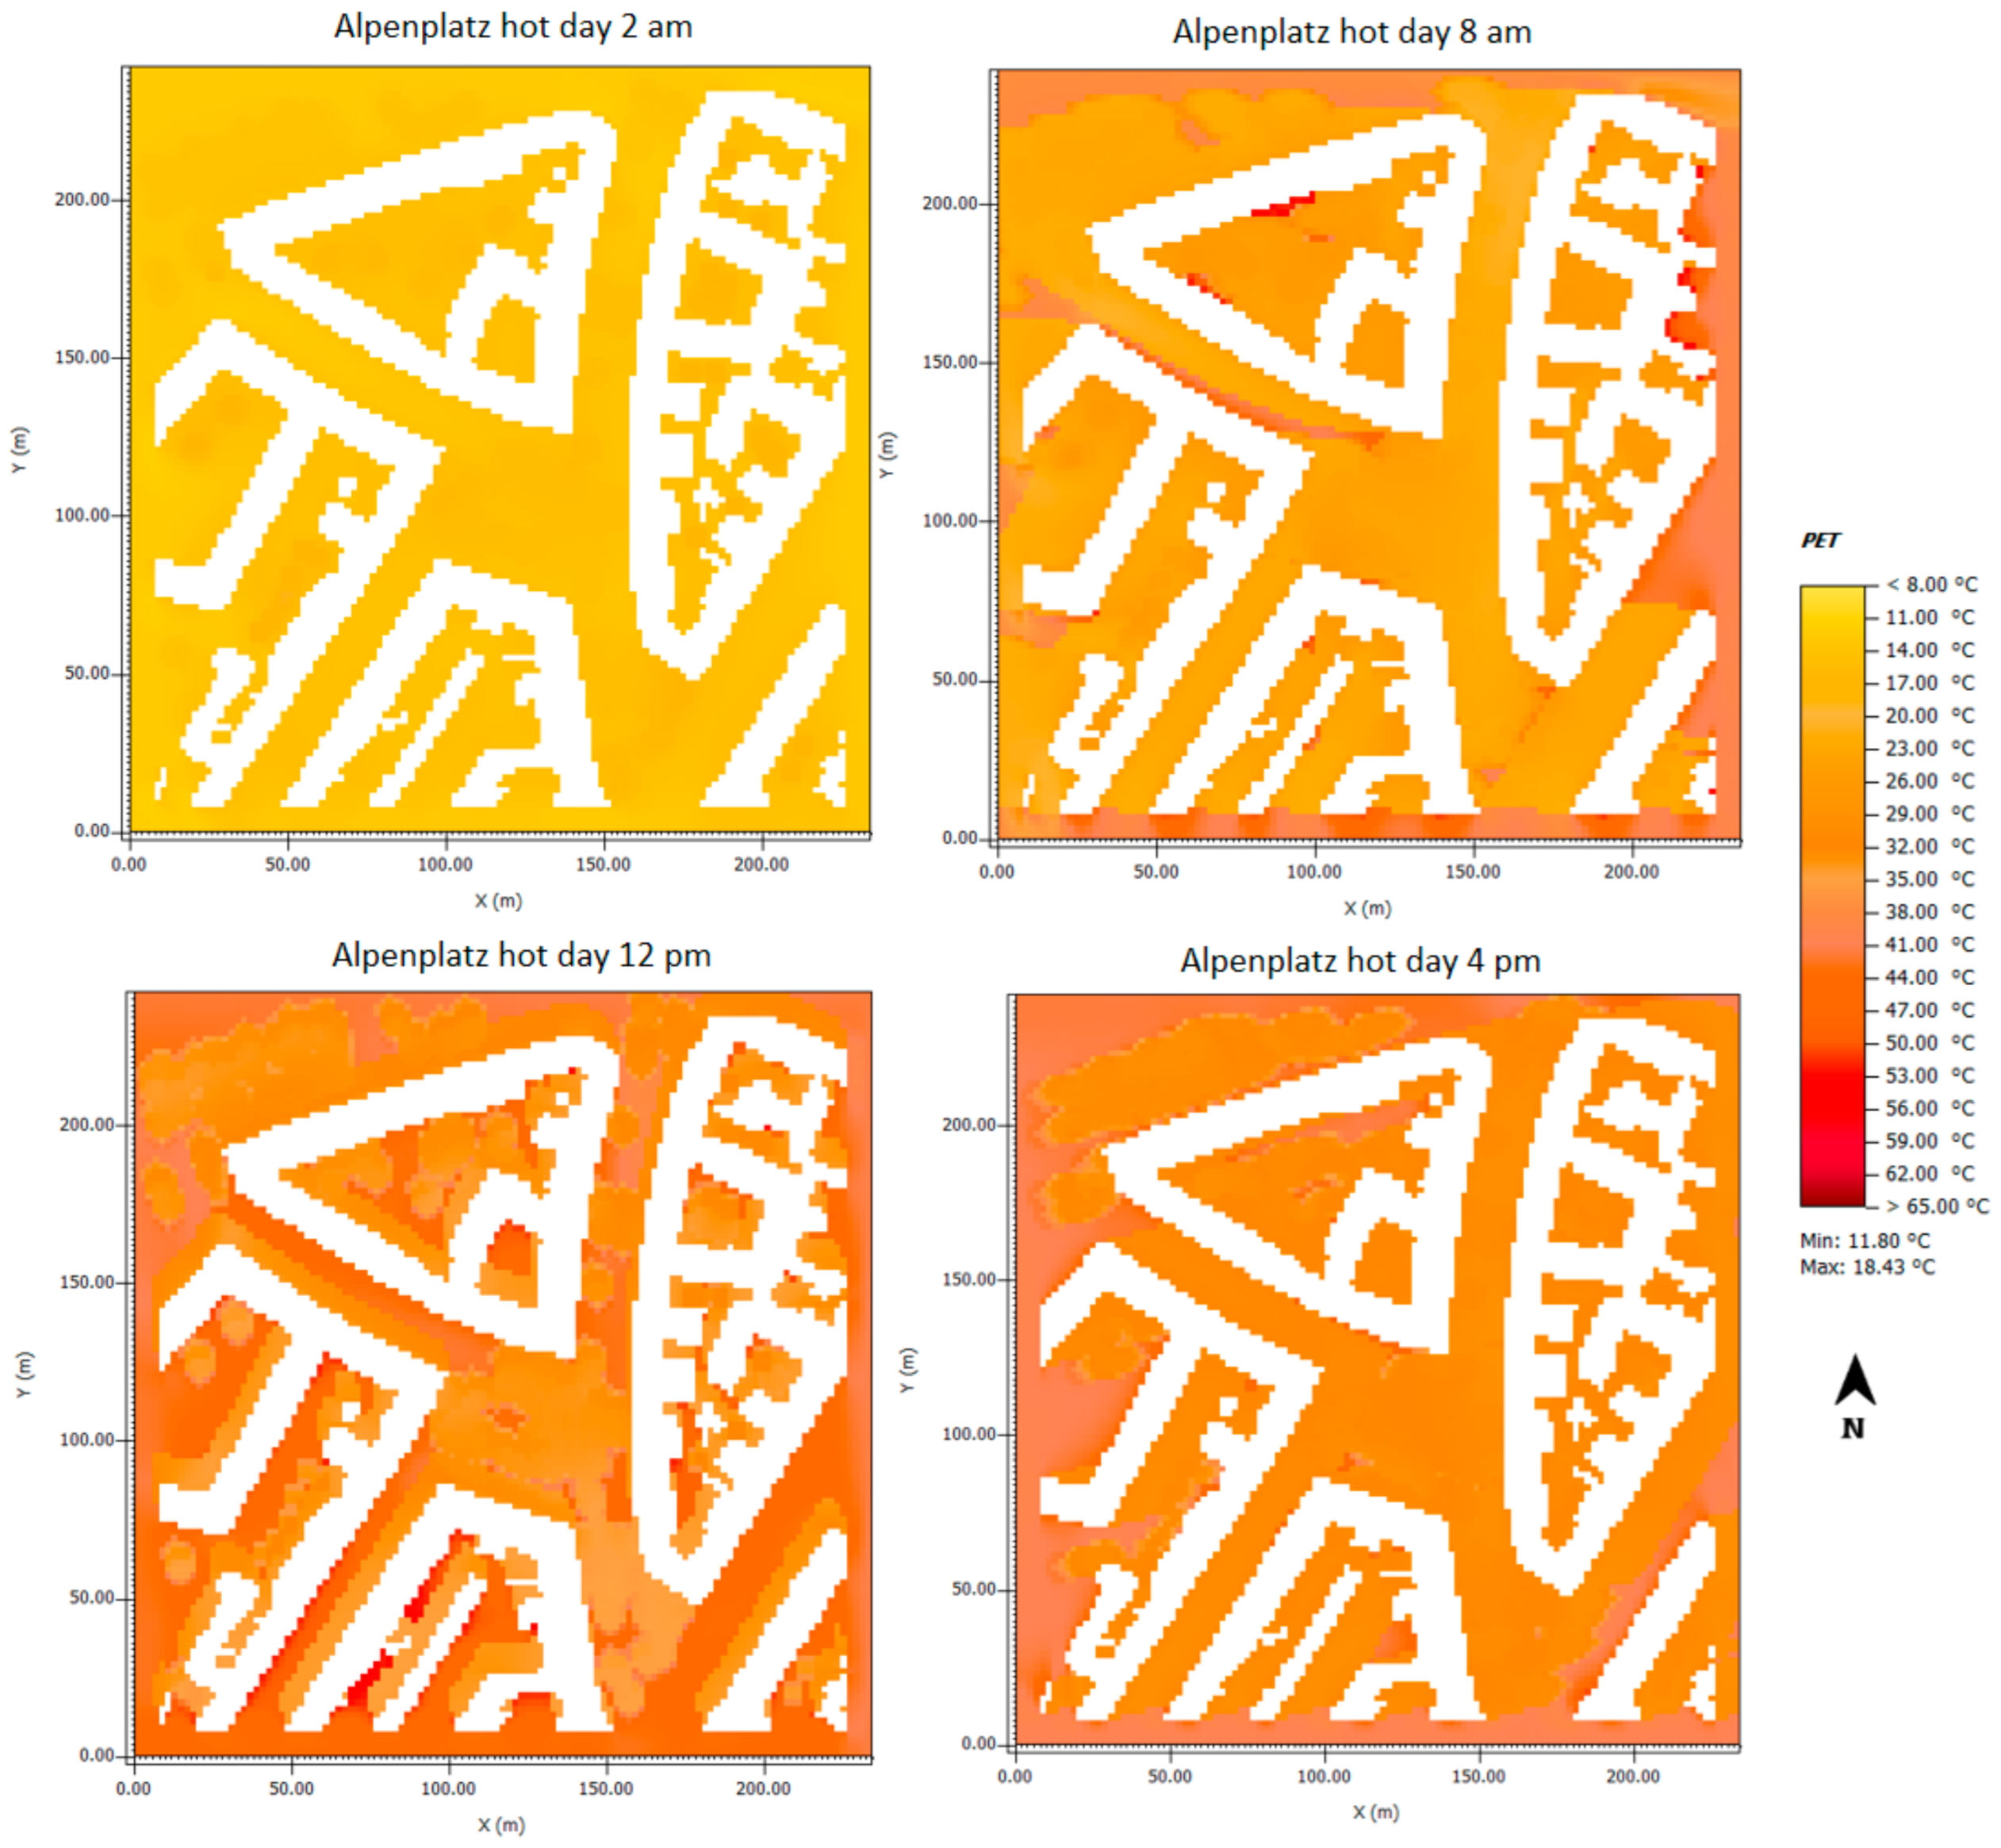
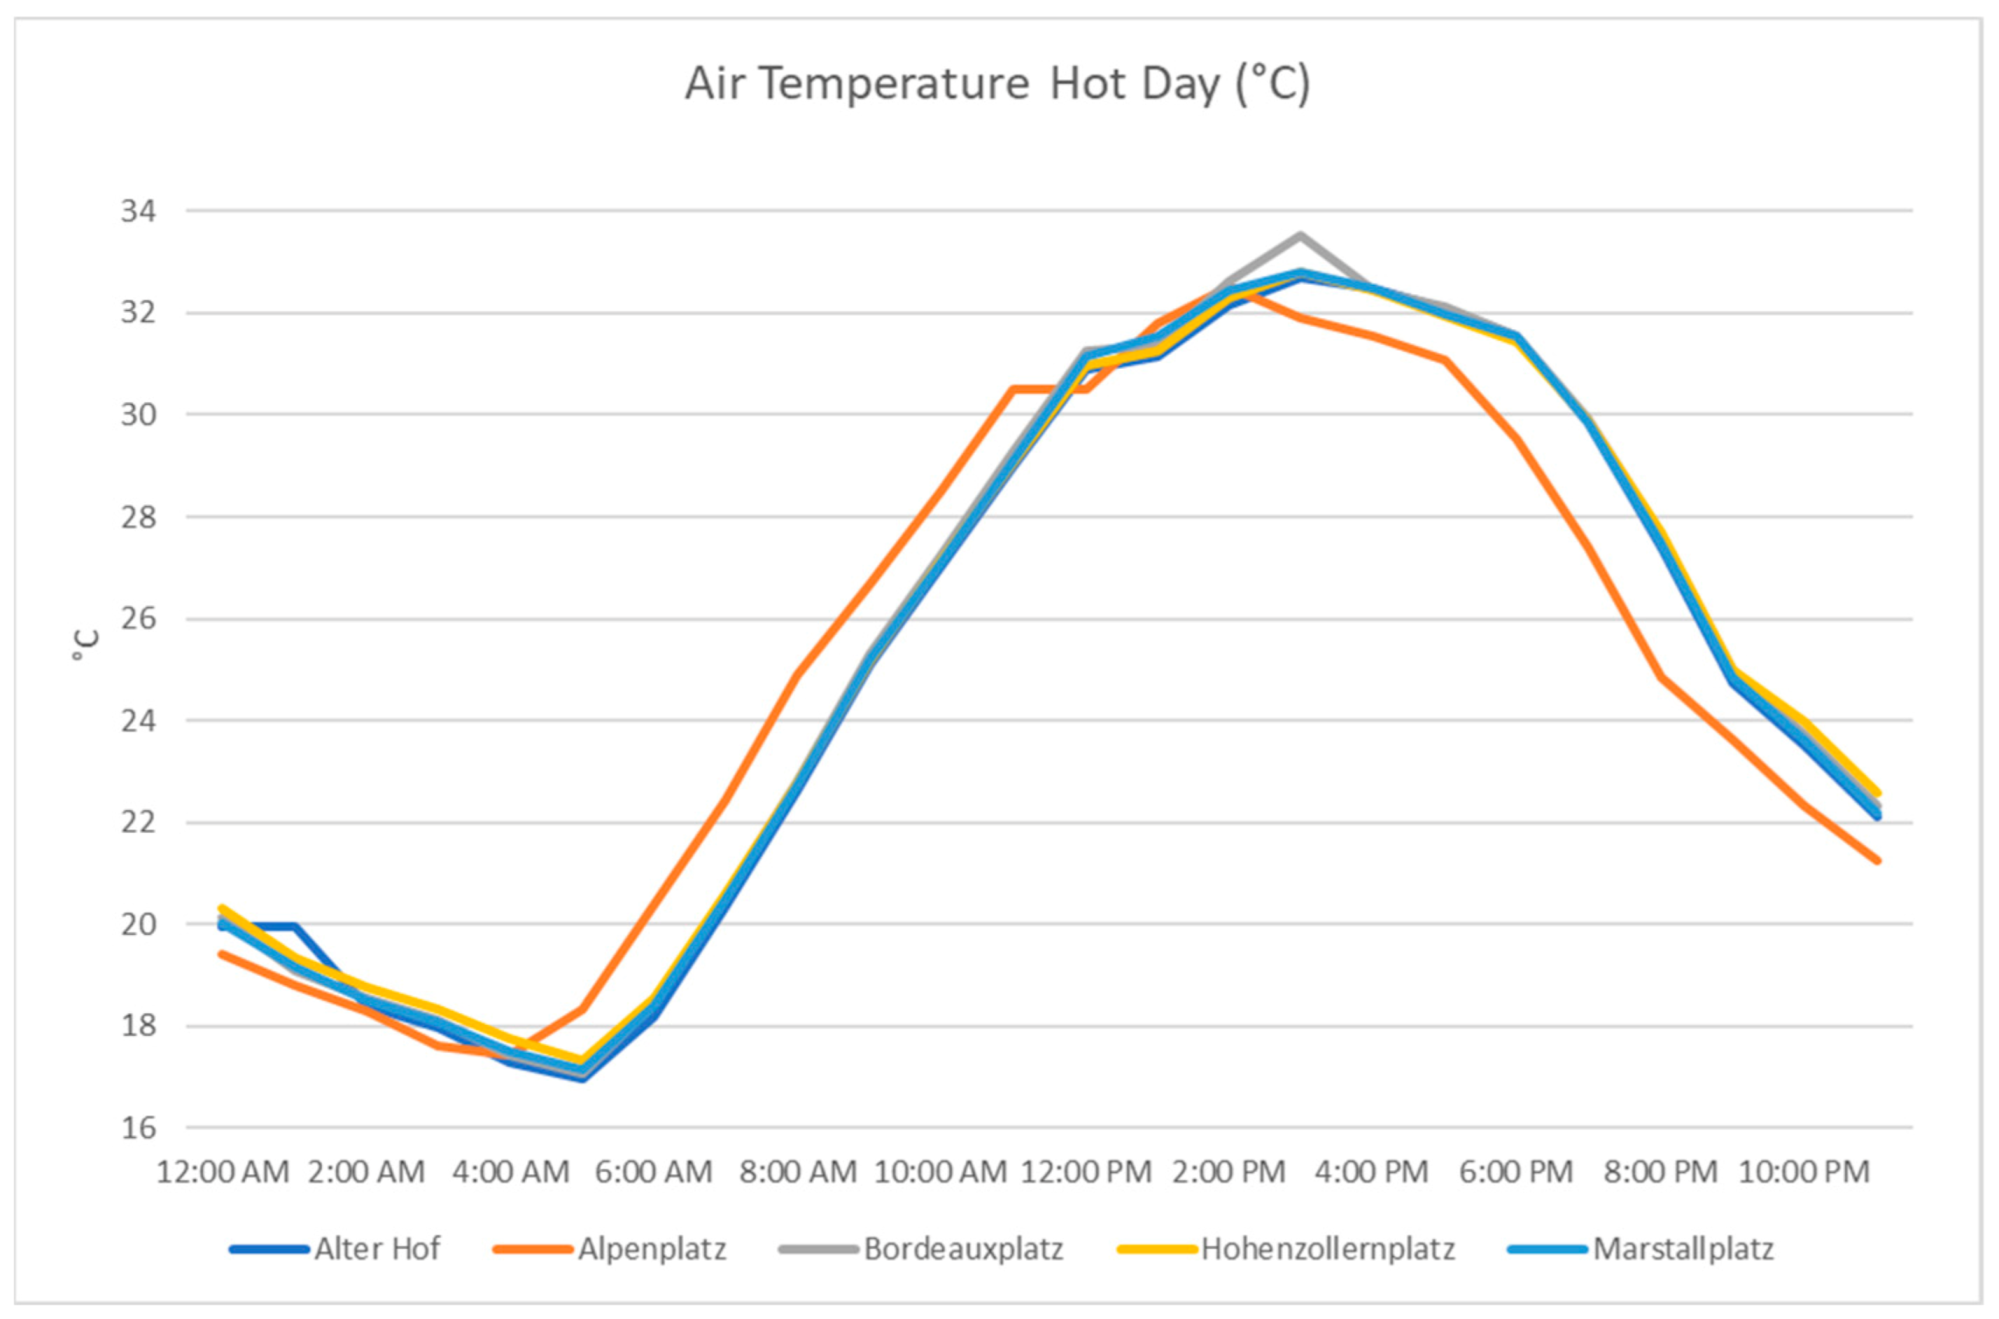
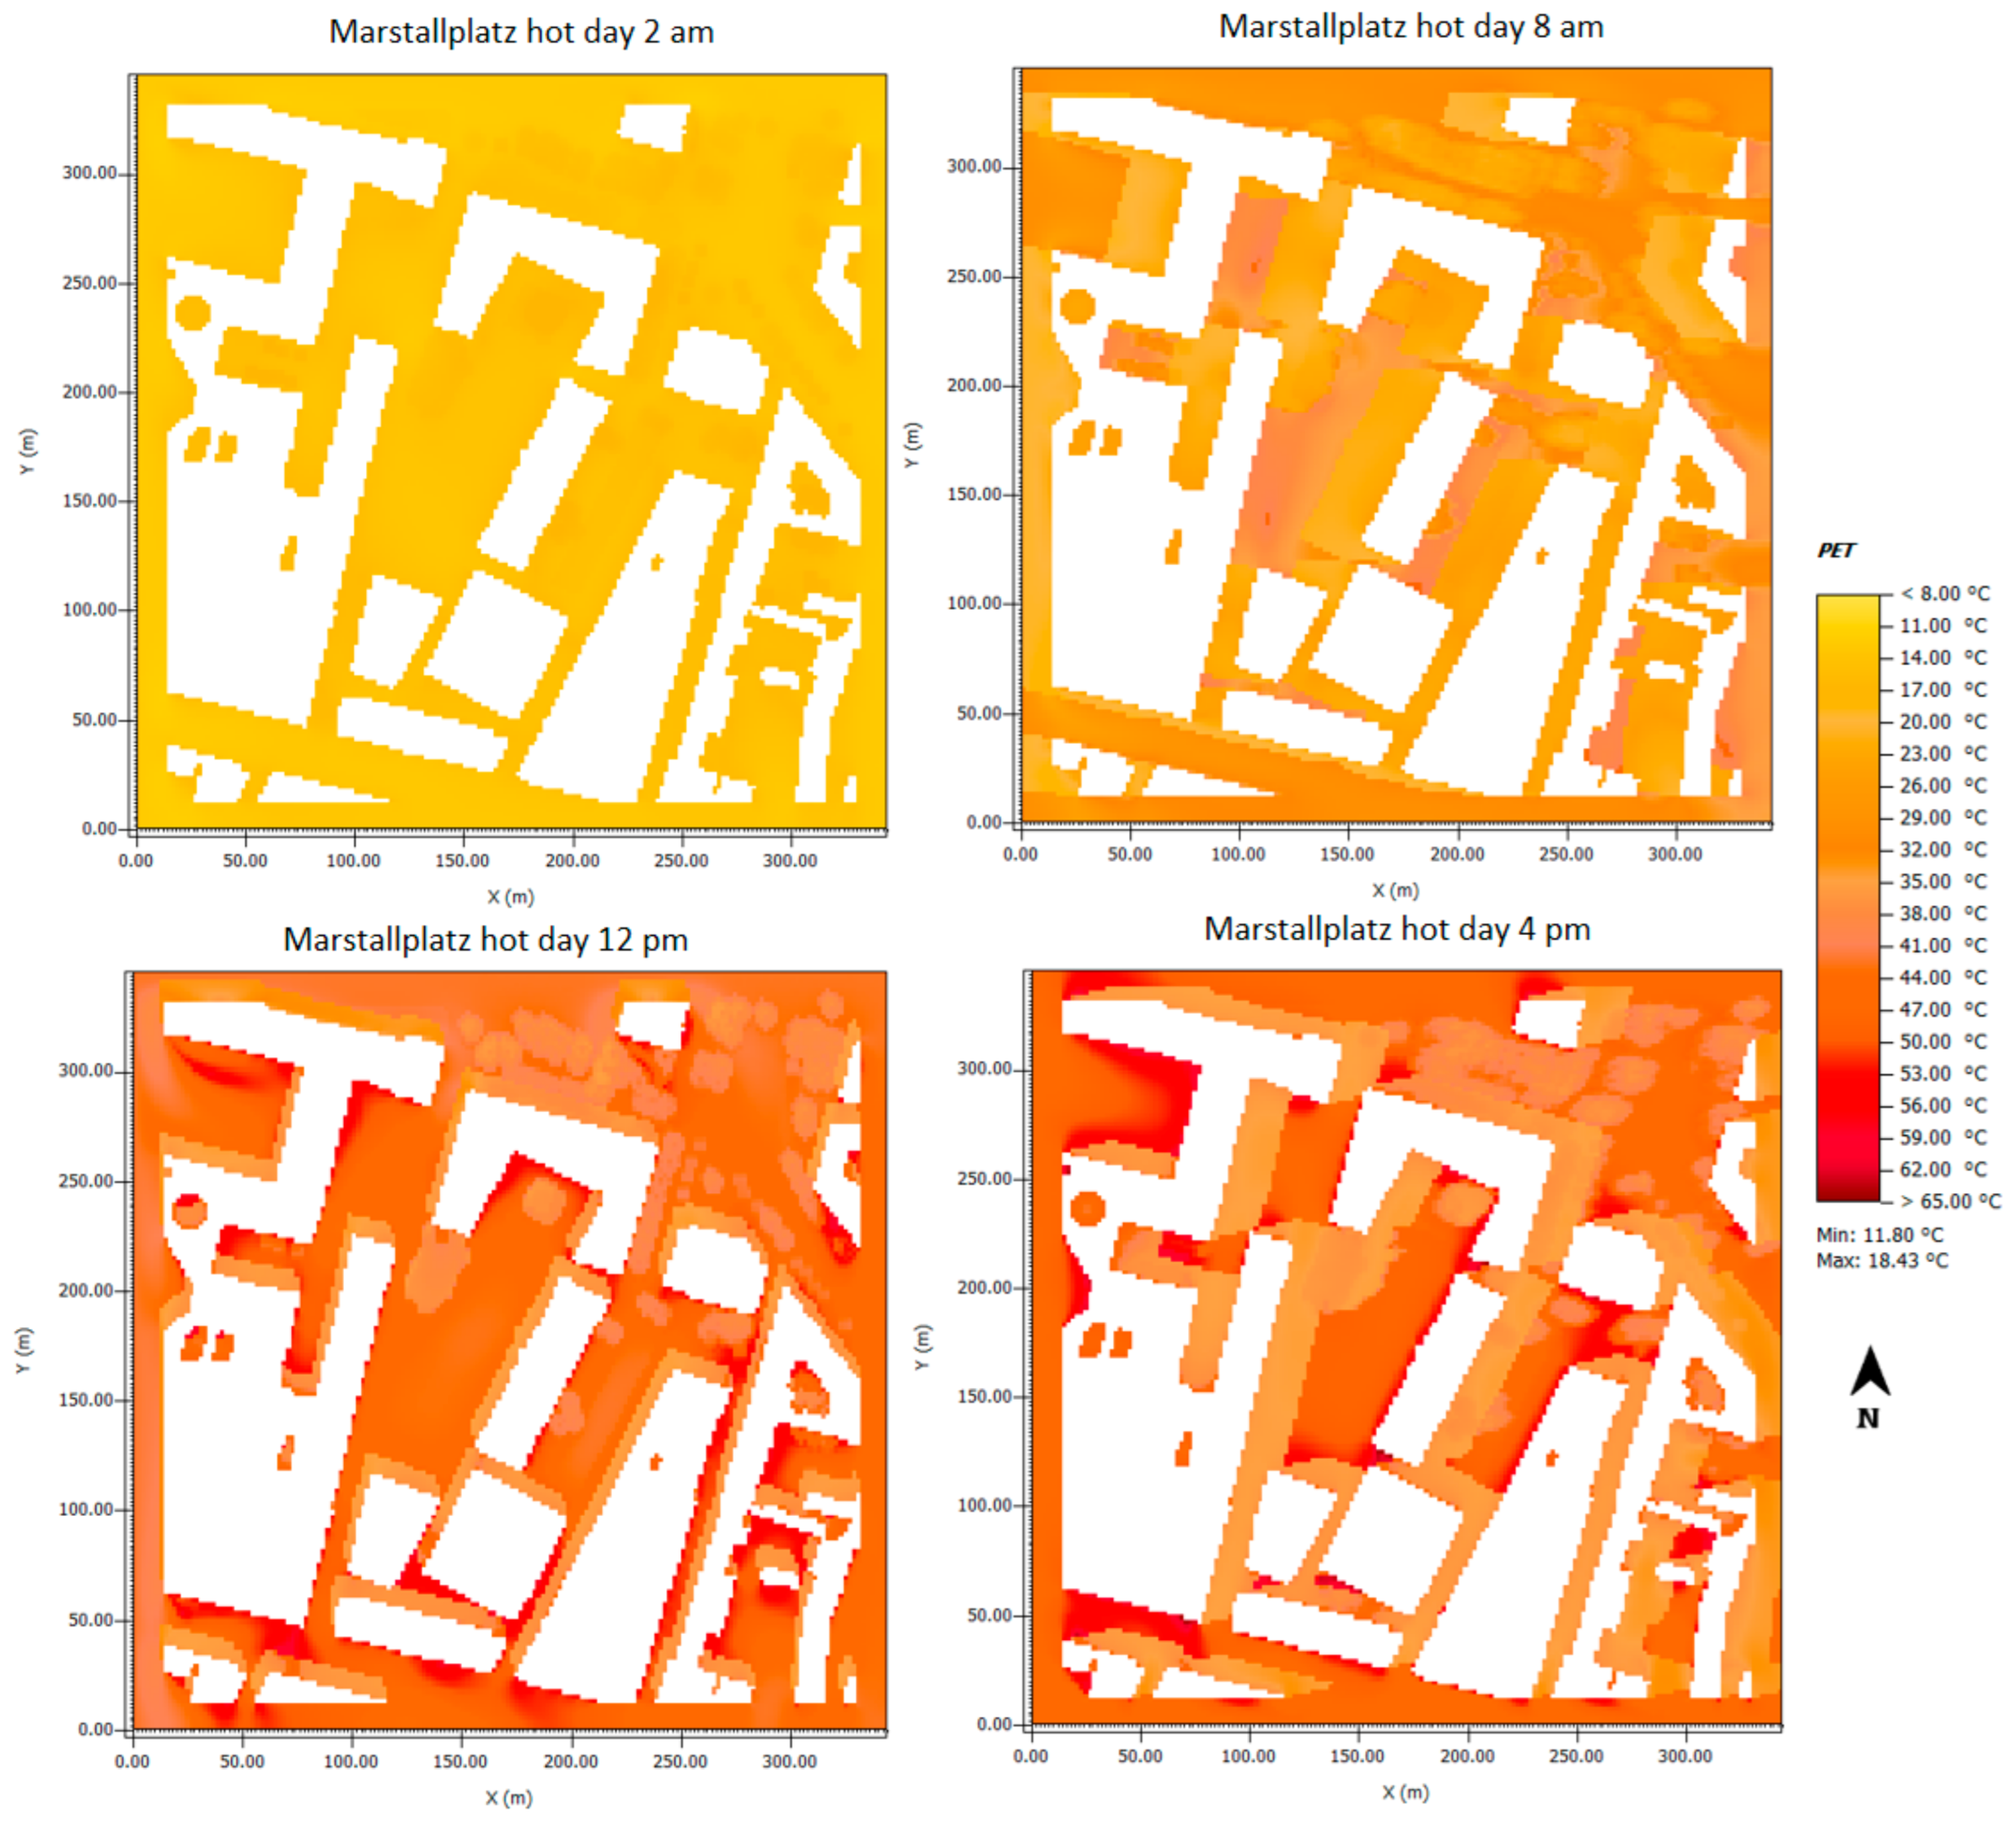
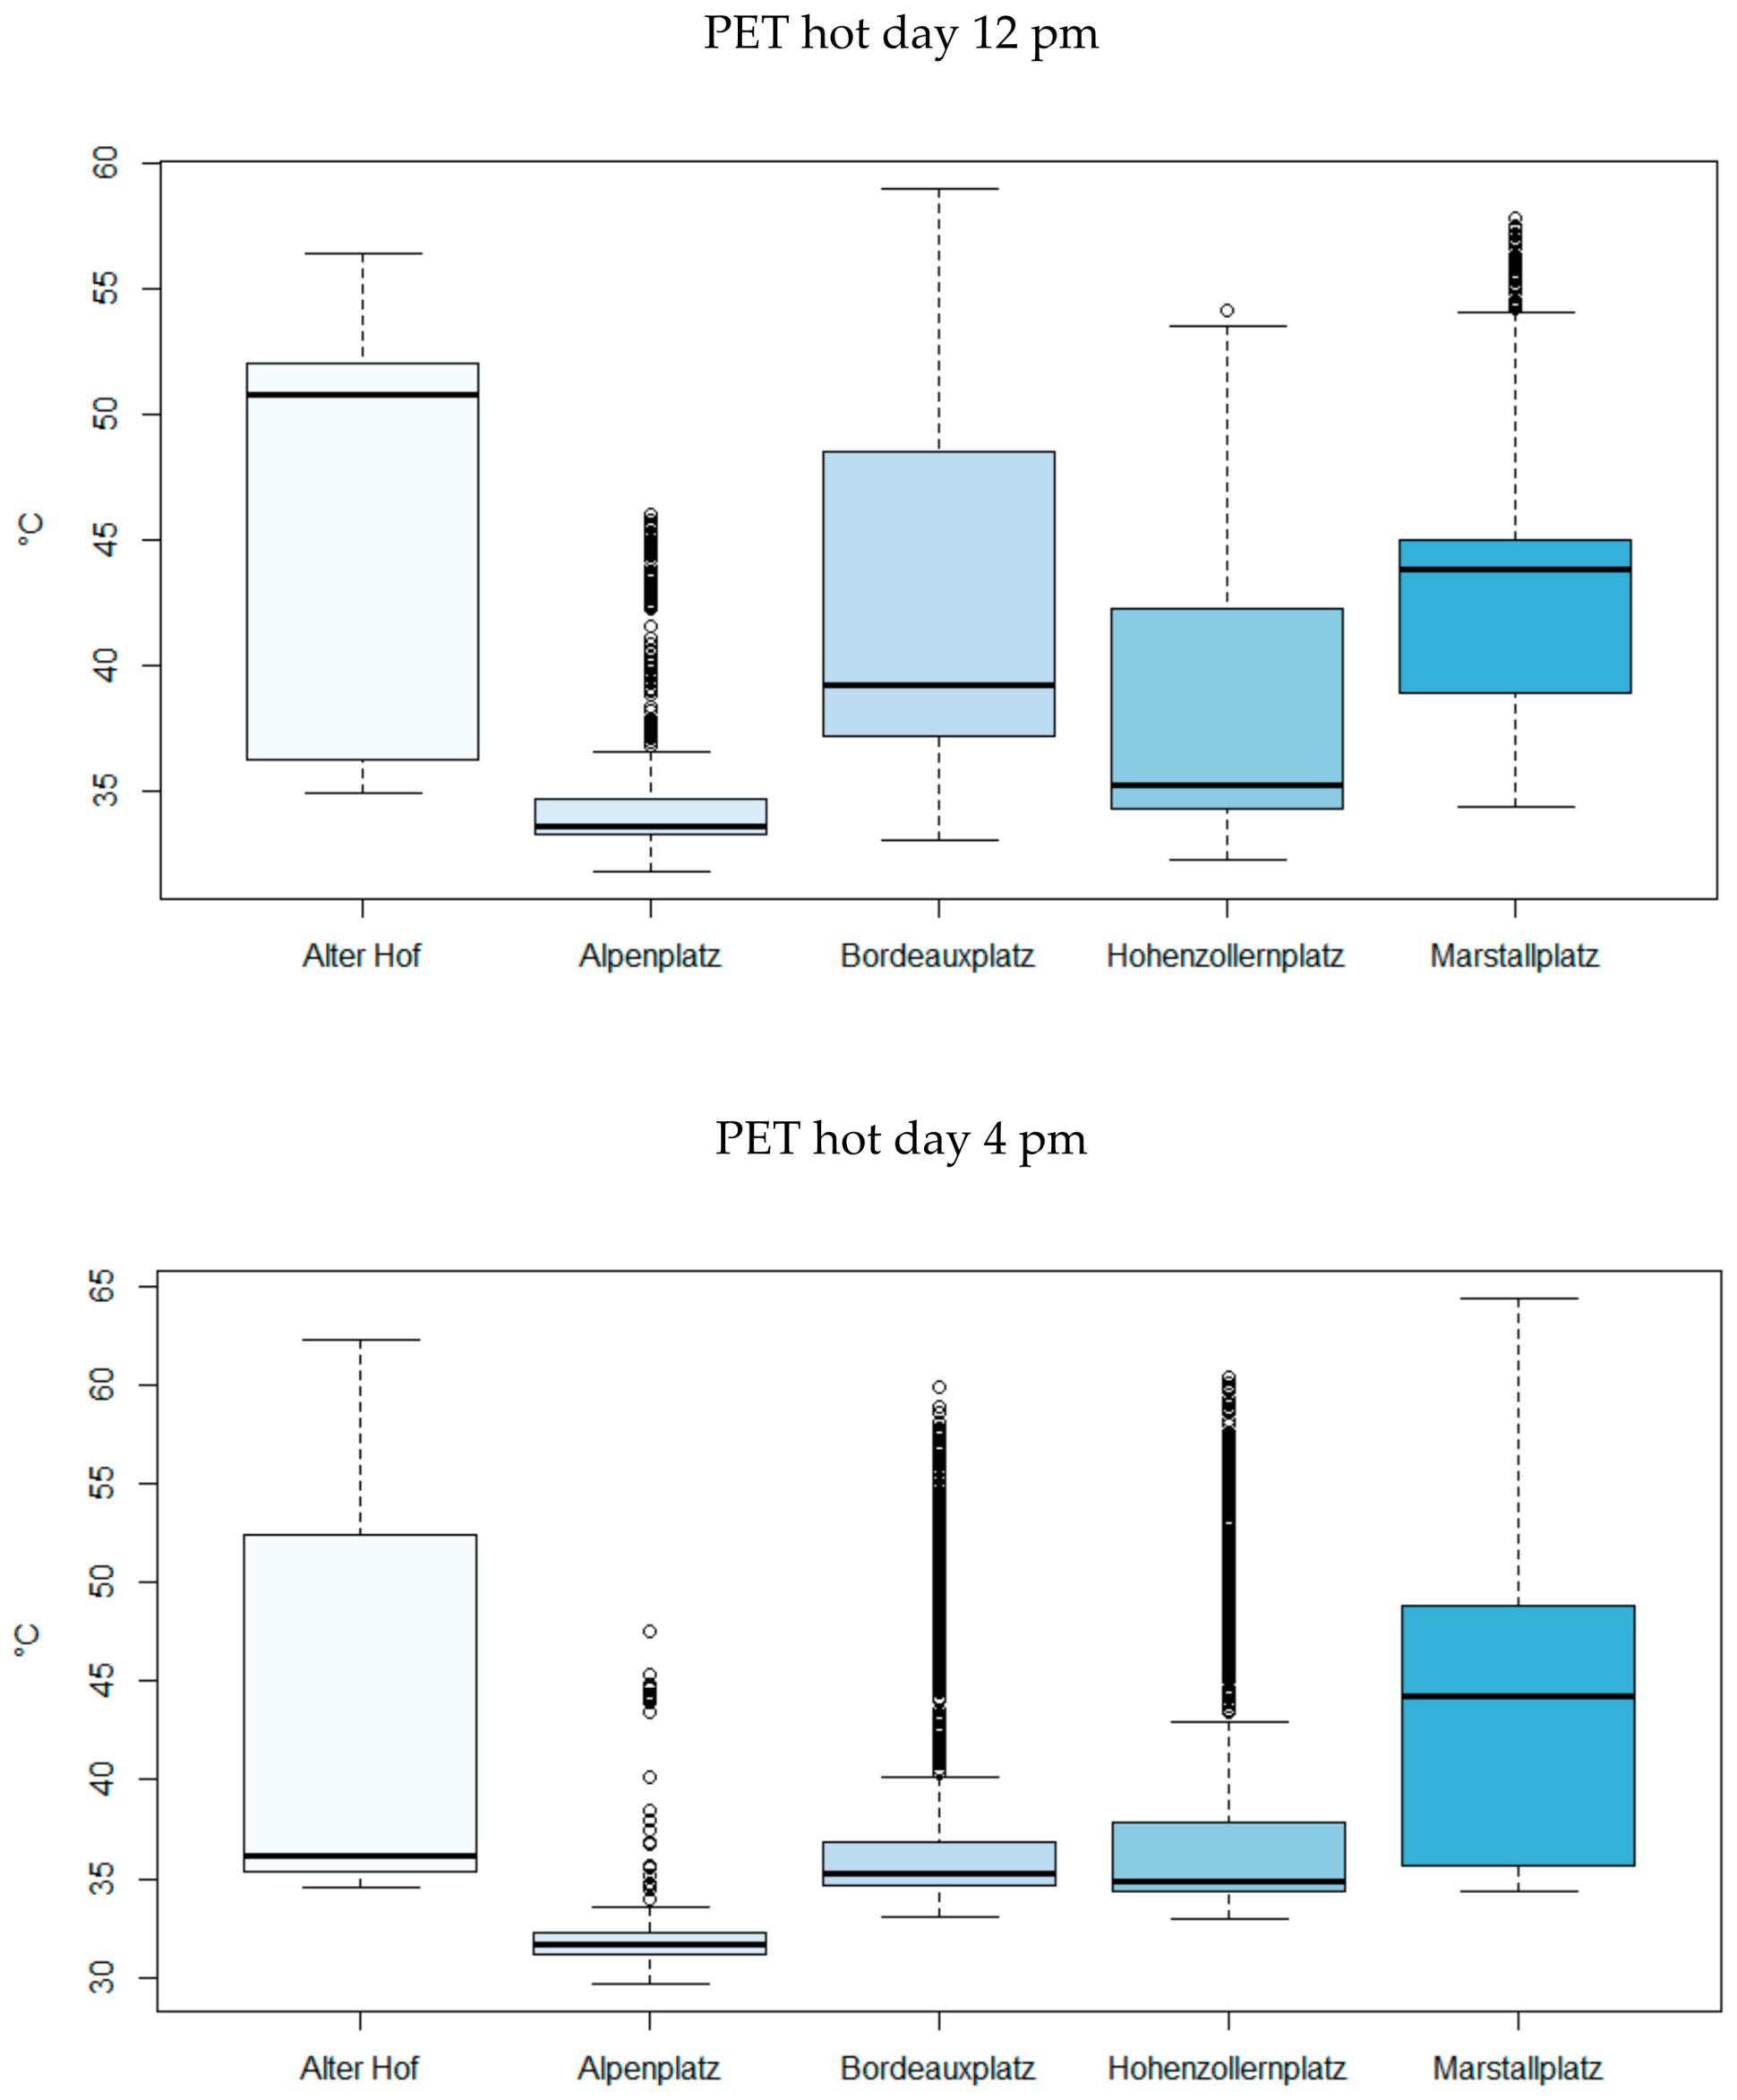
3.1. Hot Day
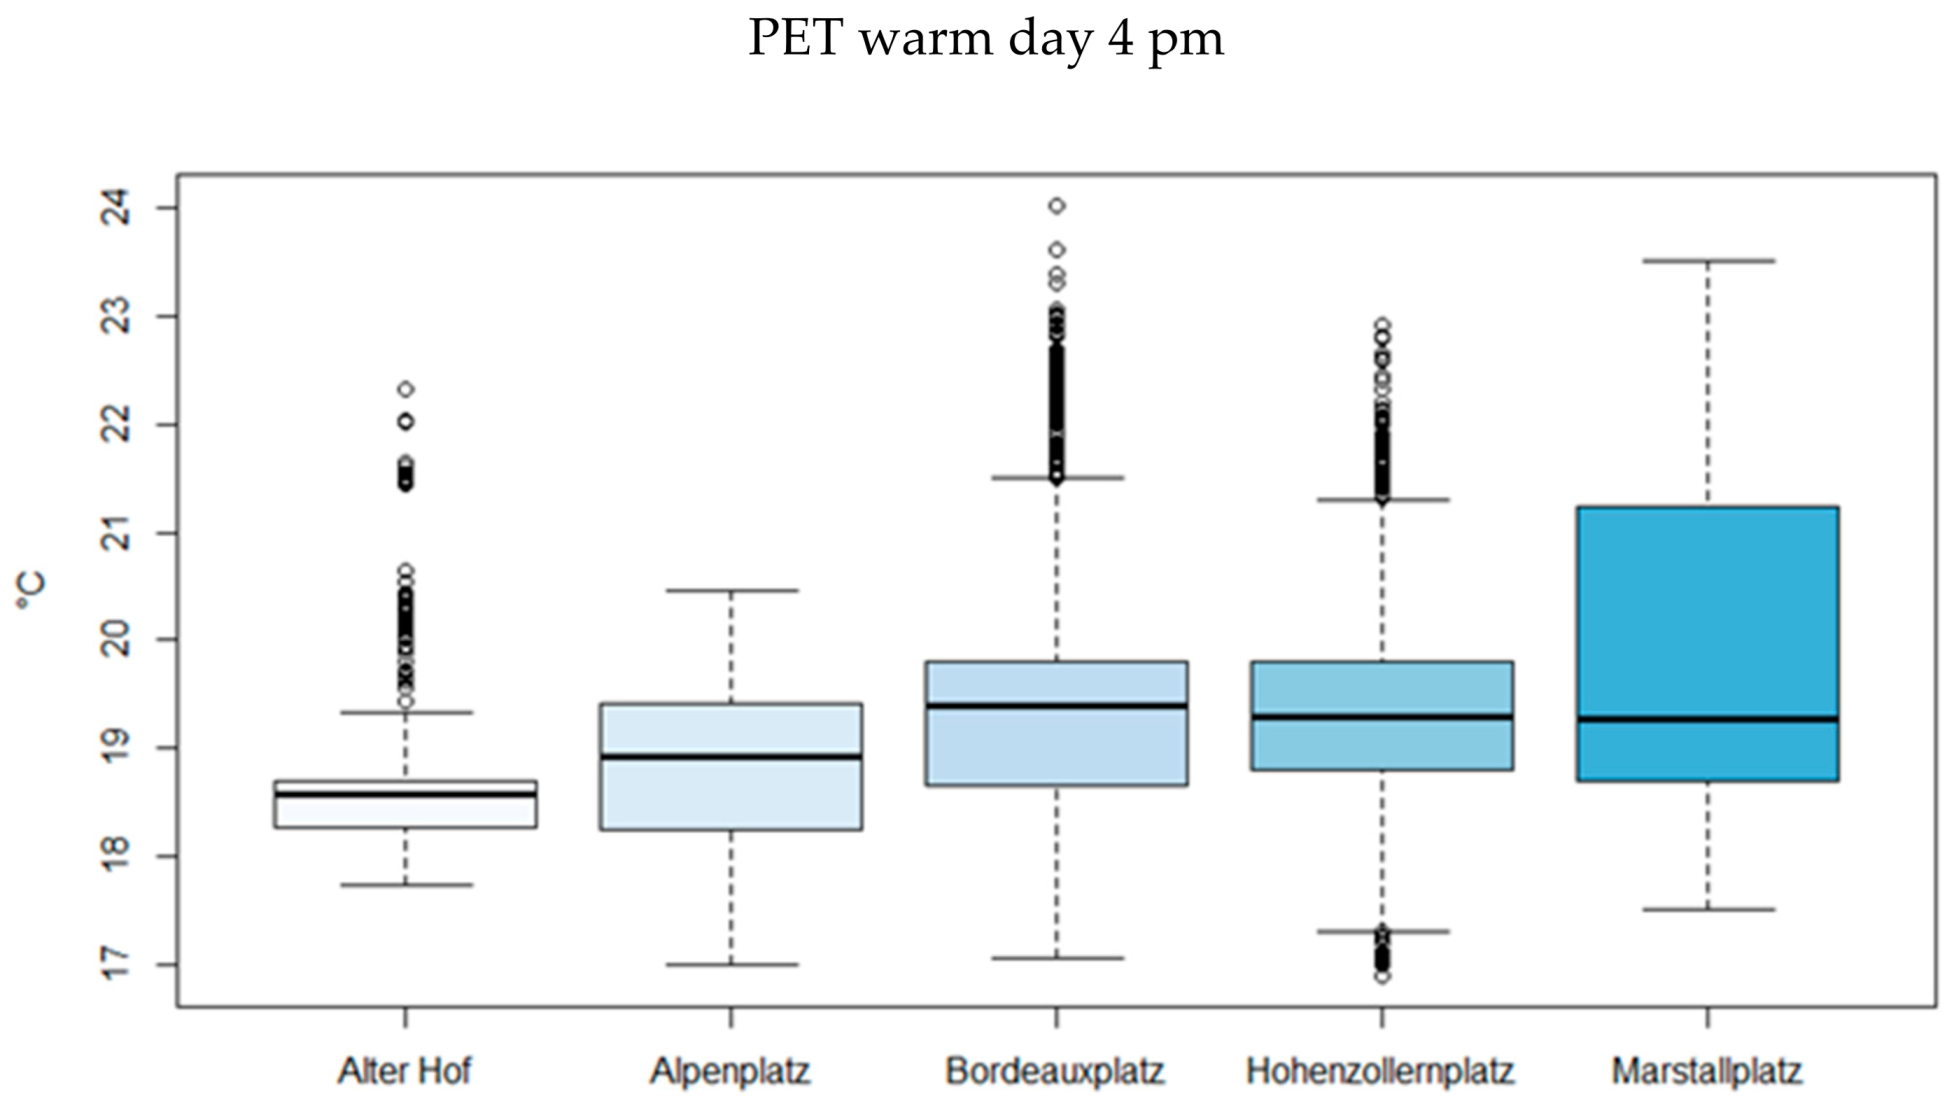
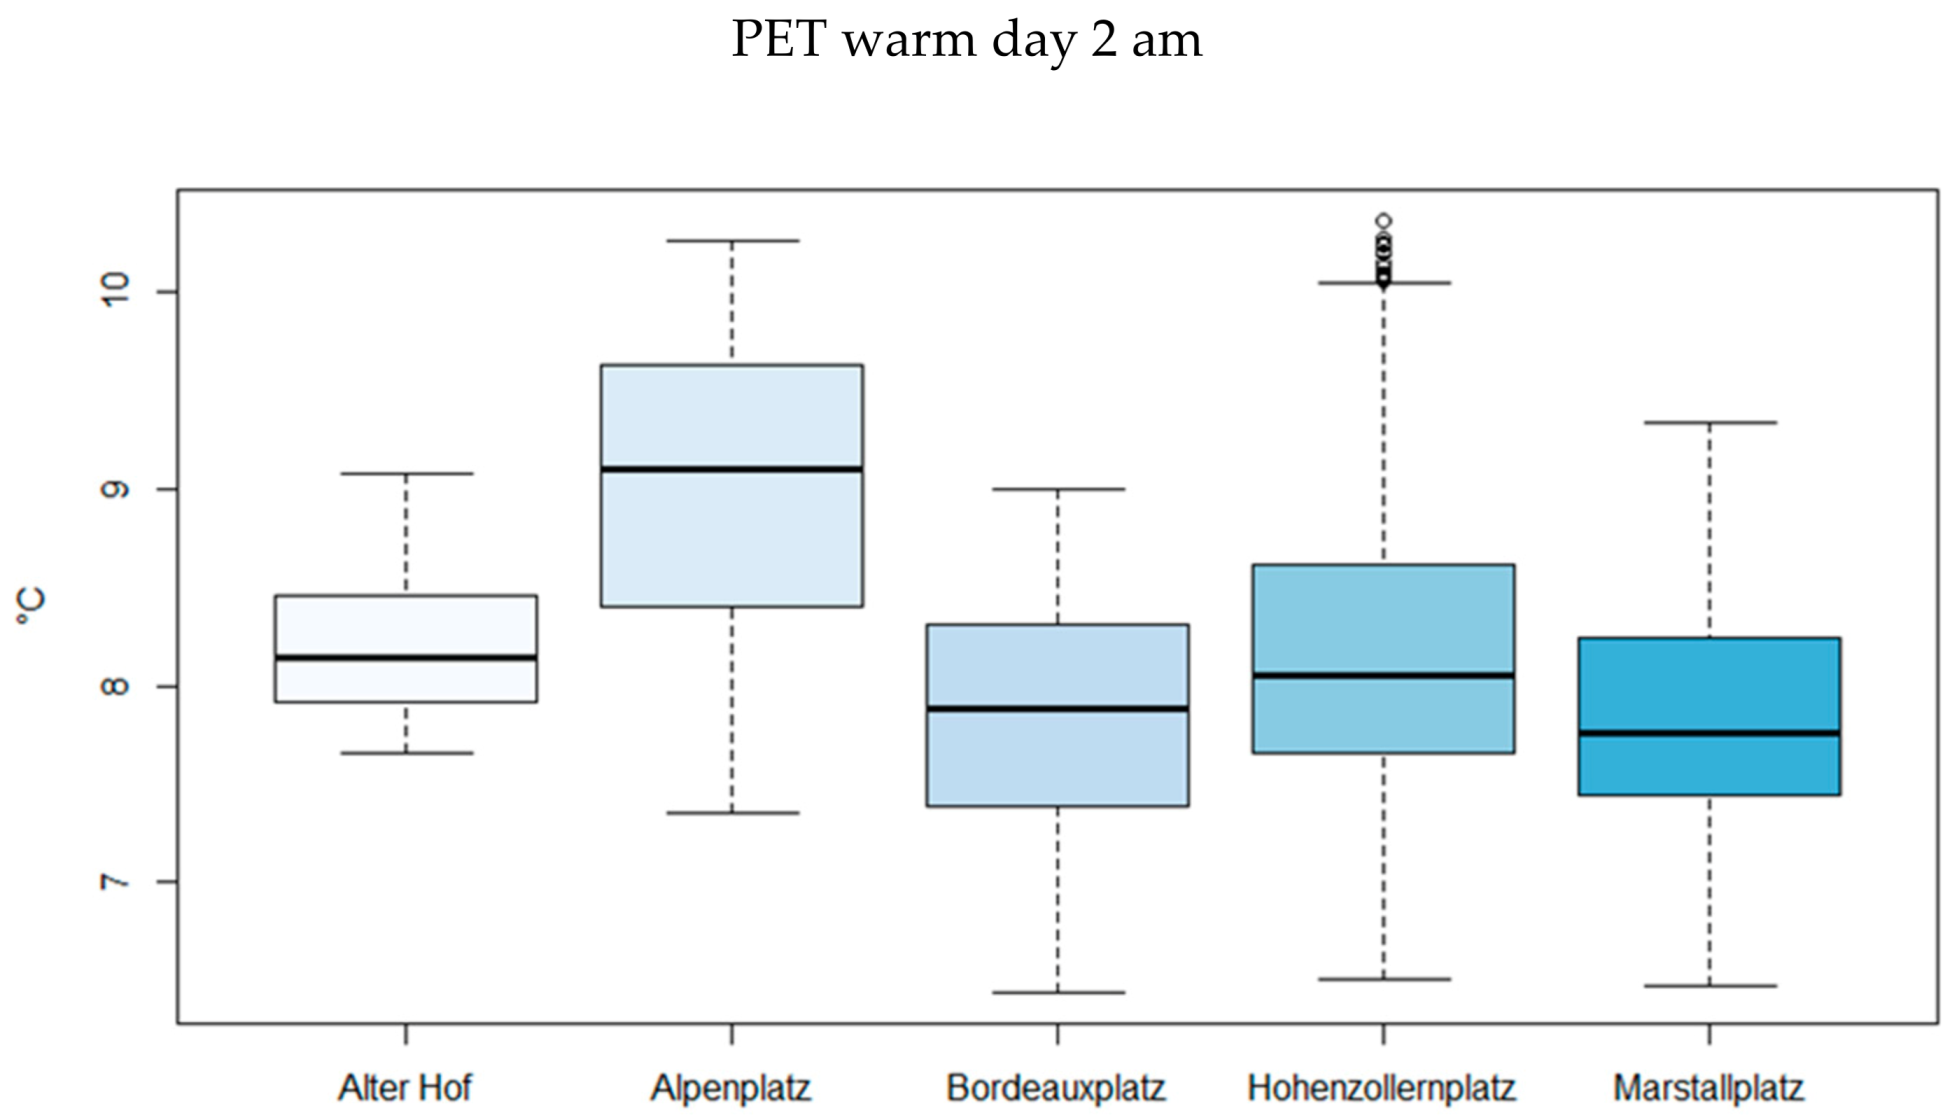
3.2. Warm Day
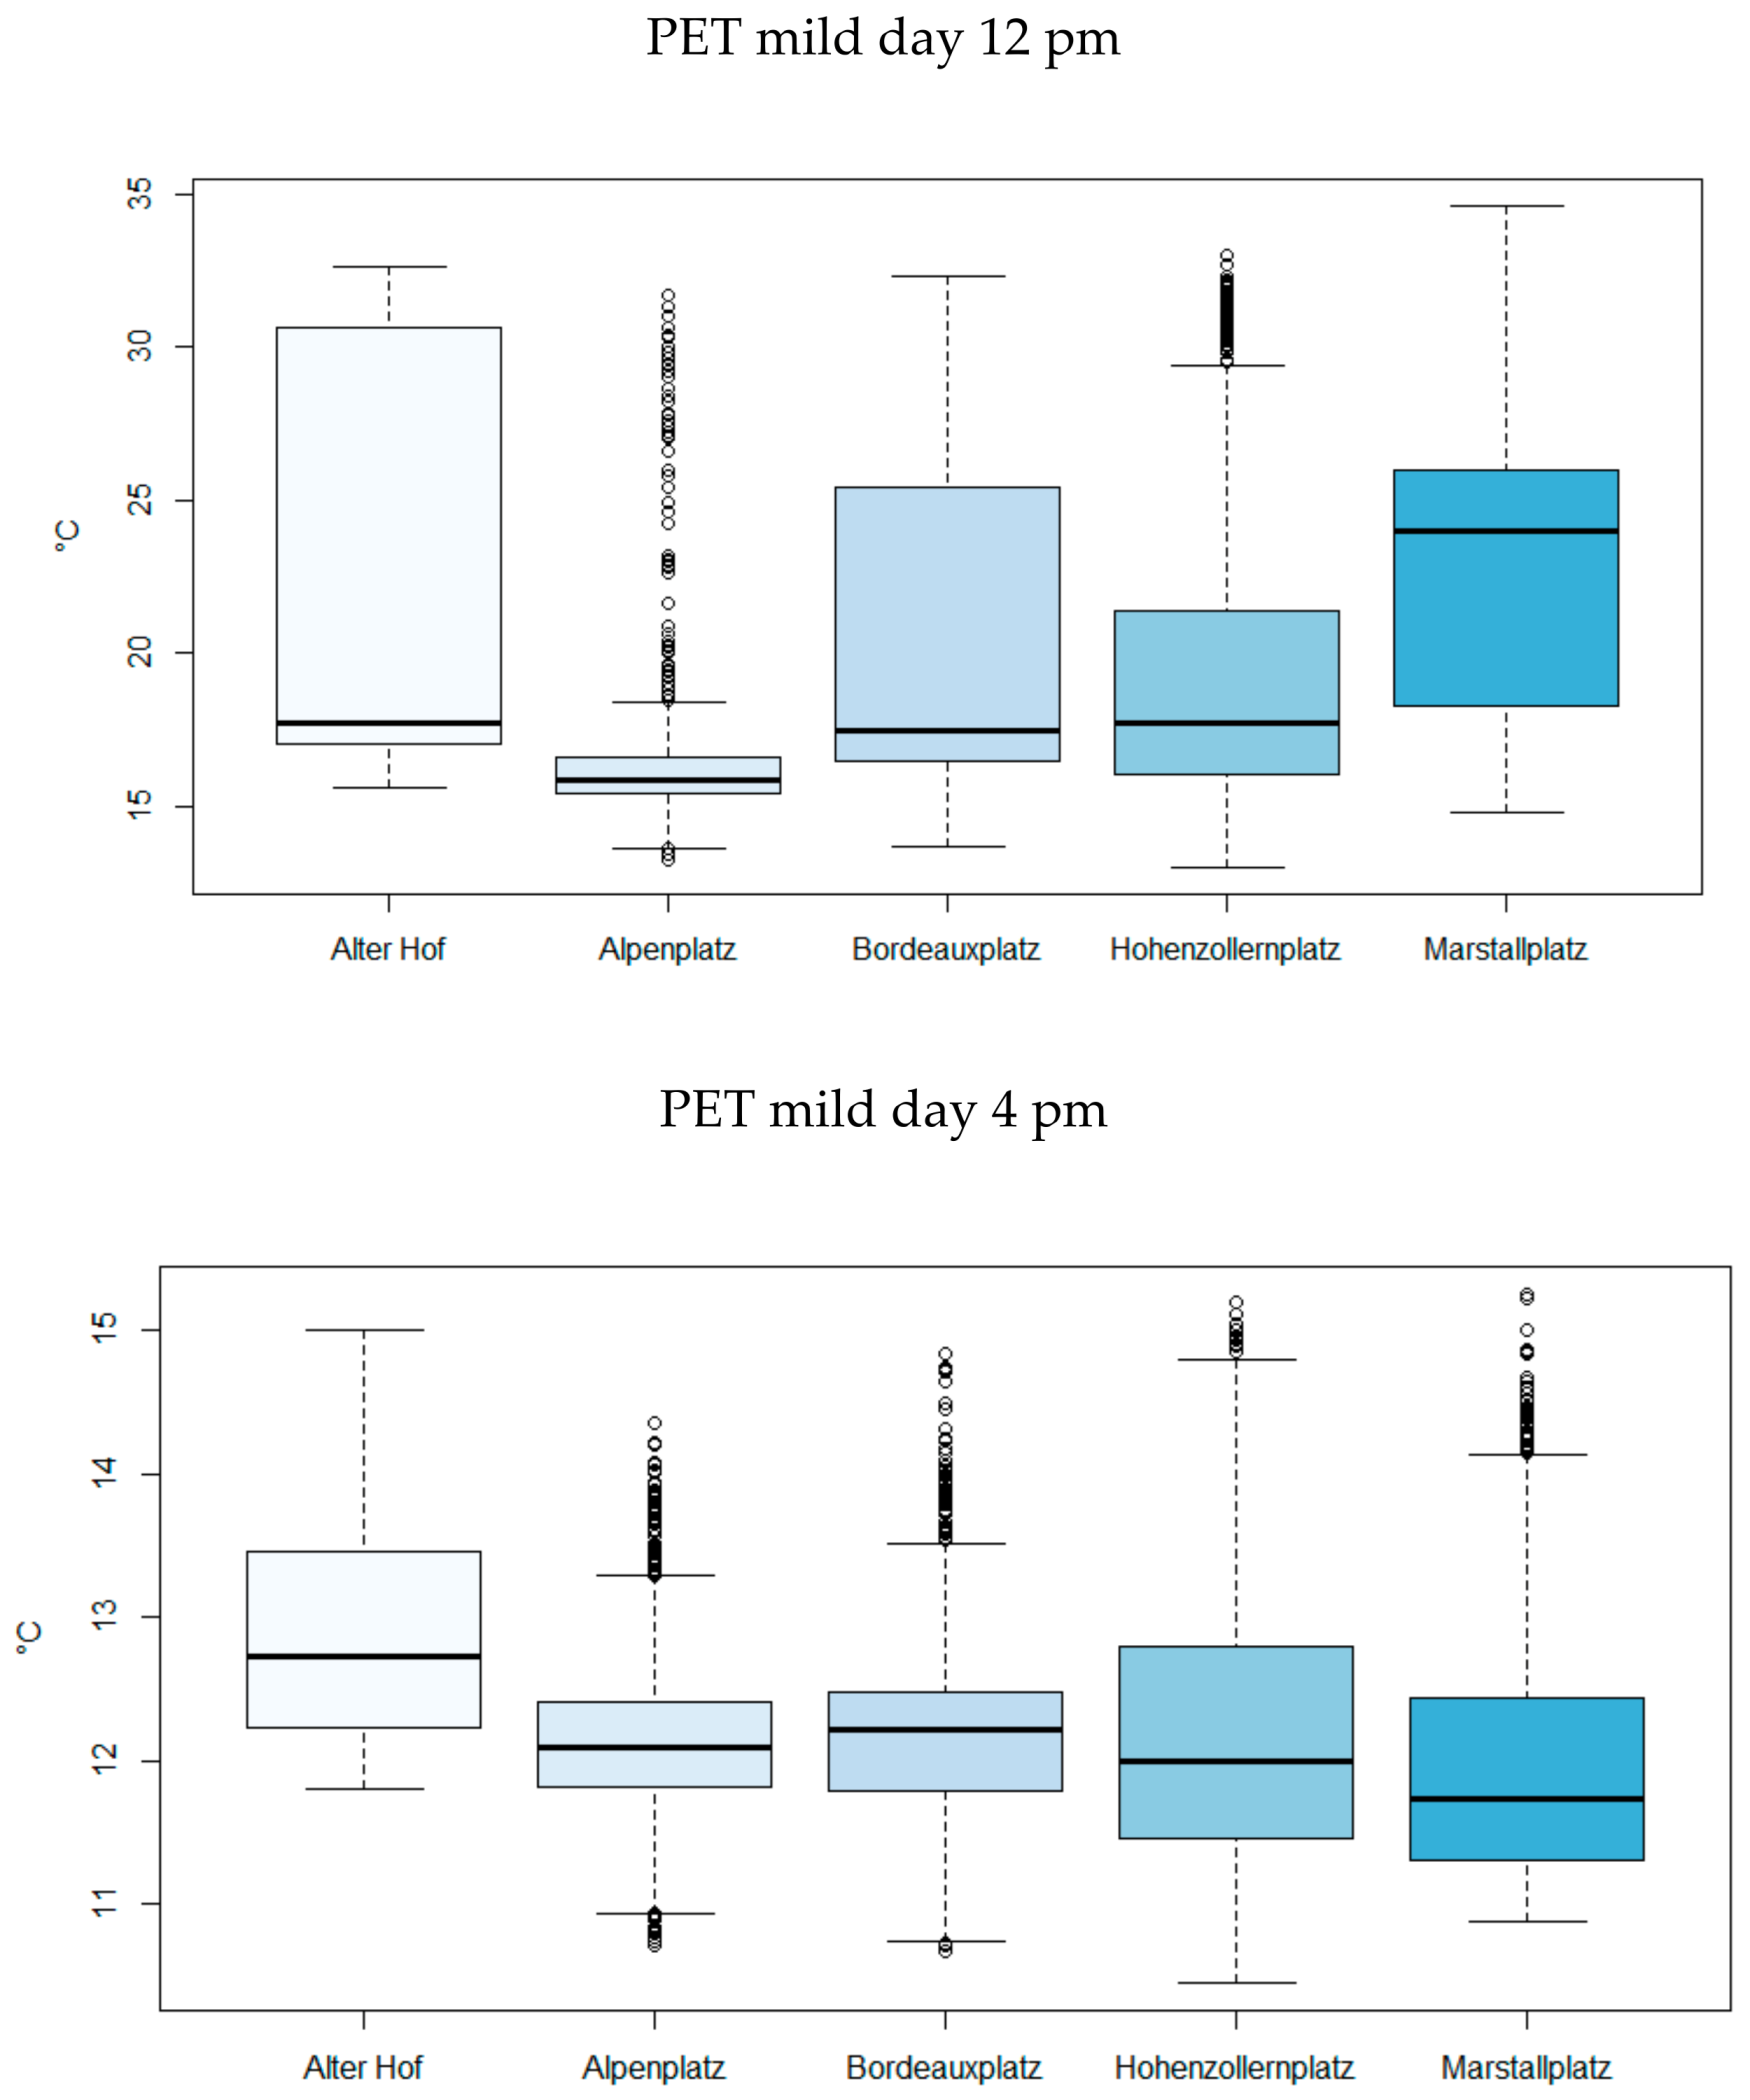
3.3. Mild Day
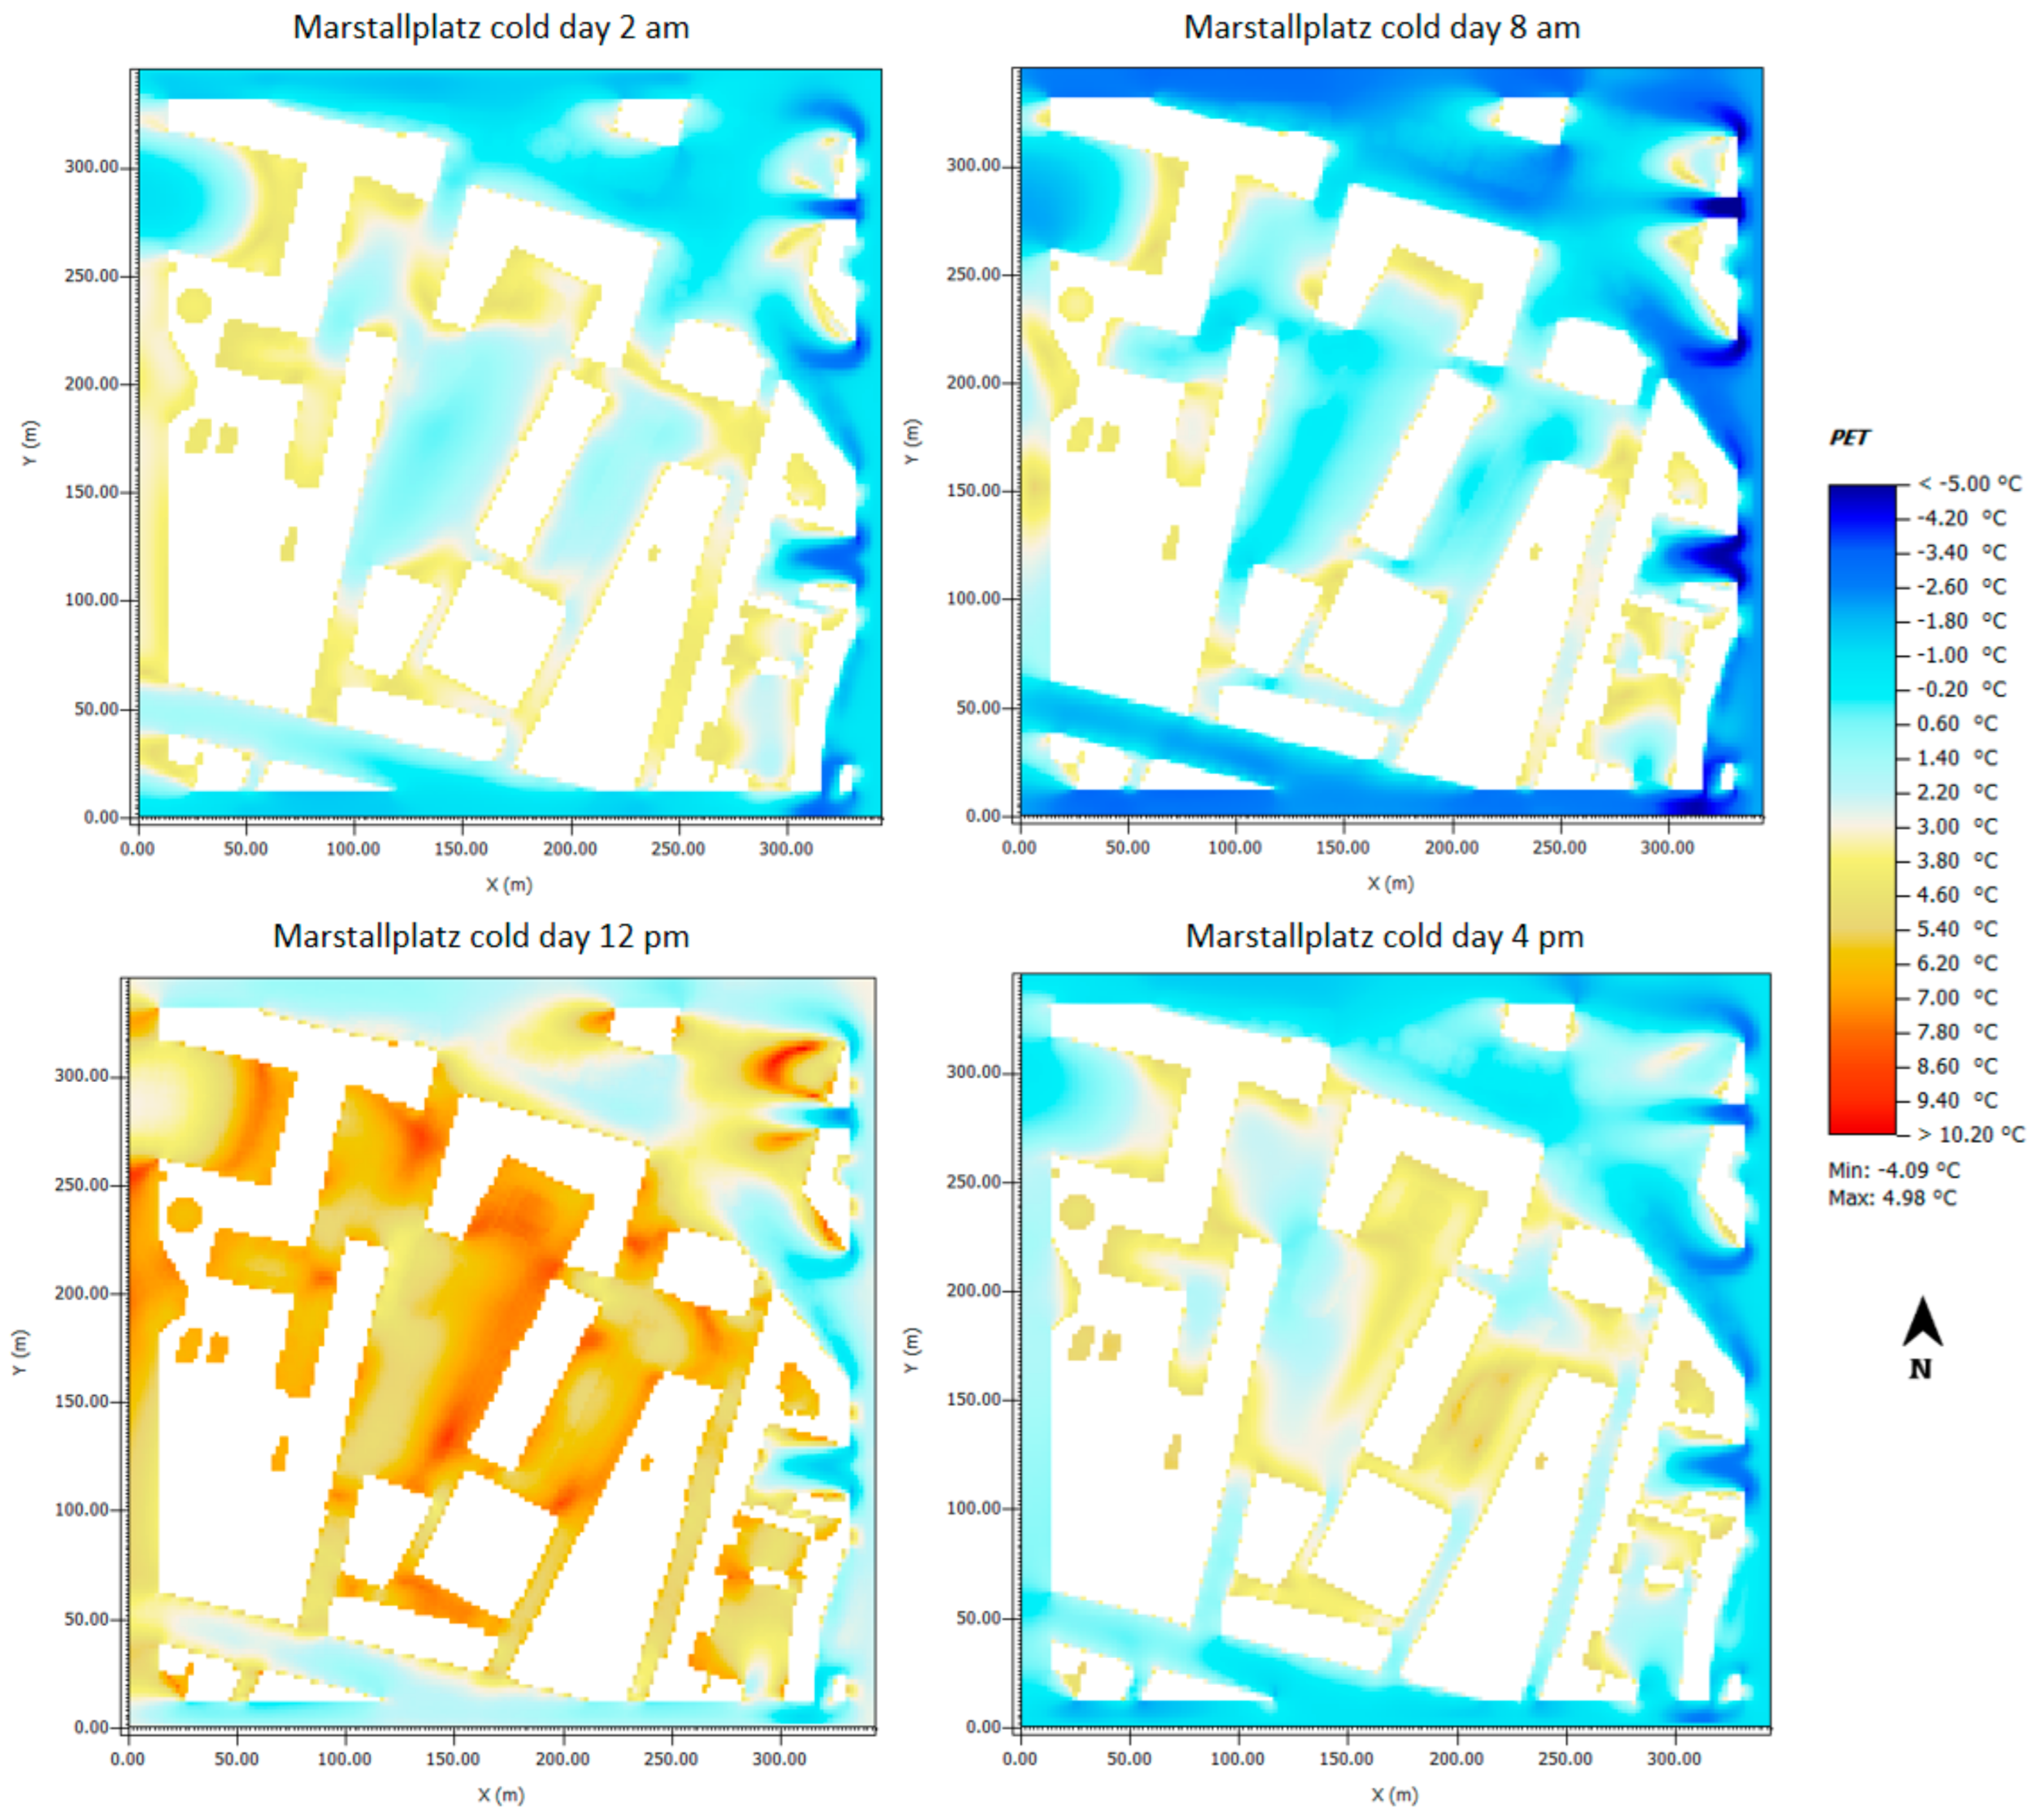
3.4. Cold Day
3.5. Cold and Humid Day
4. Discussion
Limitations of the Methodological Approach
5. Conclusions
Author Contributions
Funding
Data Availability Statement
Acknowledgments
Conflicts of Interest
References
- Erell, E. Urban Greening and Microclimate Modification. In Greening Cities; Springer: Singapore, 2017; pp. 73–93. [Google Scholar]
- Haaland, C.; van den Bosch, C.K. Challenges and strategies for urban green-space planning in cities undergoing densification: A review. Urban For. Urban Green. 2015, 14, 760–771. [Google Scholar] [CrossRef]
- Van den Berg, M.; Wendel-Vos, W.; van Poppel, M.; Kemper, H.; van Mechelen, W.; Maas, J. Health benefits of green spaces in the living environment: A systematic review of epidemiological studies. Urban For. Urban Green. 2015, 14, 806–816. [Google Scholar] [CrossRef]
- Berto, R. The role of nature in coping with psycho-physiological stress: A literature review on restorativeness. Behav. Sci. 2014, 4, 394–409. [Google Scholar] [CrossRef] [PubMed]
- Nieuwenhuijsen, M.J.; Khreis, H.; Triguero-Mas, M.; Gascon, M.; Dadvand, P. Fifty Shades of Green: Pathway to Healthy Urban Living. Epidemiology 2017, 28, 63–71. [Google Scholar] [CrossRef]
- Rodgers, C. Nourishing and protecting our urban ‘green’ space in a post-pandemic world. Environ. Law Rev. 2020, 22, 165–169. [Google Scholar] [CrossRef]
- Heo, S.; Chen, C.; Kim, H.; Sabath, B.; Dominici, F.; Warren, J.L.; Di, Q.; Schwartz, J.; Bell, M.L. Temporal changes in associations between high temperature and hospitalizations by greenspace: Analysis in the Medicare population in 40 U.S. northeast counties. Environ. Int. 2021, 156, 106737. [Google Scholar] [CrossRef]
- Karimi, A.; Sanaieian, H.; Farhadi, H.; Norouzian-Maleki, S. Evaluation of the thermal indices and thermal comfort improvement by different vegetation species and materials in a medium-sized urban park. Energy Rep. 2020, 6, 1670–1684. [Google Scholar] [CrossRef]
- Taleghani, M. Outdoor thermal comfort by different heat mitigation strategies—A review. Renew. Sustain. Energy Rev. 2018, 81, 2011–2018. [Google Scholar] [CrossRef]
- Zölch, T.; Rahman, M.A.; Pfleiderer, E.; Wagner, G.; Pauleit, S. Designing public squares with green infrastructure to optimize human thermal comfort. Build. Environ. 2019, 149, 640–654. [Google Scholar] [CrossRef]
- Mayer, H.; Höppe, P. Thermal comfort of man in different urban environments. Theor. Appl. Climatol. 1987, 38, 43–49. [Google Scholar] [CrossRef]
- Höppe, P. The physiological equivalent temperature—A universal index for the biometeorological assessment of the thermal environment. Int. J. Biometeorol. 1999, 43, 71–75. [Google Scholar] [CrossRef]
- Bernard, J.; Rodler, A.; Morille, B.; Zhang, X. How to Design a Park and Its Surrounding Urban Morphology to Optimize the Spreading of Cool Air? Climate 2018, 6, 10. [Google Scholar] [CrossRef]
- Chang, C.-R.; Li, M.-H. Effects of urban parks on the local urban thermal environment. Urban For. Urban Green. 2014, 13, 672–681. [Google Scholar] [CrossRef]
- Kariminia, S.; Ahmad, S.S. Microclimatic Conditions of an Urban Square: Role of built environment and geometry. AjBeS 2018, 3, 115. [Google Scholar] [CrossRef]
- Karimi, A.; Mohammad, P. Effect of outdoor thermal comfort condition on visit of tourists in historical urban plazas of Sevilla and Madrid. Environ. Sci. Pollut. Res. Int. 2022, 29, 60641–60661. [Google Scholar] [CrossRef]
- Klemm, W. Clever and Cool: Generating Design Guidelines for Climate Responsive Urban Green Infrastructure. Ph.D. Thesis, Wageningen University, Wageningen, The Nederlands, 2018. [Google Scholar]
- Lau, S.S.; Lin, P.; Qin, H. A preliminary study on environmental performances of pocket parks in high-rise and high-density urban context in Hong Kong. Int. J. Low Carbon Technol. 2012, 7, 215–225. [Google Scholar] [CrossRef]
- Gherraz, H.; Guechi, I.; Benzaoui, A. Strategy to Improve Outdoor Thermal Comfort in Open Public Space of a Desert City, Ouargla, Algeria. IOP Conf. Ser. Earth Environ. Sci. 2018, 151, 12036. [Google Scholar] [CrossRef]
- Mahmoud, A.H.A. Analysis of the microclimatic and human comfort conditions in an urban park in hot and arid regions. Build. Environ. 2011, 46, 2641–2656. [Google Scholar] [CrossRef]
- Nikolopoulou, M.; Lykoudis, S. Use of outdoor spaces and microclimate in a Mediterranean urban area. Build. Environ. 2007, 42, 3691–3707. [Google Scholar] [CrossRef]
- Xu, M.; Hong, B.; Jiang, R.; An, L.; Zhang, T. Outdoor thermal comfort of shaded spaces in an urban park in the cold region of China. Build. Environ. 2019, 155, 408–420. [Google Scholar] [CrossRef]
- Wei, D.; Yang, L.; Bao, Z.; Lu, Y.; Yang, H. Variations in outdoor thermal comfort in an urban park in the hot-summer and cold-winter region of China. Sustain. Cities Soc. 2021, 77, 103535. [Google Scholar] [CrossRef]
- Xiao, J.; Yuizono, T. Climate-adaptive landscape design: Microclimate and thermal comfort regulation of station square in the Hokuriku Region, Japan. Build. Environ. 2022, 212, 108813. [Google Scholar] [CrossRef]
- Rahman, M.A.; Franceschi, E.; Pattnaik, N.; Moser-Reischl, A.; Hartmann, C.; Paeth, H.; Pretzsch, H.; Rötzer, T.; Pauleit, S. Spatial and temporal changes of outdoor thermal stress: Influence of urban land cover types. Sci. Rep. 2022, 12, 671. [Google Scholar] [CrossRef]
- Irmak, M.A.; Yilmaz, S.; Mutlu, E.; Yilmaz, H. Analysis of different urban spaces on thermal comfort in cold regions: A case from Erzurum. Appl. Clim. 2020, 141, 1593–1609. [Google Scholar] [CrossRef]
- Matzarakis, A.; Rutz, F.; Mayer, H. Modelling radiation fluxes in simple and complex environments: Basics of the RayMan model. Int. J. Biometeorol. 2010, 54, 131–139. [Google Scholar] [CrossRef]
- Huang, K.-T.; Lin, T.-P.; Lien, H.-C. Investigating Thermal Comfort and User Behaviors in Outdoor Spaces: A Seasonal and Spatial Perspective. Adv. Meteorol. 2015, 2015, 42350. [Google Scholar] [CrossRef]
- Lin, T.-P. Thermal perception, adaptation and attendance in a public square in hot and humid regions. Build. Environ. 2009, 44, 2017–2026. [Google Scholar] [CrossRef]
- Thorsson, S.; Honjo, T.; Lindberg, F.; Eliasson, I.; Lim, E.-M. Thermal Comfort and Outdoor Activity in Japanese Urban Public Places. Environ. Behav. 2007, 39, 660–684. [Google Scholar] [CrossRef]
- Jendritzky, G.; de Dear, R.; Havenith, G. UTCI—Why another thermal index? Int. J. Biometeorol. 2012, 56, 421–428. [Google Scholar] [CrossRef]
- Zhang, J.; Li, Z.; Hu, D. Effects of urban morphology on thermal comfort at the micro-scale. Sustain. Cities Soc. 2022, 86, 104150. [Google Scholar] [CrossRef]
- German Meteorological Service. Vieljährige Stationsmittelwerte für die Klimareferenzperiode 1981–2010, für Aktuellen Standort und Bezugsstandort: Stations-ID 3379 Muenchen-Stadt. Multi-Year Station Mean Values for the Climate Reference Period 1981–2010, for Current Location and Reference Site: Station ID 3379 Munich City. 2018. Available online: https://opendata.dwd.de/ (accessed on 5 February 2023).
- Mühlbacher, G.; Koßmann, M.; Sedlmaier, K.; Winderlich, K. Stadtklimatische Untersuchungen der Sommerlichen Temperaturverhältnisse und des Tagesgangs des Regionalwindes (“Al-Pines Pumpen”) in München. Offenbach: Deutscher Wetterdienst (Berichte des Deutschen Wetterdienstes, 252). 2020. Available online: https://www.dwd.de/DE/leistungen/pbfbverlagberichte/pdfeinzelbaende/252pdf.pdf?blob=publicationFile&v=4 (accessed on 5 February 2023).
- Landeshauptstadt München. München in Zahlen: Daten und Statistiken der Stadt München. 2021. Available online: https://www.muenchen.de/sehenswuerdigkeiten/muenchen-in-zahlen.html (accessed on 20 December 2021).
- Keller, R. Projektsteckbrief 100 Places: M Untersuchung der Auswirkung des Wärmeinseleffekts auf den Öffentlichen Raum am Beispiel Münchens. Available online: https://www.zsk.tum.de/fileadmin/w00bqp/www/PDFs/TP4/200428_Steckbrief_TP4_FINAL.pdf (accessed on 5 February 2023).
- Bruse, M.; Fleer, H. Simulating surface–plant–air interactions inside urban environments with a three dimensional numerical model. Environ. Model. Softw. 1998, 13, 373–384. [Google Scholar] [CrossRef]
- Gusson, C.S.; Duarte, D.H. Effects of Built Density and Urban Morphology on Urban Microclimate—Calibration of the Model ENVI-met V4 for the Subtropical Sao Paulo, Brazil. Procedia Eng. 2016, 169, 2–10. [Google Scholar] [CrossRef]
- Stark da Silva, P.W.; Duarte, D.H.S. Green walls simulation for subtropical climates: Sensitivity tests with ENVI-met V4. Proc. Smart Healthy Two-Degree Limit 2018, 3, 1009–1010. [Google Scholar]
- Shinzato, P.; Simon, H.; Silva Duarte, D.H.; Bruse, M. Calibration process and parametrization of tropical plants using ENVI-met V4–Sao Paulo case study. Archit. Sci. Rev. 2019, 62, 112–125. [Google Scholar] [CrossRef]
- Elraouf, R.A.; ELMokadem, A.; Megahed, N.; Eleinen, O.A.; Eltarabily, S. Evaluating urban outdoor thermal comfort: A validation of ENVI-met simulation through field measurement. J. Build. Perform. Simul. 2022, 15, 268–286. [Google Scholar] [CrossRef]
- Matzarakis, A.; Mayer, H. Another kind of environmental stress: Thermal stress. Newsl. Inst. Water Soil Air Hyg. Fed. Environ. Agency 1996, 18, 7–10. [Google Scholar]
- Watson, I.D.; Johnson, G.T. Graphical estimation of sky view-factors in urban environments. J. Climatol. 1987, 7, 193–197. [Google Scholar] [CrossRef]
- Oke, T.R. The energetic basis of the urban heat island. Q. J. R. Meteorol. Soc. 1982, 108, 1–24. [Google Scholar] [CrossRef]
- Ali Toudert, F. Dependence of Outdoor Thermal Comfort on Street Design in Hot and Dry Climate. Ph.D. Thesis, Freiburg Universität, Freiburg im Breisgau, Germany, 2005. [Google Scholar]
- Chen, L.; Ng, E. Outdoor thermal comfort and outdoor activities: A review of research in the past decade. Cities 2012, 29, 118–125. [Google Scholar] [CrossRef]
- Oke, T.R. Boundary Layer Climates, 2nd ed; Methuen & Co: London, UK, 1987. [Google Scholar]
- Lee, H.; Mayer, H.; Chen, L. Contribution of trees and grasslands to the mitigation of human heat stress in a residential district of Freiburg, Southwest Germany. Landsc. Urban Plan. 2016, 148, 37–50. [Google Scholar] [CrossRef]
- Rahman, M.A.; Stratopoulos, L.M.; Moser-Reischl, A.; Zölch, T.; Häberle, K.-H.; Rötzer, T.; Pretzsch, H.; Pauleit, S. Traits of trees for cooling urban heat islands: A meta-analysis. Build. Environ. 2020, 170, 106606. [Google Scholar] [CrossRef]
- Shashua-Bar, L.; Hoffman, M.E. Vegetation as a climatic component in the design of an urban street. Energy Build. 2000, 31, 221–235. [Google Scholar] [CrossRef]
- Unal Cilek, M.; Uslu, C. Modeling the relationship between the geometric characteristics of urban green spaces and thermal comfort: The case of Adana city. Sustain. Cities Soc. 2022, 79, 103748. [Google Scholar] [CrossRef]


| Square | Area (m2) | Impervious Percentage | Number of Trees | Boundaries |
|---|---|---|---|---|
| Alter Hof | 3546 | 100% | 3 | Buildings |
| Alpenplatz | 3317 | 20% | 30 | Streets |
| Bordeauxplatz | 14,018 | 30% | 84 | Streets |
| Hohenzollernplatz | 10,150 | 89% | 90 | Buildings and streets |
| Marstallplatz | 9517 | 91% | 18 | Buildings |
| Day Classification | Cold | Mild | Hot | Warm | Cold and Humid |
|---|---|---|---|---|---|
| Start of simulation | 23 January 2020 | 26 March 2020 | 30 July 2020 | 18 September 2020 | 5 November 2020 |
| Duration of simulations | 48 h | ||||
| Min/Max Ta | −3.9/8.6 °C | −2.0/16.5 °C | 17.6/33.7 °C | 7.1/22.4 °C | 2.3/11.3 °C |
| Min/Max RH | 48/95% | 35/80% | 33/91% | 49/91% | 84/97% |
| Daily sum of solar incoming radiation | 287 J/cm2 | 1770 J/cm2 | 2676 J/cm2 | 1786 J/m2 | 636 J/cm2 |
| Model grid size/resolution | Alter Hof, Alpenplatz, Bordeauxplatz, Hohenzollernplatz 150 × 150 × 25 (x,y,z)/Vertical equidistant grid Marstallplatz 172 × 172 × 25 (x,y,z)/Vertical equidistant grid | ||||
| Building material | Default wall—moderate insulation | ||||
| Soil material | Sandy clay loam, granite, asphalt with gravel | ||||
| Relative soil humidity | Upper layer: 70%, Middle and deep layers: 75% | ||||
| Lateral boundary conditions | Full forcing | ||||
| PET (°C) | <4 | 4~8 | 8~13 | 13~18 | 18~23 | 23~29 | 29~35 | 35~41 | >41 |
|---|---|---|---|---|---|---|---|---|---|
| Grade of physiological stress | Extreme cold stress | Strong cold stress | Moderate cold stress | Slight cold stress | No thermal stress | Slight heat stress | Moderate heat stress | Strong heat stress | Extreme heat stress |
Disclaimer/Publisher’s Note: The statements, opinions and data contained in all publications are solely those of the individual author(s) and contributor(s) and not of MDPI and/or the editor(s). MDPI and/or the editor(s) disclaim responsibility for any injury to people or property resulting from any ideas, methods, instructions or products referred to in the content. |
© 2023 by the authors. Licensee MDPI, Basel, Switzerland. This article is an open access article distributed under the terms and conditions of the Creative Commons Attribution (CC BY) license (https://creativecommons.org/licenses/by/4.0/).
Share and Cite
Stark da Silva, P.W.; Duarte, D.; Pauleit, S. The Role of the Design of Public Squares and Vegetation Composition on Human Thermal Comfort in Different Seasons a Quantitative Assessment. Land 2023, 12, 427. https://doi.org/10.3390/land12020427
Stark da Silva PW, Duarte D, Pauleit S. The Role of the Design of Public Squares and Vegetation Composition on Human Thermal Comfort in Different Seasons a Quantitative Assessment. Land. 2023; 12(2):427. https://doi.org/10.3390/land12020427
Chicago/Turabian StyleStark da Silva, Priscila Weruska, Denise Duarte, and Stephan Pauleit. 2023. "The Role of the Design of Public Squares and Vegetation Composition on Human Thermal Comfort in Different Seasons a Quantitative Assessment" Land 12, no. 2: 427. https://doi.org/10.3390/land12020427
APA StyleStark da Silva, P. W., Duarte, D., & Pauleit, S. (2023). The Role of the Design of Public Squares and Vegetation Composition on Human Thermal Comfort in Different Seasons a Quantitative Assessment. Land, 12(2), 427. https://doi.org/10.3390/land12020427