Abstract
The large-scale construction of photovoltaic (PV) panels causes heterogeneity in environmental factors, such as light, precipitation, and wind speed, which may lead to microhabitat climate changes that may affect ecosystems. In this study, plant–soil–microbial systems in shady and non-shady gaps of PV panels in a solar park in Northern China were investigated. The shading caused by the PV panels significantly affected the alpha diversity of plant and fungal communities (p < 0.05). The compositions of plant and soil microbial (bacteria, fungi, and protists) communities were significantly different between shady and non-shady areas (p < 0.05), and the beta diversity of the plant community was significantly correlated with that of the soil microbial community (p < 0.05). Shading enhanced the complexity of microbial communities by strengthening the associations among soil microbes. Photosynthetically active radiation was the main driving factor in the assembly of aboveground and belowground communities on a small scale, and it indirectly shaped the microbial community through its effects on the plant community. This study highlights the important effects of light on microbial community formation and on the relationships among communities in plant–soil–microbial systems. Thus, the effects of solar park establishment on degraded ecosystems should be considered.
1. Introduction
Contributions from renewable energy sources, such as wind and solar, are predicted to increase by 600% from 2009 to 2035 [1], and solar photovoltaic (PV) technology is developing rapidly in China [2]. Densely arranged PV panels in solar parks alter wind directions and speeds, air and soil temperatures, precipitation and evapotranspiration levels, and the balance between direct and diffuse radiation, causing changes in surface energy fluxes and microclimate [3]. These alterations affect the diversity levels and compositions of aboveground and belowground communities [4], which then might alter the structure and even function of ecosystems [5]. Because of the continued, increasing changes in land use, it is important to understand the impact of microclimate changes on the structures and processes of plant–microbe–soil systems.
Plants impact the composition and structure of belowground microbial taxa [6,7], and the microorganisms, in turn, impact the occurrence and survival of plants [8]. Thus, plants, microorganisms, and soil form plant–microbe–soil systems to implement ecological processes, such as nutrient cycling and energy flow, in terrestrial ecosystems [9]. Recently, the responses of plant–microbe–soil systems to ongoing global changes and human disturbances have been closely monitored [10]. Some evidence indicates that the responses of the plant–soil–microbial systems to habitat changes are strongly dependent on both the physicochemical characteristics of the soils and the historical adaptations of soil microbial communities to specific climatic conditions [11]. For example, changes in water availability and temperature affect the plant–microbe–soil responses in forest ecosystems [12]. Infrequent watering decreases the coupling between plants and soil microbes, resulting in large effects on subsequent soil biogeochemical cycling [13]. Light is an important ecological factor that directly or indirectly affects the growth and development of organisms. Changes in light intensity, which result in temperature alterations, influence plant–microbe–soil systems by affecting the plant and soil microbial communities’ diversity levels and compositions [14]. Studies of light effects on soil microbial communities have generally focused on how bacterial and fungal communities change in response to altered soil temperatures or drought; however, the direct effects of light on plant–microbe–soil systems have not been reported [15,16,17,18].
Here, we investigated the soil physicochemical properties, plant and microbial community structure, and diversity in photovoltaic power plants under shading and non-shading conditions. The effects of shading on soil nutrition and plant and microbial communities were studied. We hypothesized that (1) the shading of photovoltaic panels changes the structure and diversity of plant communities, and soil nutrition and physical and chemical properties, and (2) affects the structure and diversity of microbial communities. The aim is to gain a mechanistic understanding of how light affects aboveground and belowground communities.
2. Materials and Methods
2.1. Study Sites
Shanxi Province, located on the eastern Loess Plateau, receives abundant solar radiation. This study was conducted at a solar PV power station in northern Shanxi Province (Figure 1a), a 41-MWp capacity solar park, which covers 100 ha, that was installed in 2013 (Figure 1b). Each solar PV panel, which faces south at a 30° angle, is 0.993 m wide, 1.65 m long, and 1.98 m high (Figure 1c). Prior to being converted into a solar park, the area was wasteland with light rocky desertification.
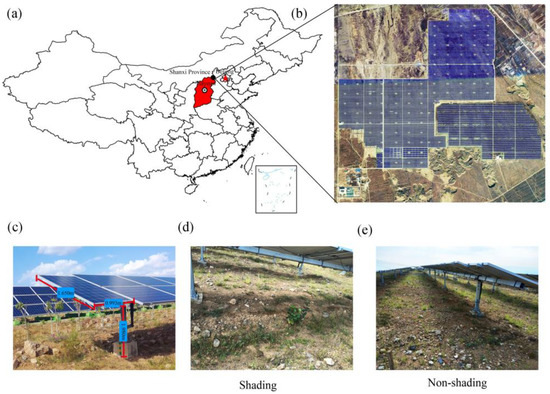
Figure 1.
Satellite photograph of the solar station and sampling location of the study area (a,b). The erecting height, length, and width of each PV (c); the shading and no shading and area under PV (d,e).
2.2. Soil Sampling and Plant Collection
Field surveys were conducted in July 2018. Shading (S) and non-shading gap (NS) soil by PV panels (Figure 1d,e) were considered to represent contrasting light conditions. Under each condition, nine sampling plots (1 m × 1 m) were selected to characterize the plant species, including the height, coverage, and the number of each species, and then the aboveground parts of plants in each plot were collected. Additionally, the five-point sampling method was used to collect topsoil (0–10 cm) samples in each plot, and then the five subsamples were mixed to form a single sample. The soil samples were immediately transported to the laboratory on ice. All the samples were sieved through 2-mm mesh and then divided into two subsamples, one of which was air-dried and used for measuring the soil physicochemical properties, whereas the other was stored at −20 °C for DNA extraction.
2.3. Analyses of Soil Properties and Plant Characteristics
Soil temperature was measured using a TR-6D portable soil parameter detector (Tongde Co. Beijing, China) during field sampling. Soil pH was determined in a 1:2.5 soil:water suspension procedure using the HANNA HI3221 (HANNA Instruments, Limena, Italy). Soil total nitrogen (TN) and total carbon (TC) content were determined using a Vario MACRO cube elemental analyzer (Elementar, Hanau, Germany). Soil nitrate nitrogen (NO3−-N) and nitrite nitrogen (NO2−-N) were determined using a CleverChem380 automated discrete analysis machine (DeChem-Tech, Hamburg, Germany). Photosynthetically active radiation (PAR) was investigated using aBNL-GPRS-9G hand-held environment monitor (Tuopuyun, Zhejiang, China). The aboveground biomass of plant matter was dried at 80 °C and then weighed. The Shannon plant community diversity index (H) was calculated using the following equation:
where Pi represents the relative abundance of plant species i in one particular quadrat. Pi was calculated as follows: Pi = ni/N, where ni represents the number of individuals of plant species i and N represents the total number of individuals of all plant species in one particular quadrat, respectively. The importance value of a plant was defined as Iv = (relative height + relative coverage + relative abundance)/3.
H = −∑(PilnPi)
2.4. DNA Extraction, PCR Assays, and High-Throughput Sequencing
DNA extraction was carried out in accordance with the protocol of the PowerSoil® DNA Isolation Kit (QIAGEN, Duesseldorf, Germany). The specific primers listed in Table S1 were used to amplify the bacterial 16S v3–v4 hypervariable regions, the fungal ITS1 region, and the protist 18S rRNA gene region [19]. PCR reactions were performed in triplicate 20 μL mixture containing 4 μL of 5 × FastPfu Buffer, 2 μL of 2.5 mM dNTPs, 0.8 μL of each primer (5 μM), 0.4 μL of FastPfu Polymerase, and 10 ng of template DNA. The resulted PCR products were extracted from a 2% agarose gel and further purified using the AxyPrep DNA Gel Extraction Kit (Axygen Biosciences, Union City, CA, USA) and quantified using QuantiFluor™-ST (Promega, Madison, WI, USA), according to the manufacturer’s protocol. We conducted sequencing at Shanghai Majorbio Bio-Pharm Technology (Shanghai, China), applying the MiSeq platform (Illumina, Inc., San Diego, CA, USA).
2.5. Bioinformatics Analysis
Quantitative Insights Into Microbial Ecology (QIIME 1.9.1) was used to process the DNA sequences [20]. In short, the raw reads of each sample were merged using FLASH into paired-end reads. Chimeric sequence removal was conducted using QIIME, and operational taxonomic unit (OTU) clustering was conducted using UPARSE (version 7.0) at 97% similarity. The taxonomy of bacterial and fungal OTUs was determined using the SILVA (Release132) database and UNITE (7.2) database, respectively [21,22]. The protist OTUs were classified using the Protist Ribosomal Reference (PR2) database [23]. The RDP Classifier algorithm was used to classify 16S rRNA and 18S rRNA gene sequences at a confidence threshold of 0.7. The obtained sequences were rarefied at the minimum number of each sequence. Fungi, metazoa, rhodophyta, streptophyta, and ambiguous eukaryotic taxa were excluded from the protistan OTUs.
2.6. Statistical Analyses
The alpha diversity of the plant community was estimated by calculating H, and that of the microbial (bacteria, fungi, and protists) community was estimated by calculating the H and Chao indices, while the beta diversity levels of the plant and soil microorganisms were calculated using the Vegan package in R language. The comparisons of soil physicochemical properties and diversity indices were conducted using a one-way ANOVA in SPSS 25.0. A non-metric multidimensional scale analysis and a community structure similarity analysis were carried out in R language (V3.4.2). CANOCO5.0 was used to select environmental factors that had significant effects (p < 0.05) on plant and soil microbial community structures. A linear regression was used to visualize the relationship between aboveground and belowground biodiversity levels, and a correlation analysis was conducted using SPSS 25.0. The associations among bacterial, fungal, and protistan communities under S and NS conditions were analyzed by using R language (V3.4.2). To reduce the complexity of the calculation and ensure its accuracy, the network analysis of soil microbial communities was conducted at the family level. When filtering data with zero values before performing the network analysis, Spearman’s rank correlation (ρ > 0.9) and significant correlations (p < 0.05) among co-occurrence network interactions between species were calculated using the Igraph package in R, and networks were visualized using the interactive platform Gephi [24]. Clustering coefficients were used to reflect changes in soil microbial community connections [19]. Families with the highest betweenness centrality value, which indicates the relevance of a node as capable of holding together communicating nodes, were considered as keystone species [25]. A structural equation model was constructed to quantify the correlations among PAR, plant community structure, aboveground biomass, and soil microbial community structure. We used the first axis score of the non-metric multidimensional scale analysis as a proxy for plant, fungal, bacterial, and protistan community compositions [26]. The covariance matrix of the variable was imported into AMOS17.0 (IBM, Armonk, NY, USA) to determine the variation in beta diversity. The Chi-square value (p > 0.05), goodness-of-fit-index (>0.90), and root mean square error of approximation (<0.05) were selected as parameters to evaluate the fitness of the model [19].
3. Results
3.1. The Effects of PV Panels on Aboveground and Belowground Community Structures
No significant differences in the soil physicochemical properties, pH, C/N, and TN, TC, NO3−, and NO2− content between S and NS were observed in the survey area (Table 1). However, the soil temperature in S was significantly lower than that in NS (p < 0.05), whereas the PAR was significantly lower in S (approximately 98 μmol·m−2·s−2) than in NS (approximately 744 μmol·m−2·s−2). Because of the effects of the PV panel shading on the soil, variations in the structure and diversity level of the aboveground plant community and belowground microbial community were investigated.

Table 1.
Physicochemical properties in shading and non-shading soil in this study.
A total of 10 plant species were found at the surveyed sites. The dominant species under NS conditions were Setaria viridis, Bidens parviflora, and Artemisia capillaris, whereas under S conditions, B. parviflora—a shade-tolerant annual plant—dominated. The community compositions and importance values of plant species under S and NS conditions were significantly different (Table S2). The H and biomass indices under NS conditions were significantly greater than those under S conditions (p < 0.05) (Figure 2). The plant diversity was positively correlated with the TN content (Table S3, p < 0.05); however, it was negatively correlated with the NO3−-N content (Table S3, p < 0.05). The beta diversity of the plant community varied dramatically between S and NS conditions (analysis of similarity, p < 0.05, Figure 3a). The aboveground biomass was most significantly affected by the PAR (Table S3). The first two axes of the redundancy analysis (RDA) accounted for 33.71% of the variation in the plant community composition, and the structure of the plant community was significantly correlated with the PAR and temperature (Tm) (Figure 3b).
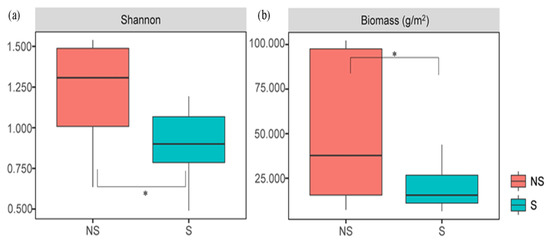
Figure 2.
Comparison of diversity (a) and performance (b) of plant community in S and NS. Significance levels are denoted with * p < 0.05. The same as below for the significant levels.
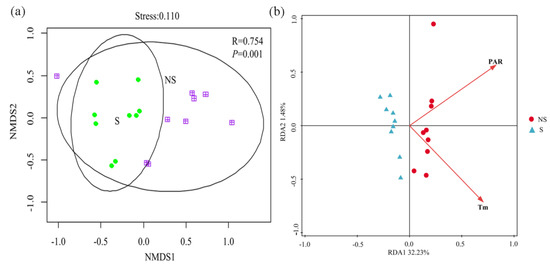
Figure 3.
Beta diversity on species level based on Bray–Curtis distance through non-metric multidimensional scaling analysis (a) and redundancy analysis of environmental factors and plant community structure (b).
A total of 719,082 16S rRNA gene sequences were generated, which were binned into 5,899 OTUs using the 97% sequence identity criterion. The description of the bacterial community composition was based on the relative abundances of microorganisms at the phylum level. Actinobacteria (32.33%), Proteobacteria (24.14%), Chloroflexi (14.12%), and Acidobacteria (12.577%) were the most dominant phyla (Figure 4a), representing 83.17% of the bacterial community. The relative abundance levels of Sphingomonadales, Acidimicrobiales, norank_c_TK10, and Streptomycetales were significantly different between S soil and NS soil (Figure S1), with Sphingomonadales and Acidimicrobiales being more prominent in S soil than in NS soil, whereas the reverse was true for norank_c_TK10 and Streptomycetales. The PV panels did not cause significant changes (p > 0.05) in the alpha diversity (Figure 4b), but dramatic changes in the beta diversity of bacterial communities were observed between S and NS soil (p < 0.05) (Figure 5a). The RDA indicated that the PAR (p < 0.05) significantly correlated with the bacterial community composition, with the first two axes together explaining 33.21% of the variation in the bacterial community composition (Figure 5b).
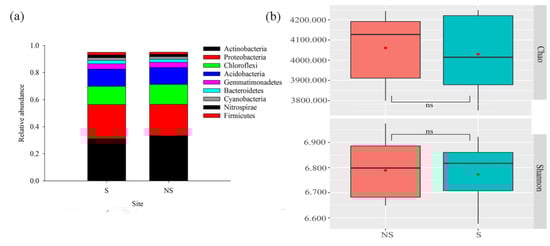
Figure 4.
Relative abundances (average values >= 0.01) of dominant phylum composition (a) and alpha diversity of the soil bacterial community (b). ns, nonsignificant. Red dots indicate intra-group differences.
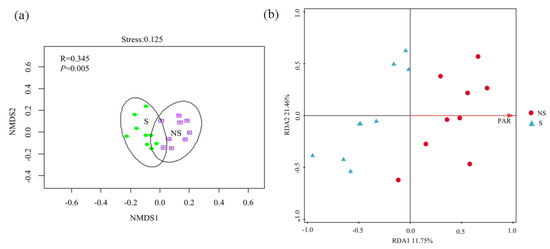
Figure 5.
Beta diversity of bacterial communities based on Bray–Curtis distance (on OTU level) analyzed by NMDS (a) and redundancy analysis of the correlation between environmental factors and bacterial community structure (b).
A total of 838,098 18S rRNA gene sequences were generated, which were binned into 1829 OTUs according using the 97% sequence identity criterion. Ascomycota (79.06%, 78.85%) and Zygomycota (11.42%, 10.56%) were the most abundant and dominant fungal phyla in both the S and NS soil (Figure 6a), representing 90.48% of the two soil fungal communities. Unlike bacteria, the shading of PV panels caused significant changes (p < 0.05) in the alpha diversity of the fungal community (Figure 6b). The relative abundance levels of Pleosporales, Sordariales, apnodiales, and norank_c_Sordariomycetes were significantly different between S and NS conditions (Figure S2), with Sordariales being significantly more prominent in NS soil than in S soil. The reverse was true for the other three phyla. Similar to the bacterial community, variations in the fungal beta diversity between S and NS soil were observed (p < 0.05) (Figure 7a). The RDA indicated that pH and PAR (p < 0.05) significantly correlated with the fungal community composition, with the first two axes together explaining 21.05% of the variation in the fungal community composition (Figure 7b).
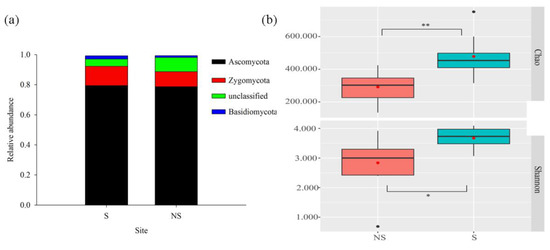
Figure 6.
Relative abundances (average values >= 0.01) of dominant phylum composition (a) and alpha diversity (b) of the soil fungal community. * p < 0.05, and ** p < 0.01. Black dots indicate inter-group differences, and red dots indicate intra-group differences. Same as below.
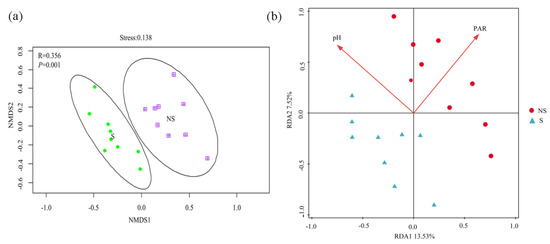
Figure 7.
Beta diversity of fungal communities based on Bray–Curtis distance (on OTU level) analyzed by NMDS plots (a) and redundancy analysis of the correlation between environmental factors and fungal community structure (b).
After removing non-protist eukaryotes, the samples were subsampled based on the minimum sequence number of samples. Consequently, 64,278 sequences were binned into 1,112 OTUs using the 97% sequence identity criterion. The compositions of the protistan communities were described according to the relative abundances at the phylum level. Cercozoa (38.57%) and Ciliophora (27.27%) were the most dominant phyla (Figure 8a), representing 65.84% of the soil protistan communities. Similar to bacteria, the shading of PV panels did not lead to significant changes (p > 0.05) in the alpha diversity of the protistan community (Figure 8b). The relative abundances of Cercomonadida, Sphaeropleales, and Nolandida in S soil were significantly enriched compared with those in NS soil, whereas those of Variosea_X, Echinamoebida, unclassified_p__Cercozoa, Colpodida, and Cyrtolophosidida were significantly enriched in NS soil (Figure S3). Similar to the bacterial and fungal communities, dramatic variations were observed in protistan beta diversity between S and NS soil (p < 0.05) (Figure 9a). The RDA indicated that the PAR significantly correlated with the protistan community composition (p < 0.05), with the first two axes together explaining 33.55% of the variation in the protistan community composition (Figure 9b).
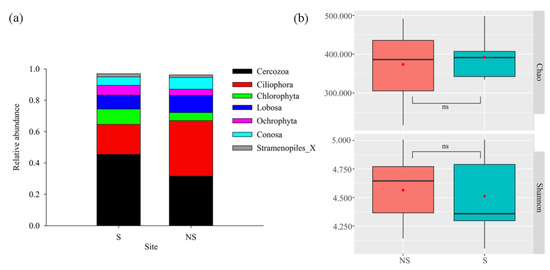
Figure 8.
Relative abundances (average values >= 0.01) of dominant phylum composition and alpha diversity of the soil protist communities. (a) Dominant phylum of protists; (b) comparison of protist diversity indices.
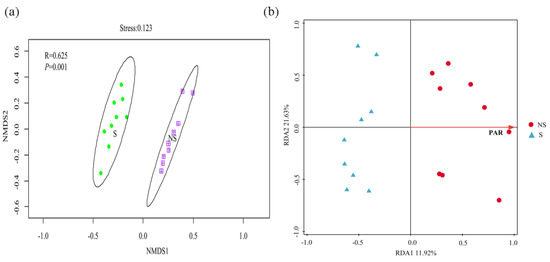
Figure 9.
Beta diversity of protistan communities based on Bray–Curtis distance (on OTU level) analyzed by NMDS plots (a) and redundancy analysis of the correlation between environmental factors and community structure of protists (b).
3.2. The Effects of PV Panel Shading on the Associations among Soil Microbes
Two co-occurrence networks were constructed by combining the soil microorganisms in the experimental groups (S and NS) (Figure 10) to indicate the effects of light on the associations among soil microbial communities. The network under S conditions captured 702 edges among 402 nodes, with positive and negative correlations of 96.30% and 3.70%, respectively, while that under NS conditions captured 624 edges among 379 nodes, with positive and negative correlations of 96.31% and 3.69%, respectively (Table S5). The proportions of the node numbers in the protistan, fungal, and bacterial communities were different in the NS and S soil networks, with the bacterial community accounting for nearly half of the microbes (Table S4). On the basis of the BC value of each network, the top 20 results were considered to be keystone species, representing six bacterial phyla, one fungal phylum, and two protistan phyla in the S soil network, and seven bacterial phyla, two fungal phyla, and three protistan phyla in the NS soil network (Table S5). Proteobacteria, Actinobacteria, and Chloroflexi were the overlapping keystone bacterial groups between S and NS conditions, whereas Ascomycete and Ochrophyta were the overlapping keystone fungal and protistan groups, respectively (Table S5). Acidobacteria, Tectomicrobia, and Nitrospirae, along with Stramenopiles_X, played important roles in the S network (Table S5), whereas Gemmatimonadetes, Cyanobacteria, Armatimonadetes, and Firmicutes played vital roles in the NS network. Basidiomycota was the dominant fungal phyla, whereas Lobosa and Cercozoa were the dominant protistan phyla in the NS soil network.
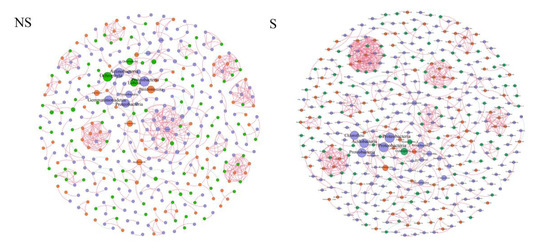
Figure 10.
The network visualized the effects of light (shading (S) and no shading (NS)) on the co-occurrence patterns among soil protists, bacteria, and fungi at family level and comparison of topological features between two groups of co-occurrence networks. The edge indicates that there is a significant Spearman’s rank correlation (ρ > 0.9, p < 0.05). The node size represents the size of the BC value. Blue dots represent bacteria, red dots represent fungi, and green dots represent protists. The color of the edge indicates the type of correlation; positive correlations are filled with red and negative correlations are filled with green.
3.3. The Relationship between the Plant and Microbial Communities in Solar Parks
A linear regression revealed a significant correlation between the alpha diversity levels of plant and fungal communities (Pearson test, r = 0.537, p = 0.022); however, plant diversity did not determine the alpha diversity levels of the bacterial and protistan communities. We fitted a structural equation model to infer the direct and indirect effects of the PAR on plant and soil microbial community structures, as well as to infer the direct and indirect interactions among biological factors (Figure 11). PAR significantly directly affected the plant community structure (r = 0.570, standardized coefficient) and aboveground biomass (r = 0.481, standardized coefficient). PAR directly and indirectly influenced the soil microbial community structures by affecting the plant community structure and aboveground biomass. Although there was no significant relationship among the alpha diversity levels of plant, bacterial, and protistan communities under S and NS conditions, the plant community composition was a predictor of the soil microbial community composition.
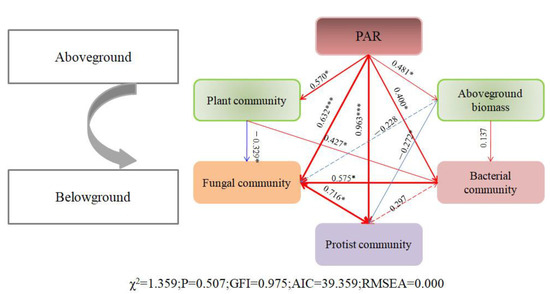
Figure 11.
The structural equation model shows the relationship among PAR, aboveground plant community, and belowground microbial communities. The solid and dotted arrows indicate significant and non-significant correlations, respectively. The numbers above the arrow indicate the path coefficient. The width of the arrow is positively correlated with the path coefficient. Red and green indicate positive correlation and negative correlation, respectively. Significance levels are denoted with * p < 0.05, *** p < 0.001.
4. Discussion
The shading of PV panels has an obvious ecological effect on soil [27], and this effect may extend to soil microbial community structures [16]. Studies have reported the effects of environmental factors or plants on the structures and diversity levels of soil microbial communities [19,28]. However, few studies have investigated the coordinate responses of aboveground and belowground communities to light on a small scale.
4.1. PAR Is a Shared Driving Factor of Aboveground and Belowground Community Structures
Although PV panels cause changes in the PAR and soil temperature, no significant effects on soil physicochemical properties (pH, C/N, and TN, TC, NO3−, and NO2− content) were observed. This is consistent with studies on barren soil and grassland in solar parks [29,30,31]. This is inconsistent with our assumptions. It may be that the distance is too close to cause significant changes in soil physical and chemical properties within 5 years.
Some reports indicated that PV panel shading affects plant communities in arable, sand, and arid lands [27,29,30]. Because of large-scale land preparation, the plant communities in solar parks are reestablished and developed during the operation of PV panels [27,32]. The shading of PV panels has certain effects on vegetation restoration [33] because they provide conditions for shade-tolerant plants. Consequently, species diversity may increase under the PV panels [30,34], as demonstrated by the presence of B. parviflora and S. viridis in this study. Under strong light conditions, plant heights are generally lower but the biomass is larger, whereas the opposite trends occur under shaded conditions [35]. The lower biomass under PV panels reflects a decline in irradiation, which is positively associated with vegetative productivity [36]. Here, the PAR effect on the plant community was consistent with that reported by Paudel and Vetaas [37] on different slope orientations. Because the slope direction determines the amount of solar irradiation, the irradiation index becomes an important factor driving the plant community compositions on northeast and southwest slopes [38]. Correlations between plant diversity and TN and NO3−-N content in soil were observed (Table S3, p < 0.05) and were consistent with those observed in a previous study [39]. Nutrient availability is another major factor affecting plant community diversity [40], and nitrogen is a limiting factor of plant species’ composition and diversity [41]. Generally, solar radiation, TN, and NO3−-N are limiting factors for plant community assembly during the restoration process at PV power stations located on rocky desertified land.
Davies et al. [16] showed that light had direct and indirect effects on the microbial community structure in a constant environment chamber. Studies on the mechanism of community assembly in different slope directions indicate that slope is important in the assembly of soil bacterial communities [38]. The slope direction determines the amount of irradiation and energy that the soil receives, which then affects the soil microbial community structure [42]. Thus, light might become a pivotal factor driving the assembly of the bacterial community in some small-scale habitats. The structure of the fungal community, unlike that of the bacterial community, was affected by both the PAR and soil pH, consistent with a previous study [43]. PAR significantly correlated with the protistan community composition (p < 0.05). Gong et al. [44] explained that the structures of protistan communities in marine ecosystems are related to changes in light caused by water depth. This might explain the differences in protistan soil community structures under different light conditions.
4.2. Solar PV Panel Shading Strengthens the Associations among Soil Microbes
The topological properties of networks were considered to reflect the degree of connectivity and interactions among microorganisms [45]. The increased clustering coefficient and average degree of connectivity for the S network (Table S4) indicated stronger interactions among soil microorganisms compared with the NS network. Strong interactions in a network are closely correlated with the responses of soil microorganisms to environmental perturbations [46,47]. The construction of PV panels might be a major factor affecting the associations among microbial communities.
On the basis of the BC values of the networks, keystone species were identified. Consistent with previous studies, Proteobacteria, Acidobacteria, and Chloroflexi were prominent phyla in the networks [48,49]. Ascomycete species are thought to represent keystone species in such networks because their secondary metabolites are important for developing relationships with other network members [49]. Acidobacteria are oligotrophic organisms that prefer existing in poor environments [50], and they have important ecological functions and extensive metabolic diversity [51]. The Nitrospirae phylum is still largely unknown, but it plays important roles in the nitrogen cycle [52]. Research on Tectomicrobia remains rudimentary [53]. Gemmatimonadetes, Cyanobacteria, and Firmicutes have phototrophic members, with the former being the least-studied phylum [54]. Cercozoa members had dominant roles in the networks and are important predators of bacteria [55].
4.3. Interactions among Plant and Microbial Communities
Shared environmental factors may enhance the relationships between the plant and soil microbial community compositions [56]. The plant community composition directly and indirectly impacts the microbial community composition in a variety of ways. For example, differences in the plant community composition may determine the amount and type of organic matter input, which influences the microbial community composition [57]. Plants may predict fungal diversity by the changes that they induce in resource availability (i.e., plant detritus) [58]. In this study, both plant diversity and biomass under S conditions were significantly lower than those under NS conditions. Low resource availability might increase competition among microbial communities. Fungi obtain more nutrients by degrading complex substrates [59]. Therefore, fungi may have a greater tolerance to negative environmental changes than bacteria and protists. The alpha diversity levels of protistan communities are mainly regulated by soil abiotic factors, and those of bacterial and fungal communities are regulated from the bottom up [19]. The protistan community composition was not directly related to the plant community composition, but it was indirectly related to the fungal community composition via plants (r = 0.716, standardized coefficient) in this study. Fungi, as the major prey, may predict the protists [60], and the fungi may drive protistan community assembly from the bottom up [19]. However, protists feed on fungi and, consequently, influence the microbial community structure from the top down. In this study, the fungal community was affected significantly by the bacterial community (β = 0.575, standardized coefficient); however, the exact nature of the interaction between the bacterial and fungal communities remains unknown [26].
The link between fungal and plant diversity is very complex and related to the spatial scale [61]. For example, plant diversity determines fungal community diversity on a regional scale [62,63] but not on a global scale [64]. The inherent factors of soil and climate co-vary with plant diversity, which might affect fungal diversity, and there is no consensus on the link between plant and microbial diversity levels.
5. Conclusions
This research highlighted the influences of light heterogeneity caused by PV panels on a plant–soil–microbial system. The heterogeneous light intensity led to significant differences in plant and soil microbial community compositions. It predominantly reduced the alpha diversity of plants under S conditions compared under NS conditions, whereas the alpha diversity of the fungal community increased significantly. Contrary to our hypothesis, S conditions did not result in differences in the alpha diversity levels of bacterial and protistan communities. Light intensity significantly affected plant and soil microbial community compositions, and the plant beta diversity predicted the microbial community composition pattern. Thus, we confirmed that changes in the microclimate caused by the setting of PV panels have important impacts on the structures and processes of plant–soil–microbial systems and on the relationships between aboveground and belowground communities in temperate semi-arid rocky desertified land. Similar studies should be conducted in varying land types, such as desert, saline–alkaline land, rocky desertified land, and wetland, to evaluate the effects of PV panel shading on microclimates and land ecosystems, which would provide guidance for the installation of solar parks.
Supplementary Materials
The following supporting information can be downloaded at: https://www.mdpi.com/article/10.3390/land12020367/s1. Table S1: Primer information used in this paper. Table S2: Effects of photovoltaic panel shading on plant species composition and important values. Table S3: Correlation between environmental factors and plant diversity and aboveground biomass. Table S4: Correlation between environmental factors and fungal diversity. Table S5: Properties of network in Figure 10. Table S6: List of key species in co-occurrence network of S and NS treatments. Figure S1: Differences in the relative abundance of the dominant bacterial order between S and NS treatments. Figure S2: Differences in the relative abundance of the dominant fungal order between S and NS treatments. Figure S3: Differences in the relative abundance of the dominant protist order between S and NS treatment. Figure S4: Relationship between plant diversity and soil microbial community diversity.
Author Contributions
Conceptualization, B.C.; methodology, J.L.; investigation, C.L., J.B. and J.L.; data curation, J.L.; writing—original draft preparation, C.L. and J.B.; writing—review and editing, T.W.; supervision, B.C.; project administration, B.C.; funding acquisition, B.C. All authors have read and agreed to the published version of the manuscript.
Funding
This research was funded by National Science Foundation of China (grant no. 31772450; 31801962); Shanxi Provincial Hundred Talents Plan Project 2020. The APC was funded by Central Government Guided Local Science and Technology Development Fund Project (YDZJSX2022B001).
Data Availability Statement
Data is unavailable due to privacy.
Acknowledgments
We acknowledge Shanxi Tianzhen Xusheng Photovoltaic Power Station for providing the research site.
Conflicts of Interest
The authors declare that they have no conflict of interest.
References
- Armstrong, A.; Waldron, S.; Whitaker, J.; Ostle, N.J. Wind farm and solar park effects on plant-soil carbon cycling: Uncertain impacts of changes in ground-level microclimate. Glob. Chang. Biol. 2014, 20, 1699–1706. [Google Scholar] [CrossRef] [PubMed]
- Fang, X.; Li, D. Solar photovoltaic and thermal technology and applications in China. Renew. Sustain. Energy Rev. 2013, 23, 330–340. [Google Scholar] [CrossRef]
- You, J.; Lim, M.; You, K.; Lee, C. Wind coefficient distribution of arranged ground photovoltaic panels. Sustainability 2021, 13, 3944. [Google Scholar] [CrossRef]
- Adair, K.L.; Lindgreen, S.; Poole, A.M.; Young, L.M.; Bernard-Verdier, M.; Wardle, D.A.; Tylianakis, J.M. Above and belowground community strategies respond to different global change drivers. Sci. Rep. 2019, 9, 2540. [Google Scholar] [CrossRef]
- Bai, Z.; Jia, A.; Bai, Z.; Qu, S.; Zhang, M.; Kong, L.; Sun, R.; Wang, M. Photovoltaic panels have altered grassland plant biodiversity and soil microbial diversity. Front. Micobiol. 2022, 13, 1065899. [Google Scholar] [CrossRef]
- Krishna, M.; Gupta, S.; Baquerizo, M.D.; Morriën, E.; Garkoti, S.C.; Chaturvedi, R.; Ahmad, S. Successional trajectory of bacterial communities in soil are shaped by plant-driven changes during secondary succession. Sci. Rep. 2020, 10, 9864. [Google Scholar] [CrossRef]
- Schlatter, D.C.; Bakker, M.; Bradeen, J.; Kinkel, L.L. Plant community richness and microbial interactions structure bacterial communities in soil. Ecology 2015, 96, 134–142. [Google Scholar] [CrossRef]
- Lau, J.A.; Lennon, J.T. Evolutionary ecology of plant-microbe interactions: Soil microbial structure alters selection on plant traits. New Phytol. 2011, 192, 215–224. [Google Scholar] [CrossRef]
- Miki, T.; Ushio, M.; Fukui, S.; Kondoh, M. Functional diversity of microbial decomposers facilitates plant coexistence in a plant-microbe-soil feedback model. Proc. Natl. Acad. Sci. USA 2010, 107, 14251–14256. [Google Scholar] [CrossRef]
- Huang, R.; McGrath, S.P.; Hirsch, P.R.; Clark, I.M.; Storkey, J.; Wu, L.; Zhou, J.; Liang, Y. Plant-microbe networks in soil are weakened by century-long use of inorganic fertilizers. Microb. Biotechnol. 2019, 12, 1464–1475. [Google Scholar] [CrossRef]
- Flores-Rentería, D.; Yuste, J.C.; Rincon, A.; Brearley, F.Q.; García-Gil, J.C.; Valladares, F. Habitat fragmentation can modulate drought effects on the plant-soil-microbial system in mediterranean Holm Oak (Quercus ilex) Forests. Microb. Ecol. 2015, 69, 798–812. [Google Scholar] [CrossRef]
- Von Rein, I.; Gessler, A.; Premke, K.; Keitel, C.; Ulrich, A.; Kayler, Z.E. Forest understory plant and soil microbial response to an experimentally induced drought and heat-pulse event: The importance of maintaining the continuum. Glob. Chang. Biol. 2016, 22, 2861–2874. [Google Scholar] [CrossRef]
- Engelhardt, I.C.; Welty, A.; Blazewicz, S.J.; Bru, D.; Rouard, N.; Breuil, M.-C.; Gessler, A.; Galiano, L.; Miranda, J.C.; Spor, A.; et al. Depth matters: Effects of precipitation regime on soil microbial activity upon rewetting of a plant-soil system. ISME J. 2018, 12, 1061–1071. [Google Scholar] [CrossRef]
- Zhou, J.; Deng, Y.; Shen, L.; Wen, C.; Yan, Q.; Ning, D.; Qin, Y.; Xue, K.; Wu, L.; He, Z.; et al. Temperature mediates continental-scale diversity of microbes in forest soils. Nat. Commun. 2016, 7, 12083. [Google Scholar] [CrossRef]
- Bates, S.T.; Clemente, J.C.; Flores, G.E.; Walters, W.A.; Parfrey, L.W.; Knight, R.; Fierer, N. Global biogeography of highly diverse protistan communities in soil. ISME J. 2013, 7, 652–659. [Google Scholar] [CrossRef]
- Davies, L.O.; Schäfer, H.; Marshall, S.; Bramke, I.; Oliver, R.G.; Bending, G.D. Light structures phototroph, bacterial and fungal communities at the soil surface. PLoS ONE 2013, 8, e69048. [Google Scholar] [CrossRef]
- Maestre, F.T.; Delgado-Baquerizo, M.; Jeffries, T.C.; Eldridge, D.J.; Ochoa, V.; Gozalo, B.; Quero, J.Q.; García-Gómez, M.; Gallardo, A.; Ulrich, W.; et al. Increasing aridity reduces soil microbial diversity and abundance in global drylands. Proc. Natl. Acad. Sci. USA 2015, 112, 15684–15689. [Google Scholar] [CrossRef]
- Ochoa-Hueso, R.; Collins, S.L.; Delgado-Baquerizo, M.; Hamonts, K.; Pockman, W.T.; Sinsabaugh, R.L.; Smith, M.D.; Knapp, A.K.; Power, S.A. Drought consistently alters the composition of soil fungal and bacterial communities in grasslands from two continents. Glob. Chang. Biol. 2018, 24, 2818–2827. [Google Scholar] [CrossRef]
- Zhao, Z.-B.; He, J.-Z.; Geisen, S.; Han, L.-L.; Wang, J.-T.; Shen, J.-P.; Wei, W.-X.; Fang, Y.-T.; Li, P.-P.; Zhang, L.-M. Protist communities are more sensitive to nitrogen fertilization than other microorganisms in diverse agricultural soils. Microbiome 2019, 7, 33. [Google Scholar] [CrossRef]
- Caporaso, J.G.; Kuczynski, J.; Stombaugh, J.; Bittinger, K.; Bushman, F.D.; Costello, E.K.; Fierer, N.; Pena, A.G.; Goodrich, J.K.; Gordon, J.I.; et al. QIIME allows analysis of high-throughput community sequencing data. Nat. Methods 2010, 7, 335–336. [Google Scholar] [CrossRef]
- Quast, C.; Pruesse, E.; Yilmaz, P.; Gerken, J.; Schweer, T.; Yarza, P.; Peplies, J.; Glöckner, F.O. The SILVA ribosomal RNA gene database project: Improved data processing and web-based tools. Nucleic Acids Res. 2013, 41, 590–596. [Google Scholar] [CrossRef] [PubMed]
- Nilsson, R.H.; Larsson, K.-H.; Taylor, A.F.S.; Bengtsson-Palme, J.; Jeppesen, T.S.; Schigel, D.; Kennedy, P.; Picard, K.; Glöckner, F.O.; Tedersoo, L.; et al. The UNITE database for molecular identification of fungi: Handling dark taxa and parallel taxonomic classifications. Nucleic Acids Res. 2019, 47, 259–264. [Google Scholar] [CrossRef] [PubMed]
- Guillou, L.; Bachar, D.; Audic, S.; Bass, D.; Berney, C.; Bittner, L.; Boutte, C.; Burgaud, G.; de Vargas, C.; Decelle, J.; et al. The Protist Ribosomal Reference database (PR2): A catalog of unicellular eukaryote Small Sub-Unit rRNA sequences with curated taxonomy. Nucleic Acids Res. 2013, 41, 597–604. [Google Scholar] [CrossRef] [PubMed]
- Morriën, E.; Hannula, S.E.; Snoek, L.B.; Helmsing, N.R.; Zweers, H.; de Hollander, M.; Soto, R.L.; Bouffaud, M.-L.; Buée, M.; Dimmers, W.; et al. Soil networks become more connected and take up more carbon as nature restoration progresses. Nat. Commun. 2017, 8, 14349. [Google Scholar] [CrossRef]
- Jiao, S.; Liu, Z.; Lin, Y.; Yang, J.; Chen, W.; Wei, G. Bacterial communities in oil contaminated soils: Biogeography and co-occurrence patterns. Soil Biol. Biochem. 2016, 98, 64–73. [Google Scholar] [CrossRef]
- De Vries, F.T.; Griffiths, R.I.; Bailey, M.; Craig, H.; Girlanda, M.; Gweon, H.S.; Hallin, S.; Kaisermann, A.; Keith, A.M.; Kretzschmar, M.; et al. Soil bacterial networks are less stable under drought than fungal networks. Nat. Commun. 2018, 9, 3033. [Google Scholar] [CrossRef]
- Wang, Z.Y.; Wang, J.; Gao, Y.; Dang, X.H.; Meng, Z.J. Impacts of photovoltaic power station construction on ecology environment in sandy area. Bullet. Soil Water Conserv. 2019, 39, 191–196. [Google Scholar]
- Dassen, S.; Cortois, R.; Martens, H.; de Hollander, M.; Kowalchuk, G.A.; van der Putten, W.H.; De Deyn, G.B. Differential responses of soil bacteria, fungi, archaea and protists to plant species richness and plant functional group identity. Mol. Ecol. 2017, 26, 4085–4098. [Google Scholar] [CrossRef]
- Armstrong, A.; Ostle, N.J.; Whitaker, J. Solar park microclimate and vegetation management effects on grassland carbon cycling. Environ. Res. Lett. 2016, 11, 74016. [Google Scholar] [CrossRef]
- Wang, T.; Wang, D.X.; Guo, T.D.; Zhang, G.G.; Zhao, S.X.; Niu, H.C.; Lu, S.Y.; Linl, H. The impact of photovoltaic power construction on soil and vegetation. Res. Soil Water Conserv 2016, 23, 90–94. [Google Scholar]
- Suuronen, A.; Muñoz-Escobar, C.; Lensu, A.; Kuitunen, M.; Celis, N.G.; Astudillo, P.E.; Ferrú, M.; Taucare-Ríos, A.; Miranda, M.; Kukkonen, J.V.K. The influence of solar power plants on microclimatic conditions and the biotic community in Chilean desert environments. Environ. Manage. 2017, 60, 630–642. [Google Scholar] [CrossRef]
- Turney, D.; Fthenakis, V. Environmental impacts from the installation and operation of large-scale solar power plants. Renew. Sustain. Energy Rev. 2011, 15, 3261–3270. [Google Scholar] [CrossRef]
- Zhou, M.R.; Wang, X.J. Influence of photovoltaic power station engineering on soil and vegetation: Taking the Gobi Desert Area in the Hexi corridor of Gansu as an example. Sci. Soil Water Conserv. 2019, 17, 132–138. [Google Scholar]
- Xu, L.; Zhang, C.X.; Wang, J.; Xu, A.L.; Zhou, X.C.; Jiao, J.R. Study on species diversity of gangue piles in Sunjiawan, Fuxin City. J. Arid Land Resour. Environ. 2006, 20, 178–182. [Google Scholar]
- Awang, Y.B.; Atherton, J.G. Growth and fruiting responses of strawberry plants grown on rockwool to shading and salinity. Sci. Hortic. 1995, 62, 25–31. [Google Scholar] [CrossRef]
- Rogiers, N.; Eugster, W.; Furger, M.; Siegwolf, R. Effect of land management on ecosystem carbon fluxes at a subalpine grassland site in the Swiss Alps. Theor. Appl. Climatol. 2005, 80, 187–203. [Google Scholar] [CrossRef]
- Paudel, S.; Vetaas, O.R. Effects of topography and land use on woody plant species composition and beta diversity in an arid Trans-Himalayan landscape, Nepal. J. Mt. Sci. 2014, 11, 1112–1122. [Google Scholar] [CrossRef]
- Gómez-Brandón, M.; Ascher-Jenull, J.; Bardelli, T.; Fornasier, F.; Sartori, G.; Pietramellara, G.; Arfaioli, P.; Egli, M.; Beylich, A.; Insam, H.; et al. Ground cover and slope exposure effects on micro- and mesobiota in forest soils. Ecol. Indic. 2017, 80, 174–185. [Google Scholar] [CrossRef]
- Kinnebrew, E.; Champlin, L.K.; Neill, C. Interactions between cattle grazing, plant diversity and soil nitrogen and in a northeastern U.S. coastal grassland. Appl. Veg. Sci. 2019, 22, 317–325. [Google Scholar] [CrossRef]
- Grace, J.B.; Anderson, T.M.; Seabloom, E.W.; Borer, E.T.; Adler, P.B.; Harpole, W.S.; Hautier, Y.; Hillebrand, H.; Lind, E.M.; Pärtel, M.; et al. Integrative modeling reveals mechanisms linking productivity and plant species richness. Nature 2016, 529, 390–393. [Google Scholar] [CrossRef]
- Valdés-Correcher, E.; Sitters, J.; Wassen, M.; Brion, N.; Venterink, H.O. Herbivore dung quality affects plant community diversity. Sci. Rep. 2019, 9, 5675. [Google Scholar] [CrossRef] [PubMed]
- Kang, S.; Doh, S.; Lee, D.; Lee, D.; Jin, V.L.; Kimball, J.S. Topographic and climatic controls on soil respiration in six temperate mixed-hardwood forest slopes, Korea. Glob. Chang. Biol. 2003, 9, 1427–1437. [Google Scholar] [CrossRef]
- Burns, J.H.; Anacker, B.L.; Strauss, S.Y.; Burke, D.J. Soil microbial community variation correlates most strongly with plant species identity, followed by soil chemistry, spatial location and plant genus. AoB Plants 2015, 7, plv030. [Google Scholar] [CrossRef] [PubMed]
- Gong, J.; Shi, F.; Ma, B.; Dong, J.; Pachiadaki, M.; Zhang, X.; Edgcomb, V.P. Depth shapes α- and β-diversities of microbial eukaryotes in surficial sediments of coastal ecosystems. Environ. Microbiol. 2015, 17, 3722–3737. [Google Scholar] [CrossRef] [PubMed]
- Deng, Y.; Jiang, Y.-H.; Yang, Y.; He, Z.; Luo, F.; Zhou, J. Molecular ecological network analyses. BMC Bioinform. 2012, 13, 113. [Google Scholar] [CrossRef]
- Zhang, B.; Zhang, J.; Liu, Y.; Shi, P.; Wei, G. Co-occurrence patterns of soybean rhizosphere microbiome at a continental scale. Soil Biol. Biochem. 2018, 118, 178–186. [Google Scholar] [CrossRef]
- Zhou, J.; Deng, Y.; Luo, F.; He, Z.; Tu, Q.; Zhi, X. Functional molecular ecological networks. mBio 2010, 1, 1592–1601. [Google Scholar] [CrossRef]
- Chen, J.; Wang, P.; Wang, C.; Wang, X.; Miao, L.; Liu, S.; Yuan, Q.; Sun, S. Fungal community demonstrates stronger dispersal limitation and less network connectivity than bacterial community in sediments along a large river. Environ. Microbiol. 2019, 22, 832–849. [Google Scholar] [CrossRef]
- He, D.; Shen, W.; Eberwein, J.; Zhao, Q.; Ren, L.; Wu, Q.L. Diversity and co-occurrence network of soil fungi are more responsive than those of bacteria to shifts in precipitation seasonality in a subtropical forest. Soil Biol. Biochem. 2017, 115, 499–510. [Google Scholar] [CrossRef]
- Zhang, C.; Liu, G.; Xue, S.; Wang, G. Soil bacterial community dynamics reflect changes in plant community and soil properties during the secondary succession of abandoned farmland in the Loess Plateau. Soil Biol. Biochem. 2016, 97, 40–49. [Google Scholar] [CrossRef]
- Quaiser, A.; Ochsenreiter, T.; Lanz, C.; Schuster, S.C.; Treusch, A.; Eck, J.; Schleper, C. Acidobacteria form a coherent but highly diverse group within the bacterial domain: Evidence from environmental genomics. Mol. Microbiol. 2003, 50, 563–575. [Google Scholar] [CrossRef]
- Oliveira, C.; Gunderman, L.; Coles, C.A.; Lochmann, J.; Parks, M.; Ballard, E.; Glazko, G.; Rahmatallah, Y.; Tackett, A.J.; Thomas, D.J. 16S rRNA gene-based metagenomic analysis of ozark cave bacteria. Diversity 2017, 9, 31. [Google Scholar] [CrossRef]
- Liu, F.; Li, J.; Feng, G.; Li, Z. New genomic insights into “Entotheonella” symbionts in Theonella swinhoei: Mixotrophy, anaerobic adaptation, resilience, and interaction. Front. Microbiol. 2016, 7, 1333. [Google Scholar] [CrossRef]
- Zeng, Y.; Baumbach, J.; Barbosa, E.G.V.; Azevedo, V.; Zhang, C.; Koblížek, M. Metagenomic evidence for the presence of phototrophic Gemmatimonadetes bacteria in diverse environments. Environ. Microbiol. Rep. 2016, 8, 139–149. [Google Scholar] [CrossRef]
- Xue, Y.; Chen, H.; Yang, J.R.; Liu, M.; Huang, B. Distinct patterns and processes of abundant and rare eukaryotic plankton communities following a reservoir Cyanobacterial bloom. ISME J. 2018, 12, 2263–2277. [Google Scholar] [CrossRef]
- Prober, S.M.; Leff, J.W.; Bates, S.T.; Borer, E.T.; Firn, J.; Harpole, W.S.; Lind, E.M.; Seabloom, E.W.; Adler, P.B.; Bakker, J.D.; et al. Plant diversity predicts beta but not alpha diversity of soil microbes across grasslands worldwide. Ecol. Lett. 2015, 18, 85–95. [Google Scholar] [CrossRef]
- Carney, K.M.; Matson, P.A. The influence of tropical plant diversity and composition on soil microbial communities. Microb. Ecol. 2006, 52, 226–238. [Google Scholar] [CrossRef]
- Waldrop, M.P.; Zak, D.R.; Blackwood, C.B.; Curtis, C.D.; Tilman, D. Resource availability controls fungal diversity across a plant diversity gradient. Ecol. Lett. 2006, 9, 1127–1135. [Google Scholar] [CrossRef]
- Xiao, X.; Liang, Y.; Zhou, S.; Zhuang, S.; Sun, B. Fungal community reveals less dispersal limitation and potentially more connected network than that of bacteria in bamboo forest soils. Mol. Ecol. 2018, 27, 550–563. [Google Scholar] [CrossRef]
- Guo, S.; Xiong, W.; Hang, X.; Gao, Z.; Jiao, Z.; Liu, H.; Mo, Y.; Zhang, N.; Kowalchuk, G.A.; Li, R.; et al. Protists as main indicators and determinants of plant performance. Microbiome 2021, 9, 64. [Google Scholar] [CrossRef]
- Hu, Y.; Veresoglou, S.D.; Tedersoo, L.; Xu, T.; Ge, T.; Liu, L.; Chen, Y.; Hao, Z.; Su, Y.; Rillig, M.C.; et al. Contrasting latitudinal diversity and co-occurrence patterns of soil fungi and plants in forest ecosystems. Soil Biol. Biochem. 2019, 131, 100–110. [Google Scholar] [CrossRef]
- Hiiesalu, I.; Bahram, M.; Tedersoo, L. Plant species richness and productivity determine the diversity of soil fungal guilds in temperate coniferous forest and bog habitats. Mol. Ecol. 2017, 26, 4846–4858. [Google Scholar] [CrossRef] [PubMed]
- Yan, C.; Xie, Y.; Li, X.; Holyoak, M.; Zhang, Z. Species co-occurrence and phylogenetic structure of terrestrial vertebrates at regional scales. Glob. Ecol. Biogeogr. 2016, 25, 455–463. [Google Scholar] [CrossRef]
- Tedersoo, L.; Bahram, M.; Põlme, S.; Kõljalg, U.; Yorou, N.S.; Wijesundera, R.; Ruiz, L.V.; Vasco-Palacios, A.M.; Thu, P.Q.; Suija, A.; et al. Global diversity and geography of soil fungi. Science 2014, 346, 1256688. [Google Scholar] [CrossRef]
Disclaimer/Publisher’s Note: The statements, opinions and data contained in all publications are solely those of the individual author(s) and contributor(s) and not of MDPI and/or the editor(s). MDPI and/or the editor(s) disclaim responsibility for any injury to people or property resulting from any ideas, methods, instructions or products referred to in the content. |
© 2023 by the authors. Licensee MDPI, Basel, Switzerland. This article is an open access article distributed under the terms and conditions of the Creative Commons Attribution (CC BY) license (https://creativecommons.org/licenses/by/4.0/).