Abstract
The special above-ground and underground dual structure in the karst area makes the capacity of surface water storage in this area poor. In water-limited ecosystems, soil moisture is the key to the survival of plants. Influenced by rainfall and soil texture, soil moisture variation characteristics of different vegetation types are different in slope land. Many researchers use rainfall simulation experiments to study the influence of soil water movement processes under rainfall patterns, but there are few studies under natural conditions. In this paper, wood trees, peach trees, flue-cured tobacco, and grassland were planted at the buffer zone boundary of Shibing, a World Heritage site, along different elevations in the depression of the research site. Peach trees and flue-cured tobacco were the main cash crops in the area. The soil layers of 0–0.15 m, 0.15–0.30 m, 0.30–0.45 m, 0.45–0.60 m, and 0.60–0.75 m were taken as research objects. Rainfall and soil moisture were monitored every ten minutes to study the variation of soil moisture of vegetation types under different rainfall patterns. Through the analysis of soil physicochemical properties and vegetation types, it was found that soil moisture changes were different in different land types. In general, shallow soil moisture (0~0.30 m) was more active in the wet season (CV > 10%) but tended to be stable in the dry season. The rainy season rainfall had the greatest influence on soil moisture change. The response level of soil moisture to rainfall of all vegetation types was grassland > peach trees > flue-cured tobacco. These results can provide ecological and economic suggestions for karst areas with large population distribution in China, so as to reduce the impact of rock desertification on this area.
1. Introduction
Soil moisture is a fundamental property affecting plant growth, soil nutrient transport and transformation, and water energy balance in the soil-plant system. Its spatiotemporal patterns are very important for understanding regional agriculture, hydrology, soil, and environmental process [1,2,3]. The factors affecting soil moisture and its dynamic change mainly include climate, terrain, vegetation type, etc., and the precipitation and vegetation type are considered the main factors controlling the soil profile and soil moisture [4,5,6]. The unique dual structure of karst landform and the shallow soil layer on sloping land is one of the important reasons for soil erosion and rocky desertification [7,8,9], and soil moisture is also the main restricting factor of the karst ecological environment [10]. As a basic research unit, there is still a large space for research in the karst area.
Currently, many reports have indicated multiple influencing factors of soil moisture variation. For example, in the study of Beckett et al., soil moisture is affected by soil texture, organic matter, and structure [11]. Robinson et al. noted that the spatiotemporal dynamics of soil moisture were more significantly affected by precipitation variation rate [12], so it can be seen that precipitation and land use are the key factors contributing to soil moisture variation [13,14]. Yao et al. pointed out in their study that the soil moisture of different land use types in the basin generally showed farmland > grassland > artificial forest land. At the regional scale, precipitation was a significant factor affecting the spatial variation of soil moisture [15]. Yu et al. found that the average soil water depth of each land use type on the semiarid Loess Plateau was ranked as native grassland > farmland > forest land, which proved that different land use structures significantly affected the spatial distribution of deep soil water in each season [16]. There is a strong spatio-temporal correlation between different land uses and soil moisture in arid regions of Africa. Wei et al. found that soil moisture variation can explain 48% of vegetation variation [17].
The variation of soil moisture on sloping land and its response to rainfall are affected by various factors [18]. Rainfall characteristics, including rainfall intensity, duration, moving direction, moving velocity, and temporal resolution of rainfall, affect responses such as runoff hydrological curves and spatio-temporal variation of soil moisture [19,20,21,22]. Among rainfall characteristics, rainfall intensity and rainfall duration are the two main factors controlling hydrological response. By comparing with the precipitation variation trend at various meteorological observation points over the Tibet Plateau, Liu et al. found that the spatial pattern of soil moisture variation trend over the plateau was consistent with the overall variation trend of precipitation [23]. Ayehu et al. showed in their analysis that watershed topography and watershed cover characteristics have significant effects on rainfall and precipitation distribution, further confirming that seasonal soil moisture can be controlled by both soil moisture evaporation loss and rainfall gains, although the variation of rainfall is the major driving factor of seasonal soil moisture variation [24]. There are some differences in soil moisture variation of slope land in different regions and different vegetation cover types. Studies on soil moisture at three different depths of Alpine natural slopes found that the soil moisture skewness decreased as the soil layer deepened [25]. The surface runoff at the same depth of the yellow soil slope cultivated land in the Penzhou Mountain area of Sichuan in China varies under different ridge tillage measures [26].
The unique dual structure development of “overlying soil, underlying bedrock” of the karst landform slope unit is similar to the landscape structure of shallow soil covering the bedrock in other geomorphologic regions. However, due to the special geological background and strong karstification, its hydrological process is more complicated and there are multiple flow-producing interfaces [27,28,29]. Therefore, due to the complexity of the geographical environment, the simulation experiment and the runoff plot experiment are still dominant methods in the study of soil moisture in the karst landform. However, these experimental methods are difficult to infer under natural conditions [30]. In the natural rainfall process, subsurface soil water movement is a complex process due to the heterogeneity of soil properties, previous soil moisture conditions, land cover, rainfall characteristics, and especially, the distribution of the different root systems [31,32,33].
The movement of soil water can be effectively affected by changing soil physical and chemical properties, interception of rainfall by the canopy, vegetation type, and vegetation absorption [34,35]. Some studies in arid areas of China have shown that soil water reserves decrease after afforestation, and deep soil water (above 1.0 m) is not replenished by natural precipitation [36,37]. Su et al. analyzed the characteristics of soil water variation in seven different vegetation recovery modes in desertified karst areas and found that the influence of vegetation coverage on water content was greater than that of rock desertification degree [38]. Therefore, land use type or vegetation cover is considered to be the most important factor affecting hydrological processes and surface scour erosion.
The hydrological ecological environment, vegetation ecological environment, soil ecological environment and human environment in karst area are all very fragile. The destruction of a certain part of these links may worsen the overall ecological environment [39]. At present, most soil moisture studies in China focus on the Loess Plateau area. Compared with the soil erosion control in the Loess Plateau area of China, which is more mature in research, the barren mountains in the karst area have gradually become clear water and green mountains, the harsh ecological environment has been optimized, and the soil erosion control has achieved remarkable results after more than twenty years of comprehensive control of desertification. However, soil and water loss is still the main cause of ecological and environmental deterioration in karst areas in southern China, and the research is relatively weak [40]. In order to improve the practicability of the research, it is necessary to take local conditions into consideration, combining the actual climate characteristics, terrain, vegetation types, and soil texture of the research area.
Because of the lack of research on soil water change characteristics and soil water absorption and utilization under vegetation in the karst area, this paper selected four vegetation plots on the slope in the research area and monitored the changes of rainfall and soil water and the characteristics of soil water change under different intensity rainfall events. Combined with soil texture, the research hypothesis is put forward: (1). The response characteristics of soil moisture to rainfall are different. Response times vary with different amounts of rain and intensity. (2). At the slope scale, the spatial heterogeneity of soil water content was mainly manifested among different vegetation types.
2. Materials and Methods
2.1. Study Area
The study area is located in Shibing County, Guizhou Province, a karst region in southern China (108°00′43″–108°12′55″ E, 27°02′54″–27°15′45″ N). It is located in the slope zone of transition from the central mountains of Guizhou Province to the hills of western Hunan Province. (Figure 1)
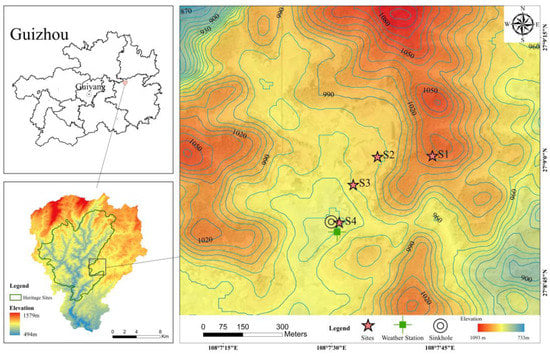
Figure 1.
Study area and site locations information.
As a part of the second phase of the South China Karst Series of the World Natural Heritage, Shibing County is a typical dolomite karst area. The Shibing Karst area has a long history of development, with an altitude of 518–1590 m, an average annual temperature of about 16 °C, and an average annual precipitation of 1060–1200 mm. The precipitation is mainly concentrated from March to September. The climate is generally mild and humid, belonging to the subtropical humid monsoon climate zone. The vegetation in the study area is mainly secondary forest, and the cash crops are flue-cured tobacco, Radix pseudostellariae, golden crisp pear, peach, grape, and so on. The dominant industry in Shibing is tourism, and the agricultural production activities are mainly concentrated at the bottom of the depression, which has a good ecological environment.
The soil types of the study sites in the study area are all yellow earth, which are close to each other on the same slope. Natural vegetation types that had not been interfered with for five years were selected for the plots, which were wood trees, peach trees, flue-cured tobacco, and grassland. These four planting coverts are the three common planting coverts of arbor, frutex, and grass. The basic information of the sample site is shown in Table 1.

Table 1.
Study site locations and information.
2.2. Field Monitoring and Sampling
The study slope is located in a depression for in-situ tests. Four typical vegetation types are selected as study samples on the slope (site 1, site 2, site 3, and site 4 are referred to as S1, S2, S3, and S4 in the paper), and the slope direction is southwest. 5TE soil moisture sensors (Decagon, Pullman, WA, USA) were installed at each site in January 2020 (accuracy: 0.03 m3/m3), which were buried in the soil profile 0–0.75 m, every 0.15 m, with a total of 5 layers (site 1 is located at the top of the slope, the soil layer is shallow, conditions, only buried to the third layer 0.45 m).
These sensors ensured that there is no coarse root distribution near the probe and were used to monitor the moisture content of different soil profiles at various points. An EM50 data logger (Decagon, USA) was used to collect data, and the soil moisture content was collected at the frequency of recording data once in ten minutes. An Ecrn-100 high-precision rainfall sensor (Decagon, USA) (precision: 0.2 mm) was installed in the open area near the sample site to conduct long-term monitoring of meteorological elements such as rainfall in the study area. The soil moisture content and rainfall data used in this paper were collected from March 2020 to March 2021. None of the sites were artificially irrigated. Before the test, the basic physical and chemical properties of the sites are shown in Table 2. The soil texture data are shown in Figure 2.
Table 2.
Study the physical and chemical properties of soil in sites.
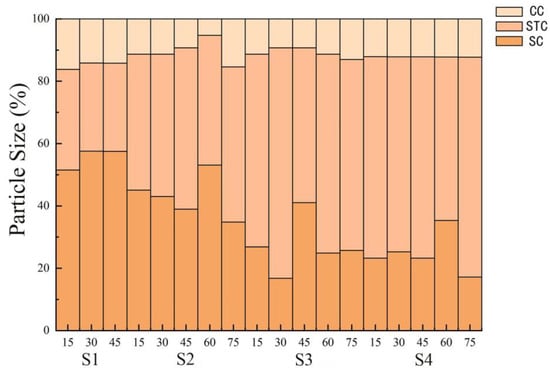
Figure 2.
Soil particle size composition in the study sites. CC: clay content. STC: silt content. SC: sand content.
2.3. Sample Analysis and Determination Method
2.3.1. Physical and Chemical Properties of Soil
Before the soil moisture sensors were buried, samples were taken at intervals of 15 cm at four sample points with a sampling depth of 0–75 cm (S1 0–45 cm). Impurities such as roots and gravel were removed during sampling. A soil sample was put into a ziplock bag for each layer, sealed and numbered, and brought back for the experiment. After drying and grinding 100 mesh, organic carbon was measured. An amount of 5 g of soil samples was weighed with a 60-mesh sieve, soaked in 1 mol/L hydrochloric acid solution for 24 h to remove carbonate in the soil, washed to neutral with deionized water, dried at 60 °C and ground, brought to the instrument laboratory, and weighed 20–50 mg samples with a 1/10,000th balance and wrapped in tin cups. An elemental analyzer (Thermo Fisher, Waltham, MA, USA) was used to determine soil organic carbon by the combustion oxidation-non-dispersive infrared method. The cutting-ring method was used to measure soil bulk density and total porosity. Undisturbed soil samples were collected with a 100 m3 ring cutter. The collected undisturbed soil samples were numbered and weighed on site, and the ring knife was taken back to the laboratory for soaking, drying, and weighing, and soil physical data such as soil bulk density and total porosity were measured. The hydrometer method was used for soil particle size [41,42]. The classification of soil texture was carried out according to the international system method of dividing soil particle size: the sand particle size is 0.020~2.000 mm; The silt particle size is 0.002~0.020 mm. The clay particle size is 0~0.002 mm. A total of 54 samples were collected by three experimental methods.
2.3.2. Analysis of Soil Water Storage and Soil Water Supplement of Each Rainfall
Based on the continuous dynamic monitoring of rainfall and soil moisture, the influence of rainfall on soil moisture change and recharge characteristics are quantitatively identified, so as to explore the effective utilization of soil water under mixed agriculture and forestry [43].
In Formula (1), is 0–0.45 m soil water storage (mm); in Formula (2), is 0–0.75 m soil water storage (mm); is the soil water content of each layer, which is measured by soil water probe (m3 m−3); and is the corresponding soil depth (mm). In this study, the depth of each soil layer is 150 mm, with a total depth of 0.45 m for three layers and 0.75 m for five layers.
In this Formula, is the amount of soil water replenishment by rainfall (mm); is the maximum soil water storage capacity after rainfall (mm); and is the initial soil water storage capacity before rainfall (mm).
2.3.3. Experimental Methods and Data Processing
Before the soil moisture sensors were buried, samples were taken at intervals of 15 cm at four sample points with a sampling depth of 0–75 cm (S1 0–45 cm). Impurities such as roots and gravel were removed during sampling. Excel 2019 and SPSS 22.0 were used for statistical analysis, and Origin 2018 was used for graph drawing. Maps were made using the ArcGIS 10.2 software.
All data were tested for normality and variance uniformity in SPSS. Single-factor ANOVA analysis was used to test the difference in soil moisture content in wet and dry seasons under different layers. Linear regression was used to test the correlation between soil moisture content and rainfall under different vegetation.
3. Results
In this study, the average water content of the test site during the rain and dry season in the monitoring period was analyzed (Figure 3). The monitoring period is the year of average rainfall. In all the 41 rainfall events that occurred during the monitoring period, the temporal variation of soil water content at different depths was shown under the representative small (5 mm), medium (36.4 mm), and large (60.8 mm) rainfall events [18] (Figure 4). In the rainfall event, two rainfall events with comparable rainfall but different rainfall times were selected to analyze the variation trend of soil moisture before, during, and after rainfall under different rainfall intensities (3.65 mm/h, 7.54 mm/h). The soil water supply of different vegetation types under the next rainfall was analyzed, and the basic characteristics of soil water response under rainfall were studied, as well as the changes of soil water under different vegetation types.
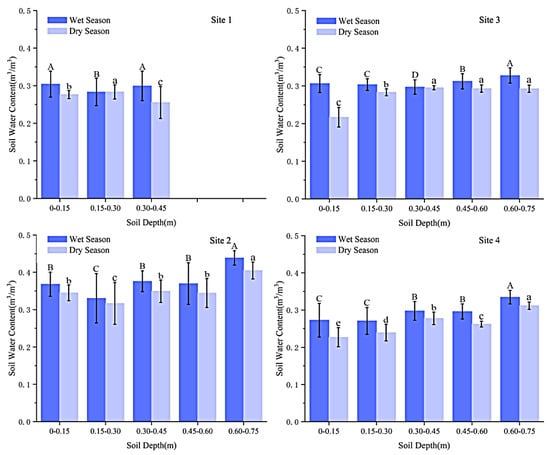
Figure 3.
Stratified average water content and difference in dry and wet seasons in the site. In the figure, from top to bottom, from left to right, the average moisture content of soil in wet and dry seasons is shown in S1, S2, S3 and S4 study sites, and the column represents the significant difference of soil water content in different layers in the same season. Capital letters indicate wet seasons and lowercase letters indicate dry seasons. The same letter means the difference is not significant, while different letters mean the difference is significant. The error bar represents the standard deviation.
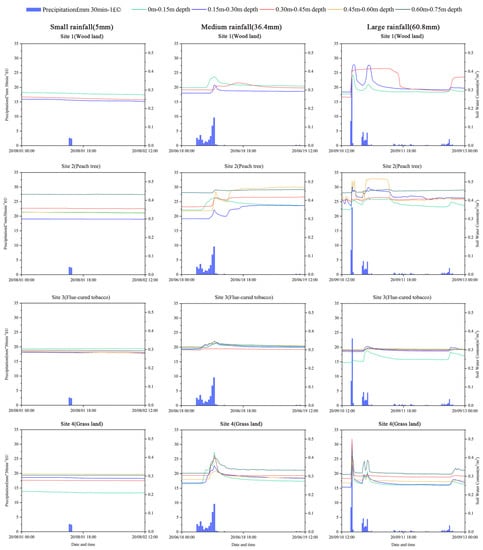
Figure 4.
Response of soil water content to rainfall events in study sites.
3.1. Soil Moisture in Wet and Dry Seasons during Monitoring Period
Figure 3 shows the average soil water content of layered soil under 0–0.75 m profiles in different wet and dry seasons. The results showed that the average soil water content was highest in the fifth layer of the S2 peach tree (0.439 m3/m3) and lowest in the second layer of S4 grassland (0.271 m3/m3) in the wet season. In the dry season, the highest value was in the fifth layer of the S2 peach tree (0.405 m3/m3), and the lowest value was in the first layer of S3 flue-cured tobacco (0.217 m3/m3). The second layer of S1 grassland in the wet season was significantly lower than the other two layers (p < 0.05), and the difference was significant in the dry season. There was a significant difference between the second layer and the fifth layer of S2 peach trees in the wet and dry seasons (p < 0.05). The difference in S3 flue-cured tobacco was significant at 0.30–0.75 m in the wet season, but not in the dry season. There were significant differences among S4 grassland layers in the dry season. The average soil water content of the four vegetation types was different, but the overall average soil water content was S2 > S3 > S1 > S4, while peach trees had the highest water content and the lowest grassland.
3.2. Soil Moisture Stratification Response to Rainfall
Table 3 shows the basic characteristics of the three rainfall events. At test sites 1, 2, 3, and 4, there were differences in soil moisture changes in representative small rainfall (<10 mm), moderate rainfall (10–50 mm), and heavy rainfall (>50 mm) (Figure 4) [18]. In the representative small rainfall (<10 mm) event, there was no significant change in soil moisture in each layer.
Table 3.
The basic characteristics of rainfall during the study period.
Among the representative medium rainfall (10–50 mm) events, the depth of 0–0.15 m is the most responsive to precipitation, followed by 0.15–0.30 m. The three layers of soil profiles in S1 all show the characteristics of longer response time with the increase of soil depth. The first layer has the most intuitive response to rainfall, the second layer is more sensitive to larger rainfall, and the third layer has the characteristic of lagging soil moisture change. Soil water at S2 had almost consistent response times in the last three layers, with the most obvious changes in the fourth layer and the most stable changes in the fifth layer. The soil moisture in S3 conforms to the rule that the response time of soil moisture to rainfall slows down with the increase of soil depth. The soil moisture in the third layer does not significantly change and tends to be stable. In S4, the response time of the first layer is the fastest, followed by that of the second layer. The response times of the last three layers are slow, but the time difference is not obvious, in which the first, third, and fifth layers have more obvious soil moisture peak at the peak moment of rainfall. As the rainfall event ended, the first soil moisture rapidly drops, and the fifth was the slowest.
Among the representative large rainfall (>50 mm) events, the response of soil moisture to rainfall was the most obvious. Soil moisture at S1 showed the same trend in the first and second layers, with a clear response to the two phases of rainfall. The soil moisture in the third layer only responded to the rainfall in the first stage, and then remained stable. The trend of rapid decline and steady and slow decline after the rainfall events in the first two phases was maintained, and the response was the most obvious in the third rainfall phase. This is possibly because the soil water in that layer reaches its peak, the soil can’t hold any more water. Thus, it cannot penetrate into the deeper layer, so the soil water changes smoothly. The variation trend of S2 soil moisture in the first three layers was the same, varying with the occurrence and intensity of rainfall. In the second and third stages, soil moisture in the first layer significantly decreased. The soil moisture in the fourth layer reached the maximum value after the second stage of rainfall, while the soil moisture in the bottom layer only slightly changed and was least affected by rainfall. The variation trend of soil moisture in S3 was small, and only the first layer responded to the rainfall in the first stage and the response time of each soil layer was longer. Combined with the analysis of the soil physical properties, the soil permeability of this site was poor. Each layer of soil moisture in S4 has the most obvious response to rainfall, and the change trend is the largest, and the change of soil moisture is also closely related to the rainfall.
In general, the rainfall supply of soil water in large rainfall events is large, which can rapidly cause the change of soil water in various soil layers, among which S4 is the most obvious and S3 is the most special, which is closely related to soil properties and vegetation cover types.
3.3. Dynamic Changes of Soil Moisture under Different Rainfall Intensities
In order to understand the characteristics of soil moisture absorption under different vegetation types, two rainfall events with similar rainfall times and different rainfall times were selected from the 41 rainfall events (stable soil environment) (Table 4). Figure 5 shows the dynamic changes in soil water content under different rainfall intensities. The results showed that under different rainfall intensities, the change of the same vegetation type was consistent on the whole, but the trend was different in different stages. The soil water content of S2 was the most significantly affected by rainfall intensity, while the soil water content of S3 was the least significantly affected by rainfall intensity. In S1, the variation trend of soil water content before and after rainfall is the same, while the variation trend during precipitation is the opposite. The peak of soil water content appears in the second soil layer profile (0.351 m3/m3) during the precipitation with small rainfall intensity. In S2, the soil moisture content of small rainfall intensity events was higher than that of moderate to low rainfall intensity events on the whole. The peak value appeared in the soil profile of the fourth layer (0.502 m3/m3) after the small rainfall intensity. The variation trend of soil moisture content in S3 at different stages is the same as that in S4, and the peak value appears in the fifth layer (0.336 m3/m3; 0.386 m3/m3).
Table 4.
Basic characteristics of two rainfall events under different rainfall intensities.
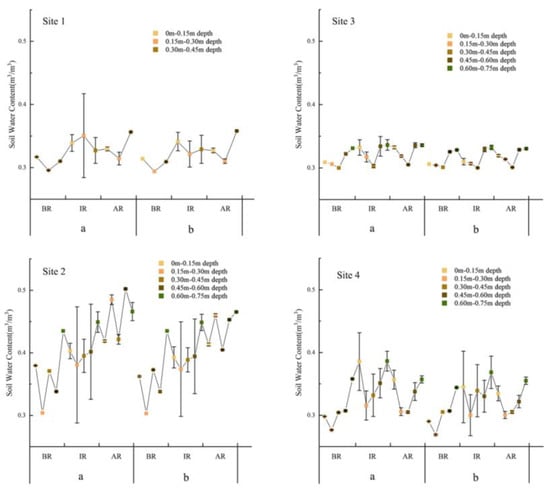
Figure 5.
Dynamic changes of layered soil water content under different rainfall intensities at different rainfall periods (a) Small rainfall intensity events and (b) moderate to low rainfall intensity events (the size here refers to the relative ratio of two rainfall, not the prescribed data range division). BR: before the rain; IR: in the rain; AR: after the rainfall.The error bar represents the standard deviation.
Studies have shown that soil moisture can be better absorbed during small rainfall events with the same amount of rainfall.
3.4. Recharge Relationship between Next Rainfall of Different Vegetation Types and Soil Water Content
3.4.1. Soil Moisture Supply by Next Rainfall of Different Vegetation Types
In order to clarify the recharge characteristics of soil water by different vegetation types, 21 representative rainfall events that have recharge effects on soil water are selected for analysis. As shown in Figure 6, under the same rainfall conditions, the soil water recharge of different vegetation are significantly different. The soil moisture of peach trees and grassland was effectively replenished in the 21 rainfall events, while the soil moisture of flue-cured tobacco was less. Under the condition of little rainfall, the soil moisture supply was insufficient.

Figure 6.
Soil water supply by next rainfall under different vegetation types.
3.4.2. Relationship between Soil Water Supply and Rainfall
Figure 7 constructs a monoidal linear regression equation for the relationship between soil water supply and rainfall under different vegetation types.
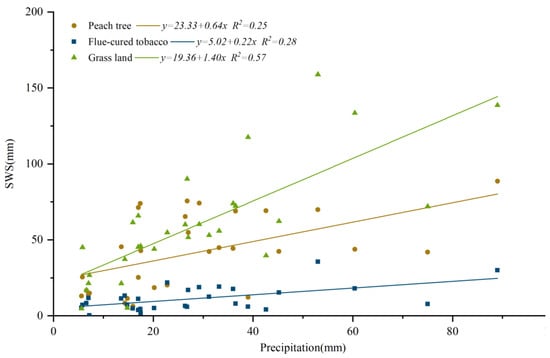
Figure 7.
Relationship between soil water supply and rainfall of different vegetation types.
It can be seen that the soil water supply of different vegetation types has a good linear relationship with rainfall. Regression analysis showed that the rainfall recharge threshold of grassland was the smallest, and rainfall was easy to recharge soil water. The flue-cured tobacco rainfall recharge threshold was the largest, indicating that a large amount of rainfall was needed to effectively recharge soil moisture. This is because the total porosity of the soil in flue-cured tobacco land is small, so that soil moisture cannot be effectively supplemented.
4. Discussion
4.1. Precipitation Is a Significant Factor Affecting Soil Moisture Variation
This study revealed the soil moisture variation characteristics under different vegetation types at the slope scale in the karst area. In the representative small rainfall events (<10 mm), there was no obvious response to soil moisture, and rainfall failed to effectively replenish soil moisture. In the event of medium rainfall (10 mm–50 mm), the response times of soil moisture in each soil layer were different. The response time of surface soil moisture was the shortest, while that of the bottom soil moisture was late. Moreover, after the end of the rainfall event, the surface soil moisture decreased the fastest, which was considered to be related to evaporation and absorption from plants. Rainfall characteristics, including rainfall intensity, rainfall amount, and rainfall duration are the main factors controlling hydrological responses. The greater the rainfall intensity or the longer the rainfall duration, the peak runoff will usually be generated [44,45], which means that under the same circumstance, the greater the runoff, the smaller the content of layered soil moisture. In this study, under the condition of the same rainfall, the variation degree of soil moisture content and stratified soil moisture with low rainfall intensity is higher than that with high rainfall intensity. The soil layer was divided into a rapid change layer (CV ≥ 15%), an active layer (CV: 10–15%), a sub-active layer (CV: 5–10%), and a relatively stable layer (CV ≤ 5%) according to the coefficient of variation [46].
As shown in Table 5, the study found that the soil layer of S1 belongs to the active layer in the wet season. In the dry season, 0–0.15 m is the relatively stable layer, 0.15 m to 0.30 m is the sub-active layer, and 0.30–0.45 m is the rapidly changing layer. In the wet season, the soil layer of S2 belongs to the sub-active layer at 0–15 cm and 30–45 cm, the rapidly changing layer at 15–30 cm and 45–60 cm, and the sub-active layer at 0.30–0.45 m. In the dry season, there are rapidly changing layers at 0.15–0.30 m, active layers at 0.45–0.60 m, and the rest are sub-active layers. In the wet season, the soil layer of S3 is sub-active except for the relatively stable layer at 0.30–0.45 m. In the dry season, except for the active layer at 0–0.15 m, the other layers were relatively stable. In the wet season, the first two layers of S4 are fast-changing layers, and the last three layers are sub-active layers. In the dry season, 0–0.15 m is the active layer, 0.15–0.30 m and 0.30–0.45 m is the sub-active layer, and the last two layers are relatively stable layers. On the whole, the shallow soil moisture (0–0.30 m) is more active in the wet season and tends to be stable in the dry season. The change of soil moisture in the karst area is mainly affected by the wet season rainfall. During the study period, the variation trend of vegetation soil moisture content had a certain rule with that of rainfall. June, August, and September had more rainfall, which was also the peak period of soil moisture recharge by rainfall. The average soil moisture content of grassland was the highest, followed by peach trees and flue-cured tobacco.
Table 5.
Variation coefficient of soil moisture content in study sites.
4.2. Soil Water Absorption Is Affected by Soil Properties and Vegetation Types
The characteristics of soil water dynamic change are affected by soil properties. At the same time, the higher the soil porosity, the smaller the change coefficient of soil water content [47,48,49]. For the flue-cured tobacco sample land in this study, the soil property of the flue-cured tobacco growing area is poor. The soil bulk density is large and the porosity is small, so the water is difficult to absorb, and it is more likely to cause soil erosion. As shown in Figure 6 and Figure 7, grassland soil moisture is the easiest to be effectively replenished after the rainfall. The grass has a smaller canopy width than other plant types, and plant morphology, especially the root system, has an important impact on the precipitation distribution process [50,51], which is consistent with the research results of others. Wang et al. studied the response characteristics of soil moisture to precipitation in the Loess Plateau watershed and analyzed the influence of different vegetation coverage on rainfall infiltration. They found that different types of vegetation cover significantly affected precipitation infiltration [52]. In this study, except for the woodland on the top of the mountain, peach trees belong to trees and flue-cured tobacco belongs to shrubs. Since trees are susceptible to canopy cortical runoff, shrubs have higher trunk runoff, but flue-cured tobacco is affected by soil properties. In this study area, the condition of water absorption of three vegetation types is grassland > peach tree > flue-cured tobacco.
4.3. Deficiencies and Future Research
Although the current in-situ experiment method is closer to the real natural environment than the indoor simulation experiment, and the research conclusions obtained are more practical, the in-situ experiment needs to take into account many external conditions, such as human interference and climate anomalies, which may cause a large number of experimental data errors. In future research, it is necessary to minimize the limitations brought by errors.
This paper mainly studied the response characteristics of soil moisture to rainfall under different vegetation types and the variation characteristics of soil moisture. In future studies, soil water can be refined from the absorption of plant roots to soil, including the different growth periods of plants, soil water absorption, and utilization are also different. C13 isotope identification technology can be used to evaluate the water use efficiency of plants. Combined with the influence of precipitation and other factors, various factors affecting soil water can be more comprehensively understood.
The research results of this paper are based on the natural conditions of the study area, which can represent a case. The specific research direction should be based on the specific natural and cultural conditions of the study area, and the specific situation on the surface of the earth.
5. Conclusions
The response characteristics of soil moisture to rainfall under different slope positions and vegetation types in the karst area were studied. In rainfall events of more than 10 mm, soil moisture changes with the rainfall, and to some extent, they affect the conservation of soil and water.
Peach tree has better water retention and water storage performance, and the soil moisture affected by rainfall level is small. Peach tree can increase the surface coverage to reduce soil erosion, leading to not only increased ecological benefits but also certain economic benefits. Since Shibing is a World Heritage site, considering the unity of ecological benefits and economic benefits, planting fruit trees in appropriate places is the first choice for the development of the site.
Author Contributions
Conceptualization, K.X. and Z.W.; methodology, Z.W., J.X. and C.S.; software, Z.W.; formal analysis, Z.W.; investigation, D.L.; data curation, Z.W. and D.L.; writing—original draft preparation, Z.W.; writing—review and editing, Z.W. and C.W.; project administration, K.X.; funding acquisition, K.X. All authors have read and agreed to the published version of the manuscript.
Funding
This study was supported by the Philosophy and Social Science Planning Key Project of Guizhou Province (Grant No. 21GZZB43), the Key Project of Science and Technology Program of Guizhou Province (No. 5411 2017 Qiankehe Pingtai Rencai) and the China Overseas Expertise Introduction Program for Discipline Innovation (No. D17016).
Data Availability Statement
Data are contained within the article.
Conflicts of Interest
The authors declare no conflict of interest.
References
- Ersahin, S.; Brohi, A.R. Spatial variation of soil water content in topsoil and subsoil of a Typic Ustifluvent. Agr. Water Manag. 2006, 83, 79–86. [Google Scholar] [CrossRef]
- Gish, T.J.; Prueger, J.H.; Daughtry, C.S.T.; Kustas, W.P.; McKee, L.G.; Russ, A.L.; Hatfield, J.I. Comparison of field-scale herbicide runoff and volatilization losses: An eight year field investigation. J. Environ. Qual 2011, 40, 1432–1442. [Google Scholar] [CrossRef] [PubMed]
- Grayson, R.B.; Bloschl, G.; Western, A.W.; McMahon, T.A. Advances in the use of observed spatial patterns of catchment hydrological response. Adv. Water Resour. 2002, 25, 1313–1334. [Google Scholar] [CrossRef]
- Deng, L.; Yan, W.; Zhang, Y. Severe depletion of soil moisture following land-use changes for ecological restoration: Evidence from northern China. For. Ecol. Manag. 2016, 366, 1–10. [Google Scholar] [CrossRef]
- D’Odorico, P.; Porporato, A. Preferential states in soil moisture and climate dynamics. Proc. Natl. Acad. Sci. USA 2004, 101, 8848–8851. [Google Scholar] [CrossRef]
- Duan, L.; Huang, M.; Zhang, L. Differences in hydrological responses for different vegetation types on a steep slope on the Loess Plateau, China. J. Hydrol. 2016, 537, 356–366. [Google Scholar] [CrossRef]
- Herman, E.K.; Toran, L.; White, W.B. Clastic sediment transport and storage in fluviokarst aquifers: An essential component of karst hydrogeology. Carbonates Evaporites 2012, 27, 211–241. [Google Scholar] [CrossRef]
- Zhang, Q.H.; Lin, C.H.; He, T.B. Discussion on soil erosion factor and ecological restoration of karst mountain area in Guizhou. Guizhou Sci. 2006, 24, 62–74. [Google Scholar]
- Li, Y.B.; Xie, D.T.; Wei, C.F.; Zhou, B.T. A study of features of water-stable soil aggregate structure under different land use in karst mountains. Resour. Environ. Yangtze Basin 2002, 11, 451–455. [Google Scholar]
- Liu, W.; Wang, S.J.; Luo, W.J.; Rong, L. Comparative Research on Soil Water Movement Between Karst and Non-karst Plots in Libo County of Guizhou Province, China. Earth Environ. 2011, 39, 137–149. [Google Scholar]
- Beckett, P.H.T.; Webster, R. Soil variability: A review. Soils Fert. 1971, 34, 1–15. [Google Scholar]
- Robinson, D.A.; Campbell, C.S.; Hopmans, J.W.; Hornbuckle, B.K.; Jones, S.B.; Knight, R.; Ogden, F.L.; Selker, J.S.; Wendroth, O. Soil moisture measurement for ecological and hydrological watershed-scale observatories: A review. Vadose Zone J. 2008, 7, 358–389. [Google Scholar] [CrossRef]
- Montenegro, S.; Ragab, R. Impact of possible climate and land use changes in the semi arid regions: A case study from North Eastern Brazil. J. Hydrol. 2012, 434, 55–68. [Google Scholar] [CrossRef]
- Yang, L.; Chen, L.D.; Wei, W.; Yu, Y.; Zhang, H.D. Comparison of deep soil moisture in two re-vegetation watersheds in semi-arid regions. J. Hydrol. 2014, 513, 314–321. [Google Scholar] [CrossRef]
- Yao, X.L.; Fu, B.J.; Lv, Y.H.; Chang, R.Y.; Wang, S.; Wang, Y.F.; Su, C.H. The multi-scale spatial variance of soil moisture in the semi-arid Loess Plateau of China. J. Soils Sediments 2012, 12, 694–703. [Google Scholar] [CrossRef]
- Yu, B.W.; Liu, G.H.; Liu, Q.S.; Huang, C.; Li, H.; Zhao, Z.H. Seasonal variation of deep soil moisture under different land uses on the semi-arid Loess Plateau of China. J. Soils Sediments 2019, 19, 1179–1189. [Google Scholar] [CrossRef]
- Wei, F.; Wang, S.; Fu, B. African dryland ecosystem changes controlled by soil water. Land Degrad. Dev. 2019, 30, 1564–1573. [Google Scholar] [CrossRef]
- Zhu, Q.; Nie, X.F.; Zhou, X.B. Soil moisture response to rainfall at different topographic positions along a mixed land-use hillslope. Catena 2014, 119, 61–70. [Google Scholar] [CrossRef]
- Yen, B.C.; Chow, V.T. A laboratory study of surface runoff due to moving rainstorms. Water Resour. Res. 1969, 5, 989–1006. [Google Scholar] [CrossRef]
- Foroud, N.; Broughton, R.S.; Austin, G.L. The effects of a moving rainstorm on direct runoff properties. Water Resour. Bull 1984, 20, 87–91. [Google Scholar] [CrossRef]
- Nunes, J.P.; De Lima, J.; Singh, V.P. Numerical modeling of surface runoff and erosion due to moving rainstorms at the drainage basin scale. J. Hydrol. 2006, 330, 709–720. [Google Scholar] [CrossRef]
- Lee, K.T.; Huang, J.K. Effect of moving storms on attainment of equilibrium discharge. Hydrol. Process. 2007, 21, 3357–3366. [Google Scholar] [CrossRef]
- Liu, Q.; Du, J.Y.; Shi, J.C. Analysis of spatial distribution and multi-year trend of the remotely sensed soil moisture on the Tibetan Plateau. Sci. China-Earth Sci. 2013, 56, 2173–2185. [Google Scholar] [CrossRef]
- Ayehu, G.; Tadesse, T.; Gessesse, B. Monitoring Residual Soil Moisture and Its Association to the Long-Term Variability of Rainfall over the Upper Blue Nile Basin in Ethiopia. Remote Sens. 2020, 12, 2138. [Google Scholar] [CrossRef]
- Penna, D.; Borga, M.; Norbiato, D. Hillslope scale soil moisture variability in a steep alpine terrain. J. Hydrol. 2009, 364, 311–327. [Google Scholar] [CrossRef]
- Wang, S.; Ye, L.H.; Zheng, Z.C.; Li, T.X. Characteristics of runoff and nitrogen losses in yellow soil sloping cropland at mature stage of maize. J. Soil. Water Conserv. 2018, 32, 28–33. [Google Scholar]
- Wang, S.; Fu, Z.Y.; Chen, H.S.; Nie, Y.P.; Xu, Q.X. Mechanisms of surface and subsurface runoff generation in subtropical soil-epikarst systems: Implications of rainfall simulation experiments on karst slope. J. Hydrology. 2020, 580, 124370. [Google Scholar] [CrossRef]
- Fu, Z.Y.; Chen, H.S.; Zhang, W.; Xu, Q.X.; Wang, S.; Wang, K.L. Subsurface flow in a soilmantled subtropical dolomite karst slope: A field rainfall simulation study. Geomorphology 2015, 250, 1–14. [Google Scholar] [CrossRef]
- Fu, Z.Y.; Chen, H.S.; Xu, Q.X.; Jia, J.T.; Wang, S.; Wang, K.L. Role of epikarst in near-surface hydrological processes in a soil mantled subtropical dolomite karst slope: Implications of field rainfall simulation experiments. Hydrol. Process. 2016, 30, 795–811. [Google Scholar] [CrossRef]
- A, Y.L.; Wang, G.; Sun, W.; Xue, B.; Kiem, A. Stratification response of soil water content during rainfall events under different rainfall patterns. Hydrol. Process. 2018, 32, 1–12. [Google Scholar] [CrossRef]
- Martínez-Fernández, J.; Ceballos, A. Temporal stability of soil moisture in a large-field experiment in Spain. Soil Sci. Soc. Am. 2003, 67, 1647–1656. [Google Scholar] [CrossRef]
- Gao, X.D.; Wu, P.T.; Zhao, X.N.; Shi, Y.G.; Wang, J.W.; Zhang, B.Q. Soil moisture variability along transects over a well-developed gully in the Loess Plateau, China. Catena 2011, 87, 357–367. [Google Scholar] [CrossRef]
- Vereecken, H.; Huisman, J.A.; Pachepsky, Y. On the spatio-temporal dynamics of soil moisture at the field scale. Hydrol 2014, 516, 76–96. [Google Scholar] [CrossRef]
- Hupet, F.; Vanclooster, M. Intraseasonal dynamics of soil moisture variability within a small agricultural maize cropped field. Hydrol 2002, 261, 86–101. [Google Scholar] [CrossRef]
- Vepraskas, M.J.; Heitman, J.L.; Austin, R.E. Future directions for hydropedology: Quantifying impacts of global change on land use. Hydrol. Earth Syst. Sci. 2010, 13, 1427–1438. [Google Scholar] [CrossRef]
- Farley, K.A.; Jobbágy, E.G.; Jackson, R.B. Effects of afforestation on water yield: A global synthesis with implications for policy. Glob. Change Biol. 2005, 11, 1565–1576. [Google Scholar] [CrossRef]
- Sun, G.; Zhou, G.Y.; Zhang, A.Q. Potential water yield reduction due to forestation across China. Hydrol 2006, 328, 548–558. [Google Scholar] [CrossRef]
- Su, Y.; He, B.H.; Yao, X.H.; Ren, H.D. Spatial Variability of Soil Water in Karst Rocky Desertification Area in the Eastern Part of Yunnan Province. J. Southwest China Norm. Univ. (Nat. Sci. Ed.) 2008, 33, 67–71. [Google Scholar]
- Xiong, K.N.; Chi, Y.K. Problems and countermeasures of karst ecosystem in southern China. Ecol. Econ. 2015, 31, 23–30. [Google Scholar]
- Ma, Q.H.; Zhang, K.L. Progress and prospect of soil erosion research in karst areas of Southwest China. Adv. Earth Sci. 2018, 33, 1130–1141. [Google Scholar]
- Li, Y.Q.; Dai, Q.H.; Ren, Q.Q. Karst soil vertical permeability and influence factors of shallow crack. J. Soil Water Conserv. 2020, 3, 150–155. [Google Scholar]
- Yang, L.; Zhang, H.D.; Chen, L.D. Study on soil water recharging efficiency and threshold value of secondary rainfall in Loess Wide beam gentle slope hilly region. J. Sci. China Earth Sci. 2018, 48, 457–466. [Google Scholar]
- Guo, D.S.; Ma, Z.Q. Study on test principle and manufacturing accuracy of hydrometer. Chin. J. Geotech. Eng. 1981, 3, 106–113. [Google Scholar]
- Stephenson, D. Kinematic study of effects of storm dynamics on runoff hydrographs. Water SA 1984, 10, 189–196. [Google Scholar]
- Singh, V. Effect of spatial and temporal variability in rainfall and watershed characteristics on stream flow hydrograph. Hydrol. Process. 1997, 11, 1649–1669. [Google Scholar] [CrossRef]
- Yom, Y.J. Study on Shallow Karst Fissures and Main Ecological Functions of Soil in Karst Rocky Desertification Rea. Ph.D. Thesis, Guizhou University, Guiyang, China, 2019. [Google Scholar]
- Bai, W.; Chen, X.; Tang, Y.; He, Y.; Zheng, Y. Temporal and spatial changes of soil moisture and its response to temperature and precipitation over the Tibetan Plateau. Hydrol. Sci. J. 2019, 64, 1370–1384. [Google Scholar] [CrossRef]
- Zeng, J.; Fei, L.J.; Pei, Q.B. Influence of Soil Bulk Density on Soil Water Infiltration Characteristics in Water Vertical Movement for Red Loams. J. Drain. Irrig. Mach. Eng. 2017, 35, 1081–1087. [Google Scholar]
- Zhang, C.; Chen, H.S.; Zhang, W.; Nie, Y.P.; Ye, Y.Y.; Wang, K.L. Spatial Variation Characteristics of Surface Soil Water Content, Bulk Density and Saturated Hydraulic Conductivity on Karst Slopes. Chin. J. Appl. Ecol. 2014, 25, 1585–1591. [Google Scholar]
- Bialkowski, R.; Buttle, J.M. Stemflow and throughfall contributions to soil water recharge under trees with differing branch architectures. Hydrol. Process. 2015, 29, 4068–4082. [Google Scholar] [CrossRef]
- Zhang, Y.F.; Wang, X.P.; Hu, R.; Pan, Y.X.; Paradeloc, M. Rainfall partitioning into throughfall, stemflow and interception loss by two xerophytic shrubs within a rain-fed re-vegetated desert ecosystem, northwestern China. J. Hydrol. 2015, 527, 1084–1095. [Google Scholar] [CrossRef]
- Wang, Y.C.; Wu, Y.H.; Li, M. Study on Water and Soil Loss and Control Methods in Pisha Sandstone, 1st ed.; The Yellow River Water Conservancy Press: Zhengzhou, China, 2007; pp. 132–138. [Google Scholar]
Disclaimer/Publisher’s Note: The statements, opinions and data contained in all publications are solely those of the individual author(s) and contributor(s) and not of MDPI and/or the editor(s). MDPI and/or the editor(s) disclaim responsibility for any injury to people or property resulting from any ideas, methods, instructions or products referred to in the content. |
© 2023 by the authors. Licensee MDPI, Basel, Switzerland. This article is an open access article distributed under the terms and conditions of the Creative Commons Attribution (CC BY) license (https://creativecommons.org/licenses/by/4.0/).