Abstract
Cultivated land quality is directly related to national food security; hence, it is necessary to determine the spatial–temporal characteristics and factors that influence its variation. This study analyzed the soil properties and cultivated land quality in the Hang-Jia-Hu Plain, the most important grain production base in Zhejiang Province, located in the lower reaches of the Yangtze River, from 2017 to 2020. In addition, the factors that influenced cultivated land quality variation were explored. The results showed that soil pH and soil organic matter (SOM) significantly improved from 6.32 and 29.07 g/kg in 2017 to 6.38 and 31.54 g/kg in 2020, whereas the variations in available phosphorus (AP) and available potassium (AK) were not significant. More than 60% of the cultivated land still had the potential for soil nutrient status improvement. The cultivated land quality indicator (CLQI) calculated based on the national standard (GB/T 33469-2016) significantly increased from 0.90 in 2017 to 0.91 in 2020. According to the CLQI classification, approximately three quarters of the cultivated land was defined as high-yielding fields. Although the spatial pattern for CLQI was similar between 2017 and 2020, more than 75% of the cultivated land quality showed an increasing trend that was mainly located in the northeastern and central areas. The results of influential factor detection indicated that the improvement in SOM and available soil nutrients including AP and AK was the main reason for the CLQI increase, whereas the climate, topography, and socioeconomic factors had little influence on the change in CLQI. In addition, when influential factors interacted, a significant increase in the explanatory ability for CLQI was obtained, especially for the interaction of SOM and AP variation, which explained 41% of the CLQI variation. This study provides basic foundations and references for cultivated land quality monitoring and improvement in the lower reaches of the Yangtze River, China.
1. Introduction
As a basic natural resource directly related to agricultural production, cultivated land is of great importance to maintain food security and social stability [1,2]. The degradation of cultivated land will affect the sustainable development of agriculture and lead to other social problems, especially in counties such as China, which has experienced rapid urbanization and industrialization processes since the Reform and Opening Up in 1978 [3,4]. China is now facing significant challenges related to the loss and degradation of cultivated land. Vast amounts of high-quality cultivated land have been encroached upon by urbanization, resulting in serious threats to the protection of 120 million hectares of cultivated land, which is the red line defined by the government [2,5]. On the other hand, the quality degradation of cultivated land caused by diverse anthropogenic factors, such as industrial pollutant emissions and intensive agricultural production, has more profound impacts on food security than the loss of cultivated land, posing serious threats to the ecological environment and socioeconomic development [6,7]. Hence, the current strategies for cultivated land conservation in China have gradually changed to those in which quantity, quality, and ecology are given equal importance [8]. Therefore, it is necessary to evaluate cultivated land quality changes in the space-time domain and to clarify the key factors that affect the changes, which would help to guarantee food security and sustainable development.
Cultivated land quality is a comprehensive reflection of the properties of cultivated land that involves a variety of natural and anthropogenic factors [9]. During its evaluation processes, there were great differences in the data and selection methods due to the different objectives. For example, the quality of cultivated land was redefined by Liu et al. in terms of productivity and environmental suitability, and the minimum barrier factor method and weighted linear model were employed to assess the comprehensive indicator for cultivated land quality [10]. Tan et al. evaluated the comprehensive quality of cultivated land in the scopes of production efficiency, ecological security, and sustainable use by means of the comprehensive evaluation indicator system and quantification standards of cultivated land quality [2]. The National Standard—Cultivated Land Quality Grade (GB/T 3349-2016) evaluates cultivated land from the comprehensive perspective of agricultural production, soil fertility, soil health status, and field infrastructures, using the composite weighted index methods to assess the quality of cultivated land, which provides a mature standard method for the evaluation of cultivated land quality in China. In addition, the development of geo-statistical theory and techniques provides intuitive and visual ways to assess the spatial distribution pattern of cultivated land quality. For example, Nael et al. applied the kriging interpolation method to predict the spatial pattern of important indicators of cultivated land quality and put forward targeted suggestions to prevent cultivated land quality degradation [11]. Kiani et al. analyzed the spatial distribution characteristics of sensitivity indicators for cultivated land quality under different land use patterns and detected their relationship with topography through the cokriging method [12]. However, when assessing cultivated land quality, previous studies usually referred to survey/statistical data at a unified time point, thus ignoring the variation in cultivated land quality in the space–time domain. From the perspective of risk assessment and influential factor detection, the analysis of quality changes can provide a more intuitive understanding of the effects of various factors on cultivated land to provide more specific recommendations for improving cultivated land quality and food production [13,14].
Analyzing the main influential factors of cultivated land quality variation is one of the main routes to provide references for the sustainable use of cultivated land and quality improvement. Various methods, including correlation analysis, cluster analysis, principal component analysis, and multiple linear regressions, which can simplify the data by replacing a class of highly correlated data with a composite indicator, thus reflecting the correlation between the data, have been used in influential factor detection in diverse regions [15,16,17]. However, to the best of our knowledge, most of those methods mainly focus on qualitative factor identification but are not sufficient for quantitative analysis. Additionally, they usually explore the possible influencing factors in general, but ignore the regional differences and temporal variation among the influencing factors, and studies on the spatial–temporal variation in cultivated land quality along with its main influential factor have rarely been conducted. Cultivated land quality variation has significant spatial-temporal characteristics whose differences should be fully considered through reasonable methods [14,18]. Among those methods, Geodetector, based on analysis of variance to capture spatial heterogeneity that makes no linear hypothesis for variables, is a relatively new spatial statistical method to detect the interaction between interpretation factors and dependent variables and has been applied to various disciplines [19,20,21]. Due to the abilities to assess numerical and categorical independent variables simultaneously and to reveal the interactions between detected factors, this method has good application prospects in identifying the influential factors and their interactions for cultivated land quality variation in the space-time domain.
The study area—the Hang-Jia-Hu Plain located in the lower reaches of the Yangtze River—is the most important food production base for Zhejiang Province and is regarded as one of the primary granaries during the history of agricultural production in China. Although the rapid development of urbanization and industrialization in recent decades has caused a decline in cultivated land, the government has taken corresponding reasonable measures, such as land consolidation and the promotion of soil testing and formula fertilization [22,23], to improve the quantity and quality of cultivated land. Considering that there are few studies on the variation in cultivated land quality and its main influential factors in this area, the main objectives of this research were (1) to explore the variation characteristics of cultivated land quality in the space–time domain and (2) to determine the main factors that influence the variation in cultivated land quality and to analyze the interactions between the factors. The results can provide basic references for improving cultivated land quality and for ensuring food security.
2. Materials and Methods
2.1. Sampling and Chemical Analysis
A total of 1308 sampling points were deployed by overlaying a 1 km × 1 km grid with the distribution of cultivated land. The sampling period was from late November to December after the main crop (rice) was harvested in 2017 and 2020, and the locations of the samples were unchanged in the two years. The actual location information was recorded through global positioning systems, and the sampling sites along with the cultivated land distribution are shown in Figure 1. The sampling process followed the criteria of Soil Testing, Collection, Handling, and Storage of Soil Samples (NY/T 1121.1): the representative field for sampling was determined according to the local conditions; 10–15 subsamples were collected at a depth of 0–20 cm and fully mixed through the “S” method around the sites; to obtain a representative sample, the quadratic method was applied to collect 1.5 kg to form a soil sample. At the same time, the field survey form for each point was filled out to verify and update the conditions of the topography, soil type, drainage and irrigation conditions, and other evaluation information defined by the National Standard—Cultivated Land Quality Grade (GB/T 33469-2016).
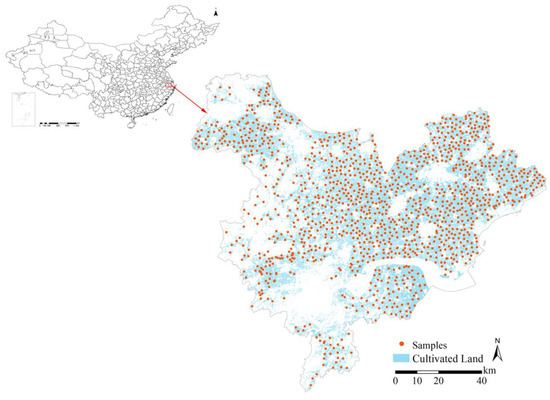
Figure 1.
The location of the study area and distribution of samples across the cultivated land area.
All soil samples were air-dried at room temperature (about 20 °C) and passed through a 2 mm mesh sieve for chemical analysis. The soil properties, including pH, soil organic matter (SOM), and soil available phosphorus (AP), were determined in accordance with corresponding criteria defined for soil testing (NY/T 1121.2-2006; NY/T 1121.6-2006; NY/T 1121.7-2014). In addition, available potassium (AK) was determined using the ammonium acetate leaching–flame photometric method (NY/T 889-2004). Parallel samples and reagent blanks were used for quality control, demonstrating the accuracy and reliability of the chemical tests.
2.2. Cultivated Land Quality Assessment
Based on the chemical analysis and field survey data of the sampling points, the cultivated land quality index (CLQI) of each point was calculated according to the National Standard–Cultivated Land Quality Grade (GB/T 33469-2016) as follows:
where CLQI is the cultivated land quality index, whose value ranges from 0 to 1 and represents the quality of cultivated land from worst to best. Si is the score of the ith evaluated indicator, whose value ranges from 0 to 1 and represents the worst to best of the indicators. According to the national standard (GB/T 33469-2016), the study area is in the “the lower reaches of the Yangtze River plain products area”, and the indicators included the soil nutrient status (SOM, AP, and AK) and pH obtained from chemical analysis and the terrain, effective soil layer thickness, soil texture and profile, and irrigation and drainage capacities obtained from the field survey dataset. Wi is the relative weight of the ith evaluated indicator, where
Detailed information about the indicator scoring and weighting definitions can be found in Cultivated Land Quality Grade (GB/T 33469-2016).
After the CLQI of each point in 2017 and 2020 was calculated, the spatial distribution of CLQI in cultivated land in each year was predicted by the kriging interpolation method [24,25]. Kriging is a classic tool to determine the optimal linear unbiased estimation of spatial data based on sampled data. The weights of the sampled neighbors to the prediction location can be estimated through the semivariogram model, which can be calculated as follows [24,26]:
where is the semivariogram value at distance h, n(h) is the number of sample pairs at distance h, and CLQI (si + h) and CLQI (si) are the cultivated land quality index at locations si + h and si, respectively.
Finally, the variation in cultivated land quality from 2017 to 2020 was calculated for each land as follows:
where is the variation in cultivated land quality for land I, and and are the cultivated land quality for land i in 2020 and 2017, respectively.
2.3. Influential Factor Selection and Processing
Based on previous studies [2,4,5,6,7,9,10,11,12] and the specific situation of the research area as well as the data available, sixteen influential factors in four categories were selected to assess their impacts on CLQI variation. Detailed information about the factors can be seen in Table 1.

Table 1.
Factors used to assess the impacts on cultivated land quality changes.
Climate data, including the annual average precipitation (AAP) and annual average temperature (AAT), were derived by interpolating gauged daily temperatures and precipitation from 825 CMA (Chinese Meteorological Administration, http://data.cma.cn/ (accessed on 10 November 2022)) stations into a spatial resolution of 0.10°.
Topography data, including the elevation (EL) and slope (SL), were obtained from the Advanced Spaceborne Thermal Emission and Reflection Radiometer Global Digital Elevation Model (ASTER GDEM) (30 m spatial resolution) (http://datamirror.csdb.cn/index.jsp/ (accessed on 10 November 2022)). Land use and land cover (LULC) information was obtained from the Data Center for Resources and Environmental Sciences, Chinese Academy of Sciences (RESDC) (http://www.resdc.cn (accessed on 10 November 2022)).
Considering soil property data, information about soil type (ST), soil texture (STE), and soil parent materials (SPM) was derived from the soil resources and cultivated land quality atlas of Zhejiang [27]. In addition, the variation in soil pH, SOM, AP, and AK information was obtained by subtracting the kriging interpolation results of the corresponding data in 2017 from those in 2020. Specifically, the values of SOMV, APV, and AKV were calculated as follows:
where Vi is the variation in indicator i from 2017 to 2020 and and are the concentrations of indicator i in 2020 and 2017, respectively. However, the “ideal” soil pH is close to neutral (7.0) and is considered to fall within a range from slightly acidic (6.5) to slightly alkaline (7.5) [28]. For the study, based on the scoring method from the national cultivated land quality standard (GB/T 33469-2016), the “ideal” pH value was defined as 6.80, and the pHV was calculated accordingly as follows:
where pH2017 and pH2020 are the pH values in 2017 and 2020, respectively; the higher the pHV value, the more significant the pH improvement.
Socioeconomic data, including the gross domestic product per capita (GDP), primary industry output (PIO), secondary industry output (SIO), and tertiary industry output (TIO), were obtained from the Hangzhou/Jiaxing/Huzhou statistical yearbook at the township level (http://www.hangzhou.gov.cn (accessed on 10 November 2022), http://tjj.huzhou.gov.cn/ (accessed on 10 November 2022), http://tjj.jiaxing.gov.cn/ (accessed on 10 November 2022)). In addition, their variation from 2017 to 2020 was calculated according to Equation (5).
2.4. Factor Detection
Geodetector is a relatively new statistical method for detecting spatial heterogeneity and revealing the driving factors [19]. It has been applied in many disciplines to measure spatial heterogeneity, detect explanatory factors, and analyze interactions between variables [20,21,29,30]. In this study, the strength of the factors with respect to the variation in CLQI was explored using the Geodetector model with the basic assumption that, if a specific factor is the main influencer of the variation in CLQI, then its spatial distribution characteristics should be similar to those of the CLQI variation. To quantitatively evaluate the similar distribution pattern, q-statistics were introduced as follows [19]:
where i = 1, ..., m is the stratification, i.e., classification or partitioning of factor X (possible influential factors); Nm and N are the number of cells in stratum m and the whole study area, respectively; and and are the variances of Y values (variation of CLQI) in stratum m and the whole study area, respectively. In addition, SVB and SVT are the sums of variances within the strata and the whole study area, respectively. The value of q ranges from 0 to 1, and a larger q value indicates a stronger explanatory power of the influential factor X on the variation in CLQI, and vice versa. In addition, the q value also indicates that factor X explains 100 × q% of the CLQI variation [20,21].
The calculation processes of Geodetector indicated that this model requires the independent variable X (influential factor) to be a categorical variable, which enhances its abilities to analyze both numerical variables and categorical variables simultaneously. Additionally, in the stratification process, categorical variables, including LULC, ST, STE, and SPM, were divided directly according to their categories, whereas numerical variables, including AAP, AAT, EL, SL, pHV, SOMV, APV, AKV, GDP, PIO, SIO, and TIO, were stratified by clustering analysis that ensured the maximum variation between groups [19].
In addition to analyzing the effect strength of individual factors on CLQI change, Geodetector integrated an interaction detector that could be used to explore the effect strength of multiple factors on the change in CLQI. The assessment of the interaction detection compares the differences among the q values of the two independent factors X1 and X2 as well as the new variable X1 ∩ X2 for the changes in CLQI. Based on the results of the comparison, the interactions between actors X1 and X2 can be classified into five categories: nonlinearly weakened, uniformly weakened, independent, bidirectionally enhanced, and nonlinearly enhanced when q(X1 ∩ X2) < Min (q(X1), q(X2)), Min (q(X1), q(X2)) < q(X1 ∩ X2) < Max (q(X1), q(X2)), q(X1 ∩ X2) = q(X1) + q(X2), q(X1 ∩ X2) > Max (q(X1), q(X2)) and q(X1 ∩ X2) > q(X1) + q(X2), respectively [29,30].
Descriptive statistics and paired t tests used to compare the differences in soil properties and CLQI in 2017 and 2020 were conducted in SPSS 21.0. Kriging interpolation and distribution maps were produced through Acrmap 10.6. Geodetector was run in R 4.1.2 software through the Geodetector package. All statistics were two-tailed, and a p value lower than 0.05 was considered significant.
3. Results and Discussion
3.1. Descriptive Statistics of Soil Properties and Cultivated Land Quality
Table 2 shows the general characteristics of the soil nutritional properties along with the mean CLQI in 2017 and 2020. The soil pH increased from 6.32 (range: 4.21–9.16) to 6.38 (range: 4.45–8.65), with a P value from the paired t test less than 0.01, indicating a significant improvement in soil acidity. Analogously, OM significantly improved from 29.07 g/kg (range: 1.91–66.96 g/kg) in 2017 to 31.54 g/kg (range: 5.66–67.26 g/kg) in 2020. However, AP and AK remained stable from 2017 to 2020, with mean AP contents of 37.58 mg/kg (range: 1.51–494.91 mg/kg) and 38.37 mg/kg (range: 1.20–460.80 mg/kg) in 2017 and 2020, respectively. In addition, for AK, the mean content was 133.07 mg/kg (range: 30.95–655.41 mg/kg) and 133.71 mg/kg (range: 24.00–731.00 mg/kg) in 2017 and 2020, respectively. As this is the most important food production base in Zhejiang Province, many efforts have been carried out to improve the cultivated land fertility in this area in recent years, such as increasing the application of organic fertilizer, popularizing soil testing, and formula fertilization, which has significantly improved the soil pH and SOM. In addition, due to intensive planting activities, the available nutrient content was in balance regarding the supply and demand; thus, AP and AK remained at a reasonable level [31,32]. Additionally, due to the significant improvement in pH and OM, which are important indicators of cultivated land quality, the CLQI showed significant improvement from 2017 (mean CLQI: 0.90) to 2020 (mean CLQI: 0.91).
Table 2.
Descriptive statistics of soil nutritional properties and cultivated land quality in 2017 and 2020.
Although the soil nutrient status in the study area has improved in recent years, there is still a large potential for improvement compared with the optimal nutrient level defined by the evaluation of cultivated land quality in the Yangtze Delta region [33]. Specifically, the mean pH values in 2017 and 2020 (6.32 and 6.38, respectively) were lower than the minimum value of the optimum. In addition, although the percentage of points with pH in the optimum range increased from 25.76% in 2017 to 33.41% in 2020, approximately 2/3 of the soil still needed to be improved, mainly in rice-planting acid soil regions across the study area and coastal alkaline soil regions (Figure 2). The mean OM values in 2017 and 2020 (29.07 g/kg and 31.54 g/kg, respectively) were also lower than the optimum value [33], and although the percentage of points with OM higher than the optimum value increased from 31.19% in 2017 to 38.91% in 2020, approximately 60% of the soil still had potential for improvements in OM, mainly in the central and northwestern parts of the study area (Figure 2). In addition, the mean AK values in 2017 and 2020 (133.07 mg/kg and 133.71 mg/kg, respectively) were also lower than the optimum value [33], and the percentage of points with AK higher than the optimum value revealed no significant differences between 2017 (28.75%) and 2020 (29.89%). Almost 70% of the soil had potential for improvements in AK throughout the study area (Figure 2). However, the mean AP values in 2017 and 2020 (37.58 mg/kg and 38.37 mg/kg, respectively) were higher than the optimum value, with no significant difference between years [33], whereas only 32.72% and 35.78% of the points had AP higher than the optimum value in 2017 and 2020, which indicated that the high average AP values were influenced by extremely high values (Table 2). Thus, there is potential to improve the AP content in approximately 2/3 of the soil distributed throughout the study area (Figure 2). It is necessary to further promote the corresponding technologies, such as the replacement of inorganic fertilizer by organic fertilizer, combination planting, and breeding for the improvement of soil fertility and crop yield [34,35].
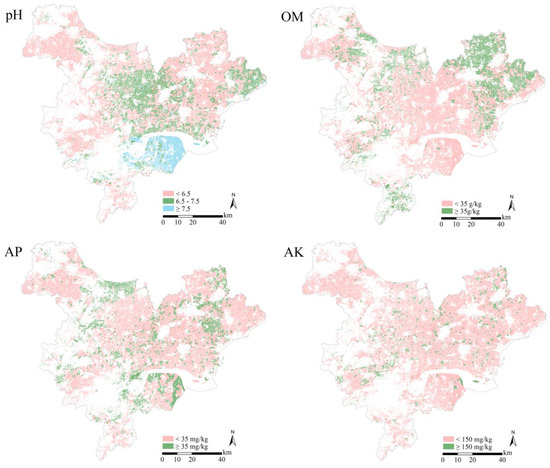
Figure 2.
The distribution of soil pH, OM (organic matter), AP (available phosphorus), and AK (available potassium) in 2020.
3.2. Spatial–Temporal Variation in Cultivated Land Quality
The average CLQI in the study area increased from 0.90 to 0.91 from 2017 to 2020, indicating that the overall quality of the cultivated land improved and was good. According to the grading of cultivated land quality (GB/T 33469-2016), ten levels of cultivated land quality were defined from high (first level) to low (tenth level) when CLQI ≥ 0.9170, 0.9170 > CLQI ≥ 0.8924, 0.8924 > CLQI ≥ 0.8678, 0.8678 > CLQI ≥ 0.8431, 0.8431 > CLQI ≥ 0.8185, 0.8185 > CLQI ≥ 0.7939, 0.7939 > CLQI ≥ 0.7693, 0.7693 > CLQI ≥ 0.7446, 0.7446 > CLQI ≥ 0.7200, CLQI < 0.7200), and 33.82% and 34.78% of the cultivated land was at the first level in 2017 and 2020, respectively. The second level accounted for 23.53% and 23.25% of the cultivated land in 2017 and 2020, respectively. Then, the third level accounted for 17.71% and 17.61% of the cultivated land in 2017 and 2020, respectively. The proportions of cultivated land area were 14.20%, 7.39%, 2.54%, 0.70%, 0.10%, and 0.01% for the fourth to ninth levels in 2017, respectively, and for 2020, the proportions for these levels were 13.99%, 6.50%, 3.00%, 0.78%, 0.09%, and 0.01%, respectively. The results indicated that overall, the cultivated land quality was at an appropriate level, with approximately 3/4 of the land within the first to third levels (defined as high-yielding fields [33]). These results are consistent with those from previous studies that have shown that due to the good conditions of climate, terrain, hydrology, and soil properties, the quality of cultivated land is relatively high [32,36,37].
The spatial distributions of the CLQI in 2020 and 2017 are shown in Figure 3A and Figure 3B, respectively. In general, the cultivated land quality showed a similar spatial pattern in the two years: i.e., relatively high in the north and northeast of the study area, while it was low in the south, west, and northwest of the study area. Combined with the soil nutrient property data, the relatively high OM content (above the optimum level) and suitable soil pH status (between 6.5 and 7.5) as depicted by green areas in Figure 2 were distributed in the northeastern and central parts of the study area, respectively, and led to the high cultivated land quality in these regions. However, in the southern part of the study area, especially in the coastal area, the soil was alkaline, and the OM content was relatively low, resulting in the low quality of cultivated land in this area. Additionally, the soil was acidic, and the OM content was relatively low in the western and northwestern areas, leading to the relatively low quality of cultivated land in these areas. In summary, in the southern, western, and northwestern areas with relatively low cultivated land quality, the soil pH and OM need to be improved. In addition, there were no significant cluster characteristics of AP and AK, so increasing the soil available nutrients, especially AK, could also improve the quality of cultivated land in the study area [13,22].
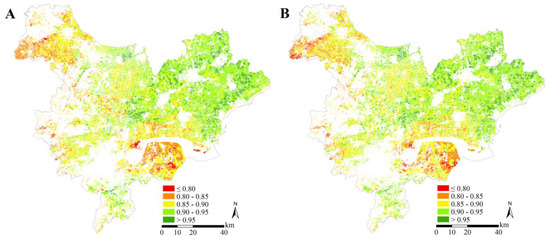
Figure 3.
The distribution of cultivated land quality in 2020 (A) and 2017 (B).
To illustrate the spatial and temporal variation in cultivated land quality, the differences between the CLQI in 2020 and 2017 are shown in Figure 4. In terms of spatial and temporal variability, 22.40% of the cultivated land quality showed a decreasing trend, mainly in the south-central coastal, west-central, and northwestern regions. In addition, although the cultivated land quality showed a general increasing trend in the northeastern and central areas, there were also scattered distributed areas that revealed decreasing quality. A detailed exploration of the influential factors of cultivated land quality variation in the space–time domain is discussed in the next section.
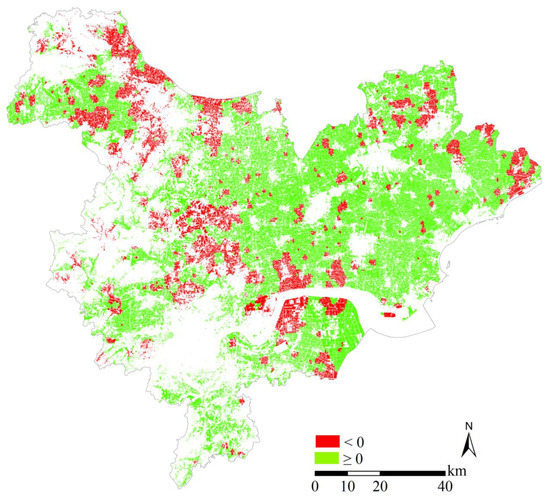
Figure 4.
The variation in the cultivated land quality index from 2017 to 2020.
3.3. Detection of Factors Affecting Cultivated Land Quality Changes
Based on the Geodetector model, the impact of sixteen factors that may affect the variation in cultivated land quality were assessed quantitatively through the q-statistics, and the results are shown in Table 3. In general, the variation in cultivated land quality in this research area was influenced by the studied factors, in the decreasing order of q values as SOMV (0.22) > APV (0.21) > AKV (0.17) > pHV (0.08) > STE (0.03) = PIO (0.03) > AAP (0.02) = AAT (0.02) = GDP (0.02) = PIO (0.02) > SPM (0.01) = ST (0.01) = EL (0.01) = TIO (0.01) > SL (less than 0.01) = LULC (less than 0.01). The study area is located in the lower reaches of the Yangtze River, where the main landform is a plain, and the topography is relatively consistent across the study area [38]. Moreover, this area is mainly used for rice planting (paddy field), and the soil type is dominated by paddy soil developed from sedimentary and alluvial parent materials [22,23,39]. Hence, topographic factors (EL, SL, and LULC) as well as the soil type and soil parent material variation revealed no significant influence on the variation in the cultivated land quality.
Table 3.
The q-statistics of each factor related to the cultivated land quality variation.
In addition, although significant, the climate factors (AAP and AAT) and socioeconomic factors (GDP, PIO, SIO, TIO) as well as the STE showed relatively low explanatory ability for the change in the cultivated land quality. The q-statistics for these factors were no higher than 0.03. The climate conditions in the study area are generally suitable for rice growth, with abundant sunshine and precipitation [39,40]. Therefore, although the q values for AAP and AAT were still significant, their values were relatively low. On the other hand, with the implementation of China’s strict cultivated land protection policies in recent years [6,32], the impacts of human disturbances such as industrialization and urbanization might be diminished, expressed as the low q value of the socioeconomic factors for the variation in CLQI.
The variation in SOM had the highest significant q value (0.22) for the variation in cultivated land quality during the study period (Table 3). In addition, according to the risk results of Geodetector, the growth rate of CLQI increased in accordance with the increase in SOMV (the variation in CLQI increased from 0.017 to 0.055 with the increase in SOMV). This result is consistent with that of previous studies, indicating that SOM is one of the significant indicators of soil quality [41,42,43]. APV also showed a high q value (0.21) for the variation in CLQI, followed by AKV, whose q value was 0.17 (Table 3). Phosphorus and potassium are the primary macronutrients in soil and are essential for maintaining soil fertility, plant growth, and agricultural productivity [44,45]. AP and AK in soil are related to the application of phosphorous/potassium-rich fertilizers during planting, and as plants take up large quantities of AP/AK during their life cycle [46], although the increases in AP and AK in soil were not significant from 2017 to 2020 (Table 2), their variation in soil revealed a direct and significant influence on the cultivated land quality. In addition, pHV showed a significant and moderate q value (0.08) for CLQI variation. Although pH is one of the inherent functional components for evaluating the quality of soil [28,47], as the regional climate, topography, and soil conditions are relatively consistent, pHV had less impact on cultivated land quality in local soils.
The variation in cultivated land quality could not be explained by a single factor, i.e., its variation in the space–time domain is the result of the interaction of many factors. There are often synergistic or antagonistic effects between various influential factors [48]. Thus, the interaction detector in the Geodetecor model was further applied to assess the interaction effects of the influential factors, and the results are shown in Table 4. Except for a couple of factor pairs (SOMV and APV; APV and AKV, pHV and APV, pHV and AKV, EL and AKV, TIO and SIO, LULC and SIO, TIO and SL, LULC and SL) that revealed bidirectional enhancements (i.e., q(X1 ∩ X2) > Max (q(X1), q(X2)), the interactions between other factors all showed nonlinear enhancement (i.e., q(X1 ∩ X2) > q(X1) + q(X2)). The results indicated that although individual factors had limited effects, when they interacted, a significant increase in the explanatory ability for cultivated land quality occurred, especially for the interaction of SOMV and APV, which explained 41% of the CLQI variation.
Table 4.
The interaction effects between factors on cultivated land quality variation.
Based on the above results, it could be concluded that, although the cultivated land quality in this area was maintained at a relatively suitable level, an improvement in SOM and available nutrients (including AP and AK) still has great potential to enhance the cultivated land quality, especially in the central and northwestern regions where SOM was observed to be relatively low and the regions across the research area with deficient available nutrients (AP and AK). In addition, in rice-planting acid soil regions across the study area and coastal alkaline soil regions, the improvement in soil pH can also improve the quality of cultivated land.
4. Conclusions
This study analyzed the spatial-temporal variation in cultivated land quality along with the soil nutritional properties. Moreover, the main factors influencing the variation in cultivated land quality as well as the interaction effects of the factors were explored using the Geodetector model. The results showed the following:
(a) In general, the cultivated land quality, SOM, and pH significantly improved from 2017–2020, whereas the variations in AP and AK were nonsignificant. In addition, although the soil nutrient status improved in recent years, more than 60% of the cultivated land in the study area still revealed potential for further improvement.
(b) The cultivated land quality is generally suitable; approximately 3/4 of the land in the study area was defined as high-yielding fields. In addition, the CLQI showed a similar spatial pattern between 2017 and 2020, where high CLQI values were distributed in the northern and northeastern regions, while low CLQI values were located in the southern, western, and northwestern regions of the study area. In terms of spatial and temporal variability, more than 75% of the cultivated land quality showed an increasing trend that was mainly located in the northeastern and central areas.
(c) The climate, topography, and socioeconomic factors had little influence on the change in cultivated land quality, whereas SOMV, APV, and AKV revealed high q values for CLQI variation. In addition, when factors interacted, a significant increase in the explanatory ability for CLQI occurred, especially for the interaction of SOMV and APV, which explained 41% of the CLQI variation, indicating that further improvement of SOM and available nutrients (including AP and AK) still has great potential to enhance the cultivated land quality, especially in areas deficient in nutrients.
The results will be useful for cultivated land quality monitoring and improvement by clarifying the variations in CLQI and its main influential factors in the lower reaches of the Yangtze River, China.
Author Contributions
Conceptualization, Z.W. and M.S.; methodology, Z.W. and X.F.; validation, X.F. and R.X.; formal analysis, Z.W. and X.F.; investigation, R.X.; resources, M.S.; data curation, Z.W. and R.X.; writing—original draft preparation, Z.W.; writing—review and editing, M.S.; visualization, R.X.; supervision, M.S.; project administration, X.F.; funding acquisition, R.X. All authors have read and agreed to the published version of the manuscript.
Funding
This research was funded by the National Natural Science Foundation of China Major Program (Grant No. 42192580 and 42192583) and Key Laboratory of National Geographic Census and Monitoring, Ministry of Nature Resources (Grant No. 2022NGCMZD03).
Institutional Review Board Statement
Not applicable.
Informed Consent Statement
Not applicable.
Data Availability Statement
Not applicable.
Conflicts of Interest
The authors declare no conflict of interest.
References
- Foley, J.A.; Ramankutty, N.; Brauman, K.A.; Cassidy, E.S.; Gerber, J.S.; Johnston, M.; Mueller, N.D.; O’Connell, C.; Ray, D.K.; West, P.C. Solutions for a cultivated planet. Nature 2011, 478, 337–342. [Google Scholar] [CrossRef] [PubMed]
- Tan, Y.; Chen, H.; Lian, K.; Yu, Z. Comprehensive evaluation of cultivated land quality at county scale: A case study of Shengzhou, Zhejiang Province, China. Int. J. Env. Res. Pub. He. 2020, 17, 1169. [Google Scholar] [CrossRef] [PubMed]
- Yang, X. China’s rapid urbanization. Science 2013, 342, 310. [Google Scholar] [CrossRef] [PubMed]
- Kuang, W.; Liu, J.; Dong, J.; Chi, W.; Zhang, C. The rapid and massive urban and industrial land expansions in China between 1990 and 2010: A CLUD-based analysis of their trajectories, patterns, and drivers. Landsc. Urban Plan. 2016, 145, 21–33. [Google Scholar] [CrossRef]
- Li, T.; Long, H.; Zhang, Y.; Tu, S.; Ge, D.; Li, Y.; Hu, B. Analysis of the spatial mismatch of grain production and farmland resources in China based on the potential crop rotation system. Land Use Policy 2017, 60, 26–36. [Google Scholar] [CrossRef]
- Zhao, R.; Wu, K.; Zhang, X. Evaluation of Farmland Health Productivity in Main Grain Producing Areas: A Case Study in Wen County of Henan Province. China Land Sci. 2019, 33, 67–75. [Google Scholar]
- Sheng, Y.; Liu, W.; Xu, H.; Gao, X. The Spatial Distribution Characteristics of the Cultivated Land Quality in the Diluvial Fan Terrain of the Arid Region: A Case Study of Jimsar County, Xinjiang, China. Land 2021, 10, 896. [Google Scholar] [CrossRef]
- Shen, R.; Wang, C.; Sun, B. Soil Related Scientific and Technological Problems in Implementing Strategy of “Storing Grain in Land and Technology”. Bull. Chin. Acad. Sci. 2018, 33, 135–144. [Google Scholar]
- Zhao, C.; Zhou, Y.; Jiang, J.; Xiao, P.; Wu, H. Spatial characteristics of cultivated land quality accounting for ecological environmental condition: A case study in hilly area of northern Hubei province, China. Sci. Total Environ. 2021, 774, 145765. [Google Scholar] [CrossRef]
- Liu, L.; Zhou, D.; Chang, X.; Lin, Z. A new grading system for evaluating China’s cultivated land quality. Land Degrad. Dev. 2020, 31, 1482–1501. [Google Scholar] [CrossRef]
- Nael, M.; Khademi, H.; Hajabbasi, M.A. Response of soil quality indicators and their spatial variability to land degradation in central Iran. Appl. Soil Ecol. 2004, 27, 221–232. [Google Scholar] [CrossRef]
- Kiani, M.; Hernandez-Ramirez, G.; Quideau, S.A.M. Spatial variation of soil quality indicators as a function of land use and topography. Can. J. Soil Sci. 2020, 100, 463–478. [Google Scholar] [CrossRef]
- Fei, X.; Xiao, R.; Christakos, G.; Langousis, A.; Ren, Z.; Tian, Y.; Lv, X. Comprehensive assessment and source apportionment of heavy metals in Shanghai agricultural soils with different fertility levels. Ecol. Indicat. 2019, 106, 105508. [Google Scholar] [CrossRef]
- Yang, Y.; Christakos, G.; Guo, M.; Xiao, L.; Huang, W. Space-time quantitative source apportionment of soil heavy metal concentration increments. Environ. Pollut. 2017, 223, 560–566. [Google Scholar] [CrossRef]
- Huang, S.; Tu, J.; Jin, Y.; Hua, M.; Wu, X.; Xu, W.W.; Yang, Y.; Wang, H.; Su, Y.; Cai, L. Contamination assessment and source identification of heavy metals in River Sediments in Nantong, Eastern China. Int. J. Environ. Res. 2018, 12, 373–389. [Google Scholar] [CrossRef]
- Ren, Z.; Christakos, G.; Lou, Z.; Xu, H.; Lv, X.; Fei, X. Contamination Assessment and Source Apportionment of Metals and Metalloids Pollution in Agricultural Soil: A Comparison of the APCA-MLR and APCA-GWR Models. Sustainability 2022, 14, 783. [Google Scholar] [CrossRef]
- Akinyemi, F.O.; Speranza, C.I. Agricultural landscape change impact on the quality of land: An African continent-wide assessment in gained and displaced agricultural lands. Int. J. Appl. Earth. Obs. 2022, 106, 102644. [Google Scholar] [CrossRef]
- Yuan, X.; Shao, Y.; Wei, X.; Hou, R.; Ying, Y.; Zhao, Y. Study on the potential of cultivated land quality improvement based on a geological detector. Geol J. 2018, 53, 387–397. [Google Scholar] [CrossRef]
- Wang, J.; Li, X.; Christakos, G.; Liao, Y.; Zhang, T.; Gu, X.; Zheng, X. Geographical detectors-based health risk assessment and its application in the neural tube defects study of the Heshun Region, China. Int. J. Geogr. Inf. Sci. 2010, 24, 107–127. [Google Scholar] [CrossRef]
- Cao, F.; Ge, Y.; Wang, J. Optimal discretization for geographical detectors-based risk assessment. Gisci. Remote Sens. 2013, 50, 78–92. [Google Scholar] [CrossRef]
- Qiao, P.; Yang, S.; Lei, M.; Chen, T.; Dong, N. Quantitative analysis of the factors influencing spatial distribution of soil heavy metals based on geographical detector. Sci. Total Environ. 2019, 664, 392–413. [Google Scholar] [CrossRef]
- Ren, Y.; Lin, M.; Liu, Q.; Zhang, Z.; Fei, X.; Xiao, R.; Lv, X. Contamination assessment, health risk evaluation, and source identification of heavy metals in the soil-rice system of typical agricultural regions on the southeast coast of China. Environ. Sci. Pollut. R. 2021, 28, 12870–12880. [Google Scholar] [CrossRef] [PubMed]
- Fei, X.; Lou, Z.; Xiao, R.; Ren, Z.; Lv, X. Estimating the spatial distribution of soil available trace elements by combining auxiliary soil property data through the Bayesian maximum entropy technique. Stoch. Environ. Res. Risk Assess. 2022, 36, 2015–2026. [Google Scholar] [CrossRef]
- Olea, R.A. A six-step practical approach to semivariogram modeling. Stoch. Environ. Res. Risk Assess. 2006, 20, 307–318. [Google Scholar] [CrossRef]
- Zhuo, Z.; Xing, A.; Li, Y.; Huang, Y.; Nie, C. Spatio-temporal variability and the factors influencing soil-available heavy metal micronutrients in different agricultural sub-catchments. Sustainability 2019, 11, 5912. [Google Scholar] [CrossRef]
- Liu, H.; Zhang, Y.; Zhou, X.; You, X.; Shi, Y.; Xu, J. Source identification and spatial distribution of heavy metals in tobacco growing soils in Shandong province of China with multivariate and geostatistical analysis. Environ. Sci. Pollut. R. 2017, 24, 5964–5975. [Google Scholar] [CrossRef] [PubMed]
- Lv, X.; Ni, Z. Soil Resources and Cultivated Land Quality Atlas of Zhejiang; Harbin Map Press: Harbin, China, 2013. [Google Scholar]
- Khan, J.; Singh, R.; Upreti, P.; Yadav, R.K. Geo-statistical assessment of soil quality and identification of Heavy metal contamination using Integrated GIS and Multivariate statistical analysis in Industrial region of Western India. Environ. Technol. Innov. 2022, 28, 102646. [Google Scholar] [CrossRef]
- Wang, J.; Xu, C. Geodetector: Principle and prospective. Acta Geograph. Sin. 2017, 1, 116–134. [Google Scholar]
- Wang, H.; Gao, J.; Hou, W. Quantitative attribution analysis of soil erosion in different geomorphological types in karst areas: Based on the geodetector method. J. Geogr. Sci. 2019, 29, 271–286. [Google Scholar] [CrossRef]
- Xiao, R.; Liu, Y.; Fei, X.; Yu, W.; Zhang, Z.; Meng, Q. Ecosystem health assessment: A comprehensive and detailed analysis of the case study in coastal metropolitan region, eastern China. Ecol. Indicat. 2019, 98, 363–376. [Google Scholar] [CrossRef]
- Fei, X.; Lou, Z.; Xiao, R.; Ren, Z.; Lv, X. Source analysis and source-oriented risk assessment of heavy metal pollution in agricultural soils of different cultivated land qualities. J. Clean. Prod. 2022, 341, 130942. [Google Scholar] [CrossRef]
- Cultivated Land Quality Monitoring and Protection Center, Ministry of Agriculture and Rural Affairs, PRC. Changsanjiao Gengdi Zhiliang Pingjia; China Agriculture Press: Beijing, China, 2018. [Google Scholar]
- Zhang, L.; Zhou, L.; Wei, J.; Cheng, X.; Xu, H.; Xiao, Z.; Tang, Q.; Tang, J. Effects of rice planting combined with chicken raising in winter on double-cropping rice growth and soil fertility. Chin. J. Rice Sci. 2018, 32, 226–236. [Google Scholar]
- Liu, J.; Shu, A.; Song, W.; Shi, W.; Li, M.; Zhang, W.; Li, Z.; Liu, G.; Yuan, F.; Zhang, S.; et al. Long-term organic fertilizer substitution increases rice yield by improving soil properties and regulating soil bacteria. Geoderma 2021, 404, 115287. [Google Scholar] [CrossRef]
- Liqun, X.; Wei, C.; Qun, W. Impact of cultivated land quantity change on grain productive capacity of Yangtze River delta in the next 10 years: From the perspective of cultivated land quality grade. J. Nat. Resour. 2012, 27, 565–576. [Google Scholar]
- Li, X.; Yu, M.; Ma, J.; Luo, Z.; Chen, F.; Yang, Y. Identifying the relationship between soil properties and rice growth for improving consolidated land in the Yangtze River Delta, China. Sustainability 2018, 10, 3072. [Google Scholar] [CrossRef]
- Su, S.; Jiang, Z.; Zhang, Q.; Zhang, Y. Transformation of agricultural landscapes under rapid urbanization: A threat to sustainability in Hang-Jia-Hu region, China. Appl. Geogr. 2011, 31, 439–449. [Google Scholar] [CrossRef]
- Song, J.; Cai, D.; Deng, J.; Wang, K.; Shen, Z. Dynamics of paddy field patterns in response to urbanization: A case study of the Hang-Jia-Hu Plain. Sustainability 2015, 7, 13813–13835. [Google Scholar] [CrossRef]
- Zhang, M.; Du, H.; Zhou, G.; Li, X.; Mao, F.; Dong, L. Estimating forest aboveground carbon storage in Hang-Jia-Hu using landsat TM/OLI data and random forest model. Forests 2019, 10, 1004. [Google Scholar] [CrossRef]
- Filep, T.; Draskovits, E.; Szabó, J.; Koós, S.; László, P.; Szalai, Z. The dissolved organic matter as a potential soil quality indicator in arable soils of Hungary. Environ. Monit. Assess. 2015, 187, 479. [Google Scholar] [CrossRef]
- Sequeira, C.H.; Alley, M.M. Soil organic matter fractions as indices of soil quality changes. Soil Sci. Soc. Am. J. 2011, 75, 1766–1773. [Google Scholar] [CrossRef]
- Pulido-Moncada, M.; Lozano, Z.; Delgado, M.; Dumon, M.; Van Ranst, E.; Lobo, D.; Gabriels, D.; Cornelis, W.M. Using soil organic matter fractions as indicators of soil physical quality. Soil Use Manag. 2018, 34, 187–196. [Google Scholar] [CrossRef]
- Malhotra, H.; Sharma, S.; Pandey, R. Phosphorus nutrition: Plant growth in response to deficiency and excess. In Plant Nutrients and Abiotic Stress Tolerance; Hasanuzzaman, M., Fujita, M., Oku, H., Nahar, K., Hawrylak-Nowak, B., Eds.; Springer: Berlin/Heidelberg, Germany, 2018. [Google Scholar]
- Zörb, C.; Senbayram, M.; Peiter, E. Potassium in agriculture—Status and perspectives. J. Plant Physiol. 2014, 171, 656–669. [Google Scholar] [CrossRef]
- Morgan, J.B.; Connolly, E.L. Plant-soil interactions: Nutrient uptake learn science at scitable. Nat. Educ. Knowl. 2013, 4, 2. [Google Scholar]
- Filip, Z. International approach to assessing soil quality by ecologically-related biological parameters. Agric. Ecosyst. Environ. 2002, 88, 169–174. [Google Scholar] [CrossRef]
- Qiao, Y.; Wang, X.; Han, Z.; Tian, M.; Wang, Q.; Wu, H.; Liu, F. Geodetector based identification of influencing factors on spatial distribution patterns of heavy metals in soil: A case in the upper reaches of the Yangtze River, China. Appl. Geochem. 2022, 146, 105459. [Google Scholar] [CrossRef]


Disclaimer/Publisher’s Note: The statements, opinions and data contained in all publications are solely those of the individual author(s) and contributor(s) and not of MDPI and/or the editor(s). MDPI and/or the editor(s) disclaim responsibility for any injury to people or property resulting from any ideas, methods, instructions or products referred to in the content. |
© 2023 by the authors. Licensee MDPI, Basel, Switzerland. This article is an open access article distributed under the terms and conditions of the Creative Commons Attribution (CC BY) license (https://creativecommons.org/licenses/by/4.0/).