


Exploring the Spatial Heterogeneity and Influence Factors of Daily Travel Carbon Emissions in Metropolitan Areas: From the Perspective of the 15-min City

Abstract
1. Introduction
2. Literature Review
2.1. 15-min City and 15-min Pedestrian-Scale Neighborhood
2.2. Built Environment and Travel Carbon Emissions
2.3. Research Gaps
3. Materials and Methods
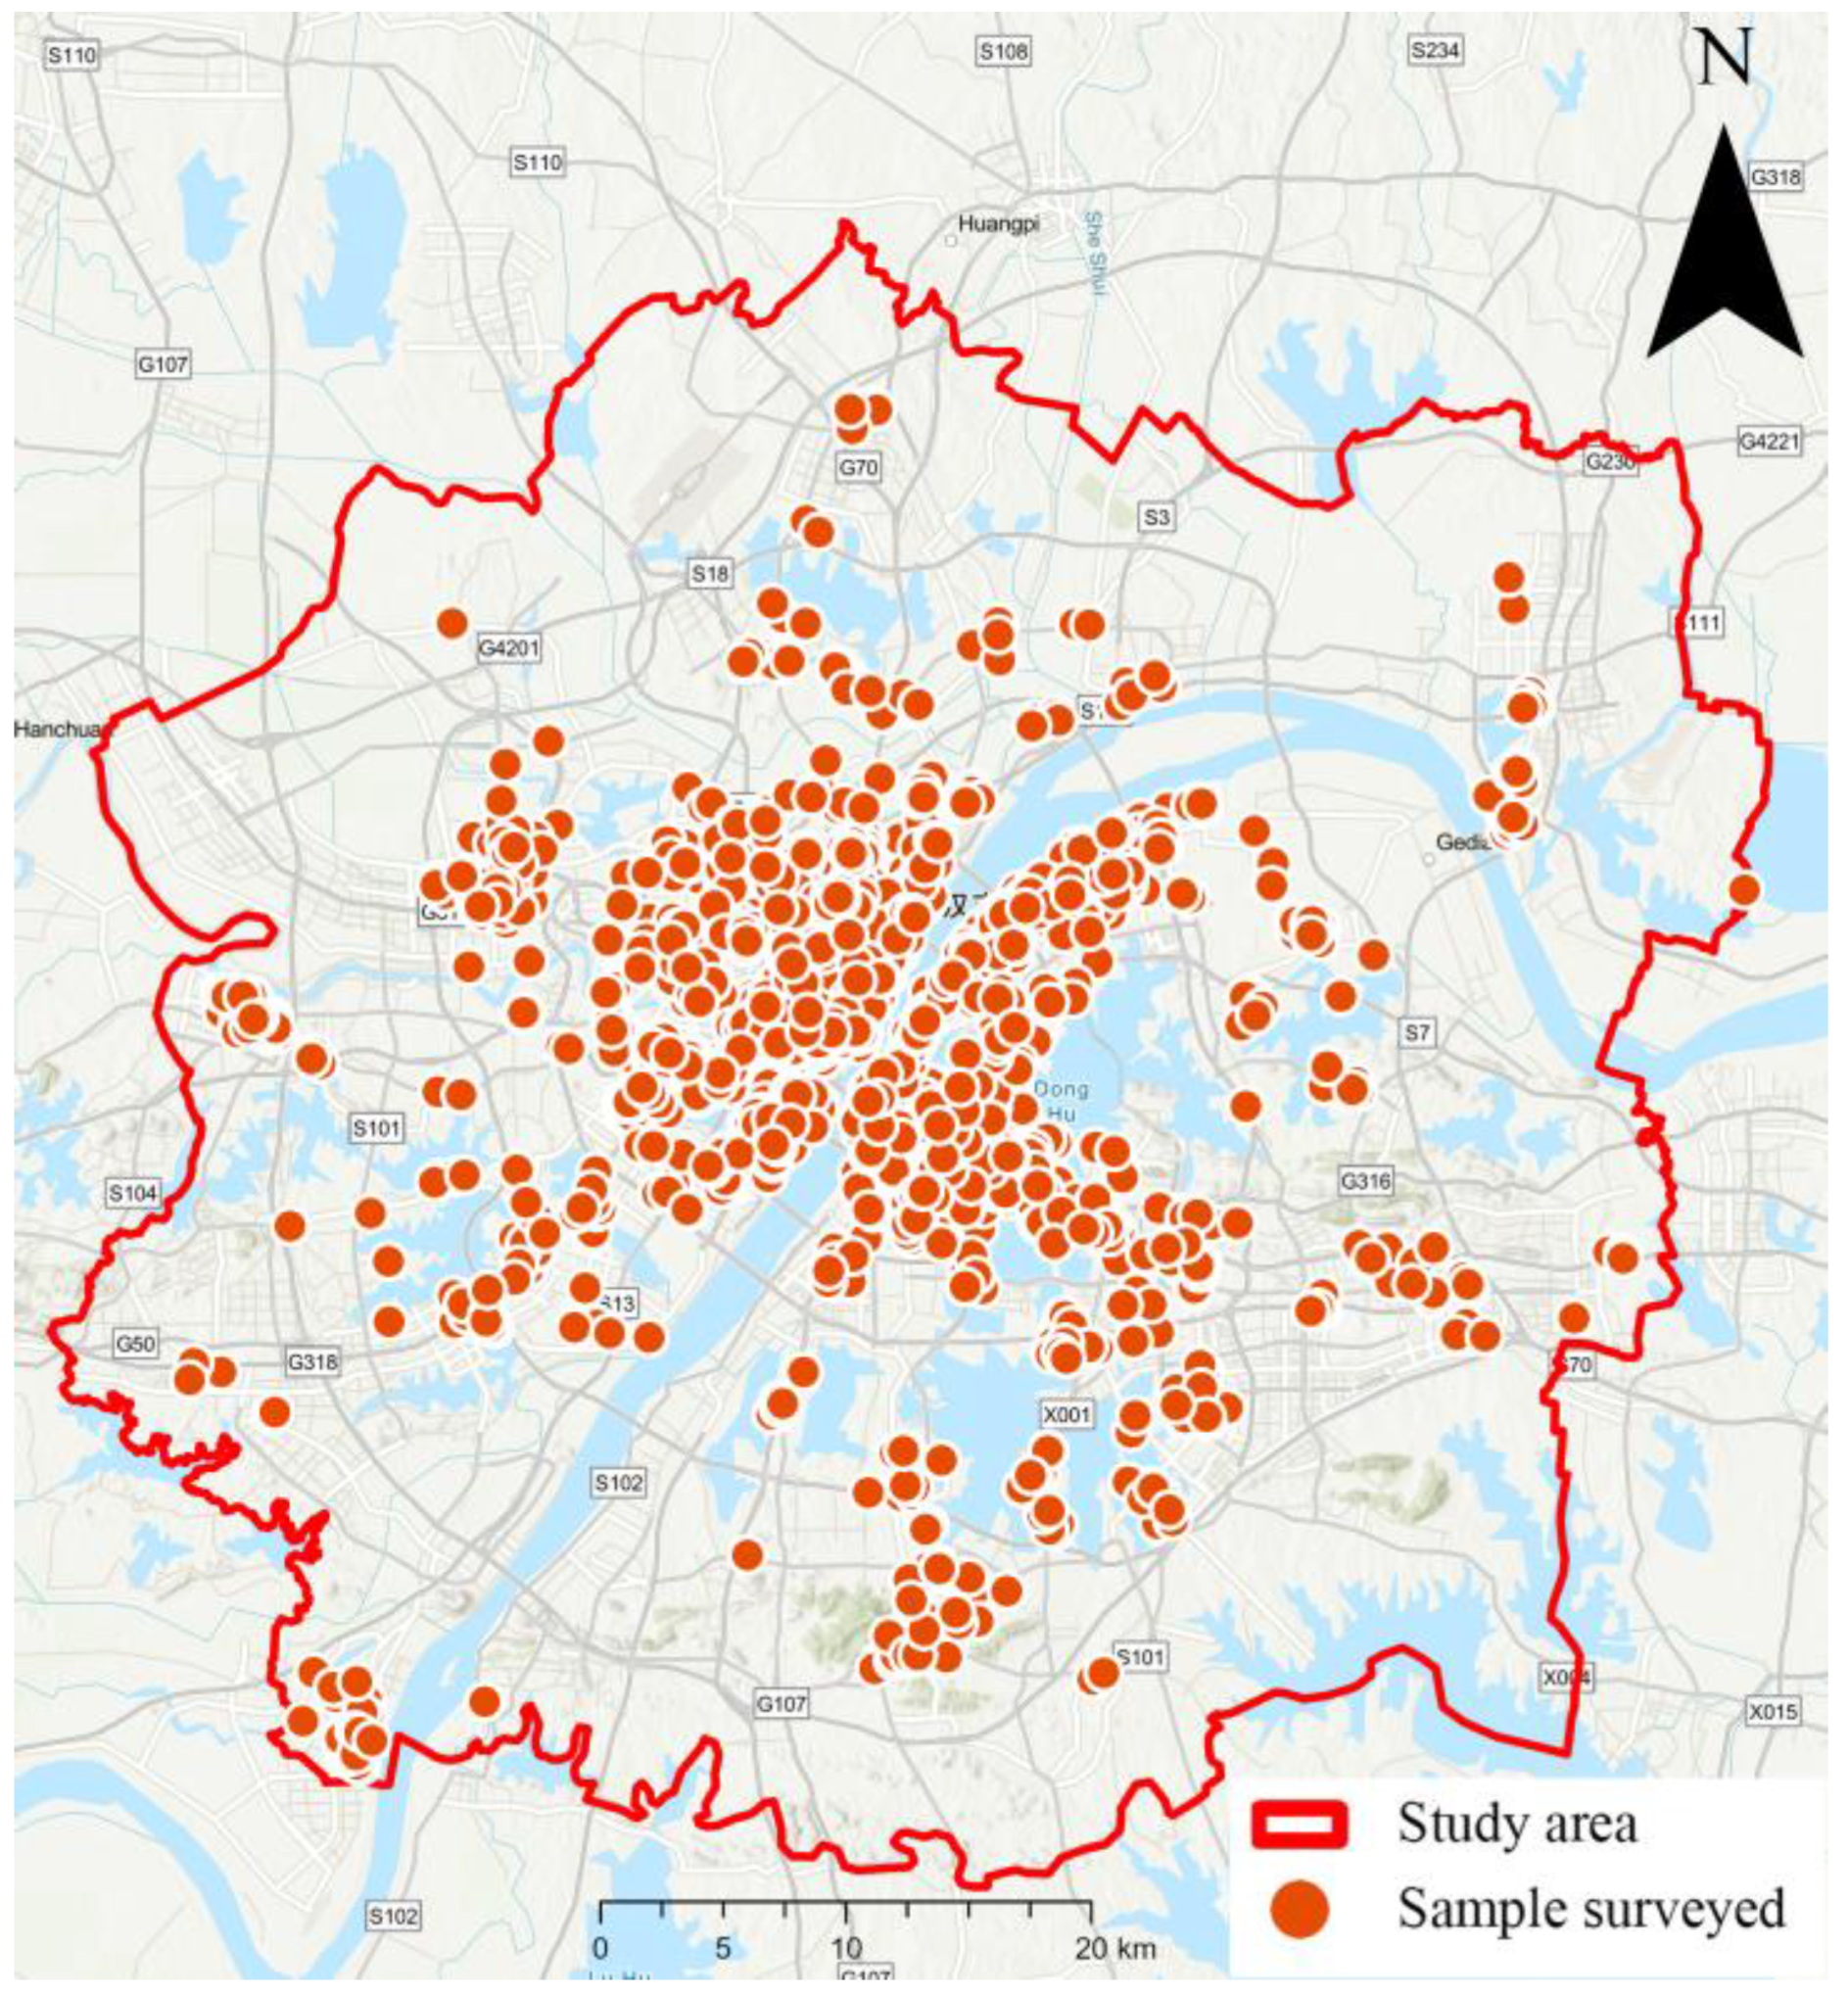
3.1. Research Area and Data Source
3.2. Variables
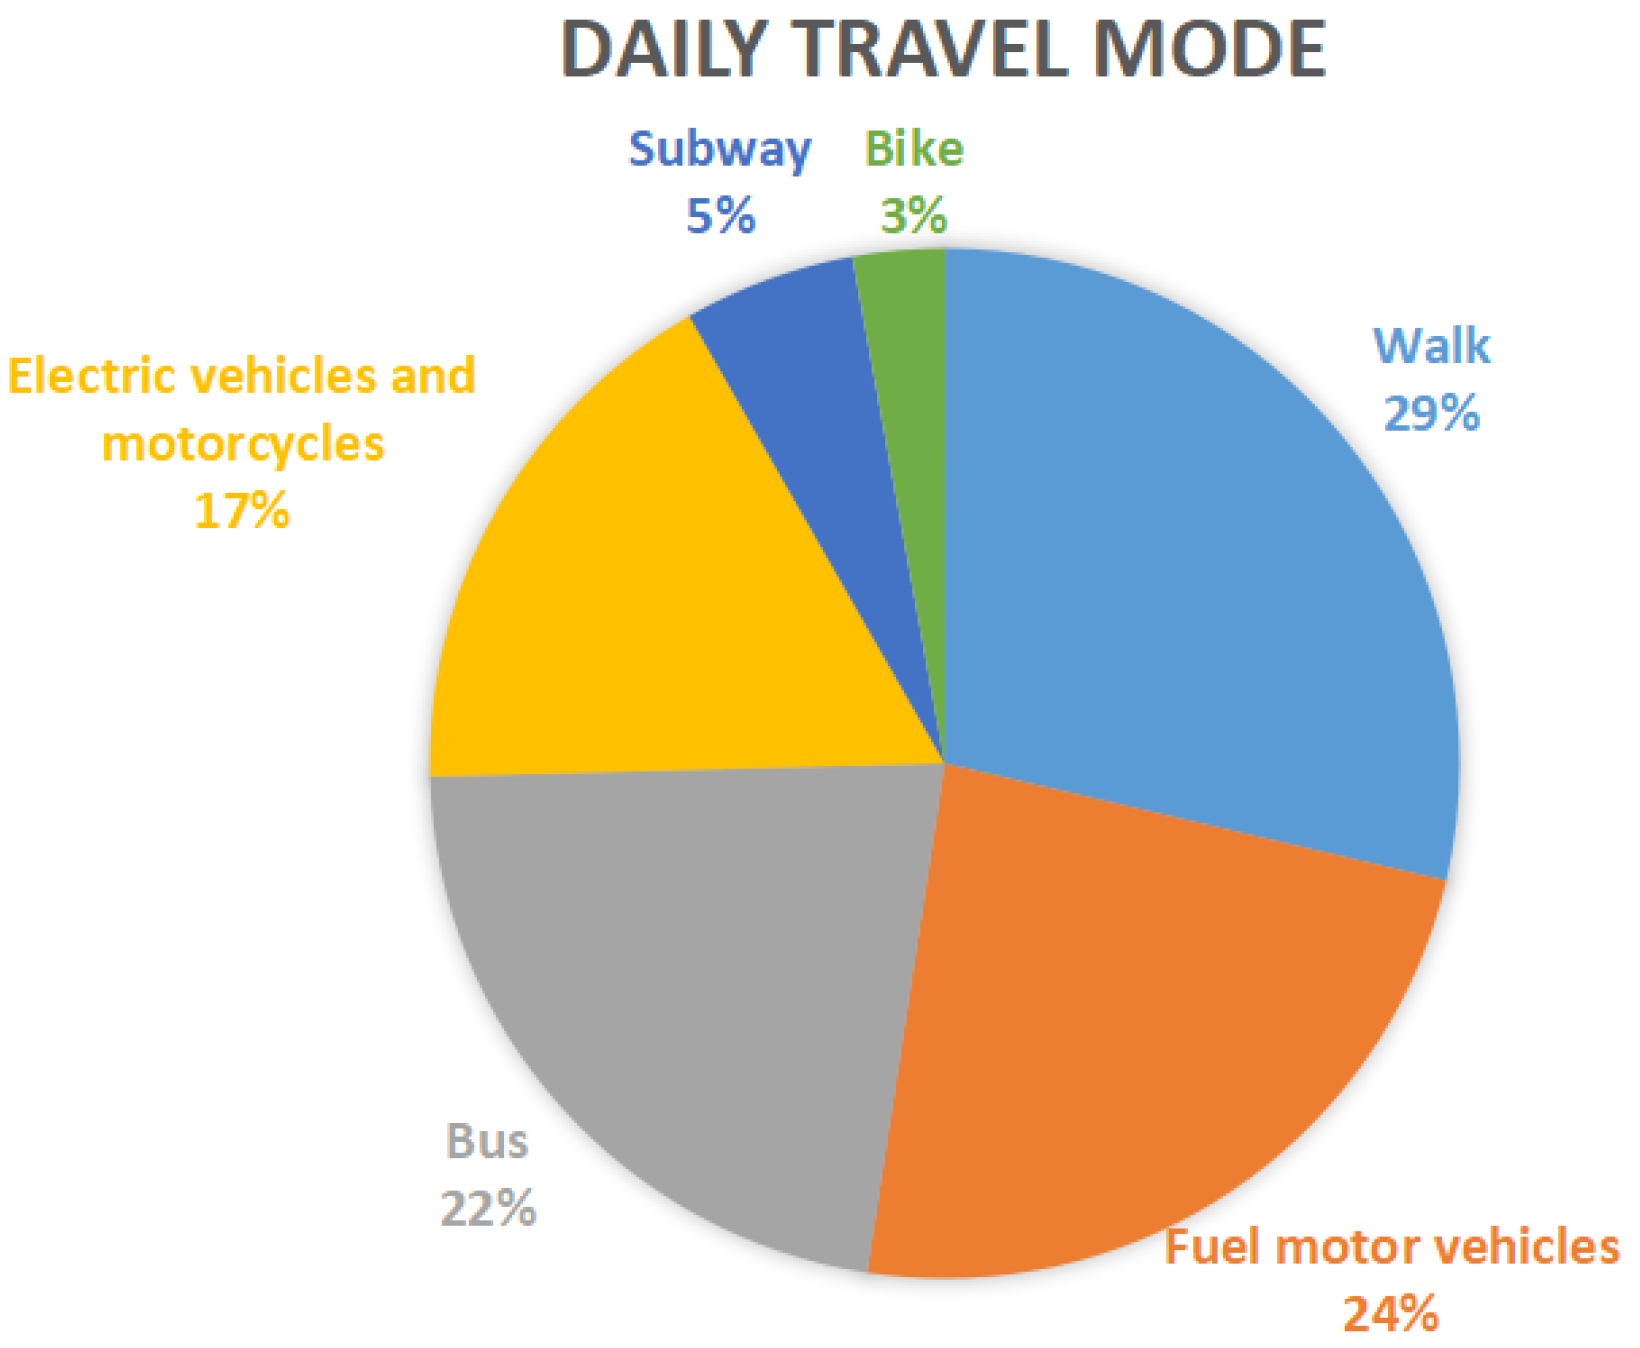
3.2.1. Residents’ Daily Travel Carbon Emissions
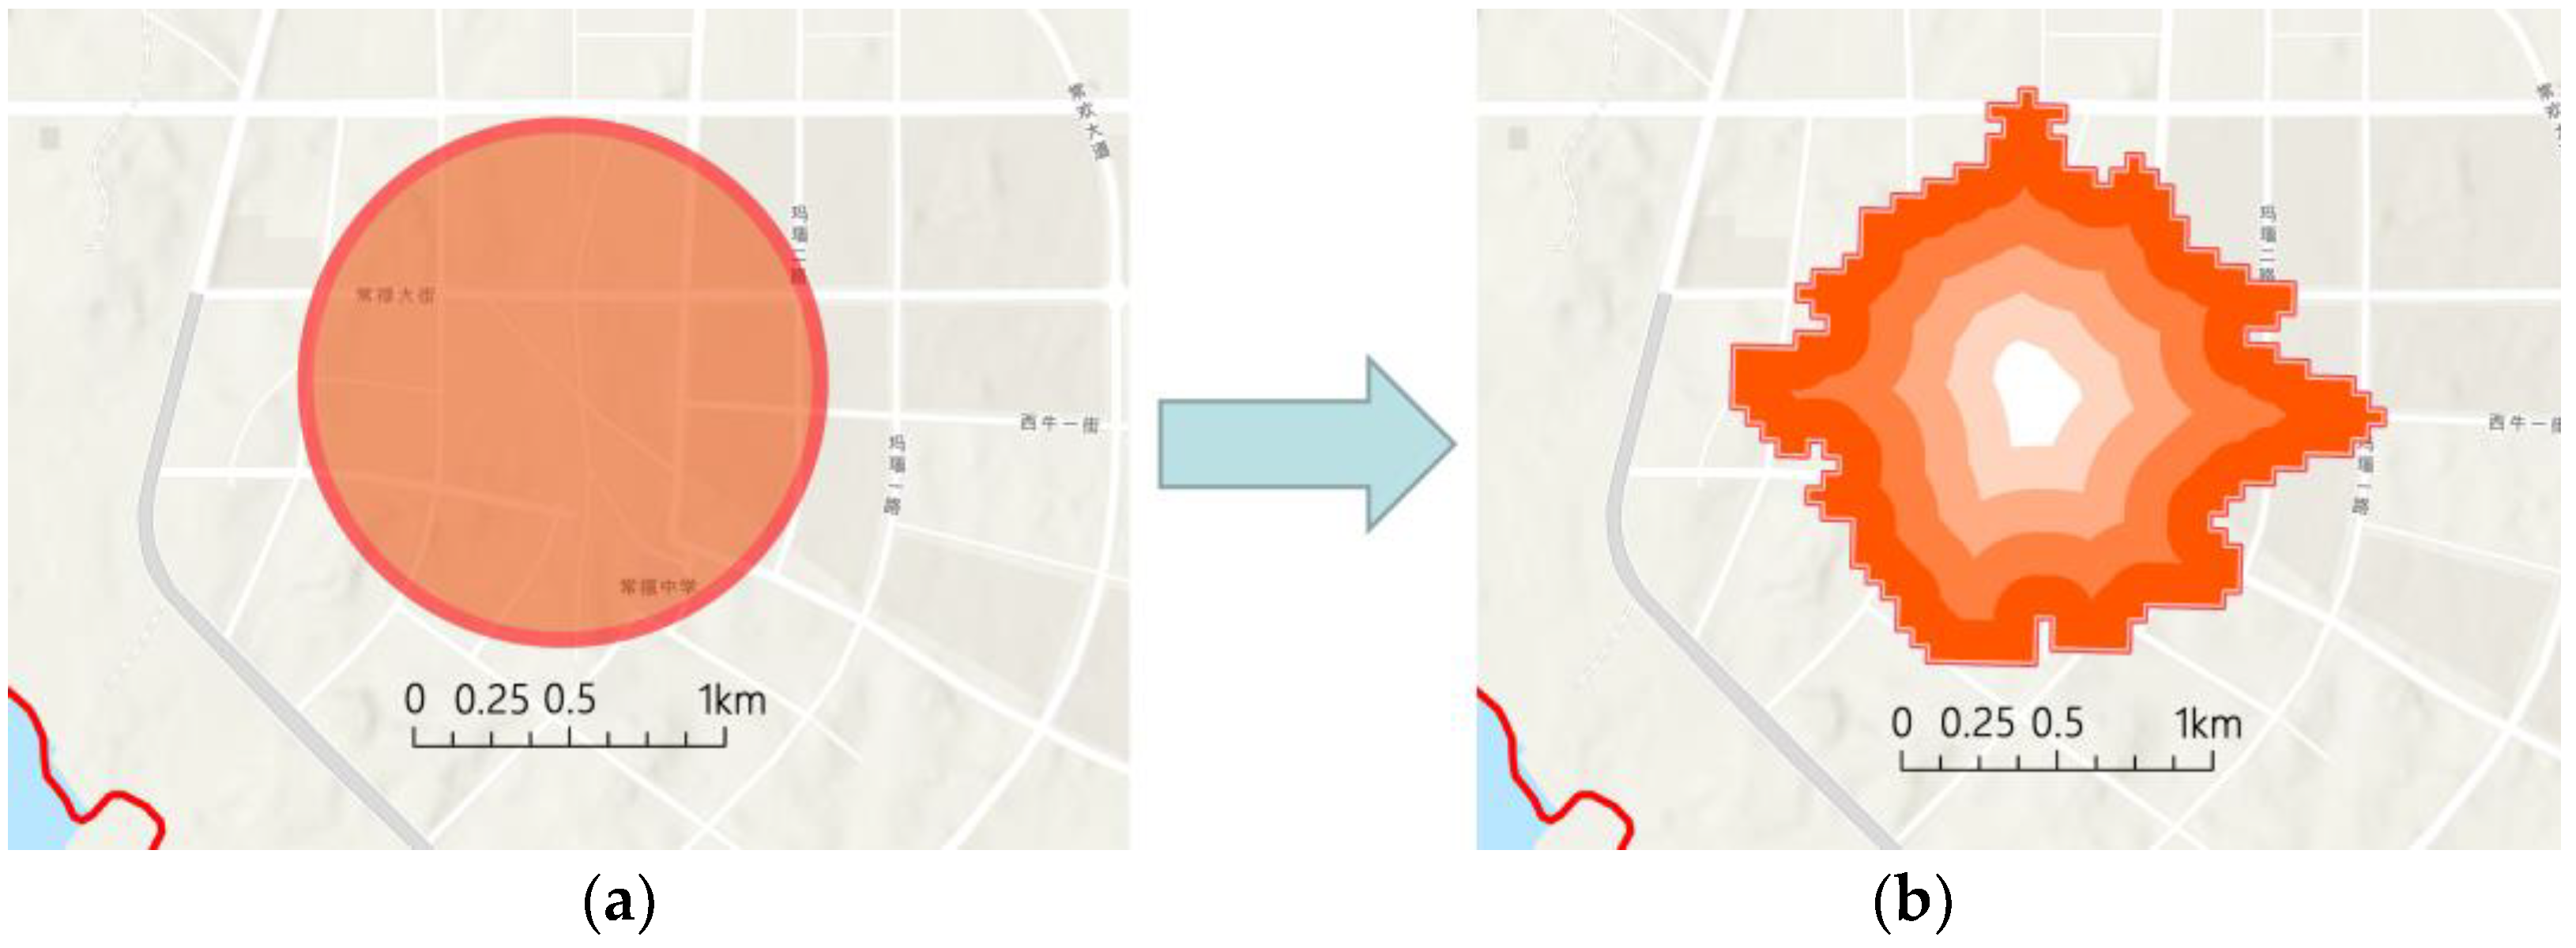
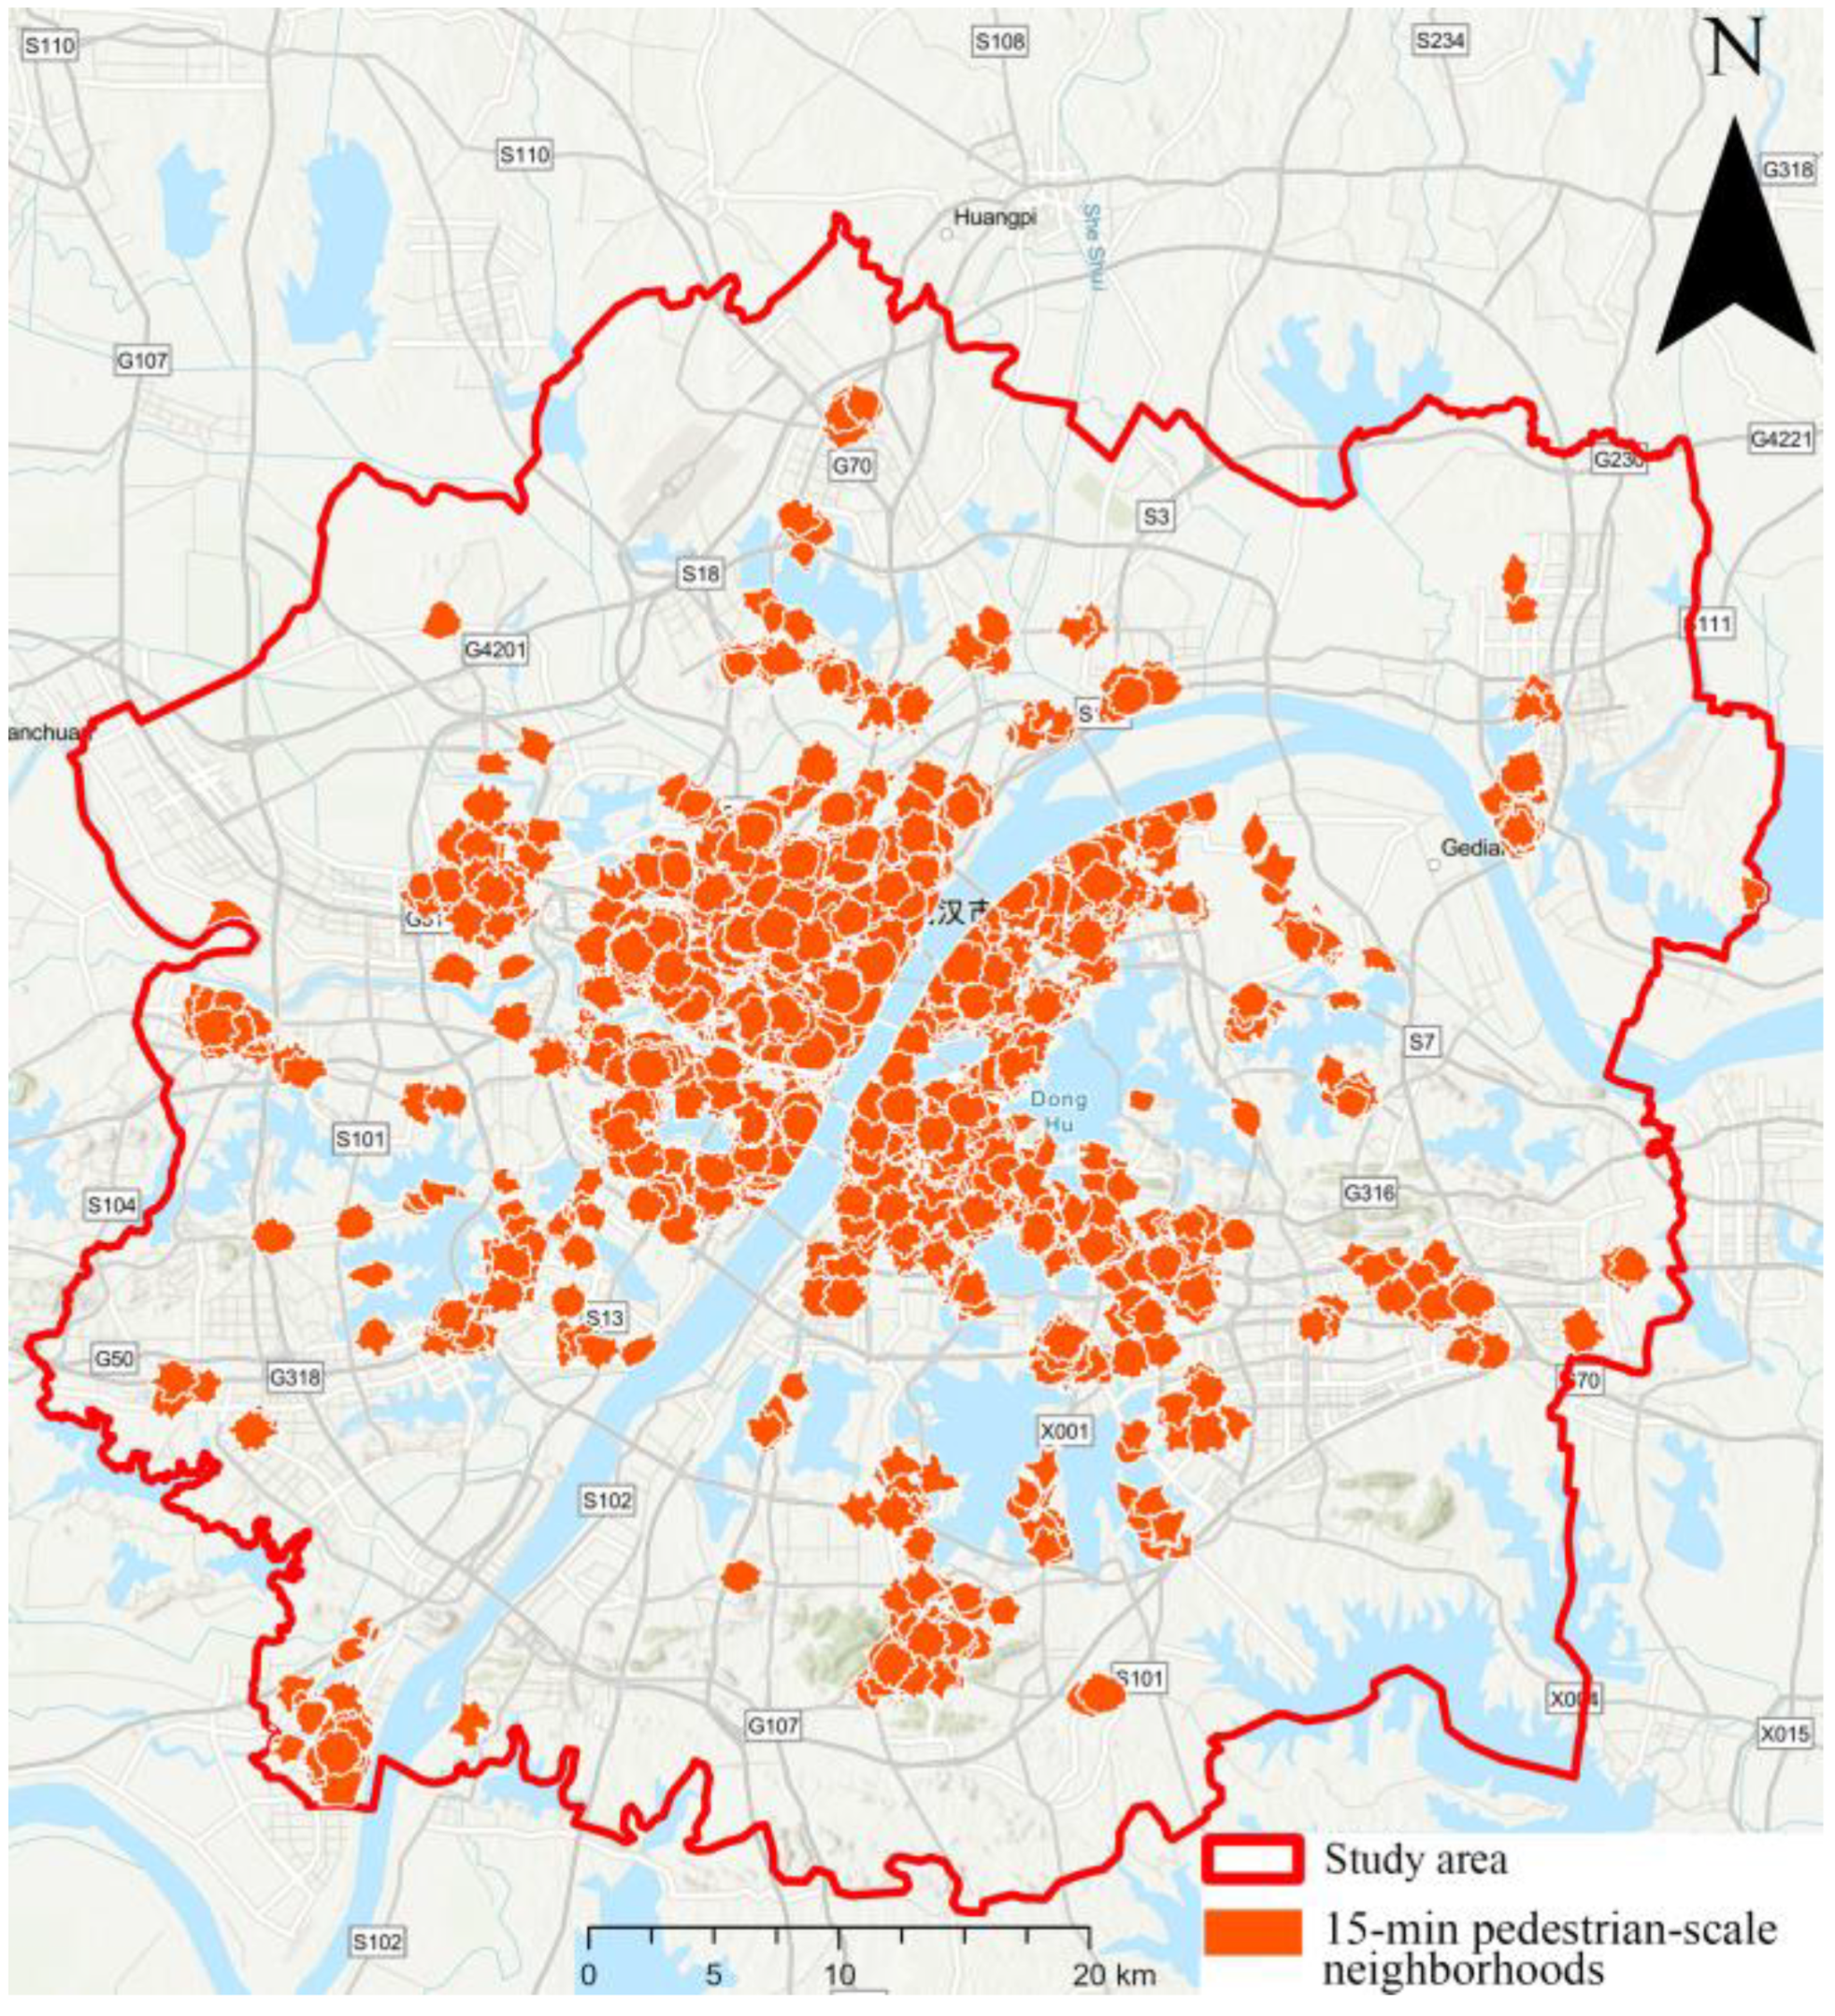
3.2.2. Residents 15-min Pedestrian-Scale Neighborhood Built Environment
3.3. Modeling Methods
3.3.1. Spatial Autocorrelation
- Global spatial autocorrelation (Moran’s I)
- 2.
- Local spatial autocorrelation (LISA)
3.3.2. Multi-Scale Geographically Weighted Regression (MGWR)
4. Results
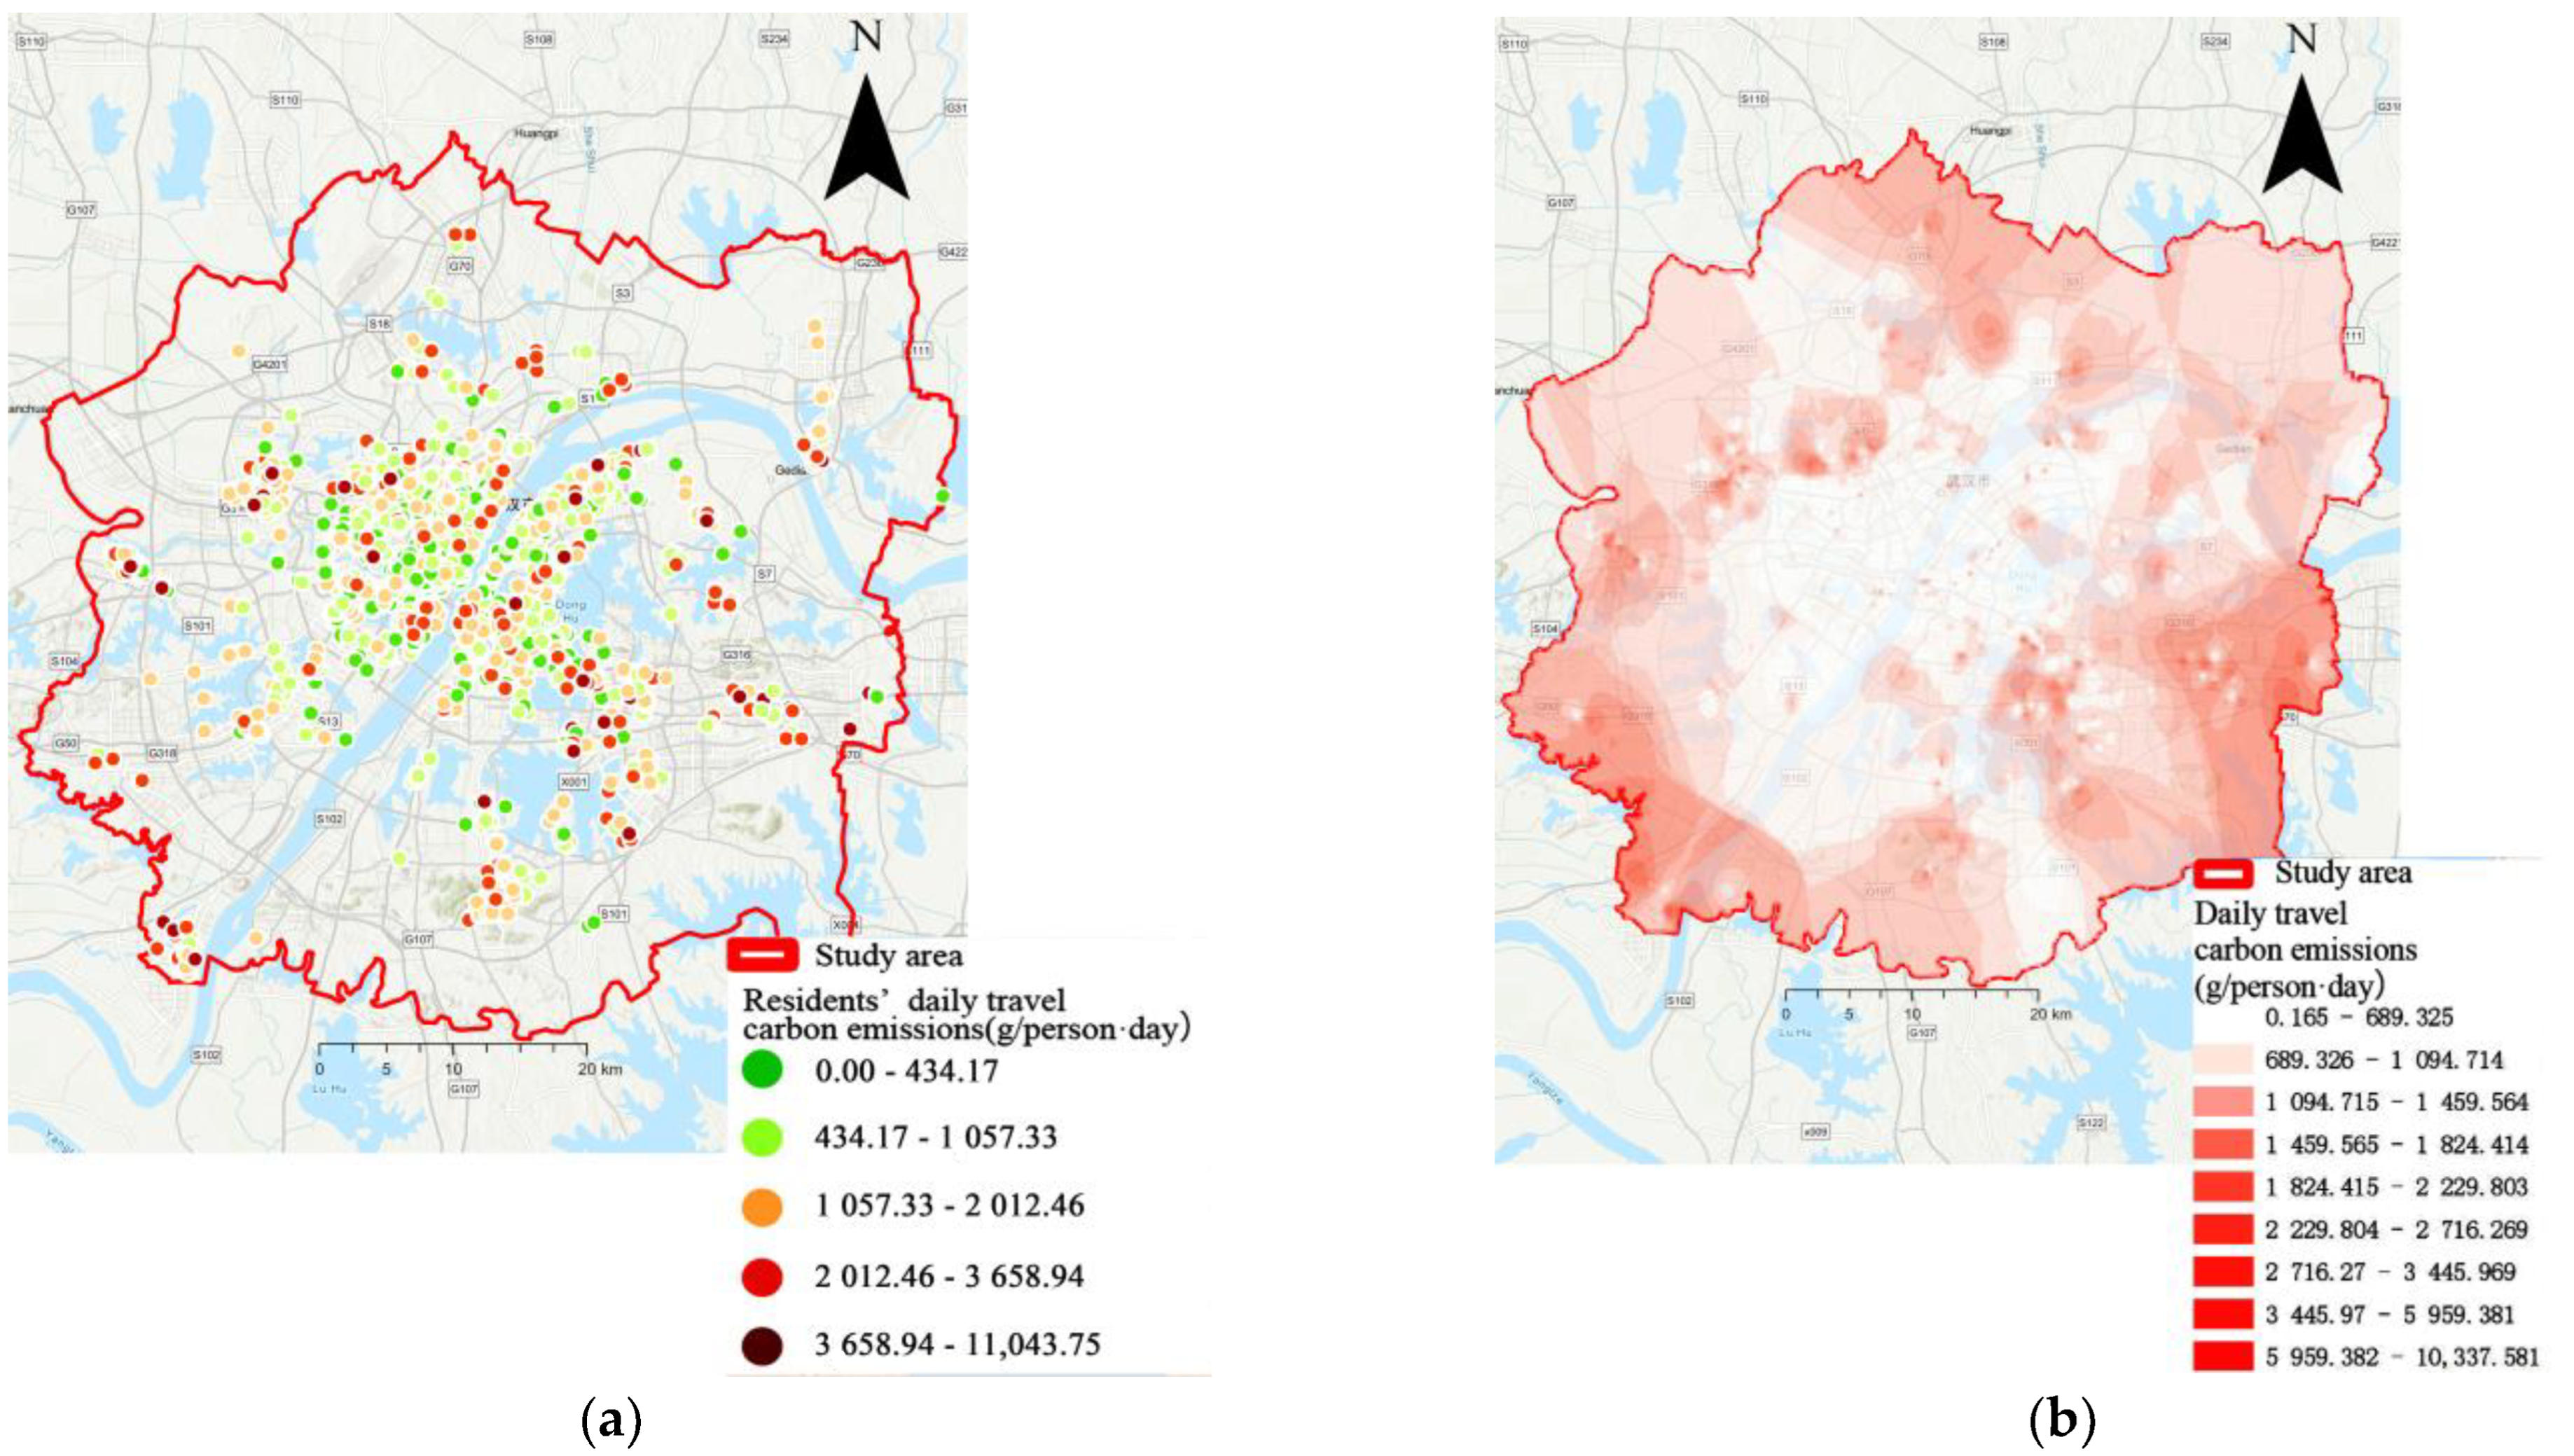
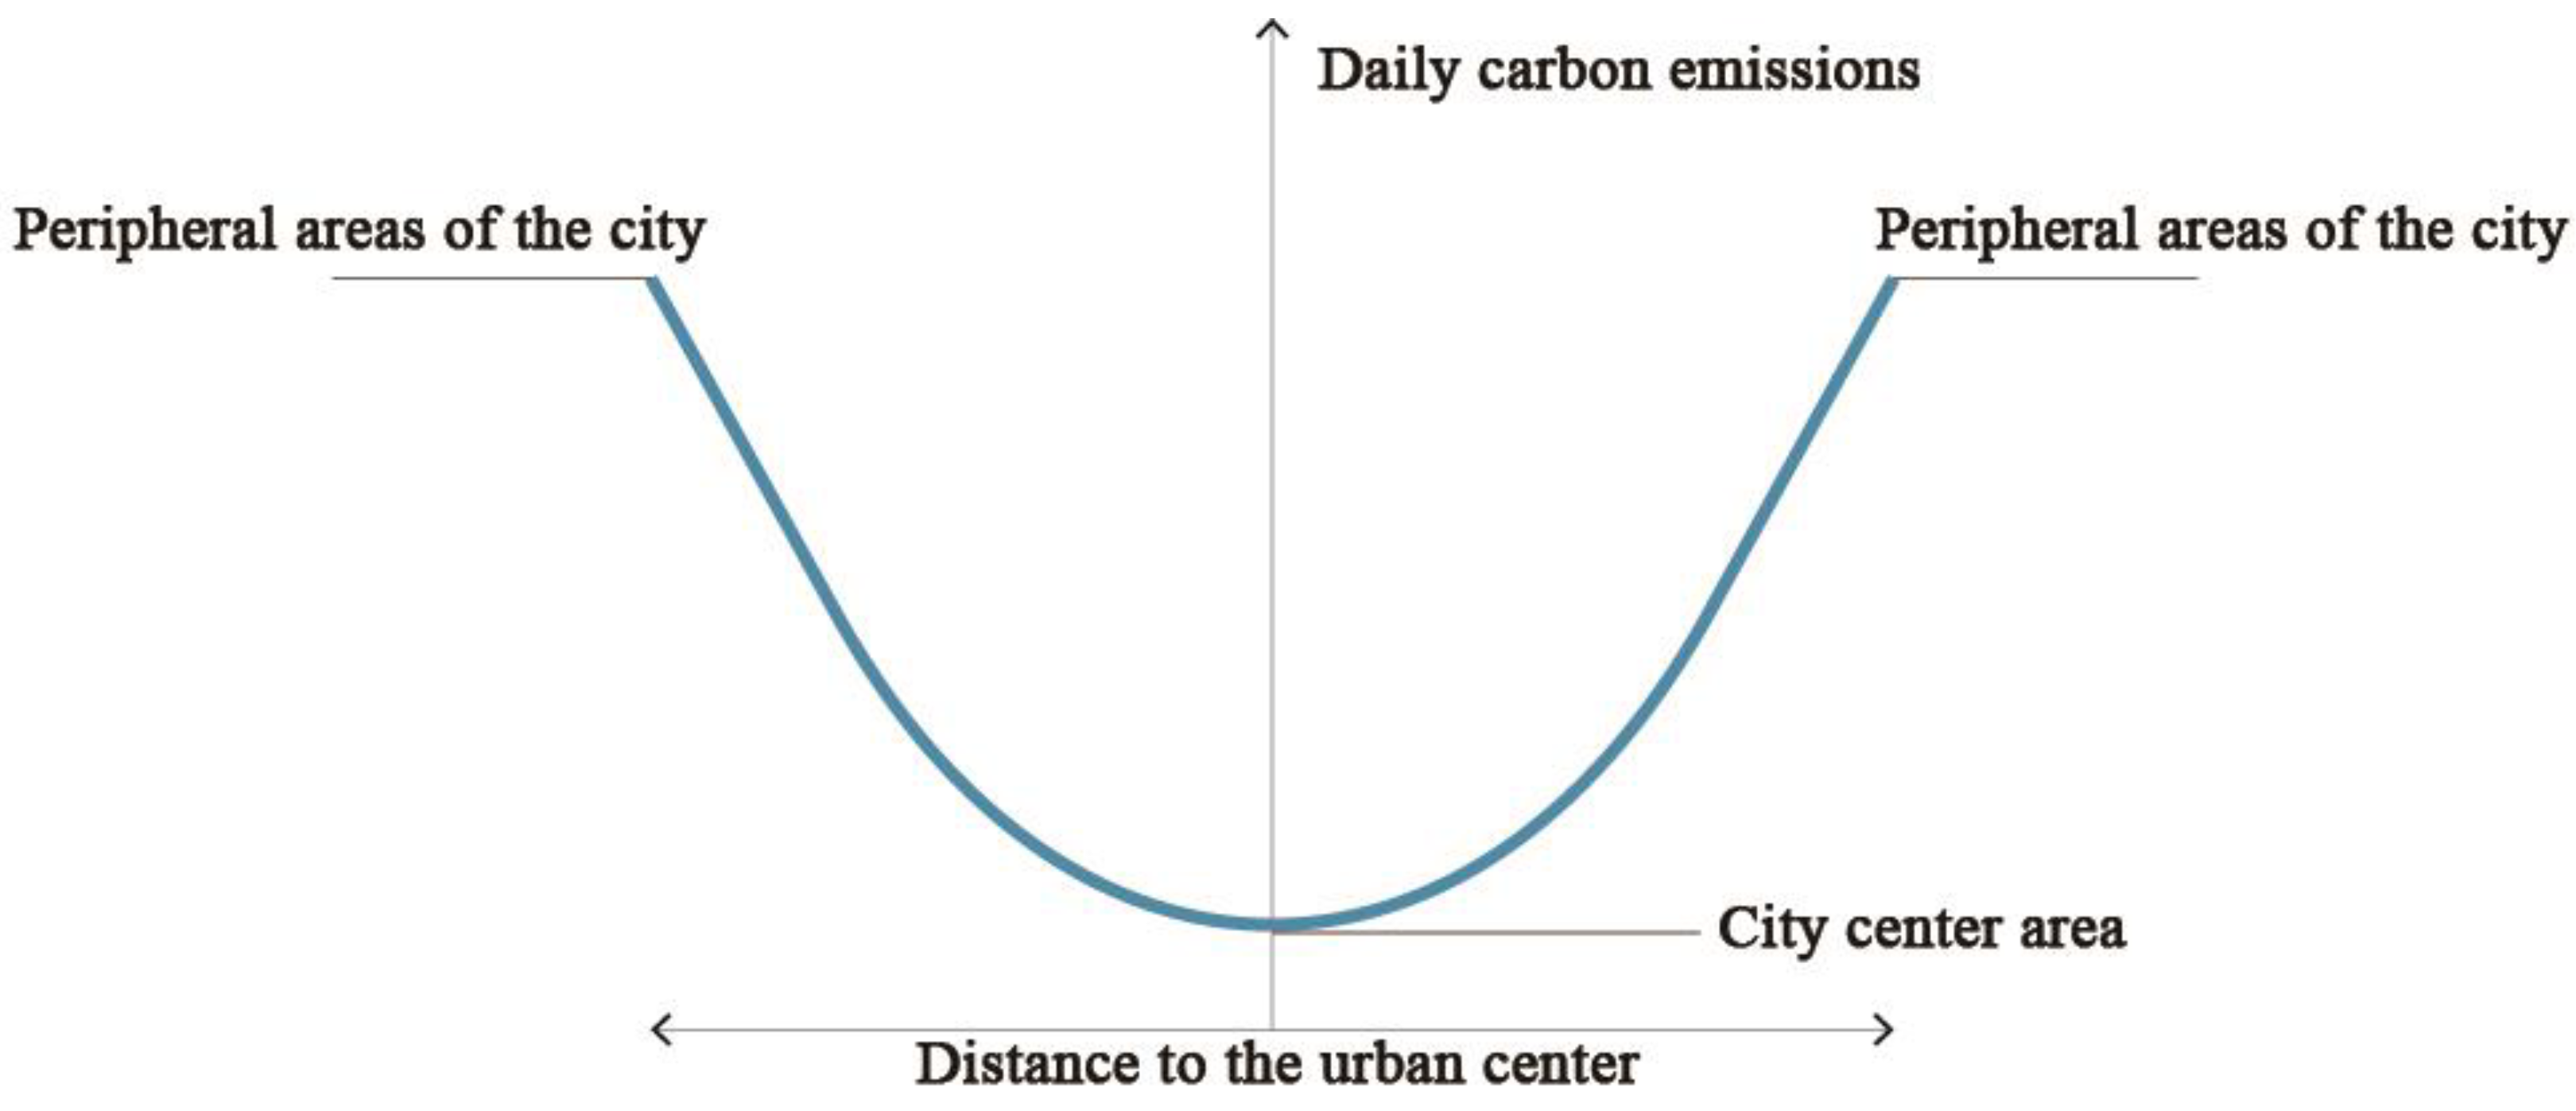
4.1. Spatial Pattern of Carbon Emissions from Daily Travel of Residents
4.2. Global Autocorrelation Analysis (Moran’s I) of Daily Travel Carbon Emissions
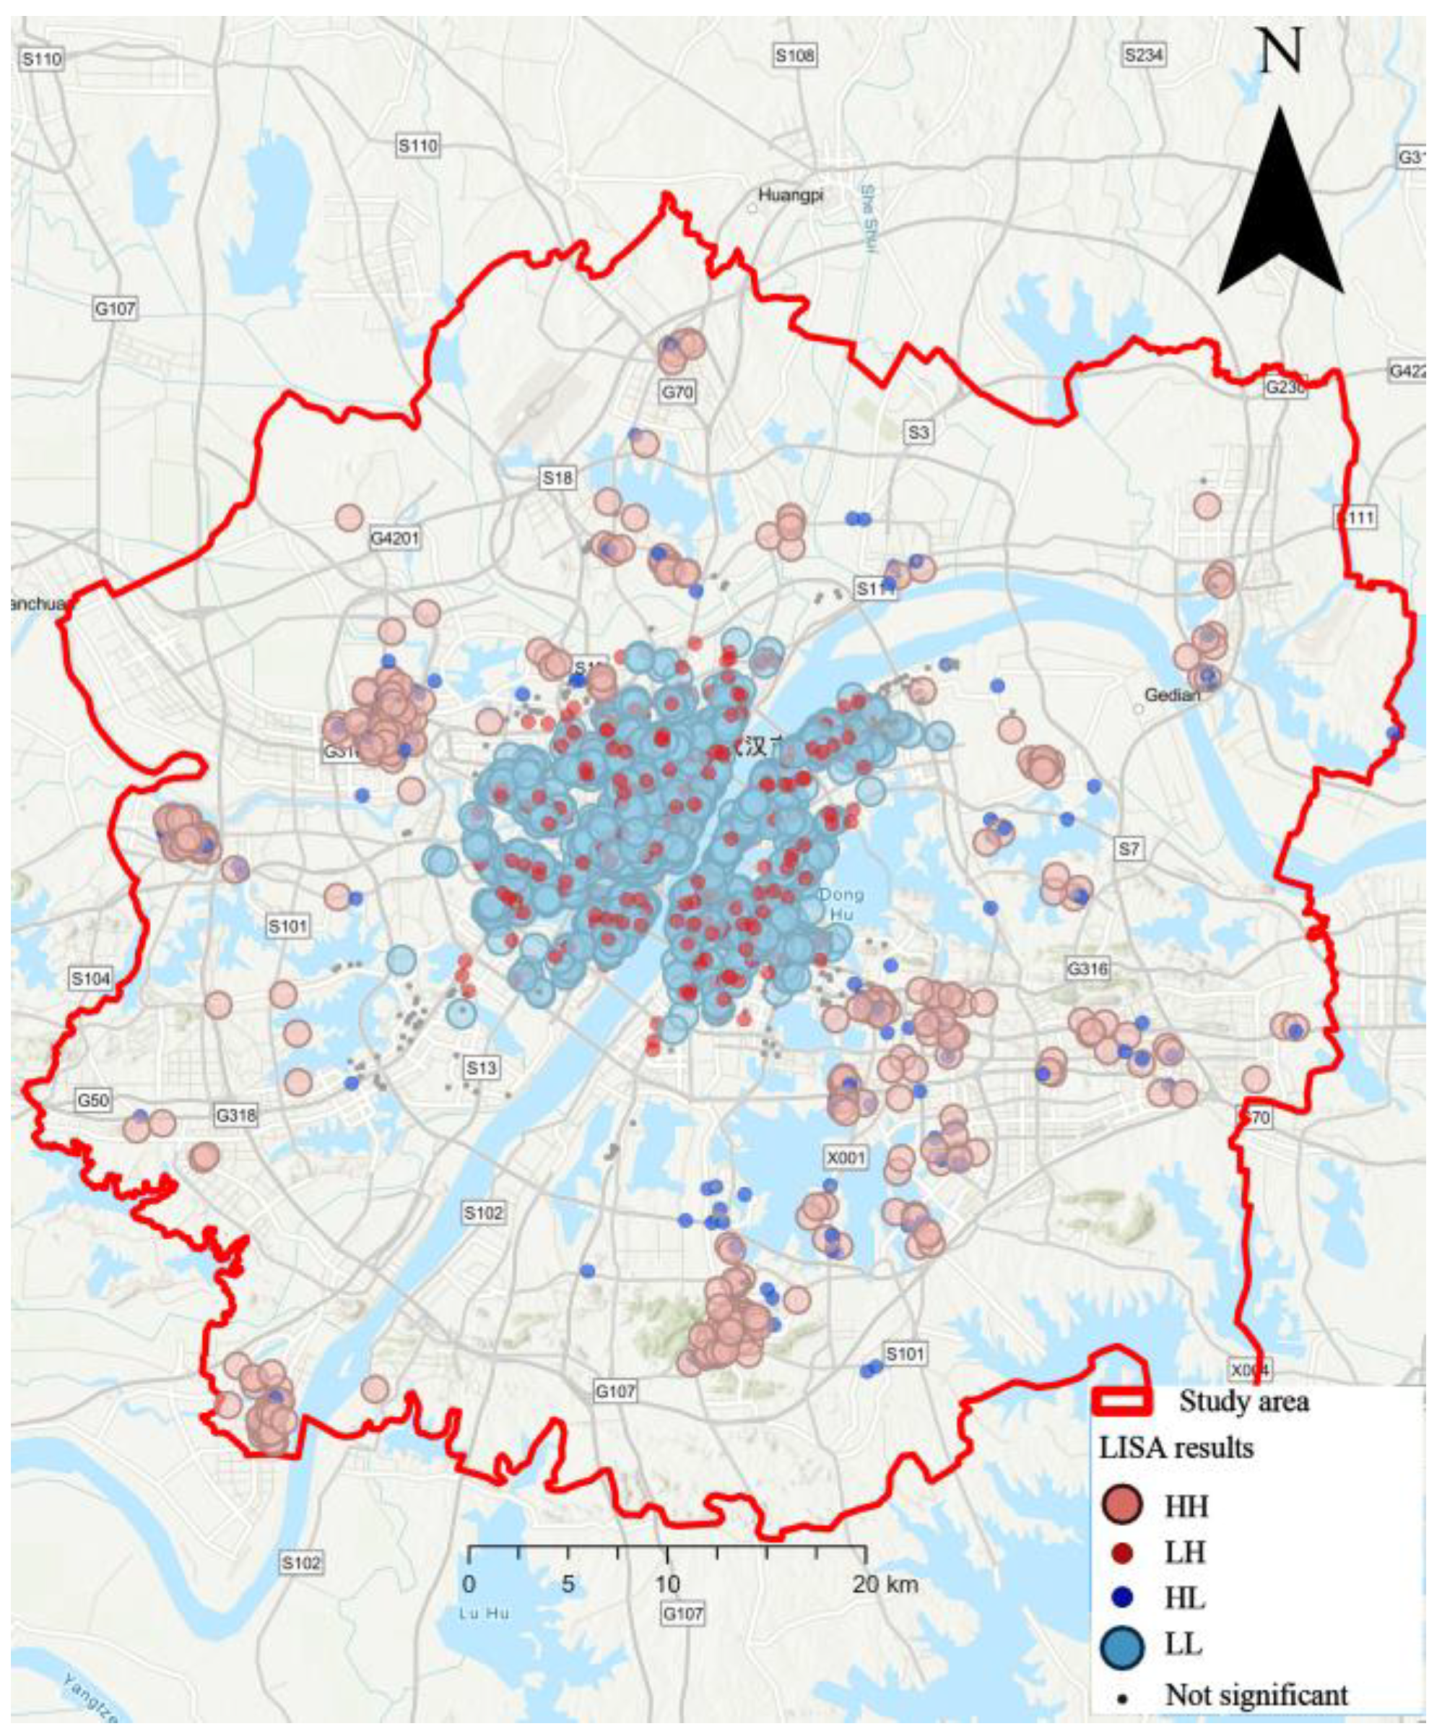
4.3. Local Autocorrelation Analysis (LISA) of Daily Travel Carbon Emissions
4.4. Heterogeneous Influence Mechanism of the 15-min Pedestrian-Scale Neighborhood Built Environment on Residents’ Daily Travel Carbon Emission
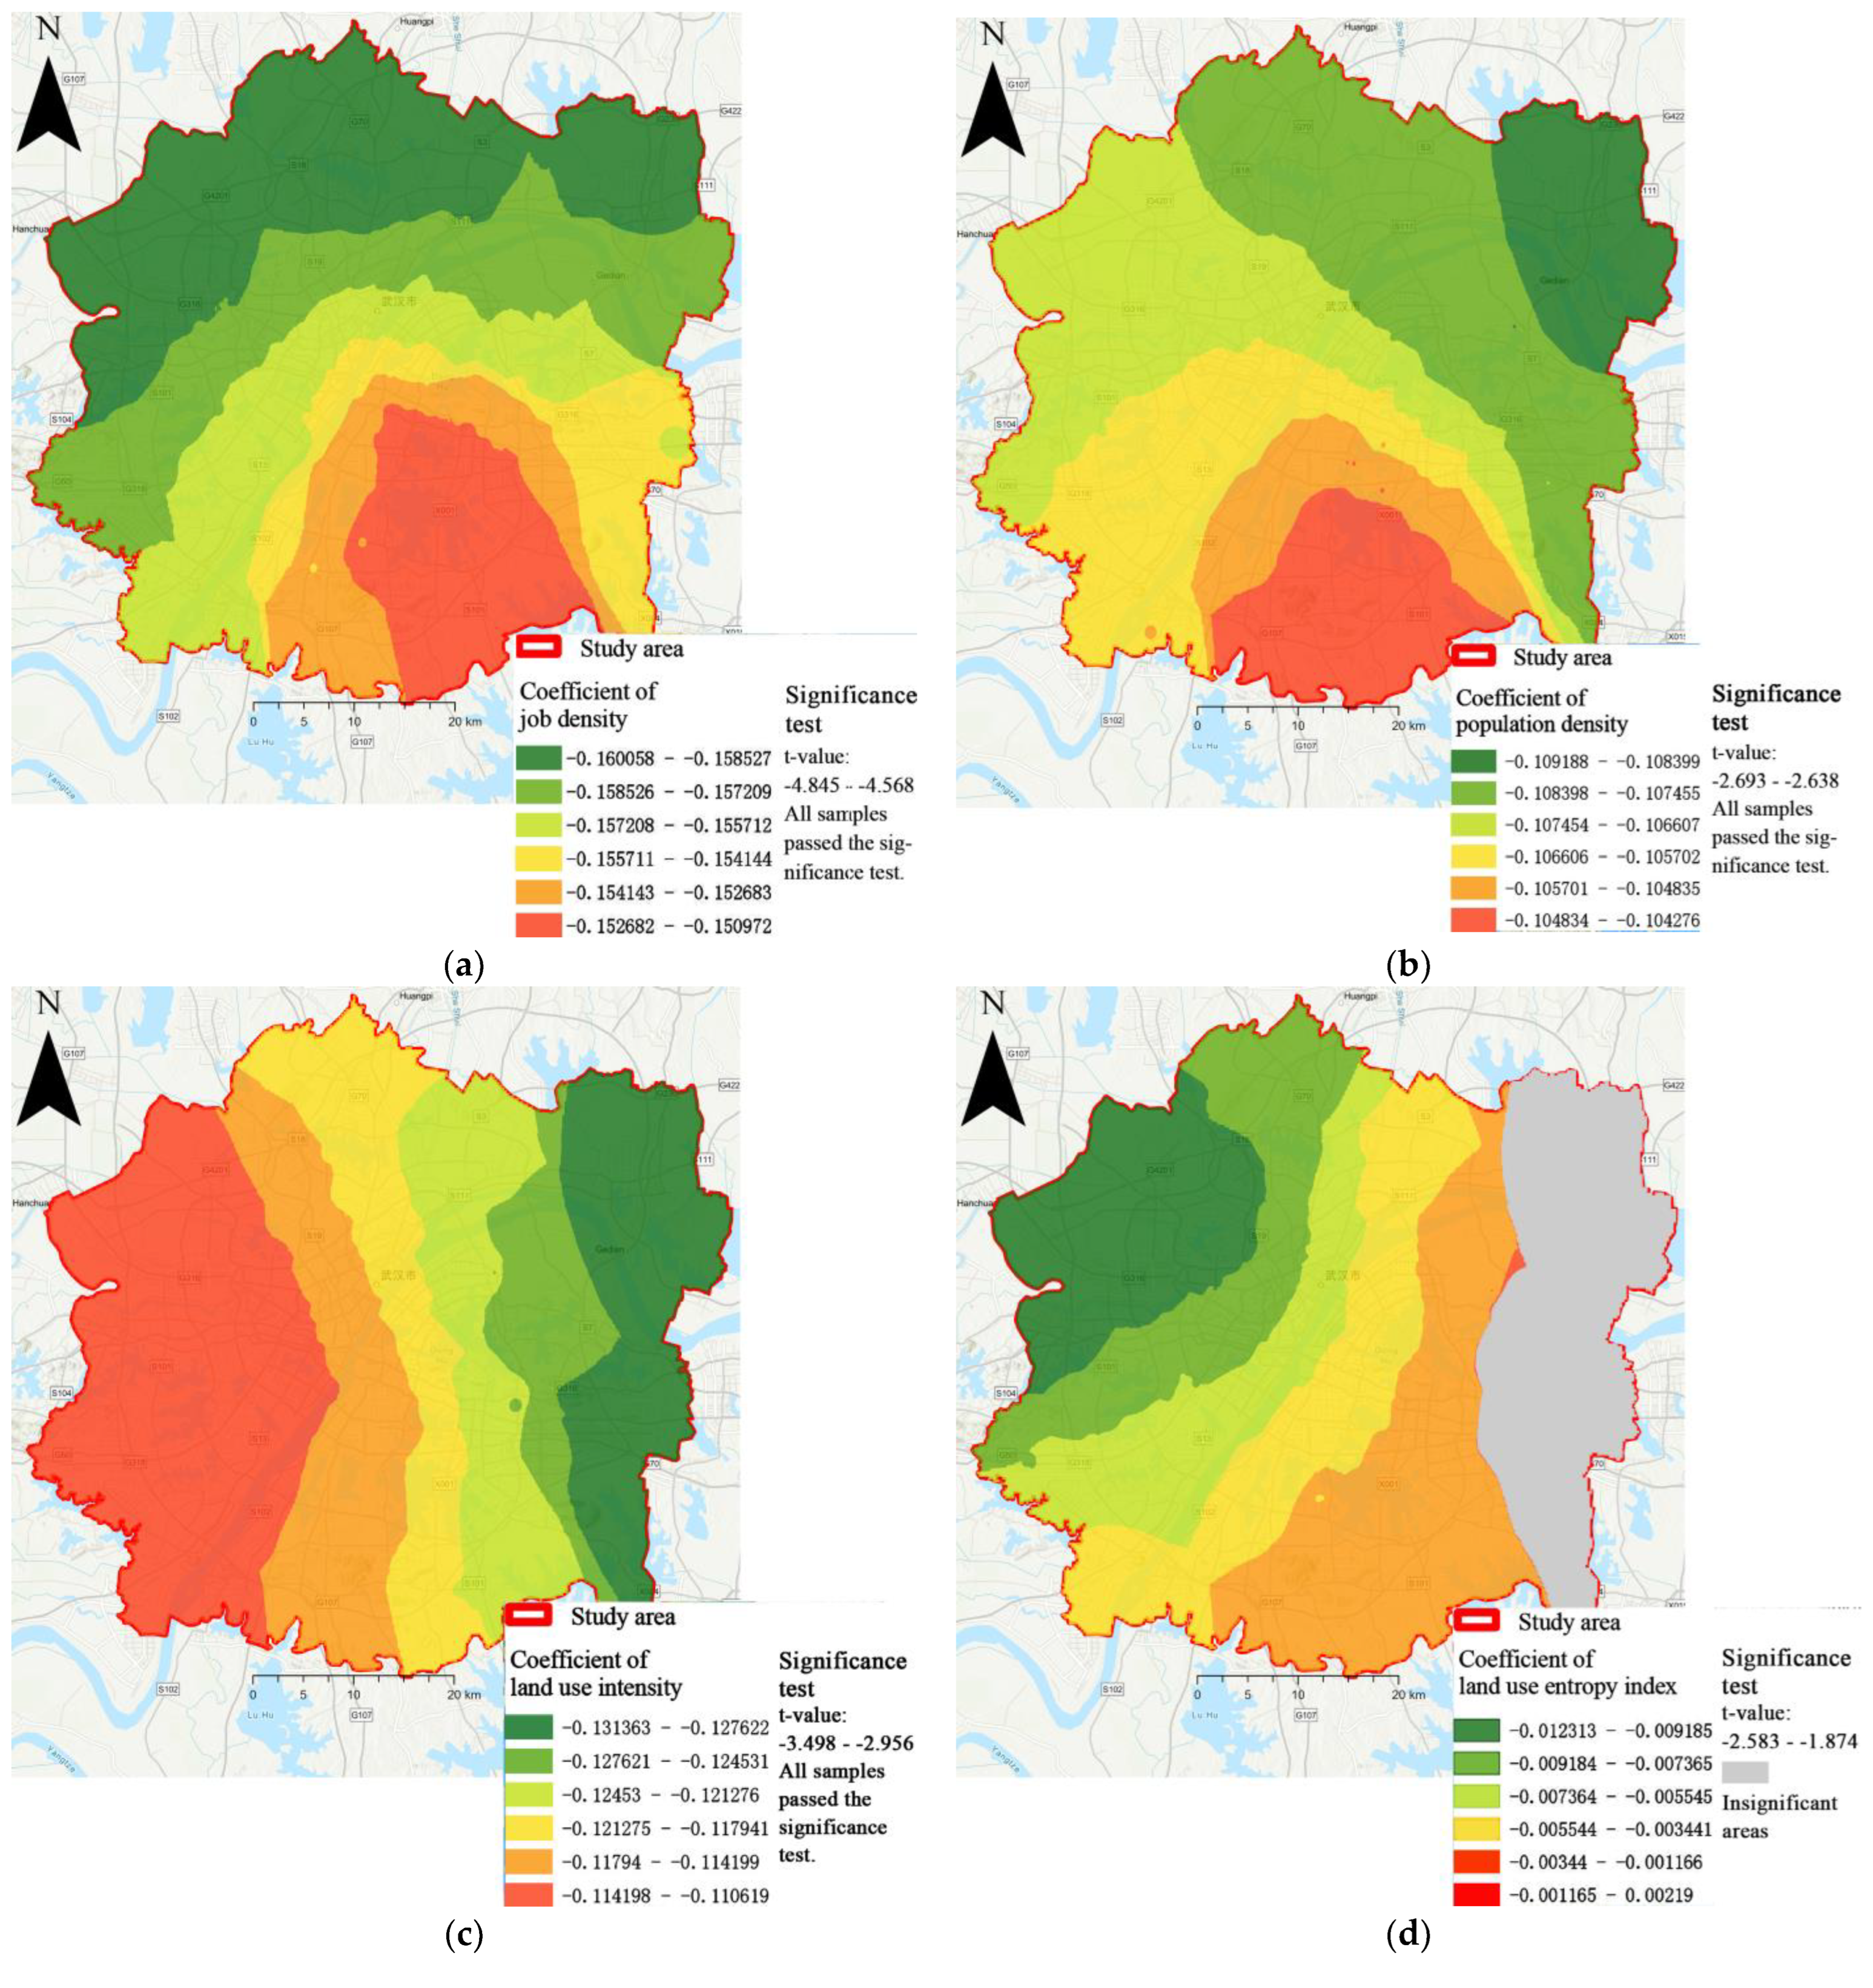
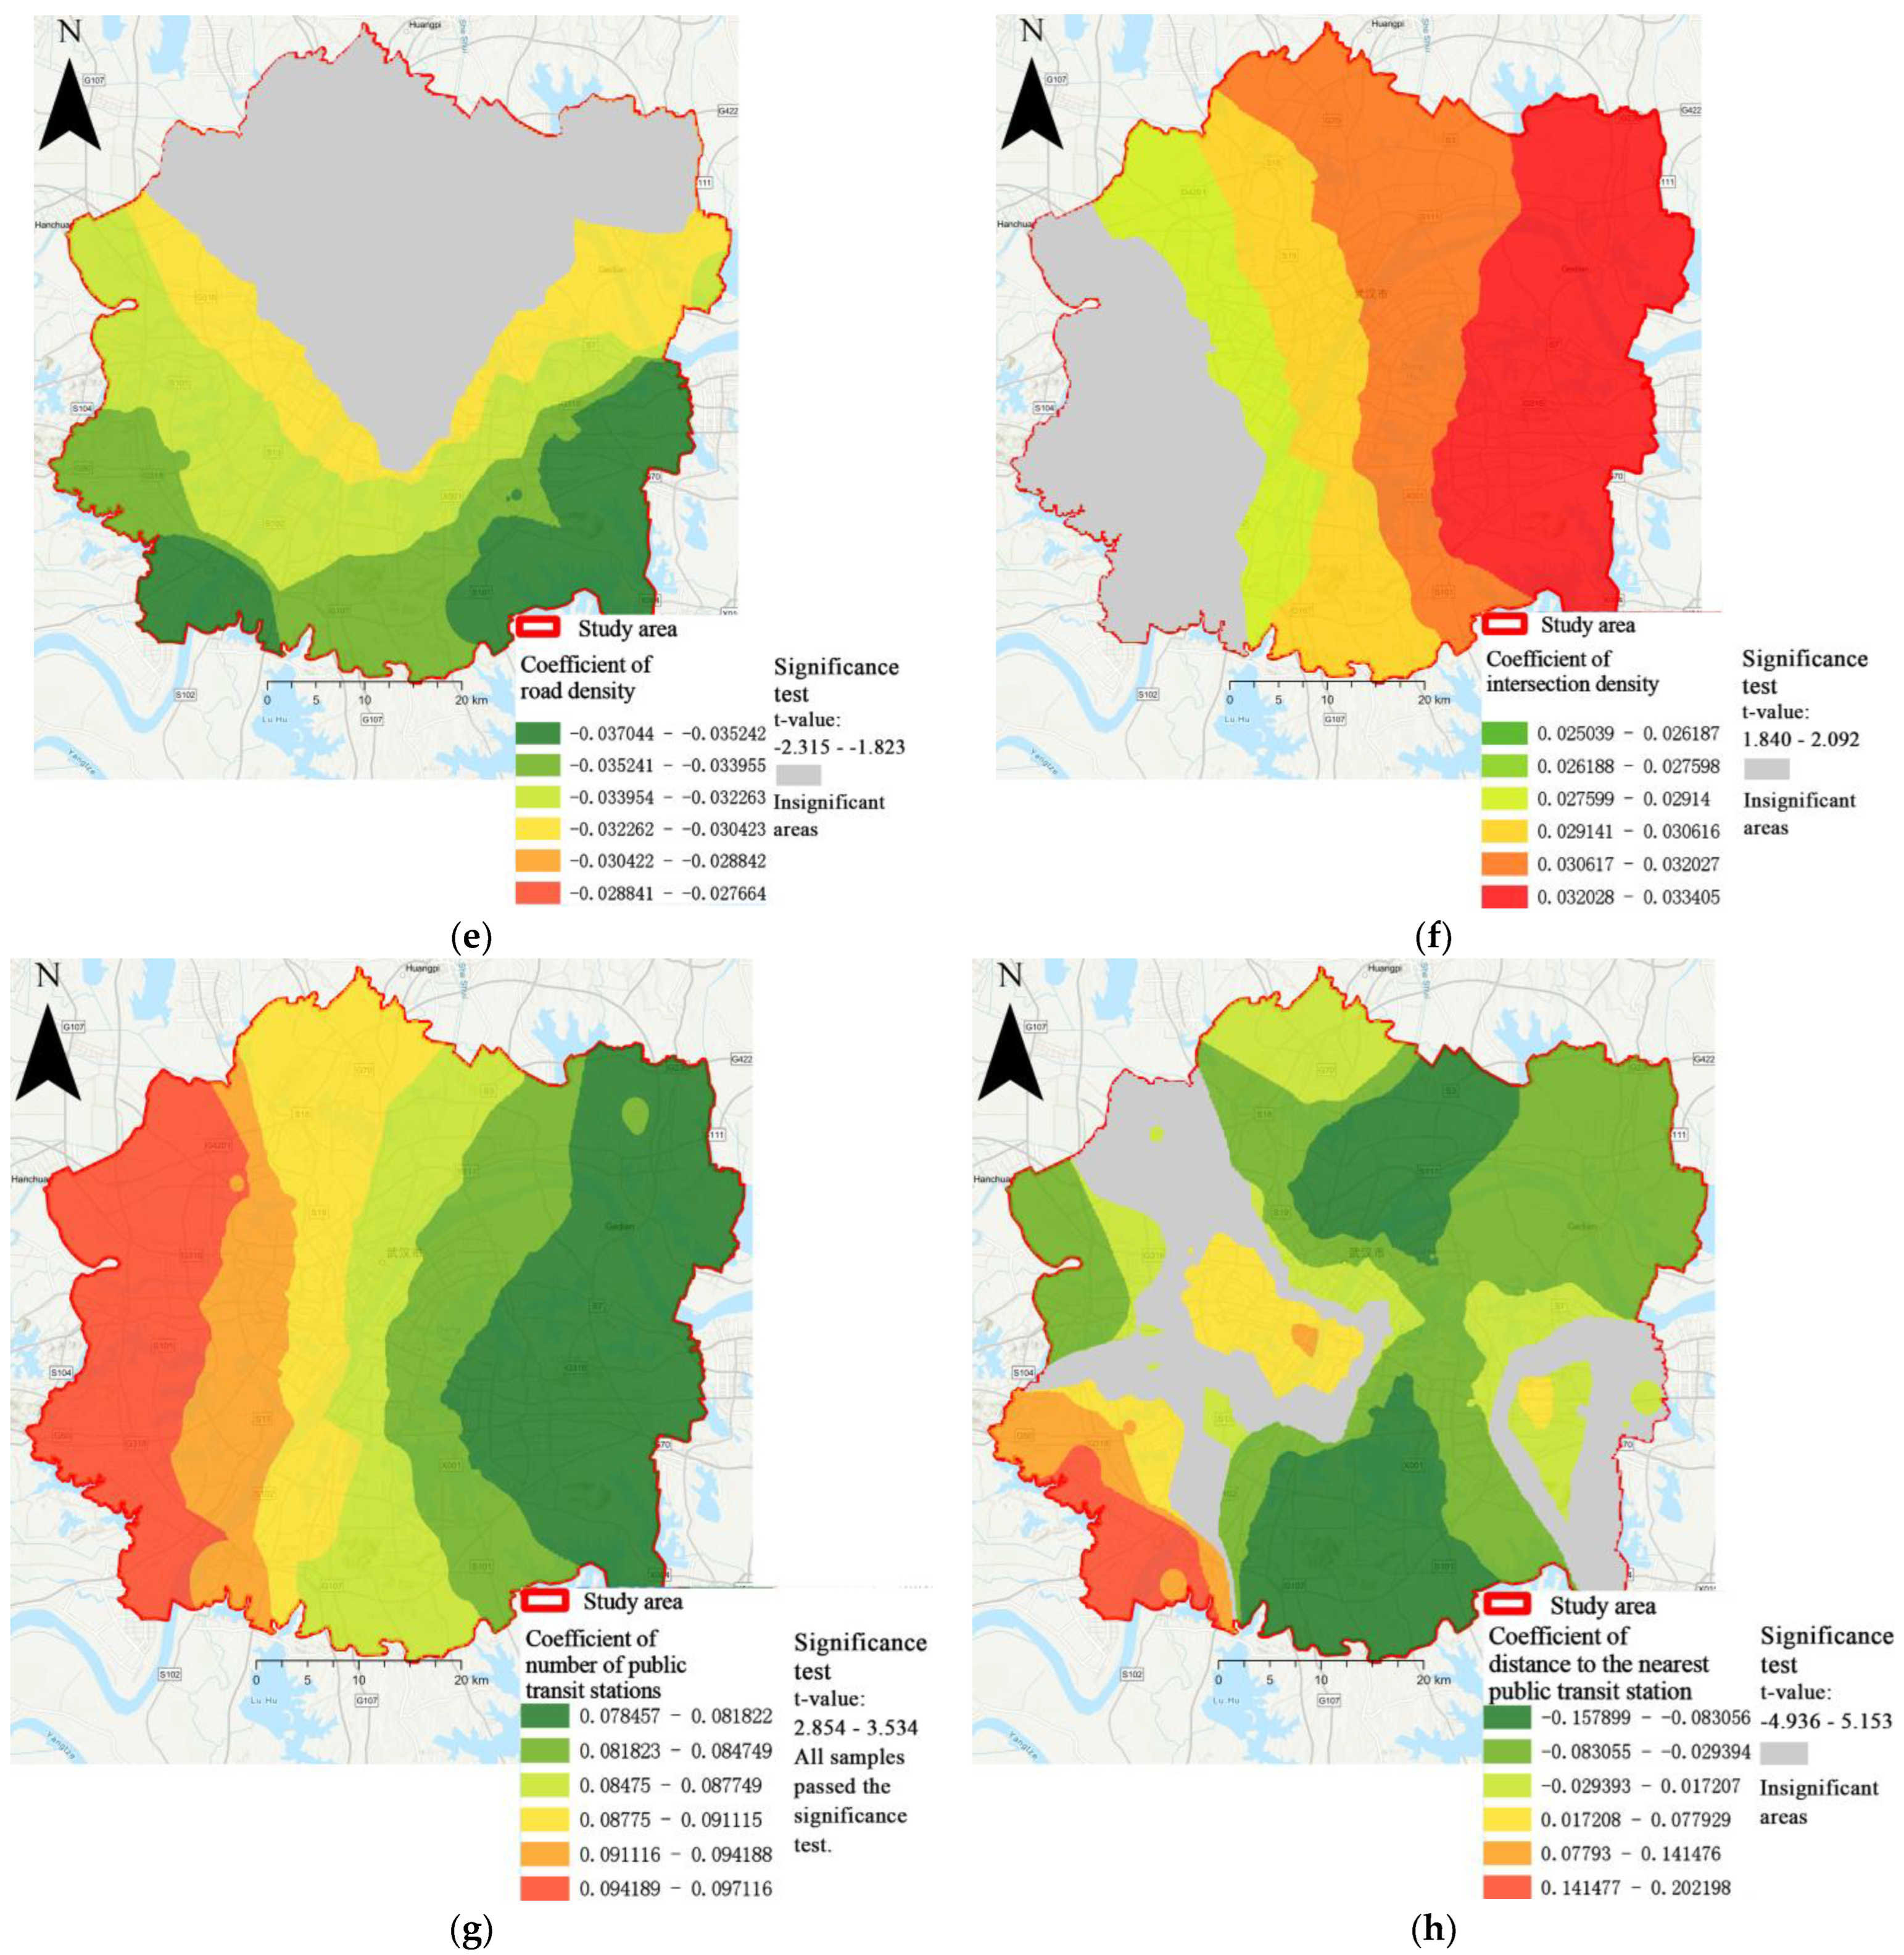
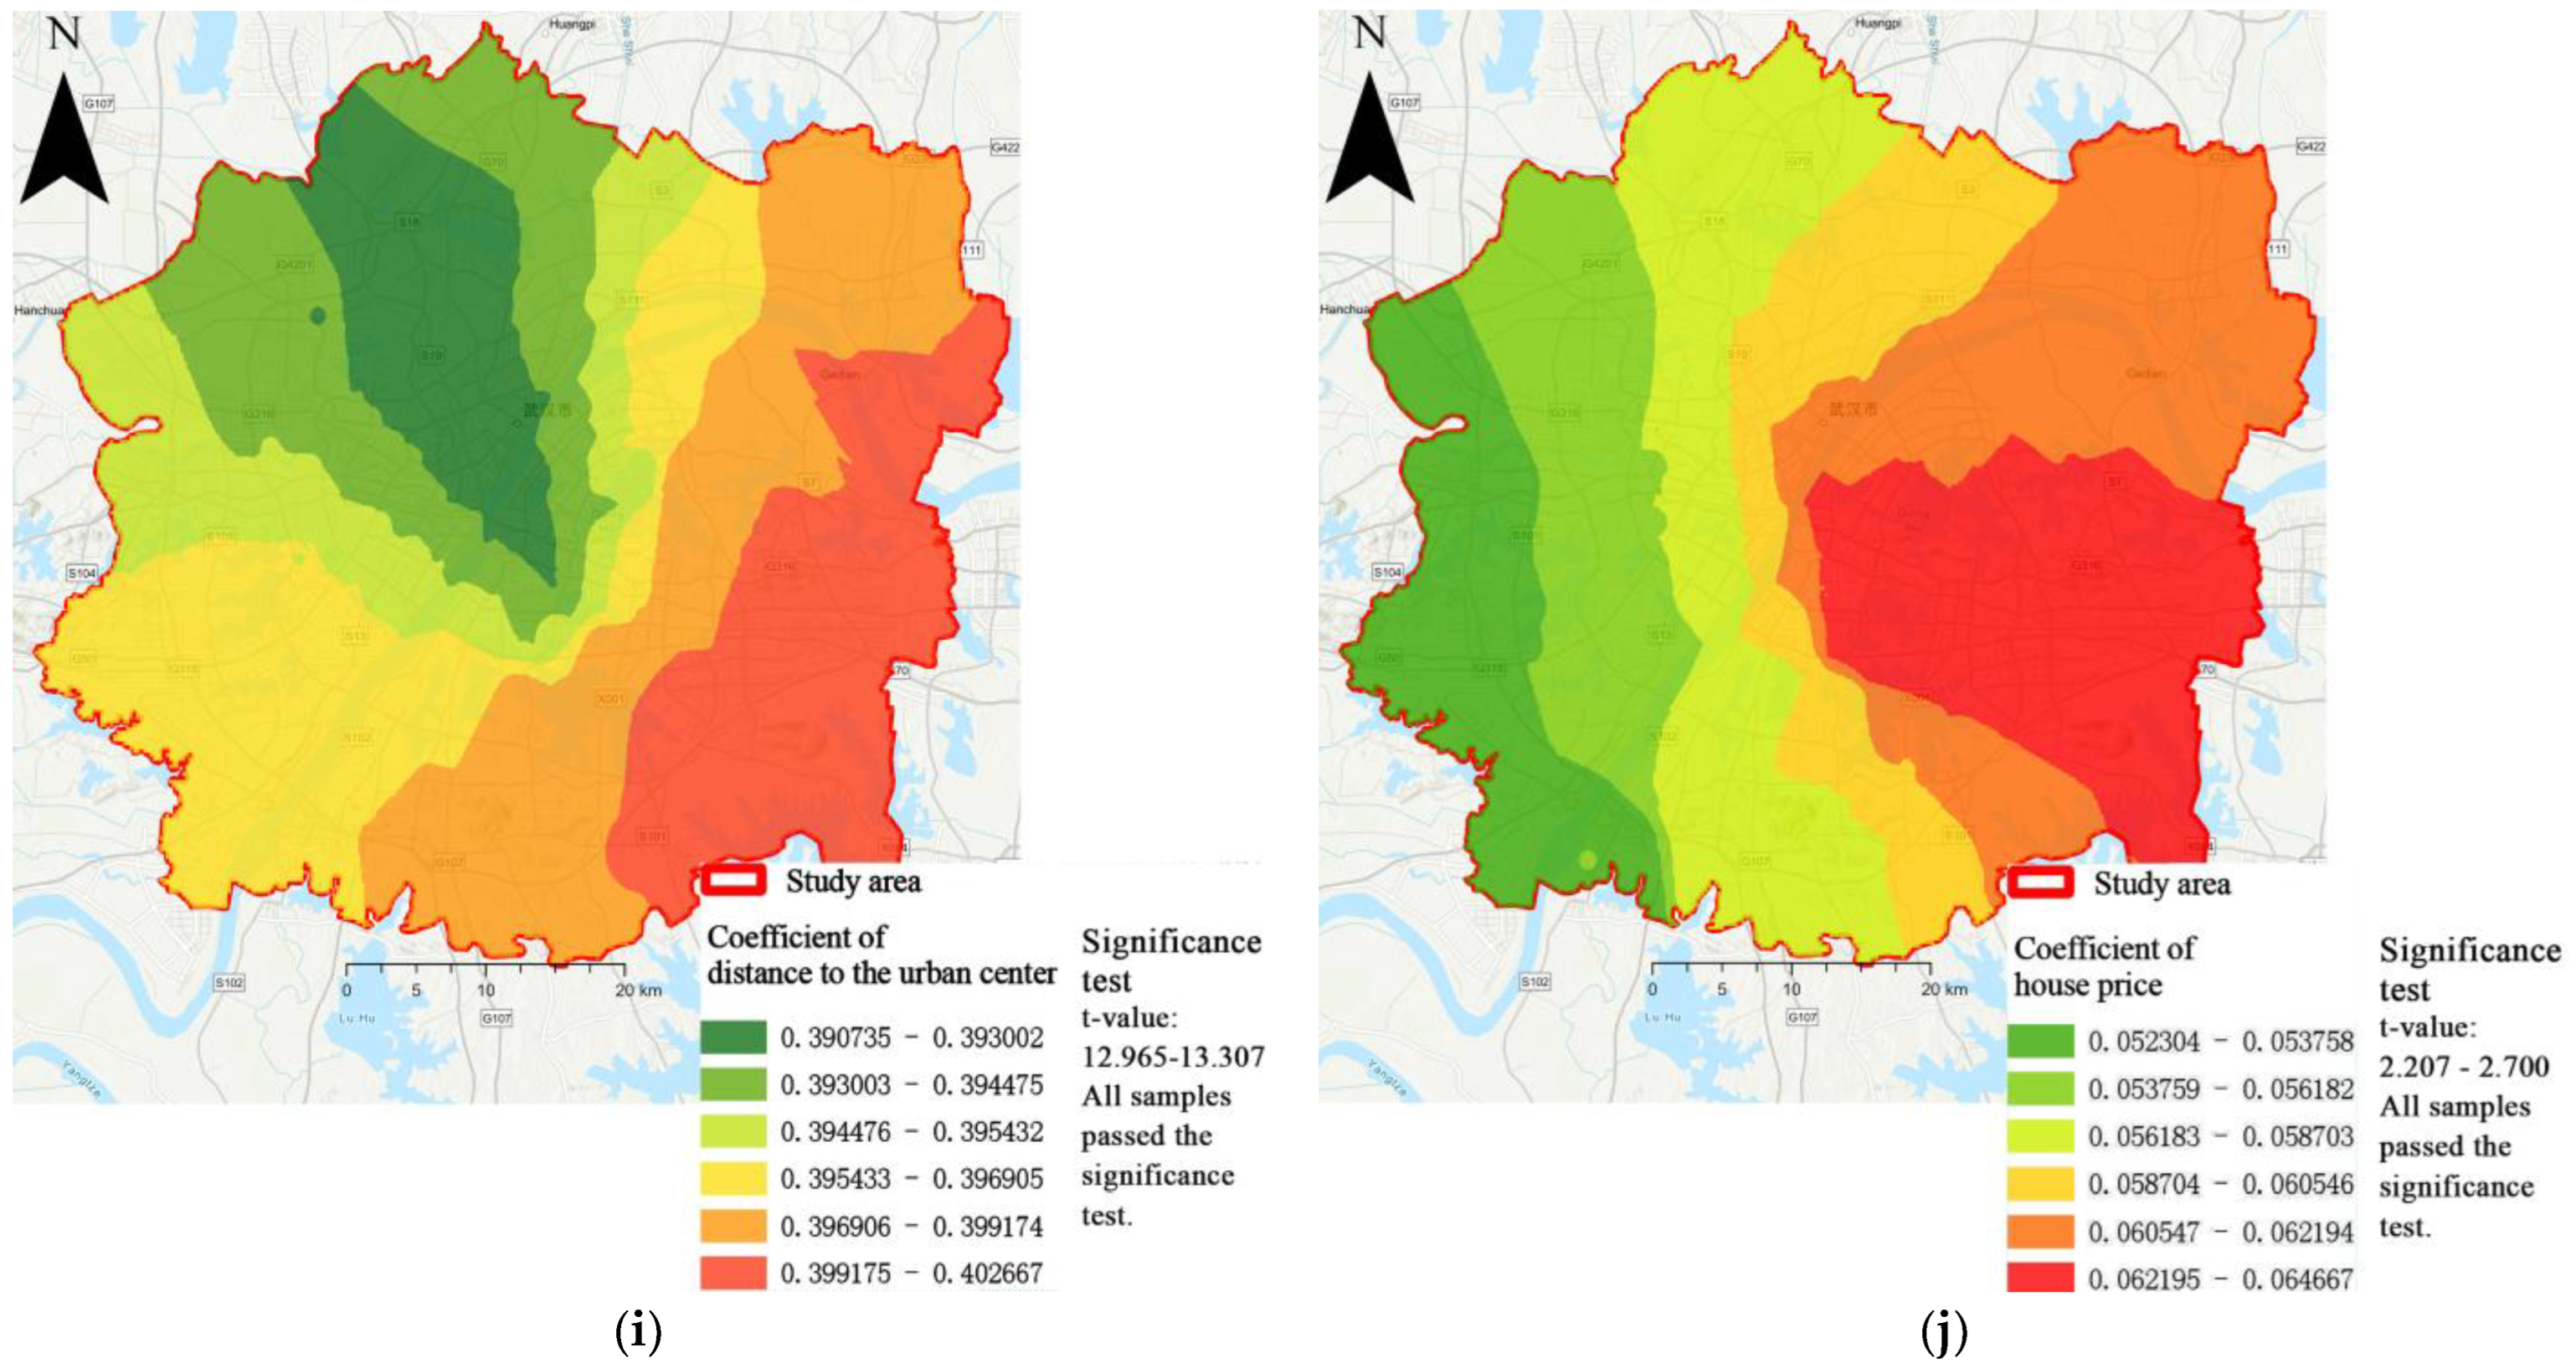
4.4.1. Spatial Heterogeneity of the 15-min Pedestrian-Scale Neighborhood Built Environment on the Impact of Daily Travel Carbon Emissions
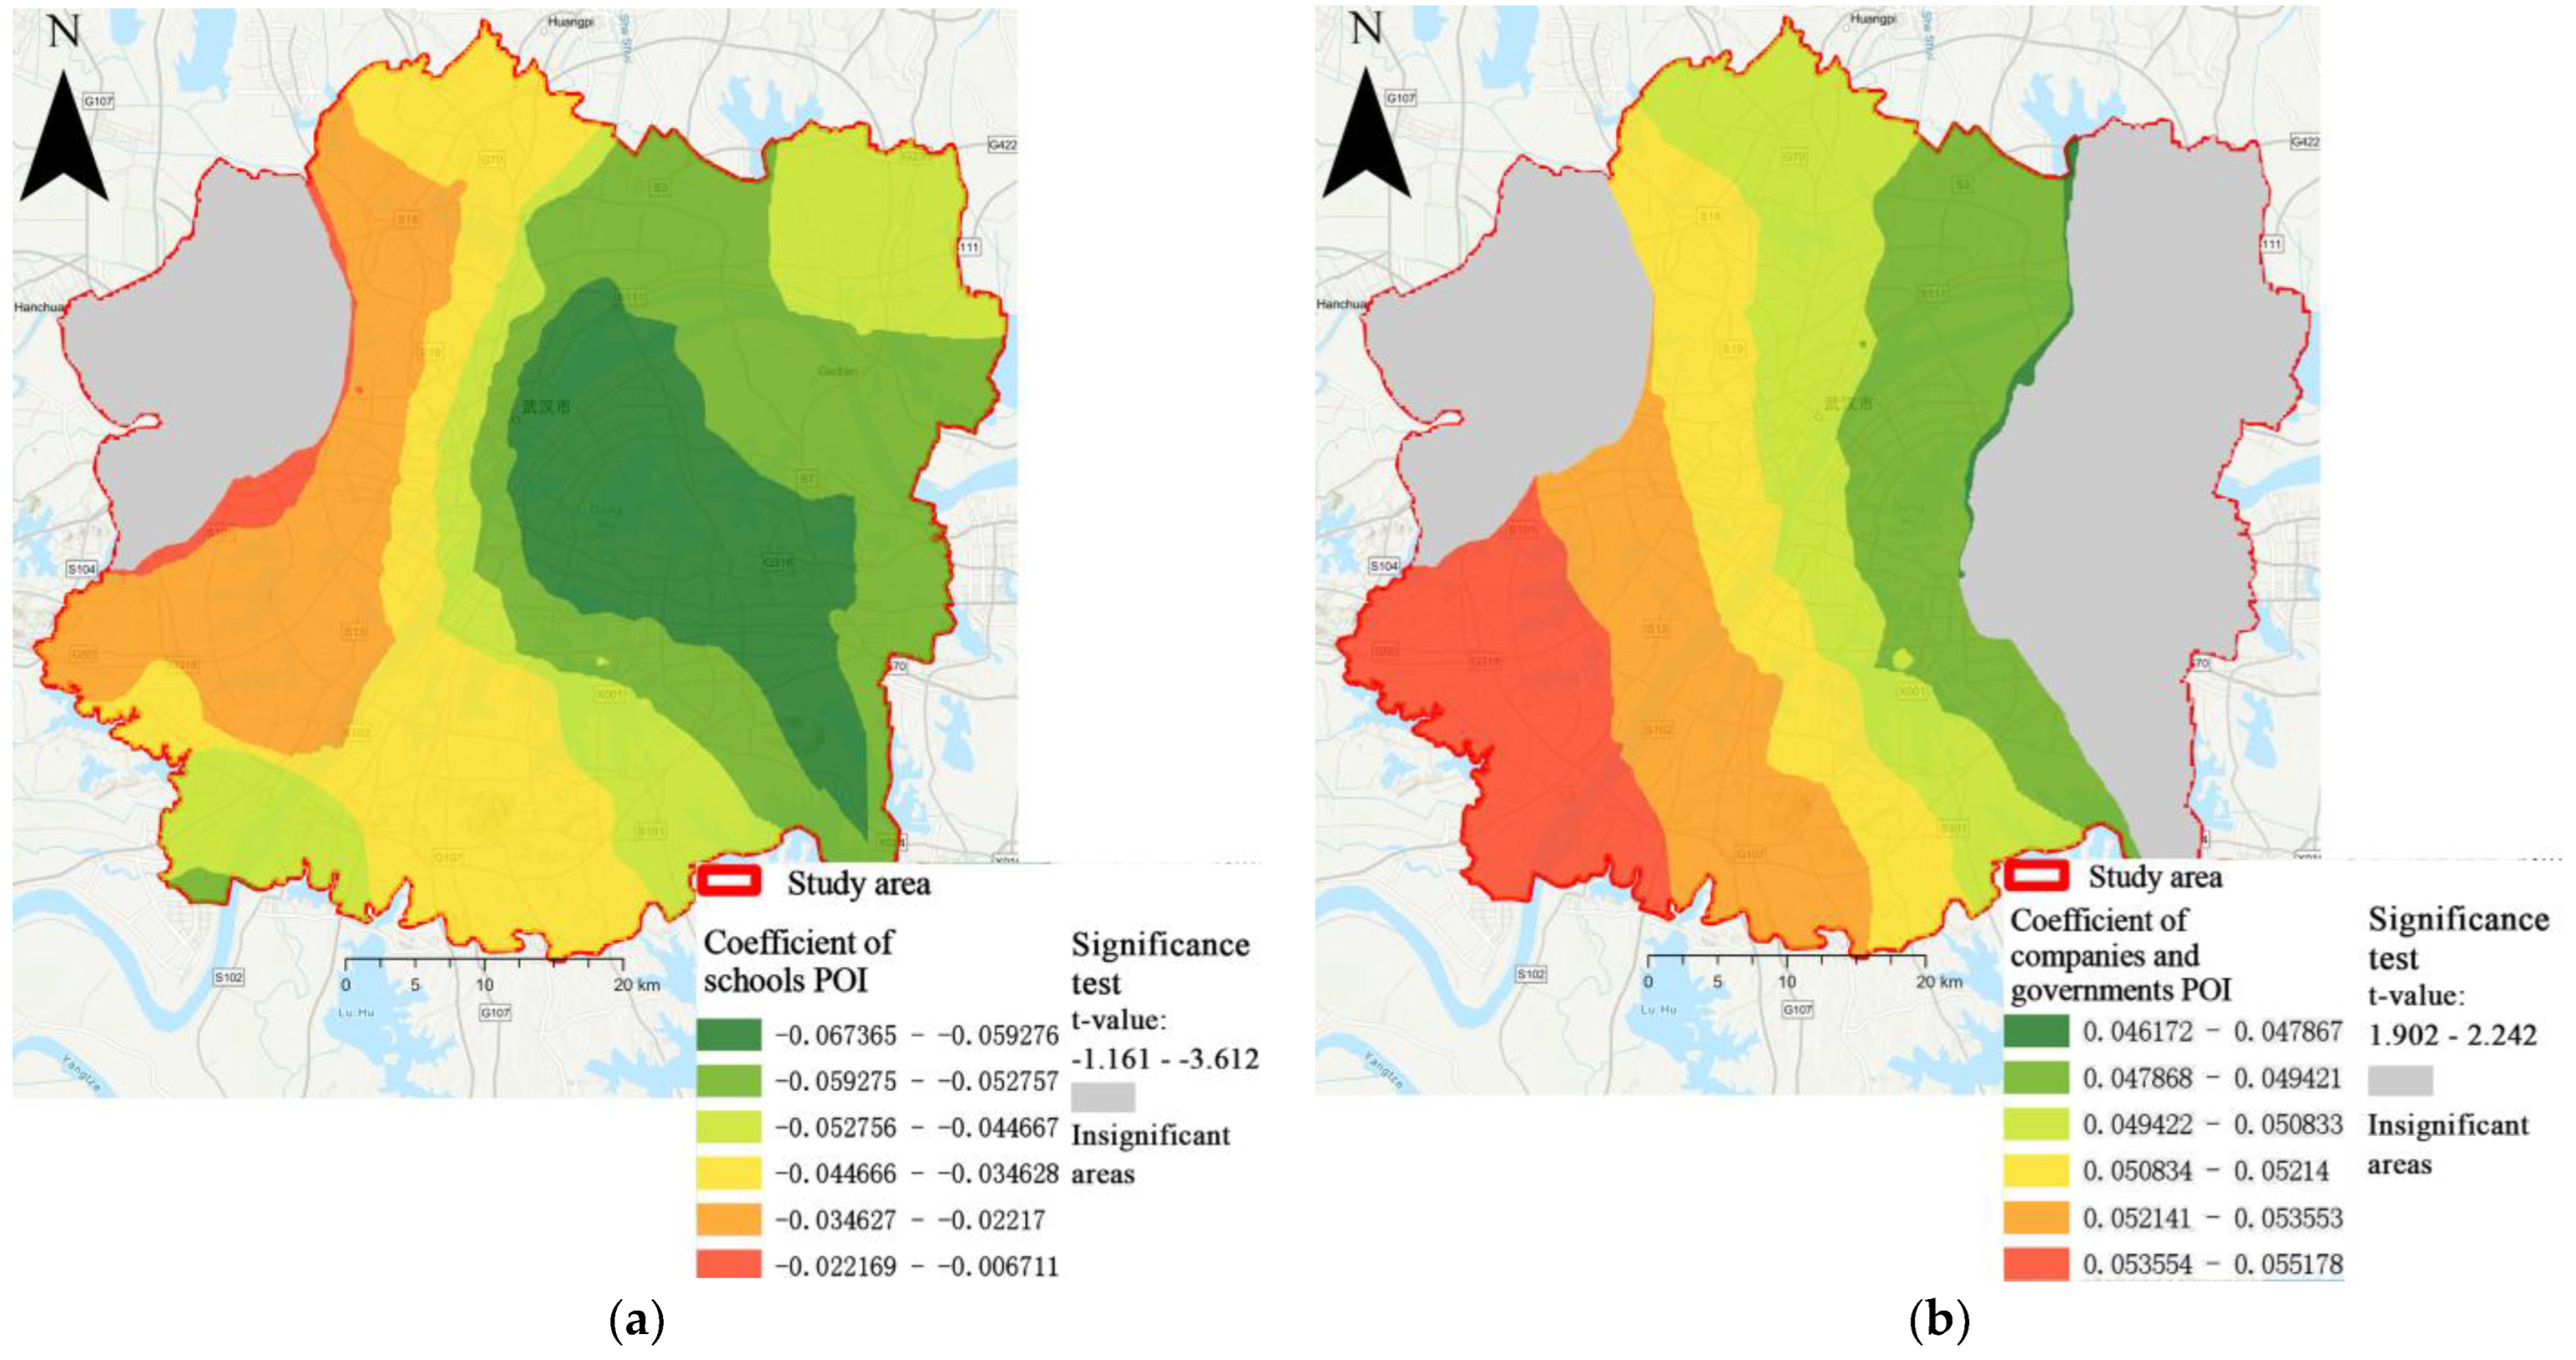
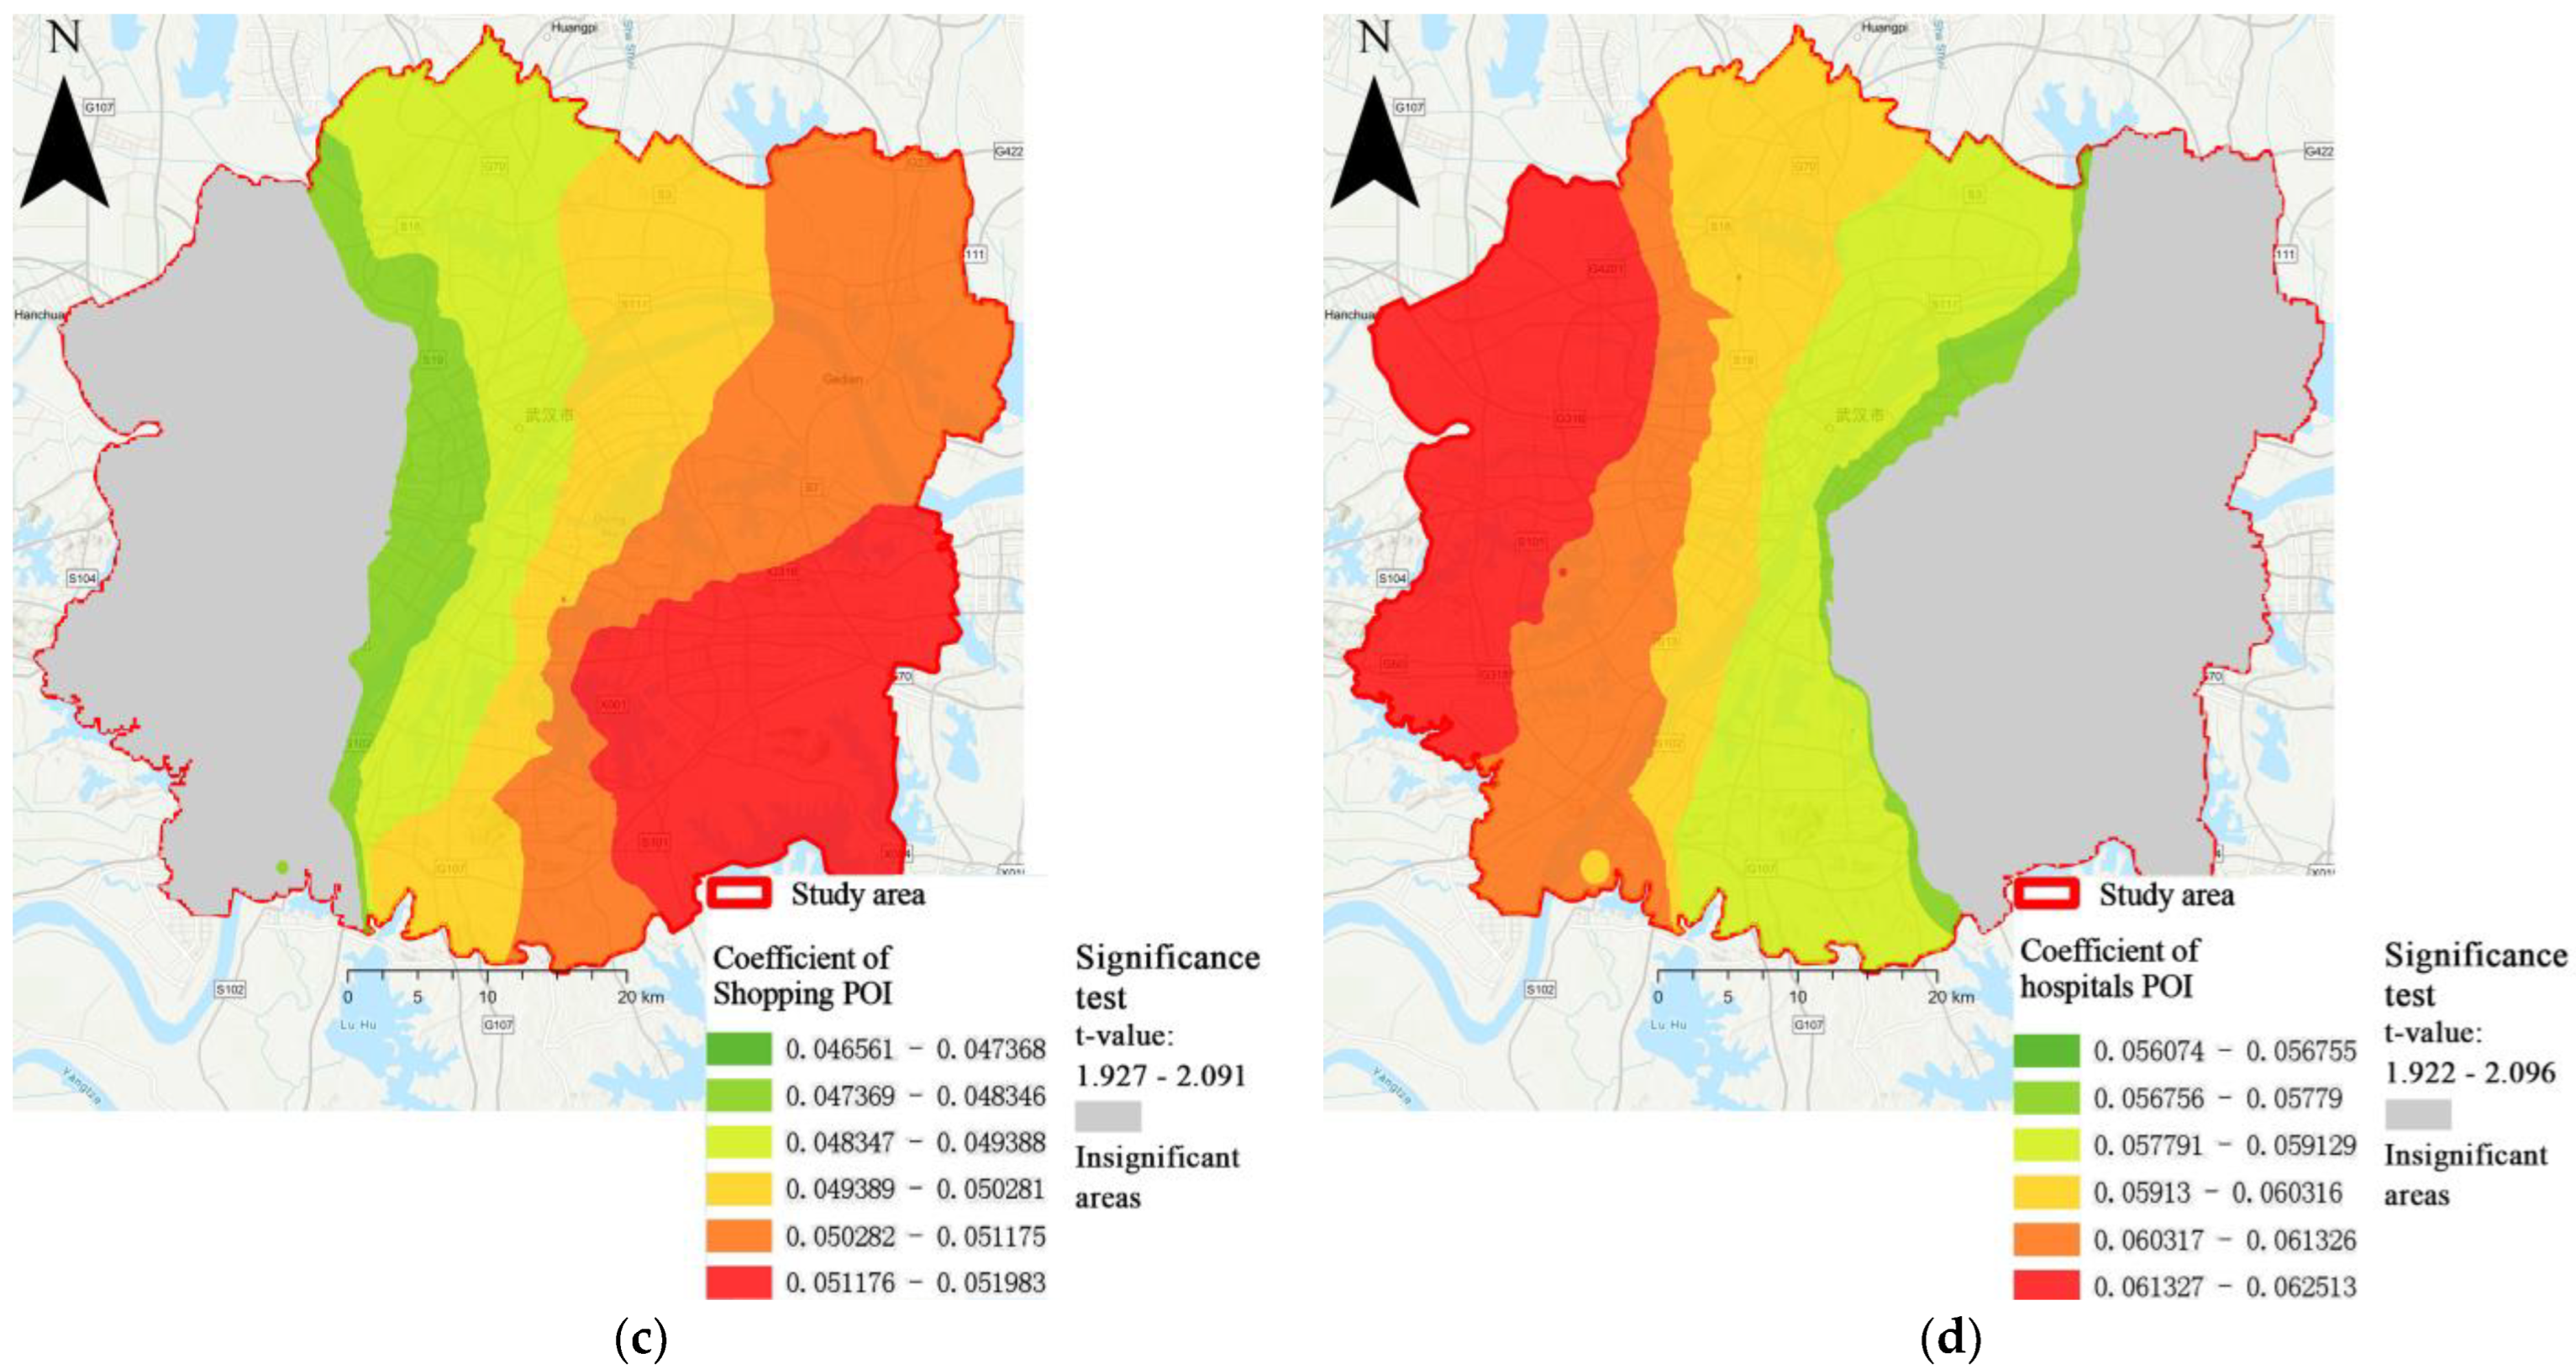
4.4.2. Spatial Heterogeneity of the 15-min Pedestrian-Scale Neighborhood Facilities Supply on the Impact of Daily Travel Carbon Emissions
5. Conclusions and Discussion
Author Contributions
Funding
Data Availability Statement
Acknowledgments
Conflicts of Interest
References
- IEA. CO2 Emissions from Fuel Combustion Highlights; IEA: Paris, France, 2019. [Google Scholar]
- Yang, S.; He, L.Y. Fuel demand, road transport pollution emissions and residents’ health losses in the transitional China. Transp. Res. Part D Transp. Environ. 2016, 42, 45–59. [Google Scholar] [CrossRef]
- Cao, X.; Yang, W. Examining the effects of the built environment and residential self-selection on commuting trips and the related CO 2 emissions: An empirical study in Guangzhou, China. Transp. Res. Part D Transp. Environ. 2017, 52, 480–494. [Google Scholar] [CrossRef]
- Wu, X.; Tao, T.; Cao, J.; Fan, Y.; Ramaswami, A. Examining threshold effects of built environment elements on travel-related carbon-dioxide emissions. Transp. Res. Part D Transp. Environ. 2019, 75, 1–12. [Google Scholar] [CrossRef]
- Ao, Y.; Zhou, Z.; Wang, Y. Progress of research on the impacts of built environment on travel carbon emissions. Sci. Technol. Rev. 2022, 40, 94–105. [Google Scholar]
- Ewing, R.; Cervero, R. Travel and the Built Environment. J. Am. Plan. Assoc. 2010, 76, 265–294. [Google Scholar] [CrossRef]
- Stevens, M.R. Does Compact Development Make People Drive Less? J. Am. Plan. Assoc. 2016, 83, 7–18. [Google Scholar]
- Zhang, W.; Lu, D.; Zhao, Y.; Luo, X.; Yin, J. Incorporating polycentric development and neighborhood life-circle planning for reducing driving in Beijing: Nonlinear and threshold analysis. Cities 2022, 121, 103488. [Google Scholar] [CrossRef]
- Allam, Z.; Nieuwenhuijsen, M.; Chabaud, D.; Moreno, C. The 15-minute city offers a new framework for sustainability, liveability, and health. Lancet Planet. Health 2022, 6, E181–E183. [Google Scholar] [CrossRef]
- Moreno, C.; Allam, Z.; Chabaud, D.; Gall, C.; Pratlong, F. Introducing the “15-Minute City”: Sustainability, Resilience and Place Identity in Future Post-Pandemic Cities. Smart Cities 2021, 4, 93–111. [Google Scholar] [CrossRef]
- Xiao, Z.; Chai, Y.; Yan, Z. Overseas Life Circle Planning and Practice. Planners 2014, 10, 93–94. [Google Scholar]
- Yifan, Y.U. From Traditional Residential Area Planning to Neighborhood Life Circle Planning. City Plan. Rev. 2019, 43, 17–22. [Google Scholar]
- Wu, H.; Wang, L.; Zhang, Z.; Gao, J. Analysis and optimization of 15-minute community life circle based on supply and demand matching: A case study of Shanghai. PLoS ONE 2021, 16, e0256904. [Google Scholar] [CrossRef]
- Luo, X.; Zhang, W.; Chai, Y. Research on threshold effects of built environment settings in 15-minute life-circles. Geogr. Res. 2022, 41, 2155–2170. [Google Scholar]
- Yang, W.; Cao, X. Examining the effects of the neighborhood built environment on CO2 emissions from different residential trip purposes: A case study in Guangzhou, China. Cities 2018, 81, 24–34. [Google Scholar] [CrossRef]
- Ma, J.; Liu, Z.; Chai, Y. The impact of urban form on CO2 emission from work and non-work trips: The case of Beijing, China. Habitat Int. 2015, 47, 1–10. [Google Scholar] [CrossRef]
- Zhou, M.; Wang, D.; Guan, X. Co-evolution of the built environment and travel behaviour in Shenzhen, China. Transp. Res. Part D Transp. Environ. 2022, 107, 103291. [Google Scholar] [CrossRef]
- Cao, J. Examining the Relationship between Neighborhood Built Environment and Travel Behavior: A Review from the US Perspective. Urban Plan. Int. 2015, 30, 46–52. [Google Scholar]
- Wang, D.; Lin, T. Residential self-selection, built environment, and travel behavior in the Chinese context. J. Transp. Land Use 2014, 7, 5–14. [Google Scholar] [CrossRef]
- Guan, X.D.; Wang, D.G. Residential self-selection in the built environment-travel behavior connection: Whose self-selection? Transp. Res. Part D-Transp. Environ. 2019, 67, 16–32. [Google Scholar] [CrossRef]
- Wolday, F.; Næss, P.; Cao, X.Y. Travel-based residential self-selection: A qualitatively improved understanding from Norway. Cities 2019, 87, 87–102. [Google Scholar] [CrossRef]
- Ding, C.; Cao, X.; Yu, B.; Ju, Y. Non-linear associations between zonal built environment attributes and transit commuting mode choice accounting for spatial heterogeneity. Transp. Res. Part A Policy Pract. 2021, 148, 22–35. [Google Scholar] [CrossRef]
- Rong, P.; Zhang, L.; Qin, Y.; Xie, Z.; Li, Y. Spatial differentiation of daily travel carbon emissions in small- and medium-sized cities: An empirical study in Kaifeng, China. J. Clean. Prod. 2018, 197, 1365–1373. [Google Scholar] [CrossRef]
- Liu, T.B.; Chai, Y.W. Daily life circle reconstruction: A scheme for sustainable development in urban China. Habitat Int. 2015, 50, 250–260. [Google Scholar] [CrossRef]
- Gower, A.; Grodach, C. Planning Innovation or City Branding? Exploring How Cities Operationalise the 20-Minute Neighbourhood Concept. Urban Policy Res. 2022, 40, 36–52. [Google Scholar]
- Balletto, G.; Ladu, M.; Milesi, A.; Borruso, G. A Methodological Approach on Disused Public Properties in the 15-Minute City Perspective. Sustainability 2021, 13, 593. [Google Scholar] [CrossRef]
- Abdelfattah, L.; Deponte, D.; Fossa, G. The 15-minute city: Interpreting the model to bring out urban resiliencies. Transp. Res. Procedia 2022, 60, 330–337. [Google Scholar]
- Sisson. How the ‘15-Minute City’ Could Help Post-Pandemic Recovery. Bloom. CityLab 2020, 16, 2020. [Google Scholar]
- GB50180-2018; Standard for Urban Residential Area Planning and Design. National standards of the People’s Republic of China, Ministry of Housing and Urban-Rural Development: Beijing, China, 2018.
- Shen, Z.; Lin, X.; Yan, M. On the Combination of Japanese Urban Master Plan and “Life Circle” Concept in Recent Years. Urban Rural. Plan. 2018, 6, 74–87. [Google Scholar]
- Huang, J.; Zhang, R.; Gangyu, H. A Research of the Elderly’s Daily Life Circle Based on Spatial-Temporal Behavior—Analysis of Place Recognition and Spatial Features. Urban Plan. Forum 2019, 3, 87–95. [Google Scholar] [CrossRef]
- Zhao, P.; Luo, J.; Hu, H. Character of the Elderly’s Life Circle and Public Service Facilities Configuration by Using Big Data: A Case of Beijing. Sci. Geogr. Sin. 2022, 42, 1176–1186. [Google Scholar]
- Ewing, R.; Cervero, R. Travel and the built environment—A synthesis. Transp. Res. Rec. 2001, 1780, 87–114. [Google Scholar] [CrossRef]
- Cao, X.; Mokhtarian, P.L.; Handy, S.L. The relationship between the built environment and nonwork travel: A case study of Northern California. Transp. Res. Part A Policy Pract. 2009, 43, 548–559. [Google Scholar] [CrossRef]
- Handy, S.L.; Boarnet, M.G.; Ewing, R.; Killingsworth, R.E. How the built environment affects physical activity: Views from urban planning. Am. J. Prev. Med. 2002, 23, 64–73. [Google Scholar] [CrossRef]
- Cervero, R.; Kockelman, K. Travel Demand and the 3Ds: Density, Design And Diversity. Transp. Res. Part D Transp. Environ. 1997, 2, 199–219. [Google Scholar] [CrossRef]
- Brownstone, D.; Golob, T.F. The impact of residential density on vehicle usage and energy consumption. J. Urban Econ. 2009, 65, 91–98. [Google Scholar] [CrossRef]
- Barla, P.; Miranda-Moreno, L.F.; Lee-Gosselin, M. Urban travel CO2 emissions and land use: A case study for Quebec City. Transp. Res. Part D Transp. Environ. 2011, 16, 423–428. [Google Scholar] [CrossRef]
- Xin, W.; Khattak, A.; Zhang, Y. Is Smart Growth Associated with Reductions in Carbon Dioxide Emissions? Transp. Res. Rec. J. Transp. Res. Board 2013, 2375, 62–70. [Google Scholar]
- Zahabi, S.A.H.; Miranda-Moreno, L.; Patterson, Z.; Barla, P. Transportation Greenhouse Gas Emissions and its Relationship with Urban Form, Transit Accessibility and Emerging Green Technologies: A Montreal case study. In Proceedings of the 15th Meeting of the Euro-Working-Group-on-Transportation (EWGT), Cite Descartes, Paris, France, 10–13 September 2012. [Google Scholar]
- Hong, J.; Goodchild, A. Land use policies and transport emissions: Modeling the impact of trip speed, vehicle characteristics and residential location. Transp. Res. Part D Transp. Environ. 2014, 26, 47–51. [Google Scholar] [CrossRef]
- Yang, W.Y.; Li, T.; Cao, X. Examining the impacts of socio-economic factors, urban form and transportation development on CO2 emissions from transportation in China: A panel data analysis of China’s provinces. Habitat Int. 2015, 49, 212–220. [Google Scholar] [CrossRef]
- Cervero, R.B. Linking urban transport and land use in developing countries. J. Transp. Land Use 2013, 6, 7–24. [Google Scholar] [CrossRef]
- Yang, J.; He, D.-Q.; Christopher, Z. Impact of Neighborhood Land Use on Residents Travel Energy Consumption Urban Transp. China 2011, 9, 21–29. [Google Scholar]
- Xiao, Z.P.; Chai, Y.; Liu, Z. Quantitative Distribution and Related Factors for Household Daily Travel CO2 Emissions in Beijing. Urban Stud. 2011, 18, 104–112. [Google Scholar]
- Wang, Y.; Chen, W.; Kang, Y.; Li, W.; Guo, F. Spatial correlation of factors affecting CO2 emission at provincial level in China: A geographically weighted regression approach. J. Clean. Prod. 2018, 184, 929–937. [Google Scholar] [CrossRef]
- Li, C.; Li, H.; Qin, X. Spatial Heterogeneity of Carbon Emissions and Its Influencing Factors in China: Evidence from 286 Prefecture-Level Cities. Int. J. Environ. Res. Public Health 2022, 19, 1226. [Google Scholar] [CrossRef] [PubMed]
- Ding, C.; Cao, X.; Næss, P. Applying gradient boosting decision trees to examine non-linear effects of the built environment on driving distance in Oslo. Transp. Res. Part A Policy Pract. 2018, 110, 107–117. [Google Scholar] [CrossRef]
- Ding, C.; Cao, X.; Wang, Y. Synergistic effects of the built environment and commuting programs on commute mode choice. Transp. Res. Part A Policy Pract. 2018, 118, 104–118. [Google Scholar] [CrossRef]
- World Resources Institute. Wuhan Transport Sector Carbon Emissions Roadmap Study; World Resources Institute: Washington, DC, USA, 2019. [Google Scholar]
- Rogerson, P.A. The Detection of Clusters Using a Spatial Version of the Chi-Square Goodness-of-Fit Statistic. Geogr. Anal. 1999, 31, 130–147. [Google Scholar] [CrossRef]
- Jackson, M.C.; Waller, L. Exploring goodness-of-fit and spatial correlation using components of Tango’s index of spatial clustering. Geogr. Anal. 2005, 37, 371–382. [Google Scholar] [CrossRef]
- Jackson, M.; Huang, L.; Xie, Q.; Tiwari, R. A modified version of Moran’s I. Int. J. Health Geogr. 2010, 9, 33. [Google Scholar] [CrossRef]
- Ord, J.K.; Getis, A. Testing for Local Spatial Autocorrelation in the Presence of Global Autocorrelation. J. Reg. Sci. 2001, 41, 411–432. [Google Scholar] [CrossRef]
- Fan, C.; Myint, S. A comparison of spatial autocorrelation indices and landscape metrics in measuring urban landscape fragmentation. Landsc. Urban Plan. 2014, 121, 117–128. [Google Scholar] [CrossRef]
- Brunsdon, C.; Fotheringham, A.S.; Charlton, M.E. Geographically Weighted Regression: A Method for Exploring Spatial Nonstationarity. Geogr. Anal. 1996, 28, 281–298. [Google Scholar] [CrossRef]
- Yu, H.; Fotheringham, A.S.; Li, Z.; Oshan, T.; Kang, W.; Wolf, L.J. Inference in Multiscale Geographically Weighted Regression. Geogr. Anal. 2019, 52, 87–106. [Google Scholar] [CrossRef]
- Yang, W.; Fotheringham, A.; Harris, P. An Extension of Geographically Weighted Regression with Flexible Bandwidths. In Proceedings of the GISRUK 2012, Lancaster, UK, 11–13 April 2012. [Google Scholar]
- Zang, P.; Qiu, H.; Xian, F.; Yang, L.; Qiu, Y.; Guo, H. Nonlinear Effects of the Built Environment on Light Physical Activity among Older Adults: The Case of Lanzhou, China. Int. J. Environ. Res. Public Health 2022, 19, 8848. [Google Scholar] [CrossRef]
- Hu, Y.; Sobhani, A.; Ettema, D. Exploring commute mode choice in dual-earner households in a small Chinese city. Transp. Res. Part D Transp. Environ. 2021, 102, 103148. [Google Scholar] [CrossRef]


| Year | Zone | Resident Population and Scale | Survey Population and Household Size | Sample Rate |
|---|---|---|---|---|
| 1987 | Main urban area | 330,000 people 940,000 households | — | — |
| 1998 | Main urban area | 3,810,000 people 150,000 households | 76,000 people 24,000 households | 2.0% |
| 2008 | City area | 870,000 people 200,000 households | 120,000 people 38,000 households | 1.5% |
| 2020 | City area | 12,320,000 people 4,080,000 households | 40,000 people 15,000 households | 0.5% |
| Traffic Category | Means of Transportation | Carbon Emission Coefficient (g/(km per Person)) |
|---|---|---|
| Small cars | Private car, unit car, car rental | 135 |
| Bus class | Bus and unit shuttle bus | 50 |
| Rail transportation category | Subway | 9.1 |
| Personal assistance class | Electric bicycle/moped, light motorcycle | 8 |
| Others | Walking, cycling | 0 |
| Variables | Description | Mean. | Std. | Min | Max | |||
|---|---|---|---|---|---|---|---|---|
| Dependent variable | Commuting CO2 emissions | Daily commute CO2 emissions | Commuting carbon emissions per respondent per day (in grams) | 808.666 | 895.367 | 0.000 | 11,043.740 | |
| Independent variable | Built environment | District Location | Distance from the city center | Distance to Hankou, the first-class urban center of Wuhan (in km) | 9.135 | 7.400 | 0.134 | 38.805 |
| Public transport accessibility | Distance to nearest public transport stop | Distance (in km) from the respondent’s residence to the nearest bus stop (both metro and surface bus) | 0.240 | 0.334 | 0.002 | 9.461 | ||
| Number of public transport stations | Number of public transport stops within a 15-min pedestrian-scale neighborhood of the respondent | 51.157 | 34.363 | 0.000 | 151.000 | |||
| Density | Population density | Residential density (persons/km2) within a 15-min pedestrian-scale neighborhood of respondents | 25,453.881 | 17,154.969 | 36.518 | 72,108.063 | ||
| Job density | Job density (persons/km2) within a 15-min pedestrian-scale neighborhood of respondents | 16,970.961 | 11,015.509 | 259.746 | 46,206.179 | |||
| Land use intensity | Floor area ratio of sites within a 15-min pedestrian-scale neighborhood of the respondent | 3.108 | 1.428 | 0.010 | 5.972 | |||
| Design | Intersection density | Density of intersections of four or more roads within a 15-min pedestrian-scale neighborhood of respondents (pcs/km2) | 17.178 | 9.796 | 0.667 | 53.186 | ||
| Road network density | Density of the road network within a 15-min pedestrian-scale neighborhood of the respondent (in km/km2) | 7.162 | 3.559 | 0.008 | 42.256 | |||
| Diversity | Land use mixed entropy index | Mixed entropy of land use within a 15-min pedestrian-scale neighborhood of respondents | 0.695 | 0.097 | 0.000 | 0.967 | ||
| Facility supply | Educational facilities | Density of schools and educational institutions | Density of schools and educational institutions POI points within a 15-min pedestrian-scale neighborhood of respondents | 8.468 | 5.371 | 0.000 | 26.696 | |
| Medical facilities | Density of hospitals and other medical institutions | Density of hospitals and other medical institutions POI points within a 15-min pedestrian-scale neighborhood of respondents | 7.739 | 5.735 | 0.000 | 25.280 | ||
| Shopping facilities | Density of shopping malls and other shopping places | Density of shopping malls and other shopping places POI points within a 15-min pedestrian-scale neighborhood of respondents | 7.677 | 5.000 | 0.000 | 26.691 | ||
| Enterprise and government department | Density of enterprises and government departments | Density of enterprises and government departments POI points within a 15-min pedestrian-scale neighborhood of respondents | 67.828 | 46.857 | 0.000 | 278.163 | ||
| Economic characteristics | House price | Average of house prices within 15-min pedestrian-scale neighborhood (CNY) | 17,130.571 | 5371.632 | 4881.000 | 44,688.000 | ||
| Variables | Moran‘s I | Z Score | p-Value |
|---|---|---|---|
| Daily travel carbon emissions | 0.236 * | 53.253 | 0.000 |
| Distance to the urban center | 0.925 * | 207.868 | 0.000 |
| Distance to nearest public transport stop | 0.326 * | 76.697 | 0.000 |
| Number of public transport stations | 0.494 * | 111.080 | 0.000 |
| Population density | 0.562 * | 126.307 | 0.000 |
| Job density | 0.597 * | 134.042 | 0.000 |
| Land use intensity | 0.595 * | 133.728 | 0.000 |
| Intersection density | 0.518 * | 116.371 | 0.000 |
| Road network density | 0.037 * | 8.460 | 0.000 |
| Land use mixed entropy index | 0.212 * | 47.604 | 0.000 |
| Density of schools and educational institutions | 0.445 * | 99.883 | 0.000 |
| Density of hospitals and other medical institutions | 0.471 * | 105.870 | 0.000 |
| Density of shopping malls and other shopping places | 0.447 * | 100.412 | 0.000 |
| Density of enterprises and government departments | 0.453 * | 101.702 | 0.000 |
| House price | 0.633 * | 142.245 | 0.000 |
Disclaimer/Publisher’s Note: The statements, opinions and data contained in all publications are solely those of the individual author(s) and contributor(s) and not of MDPI and/or the editor(s). MDPI and/or the editor(s) disclaim responsibility for any injury to people or property resulting from any ideas, methods, instructions or products referred to in the content. |
© 2023 by the authors. Licensee MDPI, Basel, Switzerland. This article is an open access article distributed under the terms and conditions of the Creative Commons Attribution (CC BY) license (https://creativecommons.org/licenses/by/4.0/).
Share and Cite
Guo, L.; Cheng, W.; Liu, C.; Zhang, Q.; Yang, S. Exploring the Spatial Heterogeneity and Influence Factors of Daily Travel Carbon Emissions in Metropolitan Areas: From the Perspective of the 15-min City. Land 2023, 12, 299. https://doi.org/10.3390/land12020299
Guo L, Cheng W, Liu C, Zhang Q, Yang S. Exploring the Spatial Heterogeneity and Influence Factors of Daily Travel Carbon Emissions in Metropolitan Areas: From the Perspective of the 15-min City. Land. 2023; 12(2):299. https://doi.org/10.3390/land12020299
Chicago/Turabian StyleGuo, Liang, Wenjun Cheng, Chang Liu, Qinghao Zhang, and Shuo Yang. 2023. "Exploring the Spatial Heterogeneity and Influence Factors of Daily Travel Carbon Emissions in Metropolitan Areas: From the Perspective of the 15-min City" Land 12, no. 2: 299. https://doi.org/10.3390/land12020299
APA StyleGuo, L., Cheng, W., Liu, C., Zhang, Q., & Yang, S. (2023). Exploring the Spatial Heterogeneity and Influence Factors of Daily Travel Carbon Emissions in Metropolitan Areas: From the Perspective of the 15-min City. Land, 12(2), 299. https://doi.org/10.3390/land12020299