Abstract
Increasing urbanization and climate change challenges are leading to relevant environmental, economic and social pressures on European cities. These include increasing flood hazards and the urban heat island (UHI) effect. Nature-Based Solutions (NBS) are increasingly recognized within strategies to provide multiple ecosystem services to mitigate existing risks and pressures, as well as to make cities more resilient and livable. Although being increasingly addressed within the literature, NBS implementation on the ground still faces many technical and financial barriers. This paper aims to test the potential of selected NBS in mitigating the effects of identified climate change risks, i.e., the UHI effect and urban floods, in the Turin urban area (north-western Italy). Four different intervention NBS-based scenarios are developed. The supply of ecosystem services by NBS in each scenario is assessed using InVEST models and the effectiveness of NBS investments is analyzed by calculating and comparing the associated costs and benefits. Different results in terms of effectiveness and economic viability are observed for each scenario and each NBS. Flood risk mitigation oriented NBS seem to have the most impact, in particular forested green areas and retention ponds. The results are relevant to suggest policy mix strategies to embed NBS in city planning.
1. Introduction
According to the United Nations Department of Economic and Social Affairs (UN DESA), for the first time in history, more than 55% of the world’s population lives in urban areas with a forecasted increase up to 68–84% in Europe—by 2050 [1]. Urbanisation and the increasing urban population lead to several environmental, social and economic challenges that might result in negative impacts on the well-being of citizens and the environment as a whole [2,3,4]. Soil sealing, due to the covering of ground by construction and artificial materials, is one of the prevalent and challenging forms of soil degradation associated with urban development and expansion [5]. It significantly modifies land use and land cover characteristics, impacting both terrain and atmospheric conditions [6,7], and often results in changes to the microclimatic dynamics within and around urban areas [5]. Among current and future challenges faced by cities, climate change-related ones play a major role [8]. These include flood hazards deriving from soil sealing, which alter the hydrological cycle of cities by increasing the impervious areas and, thereby, reducing the interception, storage and infiltration capacity of rainwater vis-à-vis mutable precipitation patterns associated with climate change, and in particular the occurrence of high-intensity short-duration rainfall events [9,10,11]. Development processes and land use variation associated with urbanization are also among drivers of the urban heat island (UHI) effect [12,13], which causes the rise in temperatures within cities compared to the surrounding rural areas [14]. The frequency and intensity of heatwaves are expected to rise in the near future [15,16] with relevant impacts on human health [17,18], increasing mortality or morbidity, especially for vulnerable categories (e.g., the elderly, children, homeless). The UHI effect also leads to increased energy consumption due to air conditioning [19] and occupational heat stress, reducing comfort and work productivity [20]. Adequate planning and management measures, effective in the short and long term, are needed for climate change adaptation and mitigation of the associated risks (disaster risk reduction). By mimicking the processes of natural ecosystems, Nature-Based Solutions (NBS) are increasingly recognized as possible solutions to mitigate these pressures due to their potential to provide multiple ecosystem services [11,21,22,23], supporting societies in achieving more resilient, livable and sustainable cities [24,25]. NBS is an umbrella term referred to different kinds of interventions [26,27], and this concept has been included within a substantial body of scientific literature since its inception in 2015 [28]. Giving its accelerated uptake, many definitions have arisen in the past years [29], highlighting the complexity and dynamism of the NBS, the existence of a non-univocal terminology, the presence of multiple solutions and variants, as well as a lack of consolidated agreement on the conceptualization of NBS [30].
A broad, though not exhaustive, list of interventions classified as NBS can be found in [31]. The nomenclature used is also different among sectors and professions (e.g., urban planning, building/construction engineering or green space management). In particular, as an example, between the interventions aimed at urban water management that may fall under the NBS group, depending on their design, there are: sustainable drainage systems (SuDS), low impact development (LID), stormwater best management practices (BMPs), and storm water control measures (SCMs) [32].
The recent resolution 5 by the United Nations Environment Assembly (UNEA-5 resolution) (2022) makes a relevant effort to harmonize the definition, stating that NBSs are “actions to protect, conserve, restore, sustainably use and manage natural or modified terrestrial, freshwater, coastal and marine ecosystems which address social, economic and environmental challenges effectively and adaptively, while simultaneously providing human well-being, ecosystem services, resilience and biodiversity benefits” [33].
In the last decade NBS have gained increasing visibility within international and national policies, being given special emphasis by the European Commission. NBS are directly or indirectly referred to, among others, in the Strategy for Biodiversity to 2030, the Strategy for Green Infrastructures, the new European Forest Strategy, the Land Use, Land Use Change and Forestry (LULUCF) Regulation, the Community Agricultural Policy, the Water Directive, the Strategy on Adaptation to Climate Change, and the Action Plan for the Implementation of the Sendai Framework for Disaster Risk Reduction, etc.
NBS can contribute to providing ecological, social and economic benefits in urban areas [34,35,36,37]. They can absorb air pollutants [38], sequester CO2 [39] and improve flood control and water resource management [40], as well as water treatment [41] and lowering the temperature within cities [42] and their surroundings [43,44]. Indeed, the strategical introduction of vegetation and water bodies as green and blue infrastructures within cities can reduce surface and air temperatures through shading, evapotranspiration and evaporation [45]. NBS can prevent natural hazard and climate extremes while contributing to climate change mitigation [46], and can sustain or enhance biodiversity [47,48]. Furthermore, NBS can contribute to quality of life and people’s wellbeing [49] in terms of, for instance, recreation, sporting activities and healthier lifestyles [50], citizens physical and mental conditions [51,52,53,54], social inclusion and relations [55], and reinforcement of cultural identities and aesthetic value [56]. Overall, there is some evidence about the NBS capacity to be more cost-effective compared to grey infrastructures and other more traditional solutions [57]. NBSs can contribute to improving the resilience of urban systems [58], generating economic benefits in the long term, and creating healthier local economies [59]. Although academic research is increasingly recognizing NBS potentialities, there are still wide barriers to their implementation and upscaling in urban areas [60]. Among these, there are financing constraints [61] and difficulties in creating feasible governance models to design and implement efficient projects that match the participation of all the relevant stakeholders, allowing responsibility sharing and collaboration [62]. Another relevant barrier is represented by the assessment of the whole range of ES that NBS can provide, including co-benefits and trade-offs [63], due to the lack of proper methodologies and standardized accessible data and metrics [25]. Furthermore, conventional valuation and accounting practices do not normally include these benefits [61], undermining the possibility to involve ES production in public, corporate, or individual decision making strategies [64,65], and consequently attracting funding resources, as well as providing efficiency evidence in comparison to more traditional solutions [35,66]. As such, more cases and evidence about the effectiveness and economic value generated by NBS [67] to inform policymakers and implementers could help in the adoption of efficient policies and interventions to preserve and enhance them [68] in urban planning [69].
Building on the above reported aspects, this paper aims to analyze the contribution of selected NBS in improving urban resilience for selected climate change risks, namely the UHI effect and urban floods. The Turin urban area (north-western Italy) is used as a case study. In more detail, the study aims to:
- (i)
- identify a set of NBS specifically intended to face the two selected climate risks;
- (ii)
- define possible combinations of selected NBS and test their effectiveness against the two selected climate risks;
- (iii)
- analyze costs and benefits associated with the different combinations tested;
- (iv)
- draw conclusions that may inform future policy making to support climate-proof urban planning.
The paper is organized into five main sections: Section 1 introduces the research topic as well as the objectives and structure of the article; Section 2 provides information about the case study area and methodological aspects; Section 3 delivers results that are then discussed in Section 4; and finally, Section 5 draws conclusions. The Appendix A and Supplementary Materials provide further data and elaborations developed for the aims of this study.
2. Materials and Methods
This section presents the case study area (Section 2.1) and the methodological approach adopted by the research (Section 2.2).
2.1. Case Study Area
The city of Turin (Piedmont, north-western Italy; Figure 1a) is located within the Po Valley and extends over a flat urban area (239 m asl) embraced by the river Po and three of its tributaries at the foot of hills reaching up to 715 m asl [70]. It stretches over a total area of about 130 km2 and there are 848,196 inhabitants within its municipal boundaries [71]. Piedmont ranks fourth among Italian regions with the highest annual soil sealing [72], i.e., man-induced replacement of non-artificial land cover (agricultural, natural or semi-natural land) with artificial [73]. Despite some slowing between 2017 and 2018, Turin has shown a continuously increasing soil sealing trend since 2012, with some 8.43 ha of municipal land being consumed on average every year. At present, the total proportion of soil sealing at the municipal scale corresponds to about 65% of the overall municipal area [74] (Figure 1b).
Land use and soil sealing dynamics, coupled with changing climate conditions, have led to an increased frequency and intensity of extreme events. In 1994, 2000 and 2016, the city suffered severe floods and in 2003 experienced the first emergency status due to intense heat waves, which have increased during the last years [75]. According to Munafò (2022) [72], Turin shows the highest land surface temperature (LST) difference between urban and rural areas in summer (about 6.3 °C) among metropolitan areas in Italy.

Figure 1.
Case study location (a) and Turin urban core main land use classes according to Urban Atlas 2018 [76] (b).
Figure 1.
Case study location (a) and Turin urban core main land use classes according to Urban Atlas 2018 [76] (b).

2.2. Methodological Approach
This study adopted a stepwise approach to test and analyze different sets of NBS to address climate risks in terms of the UHI effect and urban floods within the Turin municipal area. Each methodological step is described below.
(a) Selection of areas under climate risks
Urban areas under climate risks were selected based on the 2020 Climate Resilience Plan developed by the Turin municipality [21]. Reference was made to: (i) areas under moderate to high UHI effect risk, altogether corresponding to about 46% of the total municipal area (Figure 2a); and (ii) medium to high flood-prone areas, defined according to Directive 2007/60/EC on the assessment and management of flood risks and corresponding to about 40% of the total municipal area (Figure 2b). Based on inputs from expert staff at the Turin municipality, this was complemented by parts of the municipal road network subject to floods under frequent and intense precipitation regimes (Figure 2c). All areas under climate risk conditions were identified and mapped using Q-GIS 3.16 [77]. To consider possible spillover effects of the interventions in the surrounding areas, a 200 m-wide buffer was considered around all areas identified through the above-reported criteria and included within areas under climate risks for the aims of this study.
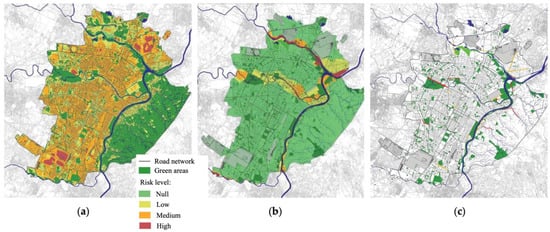
Figure 2.
Distribution of risk classes (null, low, medium and high) for (a) UHI, (b) flooding areas and (c) roads subject to flooding.
(b) Identification and selection of potential NBS
A preliminary screening of available NBS databases and online platforms (e.g., EU Climate Adaptation Platform, Oppla, Urban Nature Atlas, etc.), as well as specialized studies, was conducted, considering both the scientific and the grey literature. By building on these sources, a set of 25 different NBS (see Table A1 in Appendix A for the complete list) was identified, taking into consideration solutions specifically intended to address the UHI effect and/or flood risks. For each selected NBS, key-information was collected and organized into a Microsoft Excel database. Selected NBS were then short-listed via brainstorming with expert staff at the Turin municipality and based on exclusion criteria, including:
- financial viability: very costly solutions were excluded (e.g., vertical urban forests);
- presence of a prevalent green NBS component: solutions with an exclusive or prevalent role of grey components were not considered (e.g., geocellular storage systems);
- direct effects on climate risks: NBS requiring integration into broader solutions to influence climate risks were not considered (e.g., swales). The rationale behind this choice was to analyze single NBS, being able to account separately for their effects.
In a similar manner, NBS that could take several forms were grouped into a single category (e.g., intensive and extensive green roofs were simply reported as green roofs). While this may result in the loss of some details, it was a necessary simplification to ensure totally alternative and comparable scenarios (see the next point), while at the same time keeping modeling and analysis simple and feasible. As a result, 15 NBS were finally selected according to the above reported criteria (Table 1). Brief descriptions of the selected NBS are available in Appendix A (Table A2). For each of the 15 selected NBS, additional information was added to the database with reference to effectiveness against the two targeted climate risks, potential co-benefits, and costs. For the latter, both building and maintenance unit costs (i.e., per m2) were identified from existing NBS databases and the literature. Indirect and general costs, e.g., for designing the NBS or administrative costs, were not considered as it is not possible to standardize them. For the same reason, land acquisition costs were not considered. Values for each NBS were averaged and transformed into annual values assuming two different discount rates (r), i.e., 3% and 5% [78], and a time span to 2030 (Table 1). For each of the selected NBS, a performance assessment was conducted by adapting the assessment from the Natural Water Retention Measures (NWRM) initiative. Building on the NWRM scoring system, each NBS was assigned a score ranging from 0 (no impact) to 3 (high impact), with reference to a set of possible benefits associated with the two climate risks considered within this study. NBS co-benefits—biodiversity conservation, recreational opportunities, etc.—were assessed according to the same approach. Details about NBS assessment are available in Table 2. Assigned scores were revised and validated by expert staff at Turin Municipality. It is important to stress that our analysis was limited to the assessment of two ecosystem services (i.e., temperature regulation to tackle the UHI effect and flood risk mitigation) and additional co-benefits were only preliminarily considered for the analysis and selection of NBS, but not specifically assessed.

Table 1.
Costs of nature-based solutions (NBS).
Table 2.
Performance valuation of NBS.
(c) NBS scenario building
Building on the selected NBS and their features and using a land-use map for the city of Turin, alternative scenarios combining different sets of NBS were built.
Each NBS was associated to one or more current land use category and considered as alternative or complementary to each of them. Scenarios are aimed to achieve specific goals and NBS were selected accordingly. Therefore, in the case of multiple possible NBS, the most effective one as per the targeted goal was chosen based on the information available within the NBS database.
The four scenarios developed are:
- Complete scenario (S1). It includes the most effective NBS with reference to both targeted climate risks and co-benefits. Both alternative and complementary solutions are considered with respect to the current land use.
- Integrative scenario (S2). It includes the most effective NBS with reference to both targeted climate risks and co-benefits. Only complementary solutions are considered with respect to the current land use.
- Flood scenario (S3). It includes the most effective NBS with reference to flood risks. Both alternative and complementary solutions are considered with respect to the current land use.
- UHI scenario (S4). It includes the most effective NBS with reference to the UHI effect risks. Both alternative and complementary solutions are considered with respect to the current land use.
For each scenario, dedicated shapefiles were developed starting from the land-use map and within the scope of areas identified at point a) above. Different shapefiles were created considering both public and private land together, and just public (i.e., municipal) land.
(d) NBS scenario modeling
Climate risks were modeled using InVEST (Integrated Valuation of Ecosystem Services and Tradeoffs) 3.9.0 models for urban ecosystem services, i.e., the “Urban Cooling” and the “Urban Flood Risk Mitigation” models. For the former, the “Weighted Factors” method was selected. To account for the ability of green space to regulate temperature, the model calculates the heat mitigation index (HMI)—as a weighted function of shading, evapotranspiration and albedo assigned to different land-use and cover categories—which is then used to estimate the average cooling capacity on air temperature and monetary value associated with the vegetation cooling. HMI ranges between 0 (no cooling effect) and 1 (highest cooling effect), and areas with high HMI are more resilient to the higher temperatures associated with the UHI effect [79,80]. The model also calculates the energy saved for building cooling and conditioning thanks to the vegetation cooling capacity. As regards the Urban Flood Risk Mitigation model, the economic value of the service was estimated via the cost of substitute goods [81] using lamination basins as substitutes. Technical details about the models are available within the online InVEST User’s Guide [79]. Models were fed using data summarized in Appendix A (Table A3) and run for both the current land use conditions (baseline) and each scenario, distinguishing between total (i.e., both public and private) area and just public ones.
(e) NBS scenario analysis
Biophysical and economic values of targeted ecosystem services (i.e., temperature regulation and flood mitigation) were computed for each NBS under each scenario, finally summing up values for all NBS implemented under each scenario. Model results were analyzed by comparing outcome values for the baseline and the different scenarios to obtain the measurement of the mitigation impact generated by the NBS implementation. Furthermore, to evaluate the feasibility and economic convenience of the selected NBS, economic benefits resulting from modeling were compared with the NBS building (or planting) and maintenance costs (up to year 2030), as indicated in Table 1. Again, this analysis was conducted for each of the four scenarios, for total and only public areas, as well as for each individual NBS.
3. Results
Results presented in this section focus on the last three steps of the methodological approach, i.e., NBS scenario building (Section 3.1), modeling (Section 3.2) and analysis (Section 3.3).
3.1. NBS Scenario Building
The four scenarios show different NBS mixes, as well as a different total land use by implemented measures. S1 includes 11 different types of NBS, S2 includes 10, S3 includes 11 and S4 includes 8. Some NBS among the 15 previously selected were excluded in the development of some scenarios because of their low performance scores in absolute terms or relative to other NBS.
The NBS identified as the most relevant due to their broad spectrum of impacts are forested green areas and roadside trees, followed by infiltration basins, rain gardens and urban gardens. The creation of floodplains and riparian woods has a very high score but at the same time a very limited application potential within the reference context due to limited availability of appropriate areas for its implementation.
The composition and extension of NBS under each scenario, considering total and only public area, is summarized in Figure 3, while Table A4 (in Appendix A) reports detailed data about the spatial distribution of each NBS under different scenarios. Table A4 reports, for all scenarios, the maximum potential areas for the implementation of the identified NBS, areas expected to be actually used for the implementation of each NBS and the relative (%) incidence of the former over the latter. This means, for example, that if for a given NBS all the maximum potential area is expected to be used, the corresponding percentage will be 100%, while if the area expected to be used is smaller than the maximum potential one, the corresponding percentage will be proportionally lower than 100%. Any discrepancies between the maximum potential areas and actual areas (i.e., any case where the percentage is <100%) are due to the fact that it was chosen to implement NBS only on those areas where NBS were expected to perform the best according to their suitability to land use characteristics, as well as considering the specific scenario objectives.
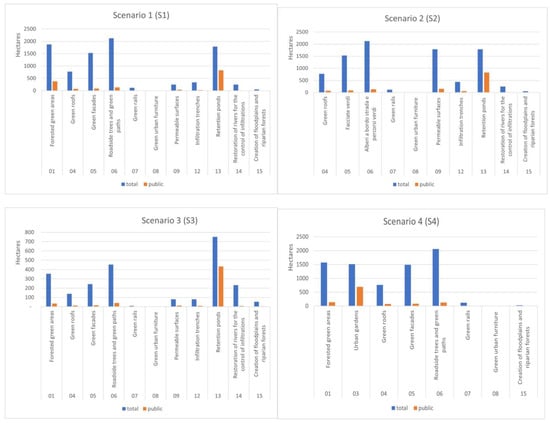
Figure 3.
NBS application areas for each scenario, hectares.
S1 shows the largest area where NBS are expected to be implemented (about 27% of the total municipal area potentially devoted to the development of identified NBS), followed by S2 (26%) and S4 (22%) with similar value, while S3 was the smallest (7%). In the case of green facades, the area reported refers to polygons where this NBS is implemented, but the actual area of intervention considered for the modeling and analysis reported in 3.3 is different. The facades surface has been calculated from data on the perimeter and height of polygons classified as buildings. Due to the lack of more detailed data and information, a precautionary approach was adopted, assuming that green facades are implemented on just one facade per building.
3.2. NBS Scenario Modeling
This section reports the results of the InVEST models applied to the four scenarios.
3.2.1. Temperature Regulation
The InVEST “Urban Cooling” model was run for each of the four scenarios. Since temperature regulation measures operate at a scale that is broader than the one corresponding to intervention areas, the analysis was conducted at the municipal scale and the impact of NBS was then calculated as the difference between each scenario and the baseline (i.e., the current state without additional NBS being implemented).
For all scenarios, the results show an increase in the HMI due to the implementation of the NBS. As expected, total impacts are higher in the case of NBS development considering total (i.e., public and private) areas compared to interventions applied only to public areas (Figure 4a,b). The highest relative increase of the average HMI values is observed for S1 and S2 (both +121%), followed by S4, that presents HMI values more than twice higher than those observed in the baseline. The increase of the HMI for S3 is significantly lower (+27%). Notably, forested green areas play a major role under S1 and S4 in determining HMI peaks and ultimately having a significant influence on changes compared to the baseline.
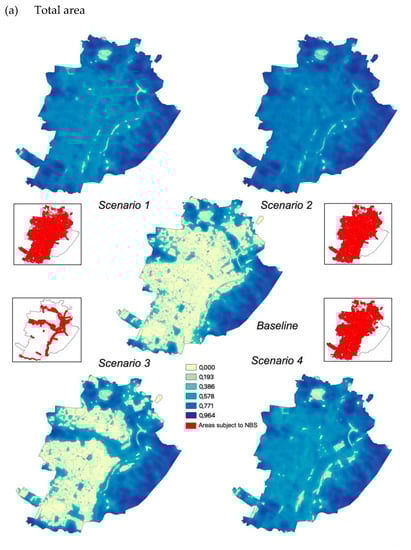
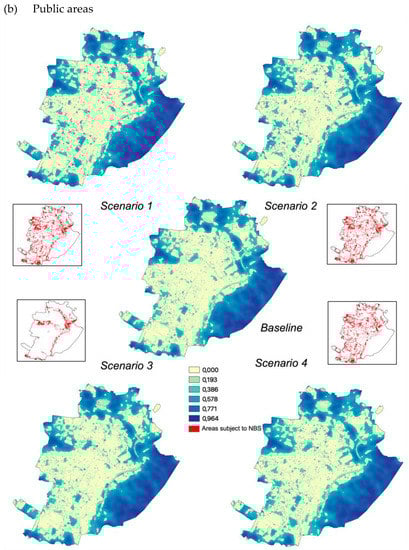
Figure 4.
Heat mitigation index for baseline and the four scenarios on total (a) and public areas only (b).
Where only public areas are considered, the variations are much less pronounced: about a +9% HMI increase for S1 and S2, +6% for S4 and +3% for S3. However, when focusing on the public areas hosting NBS, a significant increase is observed both in terms of the range of values (with an increase in the maximum extreme of the index from 0.85 to 0.96 for all scenarios), and of average value, with which results nearly tripled under all scenarios.
The relative variations of energy consumption saved for building cooling and conditioning are greater for S1, S2 and S3 (up to 6 times the values referred to the baseline, in the case of total areas) and more contained for S3. In general—and with the sole exception of S3—the increases observed with respect to total areas are approximately double compared to those observed for public areas alone. Concerning the economic value of the benefits, more pronounced percentage variations are observed than those found for the HMI, with overall higher variations where only public areas are considered instead of total ones. The results of the “Urban Cooling” model are reported in the summary in Figure 5, and in more detail in Table S1 within the Supplementary Materials.
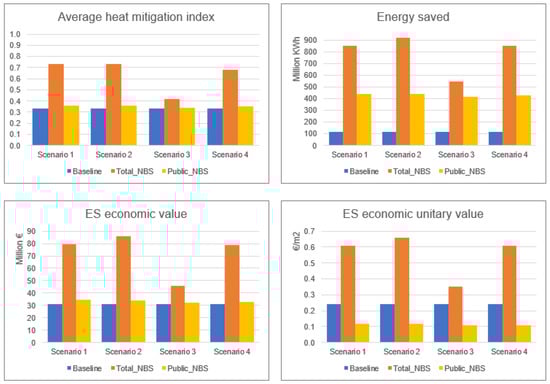
Figure 5.
InVEST Urban Cooling model outputs for the four scenarios applied to the total and public areas.
3.2.2. Protection from Flood Risks
The InVEST “Urban Flood Risk Mitigation” model outputs are strictly referred to the targeted area. Three different values of the rainfall depth parameter (i.e., the amount of rain (mm) fallen in a time (t) equal to one hour) were considered: lower (32.21 mm), intermediate (45.50 mm) and upper (55.32 mm).
Figure 6 shows a summary of the results relating to different values of rain depth, considering both total and only public areas. More details are available within the Supplementary Materials (Table S2).
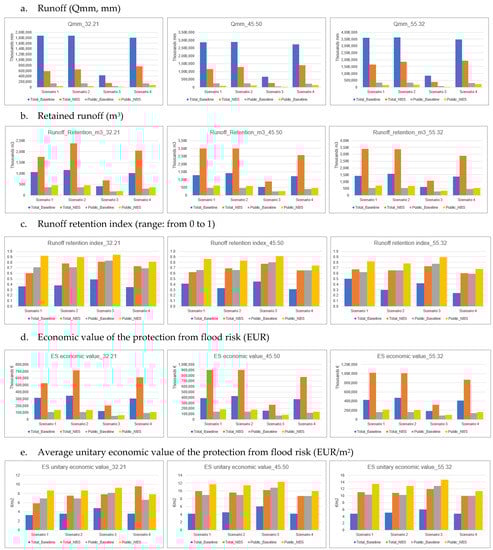
Figure 6.
Summary of the main results of the InVEST Urban Flood Risk Mitigation model applied to the four scenarios in the total and public areas.
Total runoff results (Qmm, expressed in mm, Table S2 within the Supplementary Materials) for the four scenarios and the three rainfall depths are significantly different. While 45.50 mm and 55.32 mm rainfall depths show the highest absolute values for all scenarios, S3 and the 32.21 mm rainfall depth return the lowest ones. The highest runoff value for the 32.21 rain depth is shown by S4, followed by S2 and S1.
However, in terms of runoff reduction relative to the baseline conditions, S1 and S3 stand at similar values (53–69%), though with S1 showing higher relative values, followed by S2 (49–65%) and S4 with systematically lower values (44–58%) compared to all other scenarios (Table S2 within the Supplementary Materials). This is confirmed also when focusing on public areas only.
The average unit runoff (mm of runoff per single m2) observed for the public areas is lower than that observed for the total one.
The highest retained runoff values are observed, respectively, for S2, S1 and S4, and rain amounts equal to 45.50 mm and 55.32 mm, while lower values are reported for S3 considering all the rain amounts, with the lowest value observed in the case of a 32.21 mm rainfall depth. This is associated to higher performances in terms of increased runoff retainment capacity relative to the baseline for S1 and, to a lesser extent, S2 and S4, while S3 shows a lower increase mainly due to a lower contribution, among others, of green roofs and green facades, which are less implemented under this scenario, and a significantly higher baseline compared to the other three scenarios. However, when considering the retention runoff index, i.e., retained runoff relative to rainfall depth (Table S2 within the Supplementary Materials), S3 is systematically characterized by higher values, in particular for a 32.21 mm rainfall depth. On the contrary, S1 shows the lower average value when the total area is considered, and S4 shows the lower one, in particular with a 55.32 mm rainfall depth, when only public areas are made reference to.
Although the total retained runoff is higher when larger areas are targeted by NBS implementation, NBS implemented on public areas are 14–48% more effective in terms of average unit values of retained runoff (i.e., m3 of runoff per single m2).
The economic value of the protection from flood risks provided by the NBS is significantly higher when NBS are implemented over large areas, namely in the case of S1 and S2 and high rainfall depth (55.32 mm). The lower values correspond systematically to S3, both in the case of total and public areas.
The average unit economic value (EUR/m2) increases as rainfall depth increases in all scenarios. The highest average value is observed, both in the case of total and public areas, for S3 (respectively, 12 EUR/m2 and 14.70 EUR/m2), while the lowest values are observed for S1 if considering the total area, and for S4 if considering only the public areas. The average economic unit value of benefits deriving from NBS implemented on public areas shows average unit values 14–48% higher than those delivered by NBS implemented on both public and private areas.
3.3. Scenario Analysis
This section provides summary results concerning the comparison between costs and benefits for the four scenarios, both as aggregated values for the whole set of NBS and per single NBS. The comparison of costs and expected benefits highlights different results for the total (Table 3) and public areas (Table 4). The results are summarized in Figure 7 (total area) and Figure 8 (public areas). Considering the total area, the costs exceed the expected benefits in terms of both temperature regulation and protection from flood risk under all the scenarios considered but S3, which was expressly designed to optimize the performance of NBS with respect to flood risk. For S3, when moving from the low to high rainfall depth values and considering a 3% discount rate, net benefits correspond to EUR 13.2, 75.8 and 124.8 million. When considering a 5% rate, estimated values are EUR 4.8, 67.4 and 116.4 million. The corresponding unit benefits (i.e., per single m2) fall, respectively, in ranges between 0.55–5.16 EUR/m2 and 0.20–4.81 EUR/m2.
Table 3.
Comparison of costs and benefits associated with the implementation of the NBS under each scenario and using two different discount rates—total areas (public and private), EUR/year.
Table 4.
Comparison of costs and benefits associated with the implementation of the NBS under each scenario and using two different discount rates—public areas, EUR/year.
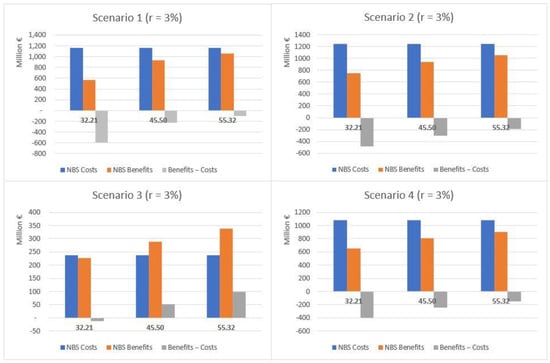
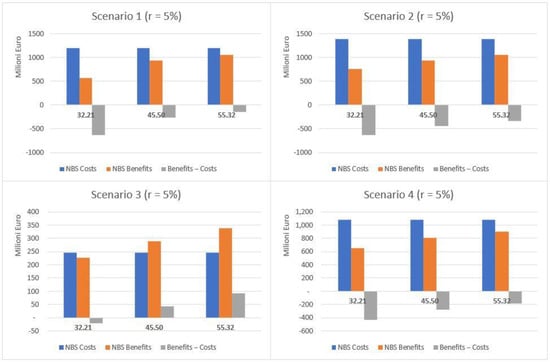
Figure 7.
Comparative analysis of costs and benefits associated with the implementation of NBS under each scenario and using two different discount rates—total area (public and private), EUR/year.
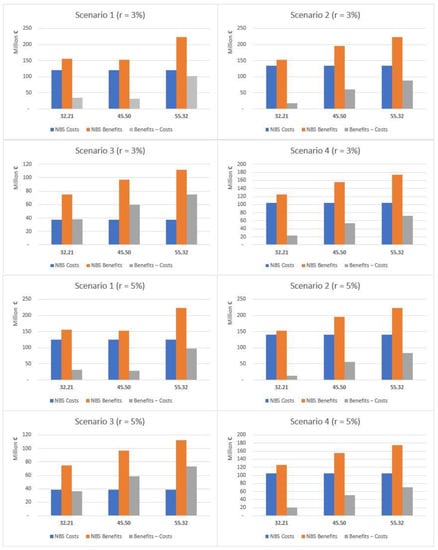
Figure 8.
Comparative analysis of costs and benefits associated with implementation of the NBS selected under each scenario and using two different discount rates—public areas, EUR/year.
Where only NBS implemented in public areas are considered (see Table 4), costs exceed benefits just for UHI effect risks. With reference to the protection from flood risk, benefits exceed costs under all scenarios, regardless of the rainfall depth values considered, when a 3% rate is adopted. Similar results are observed also when a 5% rate is used, except for S2 and a 32.21 mm rainfall depth.
The total net benefits in terms of protection from flood risks fluctuate between EUR 2.4 million (S2, 32.21 mm) and EUR 85.9 million (S1, 55.32 mm) when using a 3% rate, and between EUR 5.4 million (S4, 32.21 mm) and EUR 81.9 million (S1, 55.32 mm) with a 5% rate. The net unit benefits show a maximum value in the case of S3 and a 55.32 mm rainfall depth (10.49 EUR/m2) and a minimum one for S4 and a 32.21 mm rainfall depth (0.69 EUR/m2), when a 3% rate is used. This is also confirmed in the case of a 5% rate (10.26 EUR/m2 and 0.49 EUR/m2, respectively).
If considering the overall net benefits associated to protection from both the UHI effect and flood risk, the net values range between approximately EUR 36.6 million (S2, 32.21 mm) and EUR 120.4 million (S1, 55.32 mm), for a 3% rate, and between EUR 31.5 million (S2, 32.21 mm) and EUR 116.4 million (S1, 55.32 mm), for a 5% rate. The net unit benefits result range between 16.15 EUR/m2 (S3, 55.32 mm) and 2.74 EUR/m2 (S2, 32.21 mm) when using a 3% rate, and between 15.93 EUR/m2 (S3, 55.32 mm) and 2.36 EUR/m2 (S2, 32.21 mm) when using a 5% rate.
A summary of the cost-benefit comparison by single NBS is reported in Figure 9, Figure 10, Figure 11 and Figure 12 and more in detail within the Supplementary Materials (Tables S3–S7). Net benefits are generally found for retention ponds, creation of floodplains and riparian woods, urban gardens (envisaged and assessed under S4 only), forested green areas, roadside trees and green paths, and, finally, green urban furniture.
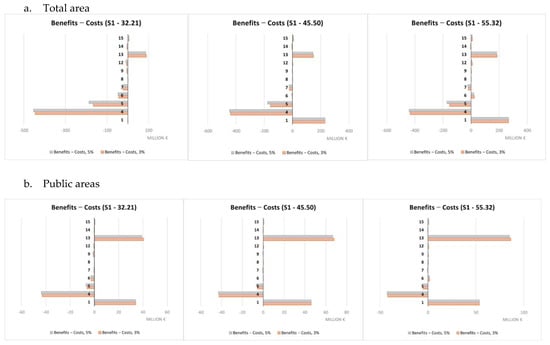
Figure 9.
Costs and benefits relating to individual NBS (S1), EUR millions.
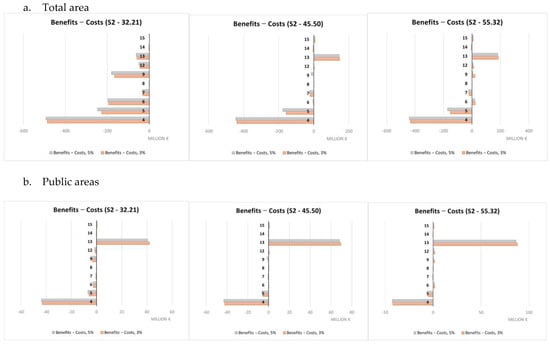
Figure 10.
Costs and benefits relating to individual NBS (S2), EUR millions.
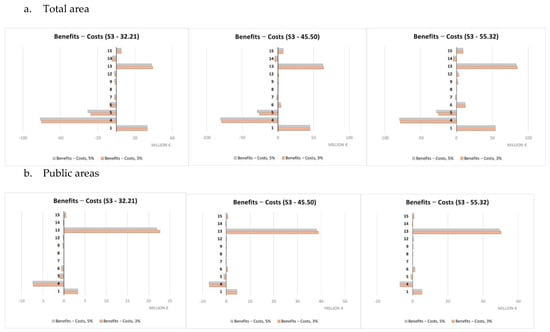
Figure 11.
Costs and benefits relating to individual NBS (S3), EUR millions.
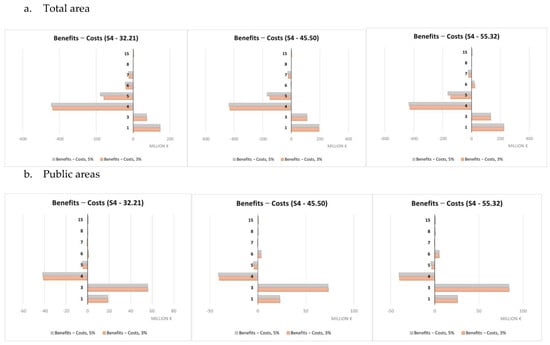
Figure 12.
Costs and benefits relating to individual NBS (S4), EUR millions.
Costs were found to systematically exceed the benefits in the case of green roofs, green facades and green rails.
4. Discussion
The potential of NBS to provide ecosystem services—namely temperature regulation and flood risk mitigation—has been verified via InVEST models considering four possible NBS scenarios in the Turin urban area.
Comparative analysis of the costs and benefits associated to the development of the NBS scenarios has highlighted positive results only for S3 when the total area is considered, thanks to the impact of the protection from flood risks. This service is determinant also when only public areas are considered, and limited scale interventions are selected, ensuring the reach of net benefits associated to the joint implementation of NBS targeted for all the scenarios considered.
The number of NBS generating net benefits increases when passing from a 33.21 mm to a 55.45 mm rainfall depth, due to an increase in benefits against fixed costs. Since different temperature scenarios were not considered, it is not possible to formulate similar considerations with reference to the temperature regulation service and the contrast to the UHI.
The difference in unit value between scenarios is imputable to their different purposes. S3 and S4 aimed at maximizing, respectively, the benefits in terms of protection from flood risks and temperature regulation in contrast to the UHI. So, the difference in value is essentially indicative of the possible trade-offs between the ecosystem service values in the hypothesis of making choices that maximize one of the two ecosystem services separately rather than opting for synergy conditions between them, as in the case of S1 and S2. Different economic performances were observed for single NBS. Net benefits were mainly observed for retention ponds, creation of floodplains and riparian woods, urban gardens, forested green areas, roadside trees and green paths, and finally, green urban furniture. Not considering any technical limitations related to the actual feasibility according to the characteristics of each individual implementation site, these NBS seem to represent a starting set of solutions for any NBS planning/implementation interventions against the risks considered within the Turin urban area. Green roofs and green facades are among the NBS showing costs exceeding benefits in a systematic way. This may be mainly due to the high unit costs associated to their implementation that do not make extensive application, such as those hypothesized here, due to modeling needs, economically worthwhile. Instead, these NBS would require design and implementation in a targeted and specific manner. Results for all other NBS are variable depending on the scenario and rainfall depth considered.
Even if the scope of our study is limited to the assessment of only two specific ecosystem services associated to the implementation of NBS chosen consistently with the two major climatic risks identified for the Turin municipality [21], our results can inform the elaboration of general guidelines for future climate proofing strategies in the study context. First of all, the hypothesis of extensive interventions on public and private areas appears to be practically unrealistic and economically unviable. It is advisable to define criteria for tailoring risk and site-specific interventions, setting priorities for those areas showing higher climate risks. Due to lower transaction costs, the development of NBS over public areas is likely to be easier and cheaper for public authorities. This is consistent with the idea that NBS could be primarily framed within the urban infrastructure domain that traditionally falls within public investments [61]. At the same time, public NBS might be seen as best practices for private owners who could be provided with guidance and support in their choice to implement NBS. Rapid urban development coupled with increasing climate risks and limited public budget, however, may render the involvement of private investors attractive, and sometimes even necessary. This would require coordinated funding between public and private financiers, while potentially making NBS implementation attractive also for private land-owners [82]. Maes and Jacobs (2015), for example, suggest that subsidies and public funds could support the management of NBS by private entities, whenever long-term societal benefits fail to concur with short-term business interests [83].
Difficulties encountered in effectively implementing concrete response measures to climate impacts are attributable not only to “traditional” economic, ecological and technological barriers, but also to political, regulatory and institutional obstacles, as well as to governance and behavioral ones [84]. Following these considerations, the effective selection, design and implementation of NBS should probably rely on a policy mix [85] combining (i) regulatory, (ii) financial (or economic) and (iii) soft (or supportive) instruments ([86,87,88]), inspired by the “sticks, carrots and sermons” metaphor [89]. More specifically this should include (i) regulatory instruments, such as local or higher regulations and constraints, varying from “command and control” regulation to agreements negotiated with a broad range of societal stakeholders [88,90]; (ii) financial instruments, comprising disincentives or incentives, for example, by considering the adoption of the NBS as a condition that allows rewarding elements with respect to the concession for the management of public areas or access to simplifications of technical-administrative practices relating to the management of private areas; and (iii) soft (or supportive) instruments consisting of informational as well as organizational instruments aimed at voluntarily (re)organizing processes [91], such as sharing guidelines, good practices, voluntary agreements by industry or non-hierarchical network opportunities with the government [86]. For example, the adoption and implementation of NBS in public areas to highlight the feasibility and effectiveness of the same, stimulating its adoption also by other actors.
The same concepts are also reflected on the four lines of interventions for urban NBS implementation provided by The Economics of Ecosystems and Biodiversity (TEEB) initiative: (1) information provision—e.g., monitoring activities and environmental accounting; (2) support for cooperation—e.g., between institutions as well as different offices and departments of the same institution, but also between public and private subjects, both at an intra- and inter-municipal scale; (3) the development of planning and guidance tools; and (4) the definition of incentive mechanisms and financial support for NBS adoption [92]. Valuable NBS projects cannot disregard consideration of the local urban structure specificities, such as technical characteristics, but also possible regulatory and administrative constraints and stakeholders’ involvement and preferences in the planning, implementation and monitoring phases. General guidelines and frameworks have been developed by researchers [93] and practitioners, such as the IUCN Global standard [94], to support NBS design and development.
Governing through policy mixes is key to the mainstreaming of urban NBS because complex and large-scale transition needs a long-term, multi-actor and multi-instrumental approach [95,96,97,98]. The delegation of some steering powers to non-governmental actors and the promotion of interactive modes of governance is also an option to be considered [99,100,101]. For example, urban sustainability is increasingly governed through ‘the politics of experimentation’ [102]. The partnering of different actors in the governance of NBS is perceived as a way to reduce barriers/constraints to adopting NBS on a wider scale [34,62]. Participatory approaches are also essential for the effectiveness of NBS, while top-down processes might make the NBS more difficult to accept and inefficient in defining the share of responsibilities to develop a win-win solution [103].
NBS should moreover be framed within an appropriate hierarchy of climate risk management and mitigation interventions, inspired by existing and consolidated models, such as the mitigation hierarchy defined by BPOP and UNEPFI [104]. This defines subsequent steps of intervention, according to a logic of (i) identification and analysis of risks and expected impacts; (ii) avoidance, i.e., measures aimed at avoiding risks and impacts, for example, through preventive actions and planning of interventions; (iii) minimization, i.e., minimization of risks and unavoidable impacts, through targeted design and operational choices; (iv) rehabilitation/restoration, in terms of restoring any compromised functionality upstream or downstream of the interventions; (v) offset, to be understood as physical compensation of risks and impacts that cannot otherwise be avoided through the previous actions; and (vi) compensation, i.e., economic compensation of risks and residual impacts. The NBS can effectively intervene in phases (iii) and, above all, (iv) and (v).
Finally, integrated solutions should also be considered whenever possible. This means, for example, integrating the management of existing resources (e.g., existing public green) with new improvement solutions (e.g., NBS introduced from scratch), but also to integrate gray and green interventions, to optimize the effectiveness and persistence of positive impacts. In a broader vision, it also means integrating mitigation with adaptation objectives and increasing the level of relationship between voluntary pathways and ordinary planning. Integration is also to be understood, as previously mentioned, with reference to the nature of the actors and resources to be handled. The creation of new public-private partnership collaborations, the co-design and co-financing of initiatives would, for instance, lead to the sharing of investment risks and so make these interventions more attractive also to the private sector.
5. Conclusions
In this study, we assessed the potential of selected NBS to mitigate flood risks and the UHI effect in the Turin urban area. The economic value of benefits from the selected NBS, in terms of expected ecosystem services, was assessed through InVEST models applied to four intervention scenarios, comprising different sets of NBS, and compared with the NBS implementation and maintenance costs.
Our analyses highlighted positive results especially regarding protection against flood risks, particularly when limited-scale interventions are considered. Benefits in terms of flood-risk reduction also drive those linked to temperature regulation, suggesting possible synergies and trade-offs when NBS are jointly implemented.
Results can be used as a starting point for the elaboration of general guidelines for future climate strategies in the study context. These strategies should rely on tailored solutions targeted at identified risks, and a site-specific approach rather than considering extensive interventions. Setting priorities in terms of intervention areas and integration of the existing resources management with new improvement solutions, including integrating green and gray solutions to various degrees, seems to be advisable. The adoption of a policy mix strategy and the involvement of different actors and financing resources is key to mainstream NBS. Public bodies, such as municipalities, might play a pivotal role in driving and organizing planning activities, as well as in implementing solutions that could serve as best practices inspiring the private sector.
Despite our efforts, the paper has some limitations. Firstly, the scope of our study is limited to the assessment of only two ecosystem services associated to the implementation of identified NBS, without considering in-depth further co-benefits and trade-offs, nor the benefit demand by potential beneficiaries. This is a choice made consistently with the two main climatic risks identified by the 2020 Climate Resilience Plan developed by the Turin municipality [21], as well as to make data modeling and analysis technically feasible. Capturing the total economic value of the whole benefits generated by the selected NBS was beyond the scope of our research; however, the selected NBS are likely to generate additional environmental and social benefits in addition to those estimated in this study. Another limitation is linked to the fact that traditional estimation approaches and software-based models require some assumption and simplification to tackle data gaps in terms of quality/scale and quantity and technical constraints.
Future research might overcome these limits, enlarging the series of NBS potentially considered for implementation and the range of benefits being estimated, thus also considering possible co-benefits and trade-offs [63], in consistency with the widely accepted idea that NBS are to be understood as “multifunctional solutions that ensure multiple services and benefits simultaneously” [105]. Furthermore, the range of costs considered to implement NBS could also be enlarged, including indirect and general costs of the projects. However, to be fully reliable, these calculations should be tailored to a specific project because NBS design and associated features may vary accordingly as they are strictly dependent on different locations. Finally, further research could also explore stakeholders’ needs and preferences, providing additional inputs for setting priorities in decision-making and planning activities associated with NBS development.
Despite being just a preliminary assessment, the analysis presented within this paper confirms how research and practice can be integrated to provide relevant information for urban development planning with respect to challenges posed by urban development trends, as well as the climate crisis.
Supplementary Materials
The following supporting information can be downloaded at: https://www.mdpi.com/article/10.3390/land12020280/s1, Table S1: Summary of the main results (in millions) of the InVEST Urban Cooling model applied to the four scenarios considering the total (a) and public (b) areas; Table S2: Summary of the main results of the InVEST Urban Flood Risk Mitigation model applied to the four scenarios considering the total (i) and public (ii) areas; Table S3: Costs associated with the creation of the NBS selected for each scenario considered and for two different discount rates—total area, values expressed in millions EUR/year; Table S4: Comparison of total and unit costs and benefits associated with the creation of the individual NBS selected for scenario 1 (S1) and for two different discount rates—total area and only public areas, values expressed in EUR/year; Table S5: Comparison of total and unit costs and benefits associated with the creation of the individual NBS selected for scenario 2 (S2) and for two different discount rates—total area and only public areas, values expressed in EUR/year; Table S6: Comparison of total and unit costs and benefits associated with the creation of the individual NBS selected for scenario 3 (S3) and for two different discount rates—total area and only public areas, values expressed in EUR/year; Table S7: Comparison of total and unit costs and benefits associated with the creation of the individual NBS selected for scenario 4 (S4) and for two different discount rates—total area and only public areas, values expressed in EUR/year.
Author Contributions
Conceptualization, A.B., M.M. and G.A.; methodology, M.M. and G.A.; software, M.M. and G.A.; validation, M.M. and G.A.; formal analysis, A.B., M.M. and G.A.; investigation, A.B., M.M. and G.A.; data curation, A.B., M.M. and G.A.; writing—original draft preparation, A.B.; writing—review and editing, A.B., M.M., G.A. and D.P.; visualization, A.B., M.M., G.A. and D.P.; supervision, M.M.; funding acquisition, M.M. All authors have read and agreed to the published version of the manuscript.
Funding
This research was funded by the municipality of Turin, grant number CIG 8042107CA1.
Data Availability Statement
Not applicable.
Acknowledgments
Our gratitude goes to all staff at the municipality of Turin who supported our study by ensuring access to data and providing valuable inputs and feedback, and to the staff of SEAcoop for participating in the data collection and analysis. We are grateful to the two anonymous reviewers for their insightful revision suggestions.
Conflicts of Interest
The authors declare no conflict of interest. The municipality of Turin staff were involved in the design of alternative scenarios, facilitating access to the data needed as inputs for the study, and reviewing results.
Appendix A
Table A1.
NBS identified and the climate risk to which they respond (“x” means that the effect of NBS on mitigating climate risk is considered positive).
Table A1.
NBS identified and the climate risk to which they respond (“x” means that the effect of NBS on mitigating climate risk is considered positive).
| Code | Name | Climate Risk | ||
|---|---|---|---|---|
| Heat Island Effect | Floods—Surface Water | Floods— Rivers | ||
| 1 | Forested green areas | x | x | |
| 2 | Rain gardens | x | x | |
| 3 | Urban gardens | x | x | |
| 4 | Intensive green roofs | x | x | |
| 5 | Estensive green roofs | x | x | |
| 6 | Traditional green facade | x | ||
| 7 | Green facades “double skin” | x | ||
| 8 | Green or living walls | x | ||
| 9 | Vertical forest | x | ||
| 10 | Roadside trees and green paths | x | x | |
| 11 | Green rails | x | x | |
| 12 | Green urban furniture | x | ||
| 13 | Permeable surfaces | x | ||
| 14 | Rainwater harvesting | x | ||
| 15 | Infiltration basins | x | ||
| 16 | Infiltration trenches | x | ||
| 17 | Drainage wells | x | ||
| 18 | Swales | x | ||
| 19 | Vegetated canals and streams | x | ||
| 22 | Retention basins | x | ||
| 23 | Retention ponds | x | ||
| 24 | Geocellular storage system | x | ||
| 25 | Blue roofs | x | ||
| 24 | Restoration of rivers for the control of infiltrations | x | ||
| 25 | Creation of floodplains and riparian forests | x | ||
Table A2.
Description of selected NBS.
Table A2.
Description of selected NBS.
| Code | Name | Description |
|---|---|---|
| 1 | Forested green areas | Urban parks, forests and other green spaces in cities. They constitute green corridors that provide many benefits to mitigate the climatic risks. They can be designed in different forms, albeit the most effective involve the planting of trees and a large surface. |
| 2 | Rain gardens | Small gardens used for storage and infiltration. Often also called “bioretention areas”. Typically, they are implemented at the level of a single property, near buildings, for example, to collect water infiltrating from the roofs. They are formed by different components, including strips of filtering meadow, small stagnation basins, areas of constructed wetlands, sand beds, vegetation. The water can be collected and returned to the collector system or infiltrated into the subsoil. In the case of intense events, it can be connected to a SuDS. |
| 3 | Urban gardens | Urban and community gardens: areas used for agriculture and urban gardening with a positive contribution to adaptation to climate change, when compared to paved land. These green areas can be further adapted for climate impacts by introducing vegetation and appropriate crops. |
| 4 | Green roofs | Intensive—Also called roof gardens or terraces, they are composed of lush vegetation and are based on a relatively deep and nutrient-rich substrate. They can support large plants and conventional lawns. Extensive—Characterized by little growing medium deep and self-sufficient and low planting maintenance covering the entire roof area. They are sometimes called “sedum roofs”. |
| 5 | Green facades | Traditional green facades—Woody climbing plants or herbaceous plants usually planted at the base of a wall. “Double skin” green facades—Include support structures engineered for the creeper vegetation and an insulating air layer between the foliage and the wall of the building. Green walls—Generally more complex than green facades, they are based on a supporting structure with several fixing methods, such as panels or planters or a tissue culture substrate (felt), on which vegetation grows. |
| 6 | Roadside trees and green paths | Planting greenery next to infrastructure, including high-rise infrastructure capabilities such as highways and railways. |
| 7 | Green rails | Grassing of tram traffic areas. |
| 8 | Green urban furniture | Outdoor furniture made of natural materials, such as bus shelters, benches, etc. |
| 9 | Permeable surfaces | Permeable surfaces allow rainwater to through the surface into the underlying layers. They are placed at the beginning of a train of SuDS, unless it is in an area with permeable subsoil, in which case it is possible to consider allowing groundwater infiltration. However, performance improves if it is placed in a SuDS. |
| 10 | Rainwater harvesting | Collecting and storing rainwater for later use. It is traditionally collected from roofs but can also be retained by all other impermeable surfaces, such as industrial buildings or car parks. It is stored in individual barrels, in underground cisterns or large storage tanks. There are different collection systems (gravity or pump). It can be placed at the head of a SuDS train or deliver water for irrigation or other purposes. It can include active management systems of the amount stored, which can be activated in anticipation of extreme events. |
| 11 | Infiltration basins | Infiltration basins are vegetated depressions designed to retain runoff from waterproof surfaces, allow sediment and pollutants to settle, and allow the water to infiltrate the underlying soils. Infiltration basins are dry, except in periods of heavy rain, and they can be used for other functions (for example recreation). They provide storage and control of the outflow as part of a SuDS. The measure improves the soil’s natural ability to drain water by providing a large contact surface with the surrounding land, through which water can reach the layers below. |
| 12 | Infiltration trenches | Shallow excavations filled with debris or stones allowing water to infiltrate from adjacent impermeable surfaces. They can also be designed with direct inflows. They reduce runoff through infiltration and contribute to the recharge of the aquifer and others by maintaining the base flow of rivers. They purify the runoff through filtration in strata and soil. They work best as part of a SuDS system. |
| 13 | Retention ponds | Ponds designed with additional storage capacity to provide washout mitigation during rain events and slowly release the runoff. They consist of a permanent pond area with natural banks. They are made using a natural depression, digging a new one or building levees. It would be better not to use natural water bodies to avoid running the risk that pollution and low-quality water disturb or damage the natural ecosystem. They are designed with an outlet to the collector system in the case of being overfull. |
| 14 | Restoration of rivers for the control of infiltrations | Measures to restore the natural state and function of rivers: renaturalization of the riverbed; renaturalization of the riverbed material; removal of embankments protection. |
| 15 | Creation of floodplains and riparian forests | Restoring/creating connections and transitioning between terrestrial and aquatic ecosystems, including lowlands alluvial and adjacent terraces. |
Source: Modified from Morello et al. (2019) [31].
Table A3.
Summary of model input and output data.
Table A3.
Summary of model input and output data.
| Urban Cooling | Urban Flood Risk Mitigation Model | ||
|---|---|---|---|
| Input Data | Input Data | ||
| Land Cover Map | Raster of land use/land cover (LULC) for each pixel (resolution 1 m × 1 m). | Land Cover Map | Raster of land use/land cover (LULC) for each pixel (resolution 1 m × 1 m). |
| Biophysical Table | .csv file reporting for each LULC type: | Biophysical Table | .csv file reporting Curve number (CN) values for each LULC type and each hydrological group. CN values were derived from USDA (1986) [106]. |
| |||
| Reference Evapotranspiration (mm) | Raster of reference evapotranspiration according to the FAO Penman-Monteith methodology [107]. | Watershed Vector | Vector of the main watersheds relative to the study area (i.e., Dora Riparia, Po, Sangone and Stura di Lanzo) [109]. |
| Area of interest | Vector of the administrative boundaries of the Turin municipality. | Depth of rainfall (mm) | Three values, i.e., minimum (32.21 mm), intermediate (45.50 mm) and maximum (55.32 mm), identified from Turin Millefonti rain gauge data. |
| Green Area Maximum Cooling Distance (m) | Distance over which large urban parks (>2 ha) have a cooling effect. Defined as 130 m based on Aram et al. (2019) [43]. | Soils Hydrological Group Raster | Raster of categorical hydrological groups developed from the Piedmont Lithological Map [109] according to [110]. Pixel values are limited to 1, 2, 3, or 4, which correspond to soil hydrologic group A, B, C, or D, respectively. |
| Baseline air temperature (°C) | 20.4 °C [111] | Unit cost for a lamination basin (EUR) | 300 EUR/m3 |
| Authors’ estimation based on unit costs available from the 2020 regional public price lists for public works [112]. | |||
| Magnitude of the UHI effect | 6.2 °C [72] | Output data | |
| Air Temperature Maximum Blending Distance(m) | 2000 m | Runoff values (Q, mm) | Raster with runoff values. |
| Default value set by the InVEST model. | |||
| Building Footprints | Vector with built infrastructure footprints developed based on the Turin Municipal Technical Map (Carta Tecnica Comunale), using the reference vector “Edificio” (i.e., building). | Runoff retention index | Raster with runoff retention values (no unit, relative to precipitation volume). |
| Energy Consumption Table | Residential (0.15 EUR/Kwh), industrial (0.12 EUR/Kwh) and other (0.10 EUR/Kwh). Derived as an average value from online data by the Italian Regulatory Authority for Energy, Networks and Environment (Autorità di Regolazione per Energia Reti e Ambiente, ARERA). | Runoff retention volume (m3) | Raster with runoff retention volume values. |
| 0.54% increase of the daily electricity load for each degree of temperature increase [110] (Santamouris et al., 2015). | |||
| Average relative humidity | 73.8% (University of Turin, 2021) [111] | Ecosystem service value (€) | Value of the ecosystem service calculated as unit cost of the substitute good (lamination basin) times the runoff retention volume. |
| Weights for factors | Shade: 0.6, Albedo: 0.2, Evapotranspiration: 0.2. | ||
| Default values set by the InVEST model. | |||
| Output data | |||
| Heat mitigation index (hm) | Raster with hm values (adimensional) showing the cooling effect of NBS. | ||
| Energy savings (KWh) | Avoided energy consumption due to the cooling effects of NBS. | ||
| Energy savings (€) | Avoided costs associated with avoided energy consumption due to the cooling effects of NBS. | ||
Table A4.
Areas of application of the NBS (in hectares) and as a percentage for each scenario.
Table A4.
Areas of application of the NBS (in hectares) and as a percentage for each scenario.
| Code | NBS | Potential Area | Scenario 1 | Scenario 2 | Scenario 3 | Scenario 4 | ||||||
|---|---|---|---|---|---|---|---|---|---|---|---|---|
| Total | Public | Total | Public | Total | Public | Total | Public | Total | Public | |||
| 1 | Forested green areas | ha | 1875.9 | 377.1 | 1875.9 | 377.1 | 0 | 0 | 355.4 | 34.5 | 1574.2 | 138.4 |
| % | 100 | 100 | 0 | 0 | 19 | 9 | 84 | 37 | ||||
| 2 | Rain gardens | ha | 3427.4 | 971.9 | 0 | 0 | 0 | 0 | 0 | 0 | 0 | 0 |
| % | 0 | 0 | 0 | 0 | 0 | 0 | 0 | 0 | ||||
| 3 | Urban gardens | ha | 3427.4 | 971.9 | 0 | 0 | 0 | 0 | 0 | 0 | 1514.4 | 691 |
| % | 0 | 0 | 0 | 0 | 0 | 0 | 44 | 71 | ||||
| 4 | Green roofs | ha | 2301.6 | 160.5 | 772.9 | 74.4 | 772.9 | 74.4 | 139 | 12.5 | 761 | 73.4 |
| % | 34 | 46 | 34 | 46 | 6 | 8 | 33 | 46 | ||||
| 5 | Green facades | ha | 2301.6 | 160.5 | 1528.7 | 86.1 | 1528.7 | 86.1 | 243.6 | 15.8 | 1493.1 | 83.9 |
| % | 66 | 54 | 66 | 54 | 11 | 10 | 65 | 52 | ||||
| 6 | Roadside trees and green paths | ha | 2128.5 | 133.7 | 2128.5 | 133.7 | 2128.5 | 133.7 | 453.4 | 40.9 | 2059.1 | 125.9 |
| % | 100 | 100 | 100 | 100 | 21 | 31 | 97 | 94 | ||||
| 7 | Green rails | ha | 119.5 | 2.3 | 119.5 | 2.3 | 119.5 | 2.3 | 8.6 | 0 | 119.3 | 2.3 |
| % | 100 | 100 | 100 | 100 | 7 | 0 | 100 | 100 | ||||
| 8 | Green urban furniture | ha | 1631.1 | 814 | 10 | 8.4 | 10 | 8.4 | 2.5 | 2.2 | 9.5 | 8 |
| % | 1 | 1 | 1 | 1 | 0 | 0 | 1 | 1 | ||||
| 9 | Permeable surfaces | ha | 2781.1 | 259.4 | 246.2 | 42 | 1785 | 150.5 | 79.7 | 12.6 | 0 | 0 |
| % | 9 | 16 | 64 | 58 | 3 | 5 | 0 | 0 | ||||
| 10 | Rainwater harvesting | ha | 2301.6 | 160.5 | 0 | 0 | 0 | 0 | 0 | 0 | 0 | 0 |
| % | 0 | 0 | 0 | 0 | 0 | 0 | 0 | 0 | ||||
| 11 | Infiltration basins | ha | 3427.4 | 971.9 | 0 | 0 | 0 | 0 | 0 | 0 | 0 | 0 |
| % | 0 | 0 | 0 | 0 | 0 | 0 | 0 | 0 | ||||
| 12 | Infiltration trenches | ha | 5094.5 | 1058.7 | 338 | 21.9 | 440.7 | 56.1 | 79.9 | 9 | 0 | 0 |
| % | 7 | 2 | 9 | 5 | 2 | 1 | 0 | 0 | ||||
| 13 | Retention ponds | ha | 3427.4 | 971.9 | 1786 | 829.2 | 1786 | 829.2 | 751.5 | 433.9 | 0 | 0 |
| % | 52 | 85 | 52 | 85 | 22 | 45 | 0 | 0 | ||||
| 14 | Restoration of rivers for the control of infiltrations | ha | 246.6 | 9.3 | 246.6 | 9.3 | 246.6 | 9.3 | 231.6 | 7.4 | 0 | 0 |
| % | 100 | 100 | 100 | 100 | 94 | 79 | 0 | 0 | ||||
| 15 | Creation of floodplains and riparian forests | ha | 53.7 | 4.9 | 53.7 | 4.9 | 53.7 | 4.9 | 53.7 | 4.9 | 27 | 3.1 |
| % | 100 | 100 | 100 | 100 | 100 | 100 | 50 | 64 | ||||
| Total | ha | 34,545.3 | 7028.5 | 9106 | 1589.3 | 8871.6 | 1354.9 | 2398.9 | 573.7 | 7557.6 | 1126 | |
| % | 26.4% | 23% | 25.7% | 19% | 7% | 8% | 22% | 16% | ||||
References
- United Nations, Department of Economic and Social Affairs, P.D. World Urbanization Prospects: The 2018 Revision; United Nations: New York, NY, USA, 2019; ISBN 9789211483192. [Google Scholar]
- EEA. Climate Change, Impacts and Vulnerability in Europe 2016. An Indicator-Based Report; EEA: Copenhagen, Denmark, 2017; ISBN 9789292138356.
- Rosenzweig, C.; Solecki, W.D.; Romero-Lankao, P.; Mehrotra, S.; Dhakal, S.; Ibrahim, S.A. Climate Change and Cities Second Assessment Report of the Urban Climate Change Research Network; Cambridge University Press: Cambridge, UK, 2018; pp. xvii–xlii. [Google Scholar]
- Vardoulakis, S.; Kinney, P. Grand Challenges in Sustainable Cities and Health. Front. Sustain. Cities 2019, 1, 7. [Google Scholar] [CrossRef]
- Fini, A.; Frangi, P.; Mori, J.; Donzelli, D.; Ferrini, F. Nature Based Solutions to Mitigate Soil Sealing in Urban Areas: Results from a 4-Year Study Comparing Permeable, Porous, and Impermeable Pavements. Environ. Res. 2017, 156, 443–454. [Google Scholar] [CrossRef] [PubMed]
- Scalenghe, R.; Ajmone-Marsan, F. The Anthropogenic Sealing of Soils in Urban Areas. Landsc. Urban Plan. 2009, 90, 1–10. [Google Scholar] [CrossRef]
- Liu, J.; Niyogi, D. Meta-Analysis of Urbanization Impact on Rainfall Modification. Sci. Rep. 2019, 9, 7301. [Google Scholar] [CrossRef] [PubMed]
- Parker, J.; Simpson, G.D.; Miller, J.E. Nature-Based Solutions Forming Urban Intervention Approaches to Anthropogenic Climate Change: A Quantitative Literature Review. Sustainability 2020, 12, 7439. [Google Scholar] [CrossRef]
- Arnbjerg-Nielsen, K.; Willems, P.; Olsson, J.; Beecham, S.; Pathirana, A.; Bülow Gregersen, I.; Madsen, H.; Nguyen, V.T.V. Impacts of Climate Change on Rainfall Extremes and Urban Drainage Systems: A Review. Water Sci. Technol. 2013, 68, 16–28. [Google Scholar] [CrossRef] [PubMed]
- Costa, S.; Peters, R.; Martins, R.; Postmes, L.; Keizer, J.J.; Roebeling, P. Effectiveness of Nature-Based Solutions on Pluvial Flood Hazard Mitigation: The Case Study of the City of Eindhoven (the Netherlands). Resources 2021, 10, 24. [Google Scholar] [CrossRef]
- Escobedo, F.J.; Giannico, V.; Jim, C.Y.; Sanesi, G.; Lafortezza, R. Urban Forestry & Urban Greening Urban Forests, Ecosystem Services, Green Infrastructure and Nature-Based Solutions: Nexus or Evolving Metaphors ? Urban For. Urban Green. 2019, 37, 3–12. [Google Scholar] [CrossRef]
- Koko, A.F.; Yue, W.; Abubakar, G.A.; Alabsi, A.A.N.; Hamed, R. Spatiotemporal Influence of Land Use/Land Cover Change Dynamics on Surface Urban Heat Island: A Case Study of Abuja Metropolis, Nigeria. ISPRS Int. J. Geo-Inf. 2021, 10, 272. [Google Scholar] [CrossRef]
- Palafox-Juárez, E.B.; López-Martínez, J.O.; Hernández-Stefanoni, J.L.; Hernández-Nuñez, H. Impact of Urban Land-Cover Changes on the Spatial-Temporal Land Surface Temperature in a Tropical City of Mexico. ISPRS Int. J. Geo-Inf. 2021, 10, 76. [Google Scholar] [CrossRef]
- Harlan, S.L.; Ruddell, D.M. Climate Change and Health in Cities: Impacts of Heat and Air Pollution and Potential Co-Benefits from Mitigation and Adaptation. Curr. Opin. Environ. Sustain. 2011, 3, 126–134. [Google Scholar] [CrossRef]
- Wouters, H.; De Ridder, K.; Poelmans, L.; Willems, P.; Brouwers, J.; Hosseinzadehtalaei, P.; Tabari, H.; Vanden Broucke, S.; van Lipzig, N.P.M.; Demuzere, M. Heat Stress Increase under Climate Change Twice as Large in Cities as in Rural Areas: A Study for a Densely Populated Midlatitude Maritime Region. Geophys. Res. Lett. 2017, 44, 8997–9007. [Google Scholar] [CrossRef]
- Rousi, E.; Kornhuber, K.; Beobide-Arsuaga, G.; Luo, F.; Coumou, D. Accelerated Western European Heatwave Trends Linked to More-Persistent Double Jets over Eurasia. Nat. Commun. 2022, 13, 3851. [Google Scholar] [CrossRef] [PubMed]
- Heaviside, C.; Macintyre, H.; Vardoulakis, S. The Urban Heat Island: Implications for Health in a Changing Environment. Curr. Environ. Health Rep. 2017, 4, 296–305. [Google Scholar] [CrossRef] [PubMed]
- Tong, S.; Prior, J.; McGregor, G.; Shi, X.; Kinney, P. Urban Heat: An Increasing Threat to Global Health. BMJ 2021, 375, n2467. [Google Scholar] [CrossRef]
- Santamouris, M.; Cartalis, C.; Synnefa, A.; Kolokotsa, D. On the Impact of Urban Heat Island and Global Warming on the Power Demand and Electricity Consumption of Buildings—A Review. Energy Build. 2015, 98, 119–124. [Google Scholar] [CrossRef]
- Casanueva, A.; Kotlarski, S.; Fischer, A.M.; Flouris, A.D.; Kjellstrom, T.; Lemke, B.; Nybo, L.; Schwierz, C.; Liniger, M.A. Escalating Environmental Summer Heat Exposure—A Future Threat for the European Workforce. Reg. Environ. Chang. 2020, 20, 40. [Google Scholar] [CrossRef]
- Bayulken, B.; Huisingh, D.; Fisher, P.M.J. How Are Nature Based Solutions Helping in the Greening of Cities in the Context of Crises Such as Climate Change and Pandemics ? A Comprehensive Review. J. Clean. Prod. 2021, 288, 125569. [Google Scholar] [CrossRef]
- de Luca, C.; Naumann, S.; Davis, M.; Tondelli, S. Nature-based Solutions and Sustainable Urban Planning in the European Environmental Policy Framework: Analysis of the State of the Art and Recommendations for Future Development. Sustainability 2021, 13, 5021. [Google Scholar] [CrossRef]
- Sikorska, D.; Ciężkowski, W.; Babańczyk, P.; Chormański, J.; Sikorski, P. Intended Wilderness as a Nature-Based Solution: Status, Identification and Management of Urban Spontaneous Vegetation in Cities. Urban For. Urban Green. 2021, 62, 127155. [Google Scholar] [CrossRef]
- Walters, G.; Janzen, C.; Maginnis, S. Nature-Based Solutions to Address Global Societal Challenges; IUCN: Gland, Switzerland, 2016; ISBN 9782831718125. [Google Scholar]
- Kabisch, N.; Frantzeskaki, N.; Pauleit, S.; Naumann, S. Nature-Based Solutions to Climate Change Mitigation and Adaptation in Urban Areas: Perspectives on Indicators, Knowledge Gaps, Barriers, and Opportunities for Action. Ecol. Soc. 2016, 21, 39. [Google Scholar] [CrossRef]
- Eggermont, H.; Balian, E.; Azevedo, J.M.N.; Beumer, V.; Brodin, T.; Claudet, J.; Fady, B.; Grube, M.; Keune, H.; Lamarque, P.; et al. Nature-Based Solutions: New Influence for Environmental Management and Research in Europe. GAIA-Ecol. Perspect. Sci. Soc. 2015, 24, 243–248. [Google Scholar] [CrossRef]
- Dorst, H.; van der Jagt, A.; Raven, R.; Runhaar, H. Urban Greening through Nature-Based Solutions—Key Characteristics of an Emerging Concept. Sustain. Cities Soc. 2019, 49, 101620. [Google Scholar] [CrossRef]
- Li, L.; Cheshmehzangi, A.; Chan, F.K.S.; Ives, C.D. Mapping the Research Landscape of Nature-Based Solutions in Urbanism. Sustainability 2021, 13, 3876. [Google Scholar] [CrossRef]
- Sarabi, S.E.; Han, Q.; Romme, A.G.L.; De Vries, B. Key Enablers of and Barriers to the Uptake and Implementation of Nature-Based Solutions in Urban Settings: A Review. Resources 2019, 8, 121. [Google Scholar] [CrossRef]
- Castellar, J.A.C.; Popartan, L.A.; Pueyo-Ros, J.; Atanasova, N.; Langergraber, G.; Säumel, I.; Corominas, L.; Comas, J.; Acuña, V. Nature-Based Solutions in the Urban Context: Terminology, Classification and Scoring for Urban Challenges and Ecosystem Services. Sci. Total Environ. 2021, 779, 146237. [Google Scholar] [CrossRef]
- Morello, E.; Mahmoud, I.; Colaninno, N. Catalogue of Nature-Based Solutions for Urban Regeneration Pre-Final Report. Land 2019, 9, 183. [Google Scholar]
- Scholz, M. Sustainable Drainage Systems; MDPI: Basel, Switzerland, 2015; Volume 7, ISBN 9788886569415. [Google Scholar]
- United Nations; United Nations Environment. United Nations Environment Assembly of the United Nations Environment Programme. 2022, pp. 3–5. Available online: https://www.unep.org/environmentassembly/ (accessed on 10 January 2023).
- Kabisch, N.; Korn, H.; Stadler, J.; Bonn, A. Nature-Based Solutions to Climate Change Adaptation in Urban Areas: Linkages between Science, Policy and Practice; Springer: Cham, Switzerland, 2017. [Google Scholar] [CrossRef]
- Davies, C.; Lafortezza, R. Transitional Path to the Adoption of Nature-Based Solutions. Land Use Policy 2019, 80, 406–409. [Google Scholar] [CrossRef]
- Dorst, H.; van der Jagt, A.; Runhaar, H.; Raven, R. Structural Conditions for the Wider Uptake of Urban Nature-Based Solutions—A Conceptual Framework. Cities 2021, 116, 103283. [Google Scholar] [CrossRef]
- Faivre, N.; Fritz, M.; Freitas, T.; de Boissezon, B.; Vandewoestijne, S. Nature-Based Solutions in the EU: Innovating with Nature to Address Social, Economic and Environmental Challenges. Environ. Res. 2017, 159, 509–518. [Google Scholar] [CrossRef]
- Abhijith, K.V.; Kumar, P.; Gallagher, J.; McNabola, A.; Baldauf, R.; Pilla, F.; Broderick, B.; Di Sabatino, S.; Pulvirenti, B. Air Pollution Abatement Performances of Green Infrastructure in Open Road and Built-up Street Canyon Environments—A Review. Atmos. Environ. 2017, 162, 71–86. [Google Scholar] [CrossRef]
- Seddon, N.; Smith, A.; Smith, P.; Key, I.; Chausson, A.; Girardin, C.; House, J.; Srivastava, S.; Turner, B. Getting the Message Right on Nature-Based Solutions to Climate Change. Glob. Chang. Biol. 2021, 27, 1518–1546. [Google Scholar] [CrossRef]
- Nika, C.E.; Gusmaroli, L.; Ghafourian, M.; Atanasova, N.; Buttiglieri, G.; Katsou, E. Nature-Based Solutions as Enablers of Circularity in Water Systems: A Review on Assessment Methodologies, Tools and Indicators. Water Res. 2020, 183, 115988. [Google Scholar] [CrossRef] [PubMed]
- Boano, F.; Caruso, A.; Costamagna, E.; Ridolfi, L.; Fiore, S.; Demichelis, F.; Galvão, A.; Pisoeiro, J.; Rizzo, A.; Masi, F. A Review of Nature-Based Solutions for Greywater Treatment: Applications, Hydraulic Design, and Environmental Benefits. Sci. Total Environ. 2020, 711, 134731. [Google Scholar] [CrossRef] [PubMed]
- Koc, C.B.; Osmond, P.; Peters, A. Evaluating the Cooling Effects of Green Infrastructure: A Systematic Review of Methods, Indicators and Data Sources. Sol. Energy 2018, 166, 486–508. [Google Scholar]
- Aram, F.; Higueras García, E.; Solgi, E.; Mansournia, S. Urban Green Space Cooling Effect in Cities. Heliyon 2019, 5, e01339. [Google Scholar] [CrossRef] [PubMed]
- Zardo, L.; Geneletti, D.; Pérez-Soba, M.; Van Eupen, M. Estimating the Cooling Capacity of Green Infrastructures to Support Urban Planning. Ecosyst. Serv. 2017, 26, 225–235. [Google Scholar] [CrossRef]
- Gunawardena, K.R.; Wells, M.J.; Kershaw, T. Utilising Green and Bluespace to Mitigate Urban Heat Island Intensity. Sci. Total Environ. 2017, 584–585, 1040–1055. [Google Scholar] [CrossRef] [PubMed]
- Lavorel, S.; Locatelli, B.; Colloff, M.J.; Bruley, E. Co-Producing Ecosystem Services for Adapting to Climate Change. Philos. Trans. R. Soc. B Biol. Sci. 2020, 375, 20190119. [Google Scholar] [CrossRef]
- Hutchins, M.G.; Fletcher, D.; Hagen-Zanker, A.; Jia, H.; Jones, L.; Li, H.; Loiselle, S.; Miller, J.; Reis, S.; Seifert-Dähnn, I.; et al. Why Scale Is Vital to Plan Optimal Nature-Based Solutions for Resilient Cities. Environ. Res. Lett. 2021, 16, 044008. [Google Scholar] [CrossRef]
- Chausson, A.; Turner, B.; Seddon, D.; Chabaneix, N.; Girardin, C.A.J.; Kapos, V.; Key, I.; Roe, D.; Smith, A.; Woroniecki, S.; et al. Mapping the Effectiveness of Nature-Based Solutions for Climate Change Adaptation. Glob. Chang. Biol. 2020, 26, 6134–6155. [Google Scholar] [CrossRef] [PubMed]
- van den Bosch, M.; Sang, O. Urban Natural Environments as Nature-Based Solutions for Improved Public Health—A Systematic Review of Reviews. Environ. Res. 2017, 158, 373–384. [Google Scholar] [CrossRef]
- Brown, C.; Burns, A.; Arnell, A. A Conceptual Framework for Integrated Ecosystem Assessment. One Ecosyst. 2018, 3, e25482. [Google Scholar] [CrossRef]
- Hansmann, R.; Hug, S.M.; Seeland, K. Restoration and Stress Relief through Physical Activities in Forests and Parks. Urban For. Urban Green. 2007, 6, 213–225. [Google Scholar] [CrossRef]
- Cervinka, R.; Höltge, J.; Pirgie, L.; Schwab, M.; Sudkamp, J.; Haluza, D.; Arnberger, A.; Eder, R.; Ebenberger, M. Green Public Health—Benefits of Woodlands on Human Health and Well-Being [Zur Gesundheitswirkung von Waldlandschaften]; Austrian Research Centre for Forests: Vienna, Austria, 2014; ISBN 9783902762320. [Google Scholar]
- Houlden, V.; Weich, S.; de Albuquerque, J.P.; Jarvis, S.; Rees, K. The Relationship between Greenspace and the Mental Wellbeing of Adults: A Systematic Review. PLoS ONE 2018, 13, e0203000. [Google Scholar] [CrossRef]
- Bartoll, X.; Cirach, M.; Borrell, C.; Zijlema, W.L. The Evaluation of the 3-30-300 Green Space Rule and Mental Health. Environ. Res. 2022, 215, 114387. [Google Scholar] [CrossRef]
- Potschin-Young, M.; Haines-Young, R.; Görg, C.; Heink, U.; Jax, K.; Schleyer, C. Understanding the Role of Conceptual Frameworks: Reading the Ecosystem Service Cascade. Ecosyst. Serv. 2018, 29, 428–440. [Google Scholar] [CrossRef]
- Swanwick, C. Society’s Attitude to and Preferences for Land and Landscape. Land Use Policy 2009, 26, S62–S75. [Google Scholar] [CrossRef]
- Terton, A. Building a Climate-Resilient City: Urban Ecosystems. Prairie Clim. Cent. 2017, 1–10. [Google Scholar]
- McPhearson, T.; Andersson, E.; Elmqvist, T.; Frantzeskaki, N. Resilience of and through Urban Ecosystem Services. Ecosyst. Serv. 2015, 12, 152–156. [Google Scholar] [CrossRef]
- Dagenhart, R.; Leigh, N.G.; Skach, J. Brownfields and Urban Design: Learning from Atlantic Station. WIT Trans. Ecol. Environ. 2006, 94, 185–194. [Google Scholar] [CrossRef]
- Voskamp, I.M.; de Luca, C.; Polo-Ballinas, M.B.; Hulsman, H.; Brolsma, R. Nature-Based Solutions Tools for Planning Urban Climate Adaptation: State of the Art. Sustainability 2021, 13, 6381. [Google Scholar] [CrossRef]
- Toxopeus, H.; Polzin, F. Reviewing Financing Barriers and Strategies for Urban Nature-Based Solutions. J. Environ. Manag. 2021, 289, 112371. [Google Scholar] [CrossRef]
- Frantzeskaki, N.; Kabisch, N.; McPhearson, T. Advancing Urban Environmental Governance: Understanding Theories, Practices and Processes Shaping Urban Sustainability and Resilience. Environ. Sci. Policy 2016, 62, 1–6. [Google Scholar] [CrossRef]
- Kapos, V.; Wicander, S.; Salvaterra, T.; Dawkins, K.; Hicks, C. The Role of the Natural Environment in Adaptation, Background Paper for the Global Commission on Adaptation; Global Commission on Adaptation: Rotterdam, The Netherlands; Washington, DC, USA, 2019. [Google Scholar]
- Croci, E.; Lucchitta, B.; Penati, T. Valuing Ecosystem Services at the Urban Level: A Critical Review. Sustainability 2021, 13, 1129. [Google Scholar] [CrossRef]
- Kumar, P.; Esen, S.E.; Yashiro, M. Linking Ecosystem Services to Strategic Environmental Assessment in: Development Policies. Environ. Impact Assess. Rev. 2013, 40, 75–81. [Google Scholar] [CrossRef]
- Nesshöver, C.; Assmuth, T.; Irvine, K.N.; Rusch, G.M.; Waylen, K.A.; Delbaere, B.; Haase, D.; Jones-Walters, L.; Keune, H.; Kovacs, E.; et al. The Science, Policy and Practice of Nature-Based Solutions: An Interdisciplinary Perspective. Sci. Total Environ. 2017, 579, 1215–1227. [Google Scholar] [CrossRef]
- Haase, D.; Larondelle, N.; Andersson, E.; Artmann, M.; Borgström, S.; Breuste, J.; Gomez-Baggethun, E.; Gren, Å.; Hamstead, Z.; Hansen, R.; et al. A Quantitative Review of Urban Ecosystem Service Assessments: Concepts, Models, and Implementation. Ambio 2014, 43, 413–433. [Google Scholar] [CrossRef] [PubMed]
- Luederitz, C.; Brink, E.; Gralla, F.; Hermelingmeier, V.; Meyer, M.; Niven, L.; Panzer, L.; Partelow, S.; Rau, A.L.; Sasaki, R.; et al. A Review of Urban Ecosystem Services: Six Key Challenges for Future Research. Ecosyst. Serv. 2015, 14, 98–112. [Google Scholar] [CrossRef]
- Gómez-Baggethun, E.; Barton, D.N. Classifying and Valuing Ecosystem Services for Urban Planning. Ecol. Econ. 2013, 86, 235–245. [Google Scholar] [CrossRef]
- Battisti, L.; Pomatto, E.; Larcher, F. Assessment and Mapping Green Areas Ecosystem Services and Socio-Demographic Characteristics in Turin Neighborhoods (Italy). Forests 2020, 11, 25. [Google Scholar] [CrossRef]
- Istat Popolazione Residente Al 1° Gennaio. Available online: http://dati.istat.it/Index.aspx?QueryId=18540 (accessed on 10 August 2021).
- Munafò, M. (Ed.) Consumo Di Suolo, Dinamiche Territoriali e Servizi Ecosistemici. Edizione 2022; SNPA: Santa Monica, CA, USA, 2022; Volume 32/22, ISBN 9788844811242.
- Strollo, A.; Smiraglia, D.; Bruno, R.; Assennato, F.; Congedo, L.; De Fioravante, P.; Giuliani, C.; Marinosci, I.; Riitano, N.; Munafò, M. Land Consumption in Italy. J. Maps 2020, 16, 113–123. [Google Scholar] [CrossRef]
- Arpa Piemonte; Ispra DICSIT—Database Indicatori Consumo Di Suolo in Italia. Available online: https://webgis.arpa.piemonte.it/secure_apps/consumo_suolo_agportal/index.html (accessed on 10 August 2021).
- CittàClima. Piano Di Resilienza Climatica; CittàClima: Rome, Italy, 2020. [Google Scholar]
- Urban Atlas. 2018. Available online: https://land.copernicus.eu/local/urban-atlas/urban-atlas-2018 (accessed on 10 January 2023).
- QGIS.Org. QGIS 3.16 Geographic Information System Installation Guide; QGIS Association: Switzerland, 2016; Available online: https://www.qgis.org/en/docs/ (accessed on 10 January 2023).
- European Commission. Guide to Cost-Benefit Analysis of Investment Projects: Economic Appraisal Tool for Cohesion Policy 2014–2020; European Commission: Brussels, Belgium, 2014; ISBN 9789279347962. [Google Scholar]
- Sharp, R.; Chaplin-kramer, R.; Wood, S.; Guerry, A.; Tallis, H.; Ricketts, T.; Nelson, E.; Ennaanay, D.; Wolny, S.; Olwero, N.; et al. InVEST User’s Guide. Nat. Cap. Proj. Stanf. Univ. Univ. Minn. Nat. Conserv. World Wildl. Fund 2020, 104–120. [Google Scholar]
- Zawadzka, J.E.; Harris, J.A.; Corstanje, R. Assessment of Heat Mitigation Capacity of Urban Greenspaces with the Use of InVEST Urban Cooling Model, Verified with Day-Time Land Surface Temperature Data. Landsc. Urban Plan. 2021, 214, 104163. [Google Scholar] [CrossRef]
- Pascual, U.; Muradian, R.; Brander, L.; Christie, M.; Cornelissen, H.; Eppink, F.; Farley, J.; Loomis, J.; Pearson, L.; Perrings, C.; et al. Chapter 5 The Economics of Valuing Ecosystem Services and Biodiversity. Econ. Ecosyst. Biodivers. Ecol. Econ. Found. 2010, 183–255. [Google Scholar]
- Koppenjan, J.F.M.; Enserink, B. Public–Private Partnerships in Urban Infrastructures: Reconciling Private Sector Participation and Sustainability. Public Adm. Rev. 2009, 69, 284–296. [Google Scholar] [CrossRef]
- Maes, J.; Jacobs, S. Nature-Based Solutions for Europe’s Sustainable Development. Conserv. Lett. 2017, 10, 121–124. [Google Scholar] [CrossRef]
- Magni, F. Per Un’efficace Governance Urbana Climate Proof. L’esperienza Di Rotterdam. Equilibri 2020, 24, 460–473. [Google Scholar] [CrossRef]
- van der Jagt, A.; Tozer, L.; Toxopeus, H.; Runhaar, H. Policy Mixes for Mainstreaming Urban Nature-Based Solutions: An Analysis of Six European Countries and the European Union. Environ. Sci. Policy 2023, 139, 51–61. [Google Scholar] [CrossRef]
- Borrás, S.; Edquist, C. The Choice of Innovation Policy Instruments. Technol. Forecast. Soc. Chang. 2013, 80, 1513–1522. [Google Scholar] [CrossRef]
- Mees, H.L.P.; Dijk, J.; van Soest, D.; Driessen, P.P.J.; van Rijswick, M.H.F.M.W.; Runhaar, H. A Method for the Deliberate and Deliberative Selection of Policy Instrument Mixes for Climate Change Adaptation. Ecol. Soc. 2014, 19, 58. [Google Scholar] [CrossRef]
- Wurzel, R.; Jordan, A.; Zito, A.R. Environmental Governance in Europe: A Comparative Analysis of New Environmental Policy Instrument; Edward Elgar: Cheltenham, UK, 2013. [Google Scholar]
- Marie-Louise, B.-V. Carrots, Sticks & Sermons. Policy Instruments and Their Evaluation; Routledge: Oxfordshire, UK, 1998. [Google Scholar]
- Weber, M.; Driessen, P.P.J.; Runhaar, H.A.C. Evaluating Environmental Policy Instruments Mixes; a Methodology Illustrated by Noise Policy in the Netherlands. J. Environ. Plan. Manag. 2014, 57, 1381–1397. [Google Scholar] [CrossRef]
- Lee, R.; den Uyl, R.; Runhaar, H. Assessment of Policy Instruments for Pesticide Use Reduction in Europe; Learning from a Systematic Literature Review. Crop Prot. 2019, 126, 104929. [Google Scholar] [CrossRef]
- Säumel, I.; Draheim, T.; Endlicher, W.; Langne, M. Ökosystemdienstleistungen in Der Stadt—Gesundheit Schützen Und Lebensqualität Erhöhen; UFZ: Berlin, Germany, 2016; ISBN 9783944280356. [Google Scholar]
- de Lima, A.P.M.; Rodrigues, A.F.; Latawiec, A.E.; Dib, V.; Gomes, F.D.; Maioli, V.; Pena, I.; Tubenchlak, F.; Rebelo, A.J.; Esler, K.J.; et al. Framework for Planning and Evaluation of Nature-Based Solutions for Water in Peri-Urban Areas. Sustainability 2022, 14, 7952. [Google Scholar] [CrossRef]
- IUCN. IUCN Global Standard for Nature-Based Solutions: A User-Friendly Framework for the Verification, Design and Scaling up of NbS, 1st ed.; IUCN: Gland, Switzerland, 2020. [Google Scholar] [CrossRef]
- Edmondson, D.L.; Kern, F.; Rogge, K.S. The Co-Evolution of Policy Mixes and Socio-Technical Systems: Towards a Conceptual Framework of Policy Mix Feedback in Sustainability Transitions. Res. Policy 2019, 48, 103555. [Google Scholar] [CrossRef]
- Filippini, M.; Hunt, L.C.; Zorić, J. Impact of Energy Policy Instruments on the Estimated Level of Underlying Energy Efficiency in the EU Residential Sector. Energy Policy 2014, 69, 73–81. [Google Scholar] [CrossRef]
- Kern, F.; Kivimaa, P.; Martiskainen, M. Policy Packaging or Policy Patching? The Development of Complex Energy Efficiency Policy Mixes. Energy Res. Soc. Sci. 2017, 23, 11–25. [Google Scholar] [CrossRef]
- Scordato, L.; Klitkou, A.; Tartiu, V.E.; Coenen, L. Policy Mixes for the Sustainability Transition of the Pulp and Paper Industry in Sweden. J. Clean. Prod. 2018, 183, 1216–1227. [Google Scholar] [CrossRef]
- Arts, B.; Leroy, P.; van Tatenhove, J. Political Modernisation and Policy Arrangements: A Framework for Understanding Environmental Policy Change. Public Organ. Rev. 2006, 6, 93–106. [Google Scholar] [CrossRef]
- Driessen, P.P.J.; Dieperink, C.; van Laerhoven, F.; Runhaar, H.A.C.; Vermeulen, W.J.V. Towards a Conceptual Framework for The Study of Shifts in Modes of Environmental Governance—Experiences From The Netherlands. Environ. Policy Gov. 2012, 22, 143–160. [Google Scholar] [CrossRef]
- Jordan, A.; Wurzel, R.; Zito, A.R.; Brückner, L. European Governance and the Transfer of ‘New’ Environmental Policy Instruments (Nepis) in the European Union. Environ. Policy Eur. Union Second. Ed. 2012, 81, 317–335. [Google Scholar] [CrossRef]
- Bulkeley, H.; Coenen, L.; Frantzeskaki, N.; Hartmann, C.; Kronsell, A.; Mai, L.; Marvin, S.; McCormick, K.; van Steenbergen, F.; Voytenko Palgan, Y. Urban Living Labs: Governing Urban Sustainability Transitions. Curr. Opin. Environ. Sustain. 2016, 22, 13–17. [Google Scholar] [CrossRef]
- Egusquiza, A.; Cortese, M.; Perfido, D. Mapping of Innovative Governance Models to Overcome Barriers for Nature Based Urban Regeneration. IOP Conf. Ser. Earth Environ. Sci. 2019, 323, 012081. [Google Scholar] [CrossRef]
- PricewaterhouseCoopers, B. Biodiversity Offsets and the Mitigation Hierarchy: A Review of Current Application in the Banking Sector—A Study Completed on Behalf of the Business and Biodiversity Offsets Programme and the UNEP Finance Initiative. Case Study 2010, 43. [Google Scholar]
- Droste, N.; Schröter-Schlaack, C.; Hansjürgens, B.; Zimmermann, H. Implementing Nature-Based Solutions in Urban Areas: Financing and Governance Aspects. In Nature-Based Solutions to Climate Change Adaptation in Urban Areas; Theory and Practice of Urban Sustainability Transitions; Kabisch, N., Korn, H., Stadler, J., Bonn, A., Eds.; Springer: Berlin/Heidelberg, Germany, 2017. [Google Scholar] [CrossRef]
- United States Department of Agriculture. Urban Hydrology for Small Watershed, 2nd ed.; Soil Conservative; 210-VI-TR-55; U.S. Department of Agriculture: Washington, DC, USA, 1986. [Google Scholar]
- Allen, R.G.; Pereira, L.S.; Raes, D.; Smith, M. FAO Irrigation and Drainage Paper No. 56—Crop Evapotranspiration; Food and Agriculture Organization of the United Nations: Rome, Italy, 1998. [Google Scholar]
- ENEA Atlante Italiano Della Radiazione Solare. Definizione Delle Grandezze Coinvolte Nei Calcoli. Available online: www.solaritaly.enea.it/CalcComune/Definizioni.php (accessed on 10 August 2021).
- Arpa Piemonte Bacini Idrografici. Available online: http://webgis.arpa.piemonte.it/geoportalserver_arpa/catalog/search/resource/details.page?uuid=ARLPA_TO%3A12.01.01-D_2011-06-21-11%3A30 (accessed on 10 August 2021).
- Pastorello, M. Proposte Metodologiche per Un Regolamento Di Invarianza Idraulica e Idrologica Nel Territorio Torinese. Politecnico Di Torino, Corso Di Laurea Magistrale in Pianificazione Territoriale, Urbanistica e Paesaggistico Ambientale. Master Thesis, Politecnico di Torino, Turin, Italy, 2019. Available online: https://webthesis.biblio.polito.it/11898/ (accessed on 10 January 2023).
- University of Turin Stazione Meteorologica Di Fisica Dell’Atmosfera. Dipartimento Di Fisica. Available online: http://www.cinfaimeteo.to.infn.it/ (accessed on 10 January 2023).
- Regione Piemonte Prezzario Regionale Delle Opere Pubbliche. Available online: http://www.sistemapiemonte.it/cms/privati/territorio/servizi/929-consultazione-prezzario-regionale-opere-pubbliche/3596-prezzario-2021 (accessed on 10 August 2021).


Disclaimer/Publisher’s Note: The statements, opinions and data contained in all publications are solely those of the individual author(s) and contributor(s) and not of MDPI and/or the editor(s). MDPI and/or the editor(s) disclaim responsibility for any injury to people or property resulting from any ideas, methods, instructions or products referred to in the content. |
© 2023 by the authors. Licensee MDPI, Basel, Switzerland. This article is an open access article distributed under the terms and conditions of the Creative Commons Attribution (CC BY) license (https://creativecommons.org/licenses/by/4.0/).