Article

Consistency Analysis of Multi-Source Remote Sensing Land Cover Products in Arid Regions—A Case Study of Xinjiang

1
College of Geography and Remote Sensing Sciences, Xinjiang University, Urumqi 830017, China
2
College of Ecology and Environment, Xinjiang University, Urumqi 830017, China
3
Key Laboratory of Oasis Ecology, Ministry of Education, Xinjiang University, Urumqi 830017, China
4
Technology Innovation Center for Ecological Monitoring and Restoration of Desert-Oasis, Ministry of Natural Resources, Urumqi 830002, China
5
Institute of Desert Meteorology, China Meteorological Administration, Urumqi 830002, China
*
Authors to whom correspondence should be addressed.
Land 2023, 12(12), 2178; https://doi.org/10.3390/land12122178
Submission received: 20 November 2023 / Revised: 11 December 2023 / Accepted: 13 December 2023 / Published: 17 December 2023

Abstract

:
Arid regions are considered to be among the most ecologically fragile and highly sensitive to environmental change globally, and land use and land cover conditions in the region directly influence large-scale ecosystem processes. Currently, thanks to diverse remote sensing platforms, geographers have developed an array of land cover products. However, there are differences between these products due to variations in spatio-temporal resolutions. In this context, assessing the accuracy and consistency of different land cover products is crucial for rationalizing the selection of land cover products to study global or regional environmental changes. In this study, Xinjiang Uygur Autonomous Region (XUAR) is taken as the study area, and the consistency and performance (type area deviation, spatial consistency, accuracy assessment, and other indexes) of the five land cover products (GlobeLand30, FROM_GLC30, CLCD, GLC_FCS30, and ESRI) were compared and analyzed. The results of the study show that (1) the GlobeLand30 product has the highest overall accuracy in the study area, with an overall accuracy of 84.06%, followed by ESA with 75.57%, while CLCD has the lowest overall accuracy of 70.05%. (2) The consistency between GlobeLand30 and CLCD (area correlation coefficient of 0.99) was higher than that among the other products. (3) Among the five products, the highest consistency was found for water bodies and permanent snow and ice, followed by bare land. In contrast, the consistency of these five products for grassland and forest was relatively low. (4) The full-consistency area accounts for 49.01% of the total study area. They were mainly distributed in areas with relatively homogeneous land cover types, such as the north and south of the Tianshan Mountains, which are dominated by bare land and cropland. In contrast, areas of inconsistency make up only 0.03% and are mostly found in heterogeneous areas, like the transitional zones with mixed land cover types in the Altai Mountains and Tianshan Mountains, or in areas with complex terrain. In terms of meeting practical user needs, GlobeLand30 offers the best comprehensive performance. GLC_FCS30 is more suitable for studies related to forests, while FROM_GLC30 and ESRI demonstrate greater advantages in identifying permanent ice and snow, whereas the performance of CLCD is generally average.

1. Introduction

Land cover represents a composite of various material types on the Earth’s surface, along with their inherent attributes and features [1]. It is a primary factor influencing global environmental changes and is the outcome of the combined interactions of human and natural activities [2]. The spatial layout and dynamics of land cover critically affect material cycles, the equilibrium of water and thermal elements, and the structure and functionality of ecosystems [3,4,5,6,7]. Therefore, obtaining a precise comprehension of land cover distribution and its shifts at global and regional levels is pivotal for numerous studies on land surface processes [8,9,10]. Evaluating the quality and categorization accuracy of existing land cover products aids in refining the precision of subsequent land cover mappings [11,12], marking its significant scientific relevance.
Remote sensing represents the most prevalent method for swiftly gathering land cover information on a global or regional scale [13,14,15]. Currently, a diverse array of global land cover products with varying resolutions are available for selection on a worldwide basis. These include the DISCover land cover product from the International Geosphere-Biosphere Programme (IGBP) [16,17], the GlobCover from the European Space Agency (ESA) [18], the Climate Change Initiative Land Cover dataset (CCI_LC) [19], GLC2000 from the European Union Joint Research Centre [17], UMD_LC from the University of Maryland [20], and the 500 m resolution land cover product from MODIS (MOD12Q1) [21]. These products hold inestimable significance in surface studies and have been widely employed across various application domains [22,23], particularly playing a crucial role in studying land cover changes [24]. However, evaluations suggest that these products have certain limitations, including lower resolution, lack of spatial detail, and varying classification systems and methodologies. These disparities inevitably influence the applicability of land cover products in practical research domains [25,26].
In recent years, thanks to the accessibility of high-resolution satellite data and advancements in computational and storage technology, the trend in global land cover mapping is leaning towards producing datasets of superior spatial resolution with more intricate classification details [27,28]. Consequently, land cover products tailored to specific analytical application needs have been launched one after another [29]. Some examples are GlobeLand30, spearheaded by the National Geomatics Center of China (NGCC) [30]; GLC_FCS30, developed by the Aerospace Institute of the Chinese Academy of Sciences [31]; and FROM-GLC, by Tsinghua University [32]. Moreover, thanks to the launch of the Sentinel series of satellites, several institutions have recently produced land cover products with a 10 m spatial resolution. These include the WorldCover by the European Space Agency (ESA) [33], land cover products by the Environmental Systems Research Institute (ESRI) [34], and FROM_GLC10 by Tsinghua University [35], which were developed using deep learning and random forest methodologies, respectively. The advent of these high-resolution GLC products offers potential users rich spatial details [36].
In previous studies, several scholars have compared and analyzed various land cover products in different regions [37,38,39,40,41]. The primary assessment methods are sample evaluation and comparative evaluation. Giri et al. [42] conducted a comparison of the GLC2000 and MODIS land cover products. The results indicated that although they maintain high consistency overall, notable disparities exist in the spatial distribution of the finer land cover types. Song et al. [43,44] validated and compared the applicability and accuracy of four low-resolution land cover products in China. The results showed that while the four products demonstrated consistency at the overall scale, there were notable differences at the local scale, especially in the southeastern and southwestern regions. Wickham et al. [45] assessed the accuracy of the National Land Cover Database (NLCD) 2011’s land cover. Their findings indicated that the overall accuracies for single-date land cover in 2001, 2006, and 2011 were 82%, 83%, and 83%, respectively. Despite the high accuracy for single dates, the accuracy was not always high for specific land cover change themes. Xu et al. [46] compared the consistency of ESA-S2, CGLS-LC100, and FROM_GLC30 across Africa, and the results indicated that all three products had an accuracy of over 60%. However, there were substantial spatial discrepancies among the three products, with 43.12% of Africa’s total area showing low consistency. These study cases demonstrate the importance and value of analyzing the consistency of land cover products from different perspectives and regions.
Xinjiang, with its vast territory and diverse topography, serves as the core area of the arid region in northwest China and holds a critically important position in the ecological and geographical layout of Central Asia. The arid region it lies within features some unique land cover types. Due to the complexities of perception standards and geographical spatial patterns [47], there is uncertainty surrounding the accuracy and applicability of land cover products in these areas. Additionally, Xinjiang boasts a diverse geographical environment, including high mountains, basins, grasslands, and deserts, giving rise to a unique landscape. This diversity leads to various land cover types, making it an exemplary region for analyzing the consistency of land cover products. In recent years, global climate change and intensified human activities have led to increasingly prominent ecological and environmental issues in Xinjiang, such as land desertification, soil salinization, and grassland degradation. Currently, studies on land use/cover changes in Xinjiang primarily focus on products with a lower spatial resolution. These products have certain limitations when it comes to in-depth studies on ecological and environmental changes, climate change, and the evolution of human activities. Whether high-resolution products can adequately meet research needs in specific areas, and how to select from a multitude of high-spatial-temporal resolution land cover products based on user application requirements, are issues that await further study. Therefore, exploring the dynamic changes in and type composition and spatial distribution of Xinjiang’s land cover necessitates a consistency analysis and accuracy assessment of high-resolution land cover products to better fulfill the scientific requirements of current regional changes and sustainable development studies.
In order to comprehensively and accurately understand the consistency and accuracy of Xinjiang’s land cover products, this study focuses on Xinjiang, located in a typical arid region, and conducts a more detailed analysis of five high-resolution land cover products. The objectives were as follows: (1) To employ methods such as area deviation, spatial consistency, and accuracy assessment to compare and analyze five land cover products in Xinjiang (GlobeLand30, FROM_GLC30, CLCD, GLC_FCS30, ERSI). (2) To reveal the spatial distribution of consistency and discrepancies among these products and analyze the characteristics of land cover classification in Xinjiang. (3) To explore the factors and reasons causing inconsistencies in the classification results of land cover products. The study results can serve as a reference for studies on land use/cover changes, remote sensing, and environmental changes in Xinjiang and the arid regions of Central Asia.

2. Materials and Methods

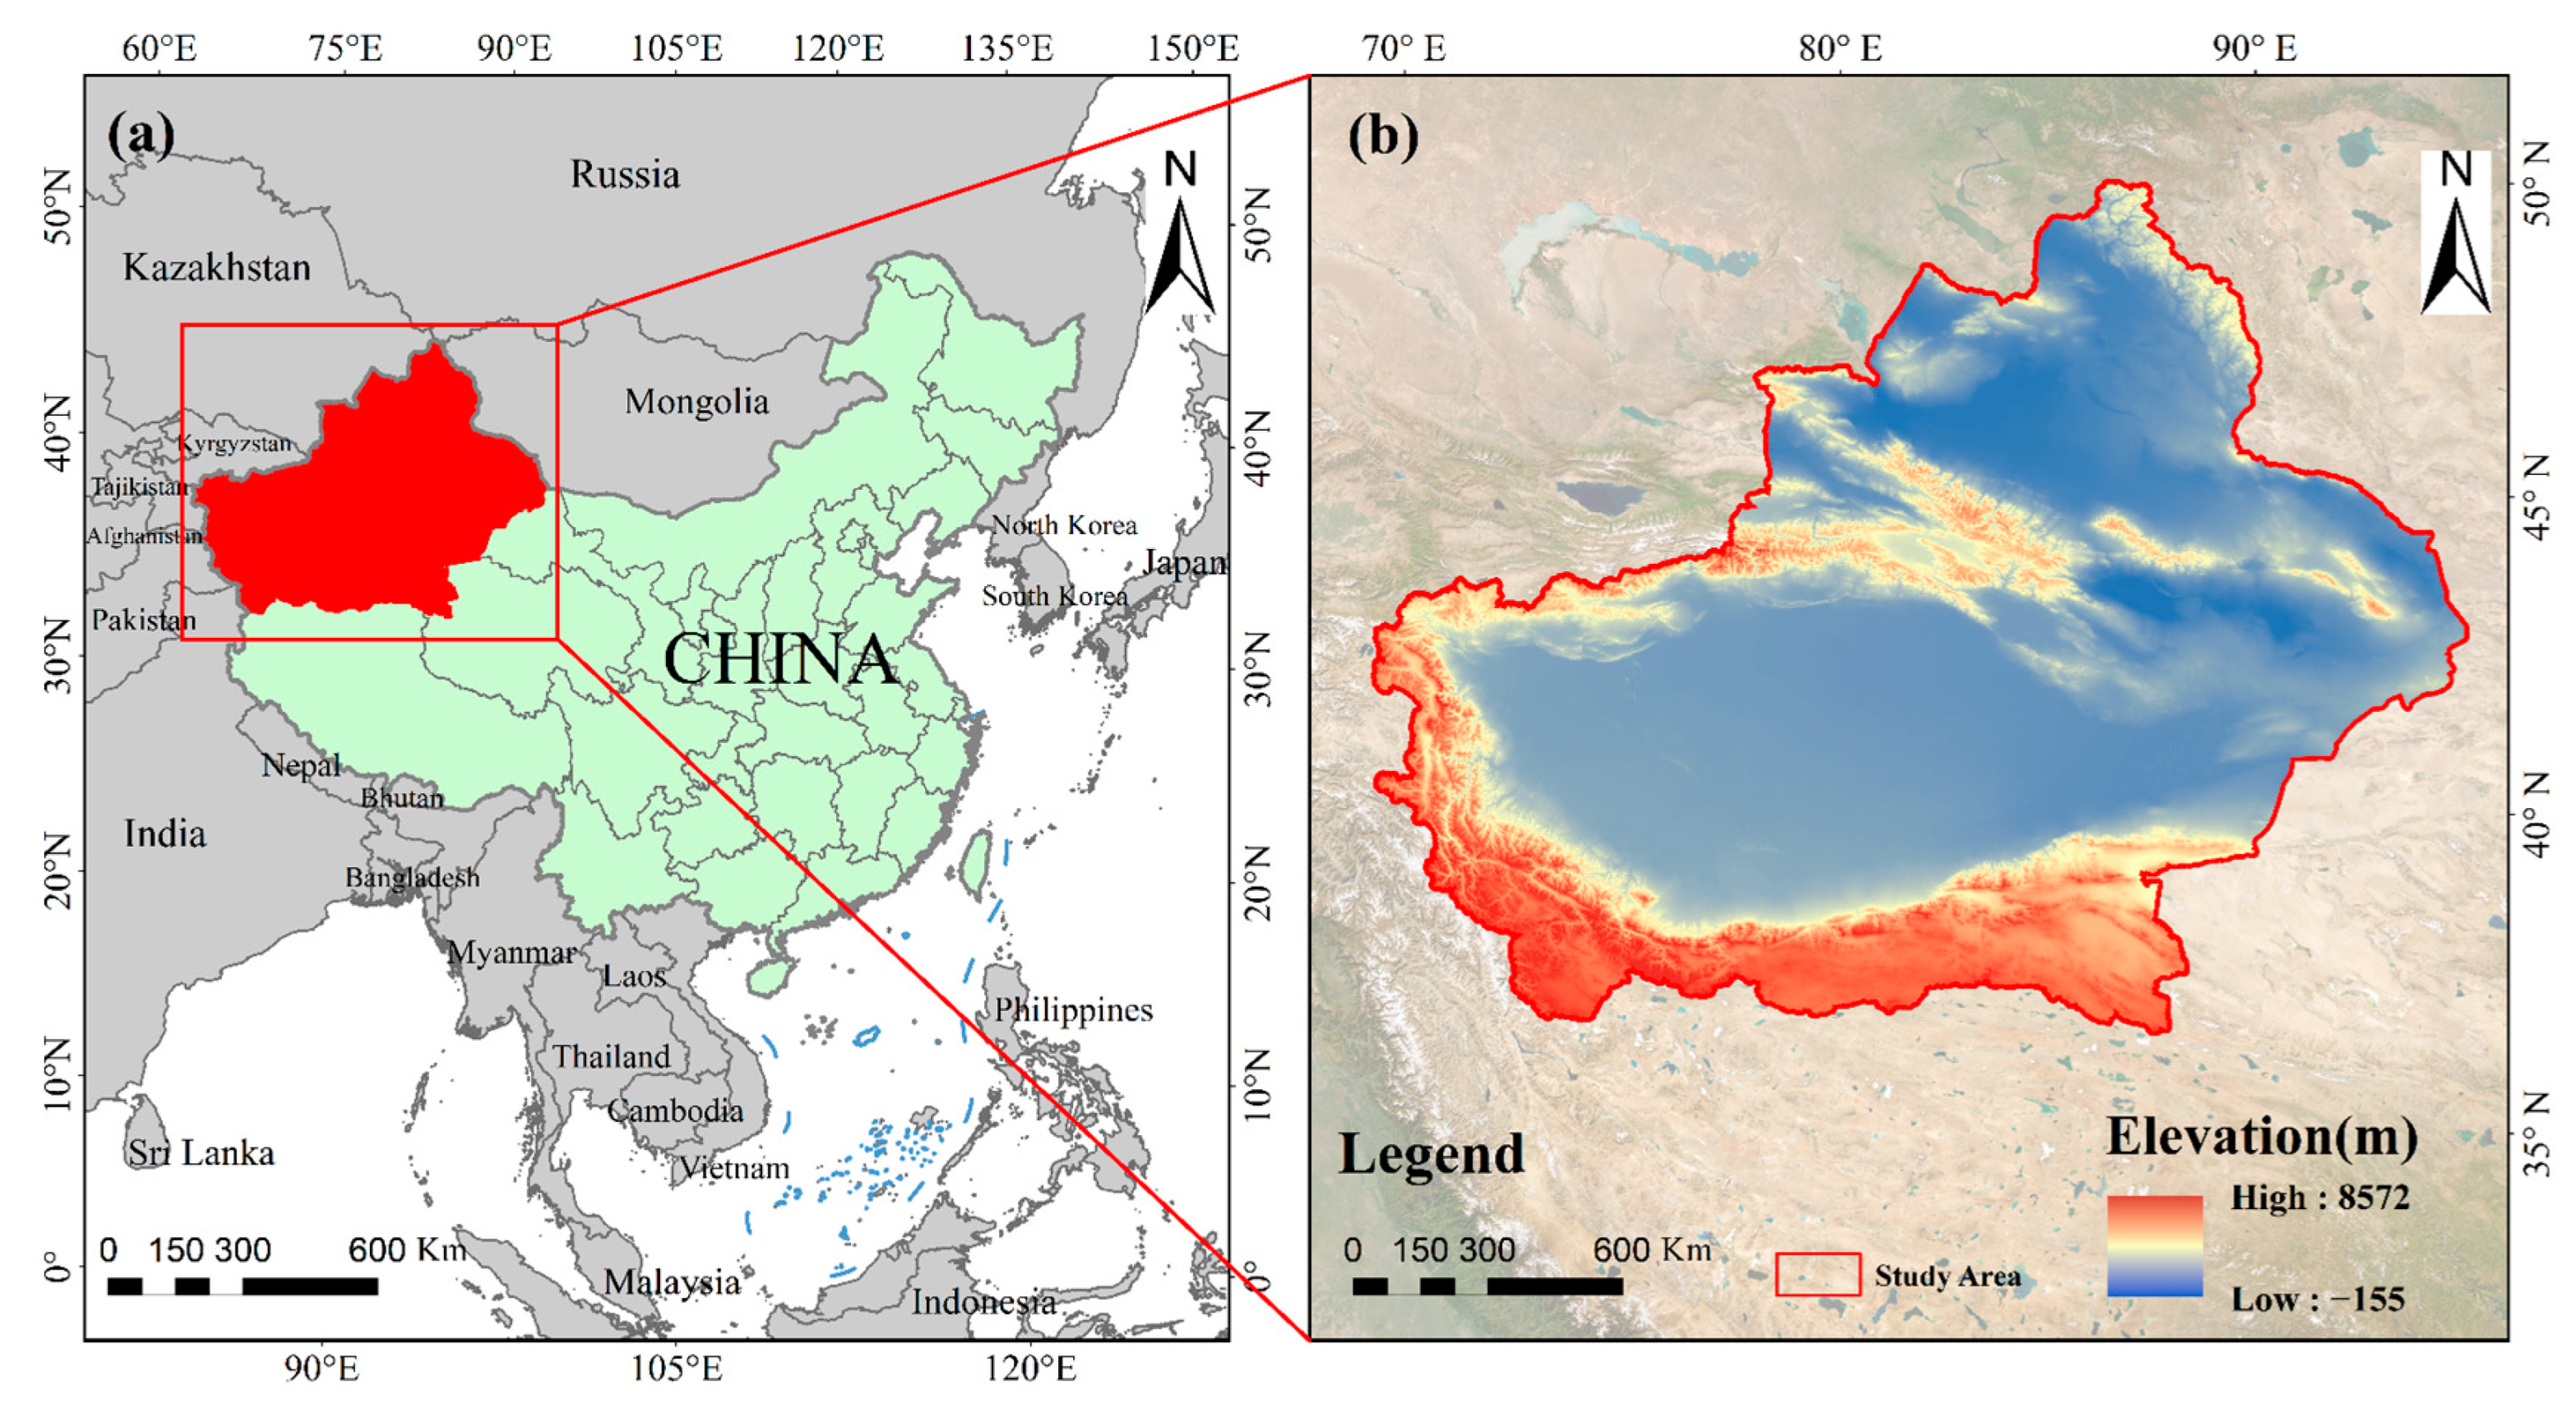
2.1. Overview of the Study Area

Xinjiang, located in the northwest of China, stretches from 73°40′ E to 96°23′ E in longitude and from 34°22′ N to 49°10′ N in latitude. It occupies a significant portion of the Eurasian hinterland, covering 1,664,900 km2, or about one-sixth of China’s total land area. It shares borders with domestic provinces such as Tibet, Qinghai, and Gansu, and internationally with countries like Mongolia, Russia, and Kazakhstan. With a land border extending over 5700 km, it accounts for nearly a quarter of China’s entire boundary. Xinjiang is the provincial administrative region with the most extensive land area and the highest number of neighboring countries in China (Figure 1).
The geographical characteristics of Xinjiang can be summarized as “three mountains with two basins”. The Kunlun Mountains are in the south, the Altai Mountains are in the north, and the Tianshan Mountains run through the center, dividing Xinjiang into its southern and northern regions. The climate is typical of a temperate continental area, with low rainfall and high evaporation rates, resulting in an average annual precipitation of around 170.6 mm.

2.2. Data Sources

For this study, five high-resolution land cover products were selected from diverse global and regional datasets to undertake consistency and accuracy analyses. All of these products are from the year 2020, except FROM-GLC30, which is from 2017. The selections include GlobeLand30 (http://www.globallandcover.com/, accessed on 12 July 2023), developed by the National Geomatics Center of China (NGCC); GLC_FCS30 (https://data.casearth.cn/, accessed on 16 July 2023), developed by the Aerospace Information Research Institute, Chinese Academy of Sciences (AIR); FROM_GLC30, from Tsinghua University (http://data.ess.tsinghua.edu.cn/, accessed on 19 July 2023); CLCD, by Wuhan University (https://zenodo.org/records/5816591, accessed on 24 July 2023); and ESRI land cover products by the Environmental System Research Institute (ESRI) (https://www.arcgis.com/apps/instant/media/index.html?appid=fc92d38533d440078f17678ebc20e8e2, accessed on 30 July 2023). Among these, GlobeLand30 and FROM_GLC30 each include 10 land types, CLCD includes 9 types, while GLC_FCS30 has 29 types, and ESRI includes 11. The main characteristics of the five products are detailed in Table 1.

2.3. Data Preprocessing

In order to facilitate a comparative analysis, a series of preprocessing tasks need to be performed on the study area before accuracy assessment and consistency analysis. These preprocessing tasks include data mosaicking and clipping, projection transformation, and the unification of classification systems. Considering the particular geographic location of Xinjiang and the subsequent comparative analysis of the area of different cover types, the WGS-84 coordinate system was used in this study, and the Albers_Conic_Equal_Area projection was selected. This projection system is suitable for the geographic characteristics of the Xinjiang region while maintaining the area proportions.
Assessing the consistency among various land cover products presents a challenge, largely attributed to the significant disparities in their classification systems. To address this issue, this study will use the GlobeLand30 classification system as a baseline and develop a new land cover classification system that is better designed to reflect the unique features of the study area. The new classification includes eight types: cropland, forest, grassland, bare land, wetland, water, permanent snow and ice, and impervious surface. The development of this classification system will help to establish comparability between different land cover products for better consistency analysis. It should be noted that due to the specificity of the ESRI product, its spatial resolution is 10 m. To ensure consistency with the other four products, it was resampled to 30 m.
Meanwhile, the number of “cloud” pixels in the ESRI product constitutes a tiny proportion of the total number of pixels in the study area; therefore, they have been omitted. Moreover, the year of production for FROM_GLC30 differs by three years compared to the other products. However, many studies have shown that the land cover changes during this period at large scales are almost negligible compared to the classification error of land cover products [48]. Table 2 presents the detailed system category correspondences and subsumption relationships, Table 3 lists the original classification systems and codes for the land cover products, and Figure 2 shows the spatial distribution of the five preprocessed products.

2.4. Type Area Deviation Analysis

The coefficient of deviation serves as an effective measure [49] to assess the classification accuracy of land cover types. This study tallied the area of various land cover types across five products. The coefficient of deviation for each type’s area was determined using the average area of identical types from the five products as a reference. The formula is as follows:
D x k = ( x k k ¯ 1 ) × 100 %
where x is the land cover product; k is the land cover type, k 8 ; x k is the area of type k in product x , and is the mean value of the area of the five product types k ; and D x k is the coefficient of deviation of the area of type k in product x , with a positive value representing a larger area relative to the mean, and a negative value representing a smaller area relative to the mean.

2.5. Compositional Similarity Analysis

The analysis of compositional similarity quantifies the extent of resemblance in the composition of identical land cover types across varied land cover products. By calculating the area for each type within a given product, the congruence in composition for each type between products is assessed. The formula is provided below:
R i = k = 1 8 ( X k X ¯ ) ( Y k Y ¯ ) k = 1 8 ( X k X ¯ ) 2 k = 1 8 ( Y Y ¯ ) 2
Where R i denotes the correlation coefficient of the area; k is the land cover type; X k and Y k denotes the area of type k in product X and Y (km2); X ¯ denotes the mean value of the area of all eight land types in product X (km2); and Y ¯ denotes the mean value of the area of all eight land types in product Y (km2).

2.6. Spatial Consistency Analysis

To visually represent the spatial consistency of various land cover products, the spatial overlay method [41] was employed to ascertain the pixel-by-pixel spatial correspondence among the five products. According to the consistency of different land types across these products, the following levels were established, ranging from high to low:
Full consistency (the types indicated by the five land cover products were identical);
High consistency (the indicated types were the same in the four products);
Moderate consistency (the indicated types were the same in the three products);
Low consistency (the indicated types were the same in the two products);
Inconsistency (the indicated types differed among the five products).
Figure 3 shows a schematic diagram of the spatial overlay of bare ground types.

2.7. Accuracy Evaluation

2.7.1. Confusion Matrix Analysis

Confusion matrix analysis is one of the most commonly used methods for accurately assessing land cover products [50]. The accuracy metrics derived from the confusion matrix are mainly producer accuracy (PA), user accuracy (UA), overall accuracy (OA), and Kappa coefficient. The formulas for these indicators are below:
P A i = x i i x + i × 100 %
U A i = x i i x i + × 100 %
O A = i = 1 n x i i N × 100 %
K a p p a = N i = 1 n x i i i = 1 n x i + + x + i N 2 i = 1 n x i + + x + i
where N is the total number of sample points, n represents number of rows in the confusion matrix; x i i is the number of samples in the row i and column i of the confusion matrix; and x i + and x + i are the total number of samples in row i and column i , respectively.

2.7.2. Land Cover Product Validation Sample Data Construction

Securing precise validation samples is paramount for an effective accuracy assessment. However, when dealing with large-scale land cover products, field collection of these samples can be constrained by economic and temporal factors. In this study, an adept and efficient approach was adopted for sample collection, namely the visual interpretation of 2020 Google Earth imagery over Xinjiang. This study employed a simple and effective method for sample collection, namely the visual interpretation of 2020 Google Earth imagery over Xinjiang. This method is favored for its precise positioning, encompassing temporal phases, superior resolution, and easy accessibility, establishing it as a primary data source [51,52] for accuracy assessments. To mitigate potential biases arising from human subjectivity and errors in interpretation affecting sample quality, the following guiding principles were adhered to: (1) The study area was systematically divided using a regular grid, concentrating the sampling within the grid’s central regions. This strategy ensures that samples predominantly come from homogenous zones with a defined extent, aiming to enhance the interpretive accuracy. (2) For certain samples presenting interpretation challenges, auxiliary data sources are incorporated to bolster interpretation. For example, differentiation between bare land and constructed terrains is aided by harnessing the capabilities of the Geo-wiki platform [53]. (3) When interpretation results show discrepancies, they undergo independent review by multiple individuals. Should a consensus not be reached post-discussion, the relevant samples are discarded. (4) To maintain sample point representativeness, stratified random sampling is applied, factoring in the area size of each land cover type. This approach ensures a balanced distribution of samples across various types. Following these principles, a selection of 5435 validation samples from across the study area was gathered through visual interpretation methods. Among these samples, there were 865 for cropland, 1482 for forest, 694 for grassland, 617 for bare land, 453 for wetland, 337 for water, 364 for snow/ice, and 533 for impervious surface. The spatial distribution of these samples is shown in Figure 4.

3. Results

3.1. Type Area Deviation Analysis

The area deviations for the five land cover product types are shown in Figure 5. The area percentages for the cropland, bare land, and permanent snow and ice types are pretty consistent across all five product types, signifying only a minimal deviation. This consistency underscores a relatively uniform classification approach for these land cover types among the products. However, when delving into other types, the deviation becomes pronounced, indicating considerable disparities in classification outcomes. For example, the ESRI product stands out with its significant deviation in the forest and grassland types, registering deviations of 66.40% and 72.70%, respectively. This suggests a potential difference in the classification criteria or methodology adopted by ESRI for these types. GlobeLand30, on the other hand, reveals a marked inclination towards classifying larger areas as wetlands, as evidenced by its 159.48% deviation. This might indicate a broader definition of wetlands in its classification system. In contrast, both CLCD and GLC_FCS30 exhibit a more conservative approach to wetland classification, with deviations of −85.89% and −60.09%, respectively. FROM_GLC30 stands out in the water bodies type, showcasing a deviation of 52.57%. This suggests that FROM_GLC30 might be capturing more water bodies or classifying certain borderline areas as water, compared to other products. In addition, the forest area in GLC_FCS30 witnesses a notable deviation of 151.67%. This points to the possibility that GLC_FCS30 might have a broader or different interpretation of what definition of forest. To sum up, while the five land cover products exhibit relatively good consistency for types like cropland, water bodies, and permanent snow and ice in Xinjiang, stark differences emerge in other types. These disparities highlight the importance of understanding the underlying classification standard of each product. Users must exercise discretion when selecting a product, ensuring it aligns with the specific nuances and requirements of their study or application.

3.2. Analysis of the Composition of Land Cover Types

Figure 6 shows the area statistics of various land cover types in Xinjiang across five distinct products. Overall, these products show a consistent depiction of land cover types in Xinjiang. However, variations are observed with the ESRI product in certain types. For example, while most products show more than 65% of the region as bare land, the ESRI product shows it at only 49.74%. Grassland, another main land cover type, has varied representation among the products, ranging from 14.92% to 40.90%. The ESRI product, in particular, depicts a higher percentage of grassland at 40.90% compared to the other products. For cropland, the percentages are relatively close across products, between 5.01% and 6.29%. Both GlobeLand30 and GLC_FCS30 show similar percentages of 6.29% and 6.18%, respectively. Forest areas vary more, ranging from 0.73% to 5.48%, with GLC_FCS30 showing the highest at 5.48%. Other types such as permanent snow and ice range from 2.07% to 3.45%. Wetlands, water bodies, and impervious surfaces, although smaller in percentage, display a high degree of consistency among certain products. Specifically, the CLCD and ESRI products show similar percentages for wetlands, at 0.03% and 0.09%, respectively. For water bodies, CLCD, GLC_FCS30, and ESRI all show close percentages around 0.65%, 0.60%, and 0.66%, respectively. Impervious surfaces are consistent across products, ranging from 0.30% to 0.79%.
In terms of correlation among the five land cover products, there is a high level of consistency. CLCD, in particular, has a strong correlation with other products, with coefficients above 0.92. The highest correlation is between CLCD and GlobeLand30 at 0.99. In contrast, ESRI’s correlation with other products is somewhat lower, with the lowest being 0.85 with FROM_GLC. GLC_FCS30 follows with a coefficient of 0.88. Table 4 shows the area correlation coefficients between the different products.

3.3. Spatial Consistency of Multi-Source Products

3.3.1. Consistency of Spatial Distribution

Figure 7 shows the spatial distribution characteristics related to the consistency of primary land cover types in Xinjiang. The details are as follows:
Cropland (Figure 7a) is one of the primary land cover types in Xinjiang and is predominantly found in the Altai Mountains area, around the Tianshan Mountains, and in the Tarim Basin. The areas with full consistency are particularly pronounced, accounting for 63.39% of the total cropland area. These areas are primarily situated on the northwestern fringe of the Tarim Basin and the northern slopes of the Tianshan Mountains.
Forest (Figure 7b) is primarily distributed in the Ili River Valley, the southern Tianshan Mountains, and the Altai Mountains. In these areas, land cover products identify forests with a high level of consistency. However, most other areas show recognition of the forest by only one or two products, leading to notable misclassification with grasslands.
Grasslands (Figure 7c) are prevalently distributed in areas such as the northern slopes of the Tianshan Mountains, the Ili River Valley, and the Kunlun Mountains. Out of the total grassland area in Xinjiang, full-consistency areas account for 24.54%, high-consistency areas account for 29.64%, and areas with low consistency represent 36.15%.
Bare land (Figure 7d), the most dominant and widespread land cover type in Xinjiang, is situated in areas like the Junggar Basin, Tarim Basin, Tuha Basin, and parts of the Pamir Plateau. Analysis indicates that five land cover products offer relatively high recognition rates for bare land. The majority of areas are identified as bare land by four or more products, with full and high-consistency areas covering 94.15% of Xinjiang’s total bare land. Low-consistency areas account for 8.7%, primarily found in the midsection of the Tianshan and between the Kunlun Mountains. These intermountain transition areas often display confusion in identifying bare land types. Moreover, the vague definitions of bare land, transitions between bare land and cropland, and between bare land and grassland can lead to reduced consistency among different remote sensing products.
Water bodies (Figure 7e) align with the spatial distribution of significant lakes (e.g., Bosten Lake, Sayram Lake, Ulungur Lake) and major rivers (e.g., Irtysh River, Ili River, Tarim River) in Xinjiang. The five products demonstrate a high level of consistency in identifying water bodies, with most areas being indicated as water bodies by three or more products.
Impervious surfaces (Figure 7f) are predominantly found on the fringes of oases in Xinjiang and along river valleys, especially in the urban clusters formed on the northern slope of the Tianshan Mountains, such as Urumqi, Changji, Shihezi, and Kuitun. The five products exhibit a high level of consistency in recognizing impervious surfaces, with the majority of areas indicated as such by four or more products.
Based on the analysis of spatial consistency for individual land cover types, an integrated spatial consistency map for all types from the five products was obtained (Figure 7). Overall, the highest consistency among the five products was observed in the Junggar Basin, Turpan Basin, Tarim Basin, and some intermountain areas in Xinjiang. The spatial consistency was relatively lower in parts of the Altai Mountains, the southern slopes of the Tian Shan, and the northern regions of the Tarim Basin.
After further statistical examination, as shown in Figure 8, the five land cover products exhibit full consistency, covering 49.01% of Xinjiang’s entire area. High-consistency areas represent 32.26%, while those with moderate consistency comprise 16.05%. Conversely, regions with low consistency amount to 2.65% of Xinjiang’s total landmass, and areas with inconsistency are a mere 0.03%. Interpreting this data, if we set an approx 80% confidence threshold—meaning that over four out of the five products concurrently indicate the same type—the prevailing global satellite remote sensing products are highly consistent across approximately 80% of Xinjiang’s land. However, the remaining 20% signifies a potential area of enhancement regarding consistency among different products.

3.3.2. Comparison with High-Resolution Imagery from Google Earth

Using high-resolution imagery from Google Earth, three distinct locations within the study area were selected for verification (as shown in Figure 9) to validate the accuracy and consistency of the three land cover products. At location A, GlobeLand30, FROM_GLC30, and GLC_FCS30 products demonstrated relatively high spatial consistency (Figure 9A). These products show high consistency in the spatial distribution of cropland, bare land, and water bodies. However, there were notable variations in their differentiation between vegetation and impervious surfaces. The distinction between forest and grasslands made by GlobeLand30, FROM_GLC30, and CLCD was more refined and consistent. In contrast, GLC_FCS30 overestimated the forest areas, while ERSI overestimated grassland areas. GlobeLand30, GLC_FCS30, and ERSI displayed high consistency in differentiating impervious surfaces, whereas FROM_GLC30 and CLCD exhibited more inconsistency, classifying isolated impervious areas within cropland as grasslands.
In location B, all five products were consistent in differentiating cropland, and their differentiation of impervious surfaces was similar to that in location A (Figure 9B). GlobeLand30, FROM_GLC30, and CLCD displayed relatively high consistency in distinguishing between grasslands and bare land, whereas GLC_FCS30 and ERSI exhibited significant confusion between the two. This discrepancy is primarily due to GLC_FCS30 defining bare land as those with vegetation cover below 15%, while ERSI’s threshold is 10%, resulting in difficulty in accurately differentiating between grasslands and bare land. Given the smaller area of water bodies in location B, the consistency among the five products was lower compared to location A.
Observations from location C in Figure 9 reveal that the five products were highly consistent in their accuracy and consistency concerning water bodies. However, CLCD and GLC_FCS30 showed significant confusion between wetlands and water bodies, failing to accurately identify wetlands. FROM_GLC30 and GLC_FCS30 were more precise in distinguishing forests, while the other three products did not identify scattered forest areas.
In summary, the comparative analysis of the five products indicates that areas with similar spectral and textural features, such as forests and grasslands, displayed higher inconsistency in classification results. With regard to the level of detail in classification, GlobeLand30 generally excels in depicting the intricate details of land cover features, while the descriptions provided by other products tend to be more cursory.

3.4. Accuracy Assessment Results

Based on the fundamental accuracy formulas, computed accuracy data are illustrated in Table 5. The results indicate that the overall accuracy of all five products exceeds 70%. Specifically, GlobeLand30 achieves the highest overall accuracy and Kappa coefficient, registering at 84.06% and 0.82, respectively. ESRI follows with an overall accuracy of 75.57% and a Kappa coefficient of 0.72. In contrast, CLCD records the lowest overall accuracy and Kappa coefficient, at 70.05% and 0.65, respectively. Overall, the validation samples suggest a notable advantage in classification accuracy for the GlobeLand30 product.
However, there are variations in classification accuracy among different land cover types for the five products. For croplands, GlobeLand30 has the highest accuracy, with minimal differences between the producer’s accuracy (PA) and the user’s accuracy (UA) across the products. Conversely, CLCD and GLC_FCS30 demonstrate lower user accuracy, at 76.01% and 72.94%, respectively. For forests, most products show high accuracy levels, but GLC_FCS30 reveals a considerable gap between its PA and UA, which are 94.84% and 59.35%, respectively. The underlying reason might be that shrublands within the forest type and grasslands exhibit spectral similarities, making accurate differentiation challenging during remote sensing interpretation. The accuracy for grasslands is lower for all products, particularly for GLC_FCS30, which exhibits both PA and UA below 65%. For bare land, wetlands, and water bodies, GlobeLand30 has higher accuracy metrics, especially with both PA and UA for bare land exceeding 80%. There is a significant variation between PA and UA for wetlands across products, with CLCD’s user accuracy for wetlands reaching 100%, but its PA is only 6.62%. Both ESRI and GlobeLand30 achieve accuracy levels for water bodies with both PA and UA above 70%. For permanent ice and snow, except for CLCD’s PA at 88.40%, the other products consistently show PA and UA above 90%. Specifically, FROM_GLC has PA and UA values of 92.82% and 99.12%, respectively, with ESRI closely following. In terms of impervious surfaces, ESRI and GlobeLand30 display higher accuracy values, with both PA and UA above 85%, whereas CLCD has lower metrics.

4. Discussion

4.1. Impact of Geographic Features on Land Cover

Xinjiang, as the largest land area provincial administrative region in China, encompasses an extensive territory rich in resources. It contains unique and diverse geographical characteristics, which profoundly impact the distribution and classification accuracy of land cover. Firstly, climate, topographic, and hydrological conditions can affect land cover types in different regions. Northern Xinjiang is relatively humid, with more precipitation, which may form more wetlands and cropland, while desert areas with dry climates are dominated by bare land and desert vegetation. The diversity of topography also has a certain impact on the accuracy of land cover classification [54]. Variations in land cover characteristics are prevalent across different landforms. Steep hillsides or intermountain transition areas may present problems in remote sensing images due to shadow effects, increasing the difficulty of land cover classification. Therefore, topographic differences must be considered in land cover mapping to ensure accurate classification and monitoring.
Secondly, Xinjiang is inland in northwest China and far from the ocean, with scarce precipitation and a typical semi-arid and arid climate, with a long-term average annual precipitation of less than 200 mm [55]. At the same time, evapotranspiration is abnormally high, which leads to blurred boundaries of land cover types. In addition, water resources in Xinjiang are limited, and the distribution of wetlands and water bodies is relatively small [56,57], making monitoring of these types even more critical.
Lastly, human economic activities also greatly impact land cover [2]. As the core area of the “One Belt, One Road” development strategy, Xinjiang is in a period of rapid economic and social development, and large-scale human activities and agriculture and animal husbandry may lead to rapid changes in land cover in a short period. These factors contribute to an increased fragmentation of the land surface and complicate the land cover, thus diminishing the accuracy of classification. Therefore, when studying land cover change, it is necessary to use multi-period remote sensing data to monitor seasonal changes in land cover, and to update the data on time to reflect these changes, in order to maintain the timeliness and accuracy of land cover products.

4.2. Comparative of Research Findings across Different Regions

In the context of varied regional studies, the GlobeLand30 product demonstrated a notably high overall accuracy of 84.06% in Xinjiang. This performance aligns with some regional research findings, while it contrasts significantly with others influenced by different local environmental conditions. For example, Jiang et al. [58] studied the accuracy of GlobeLand30 in the Eastern European Plain, which was only 69.80%. This disparity underscores the impact of regional characteristics, landforms, and land use patterns [59] on the performance of land cover products. In this study, the importance of region-specific assessments of land cover products is underscored to ensure their optimal application in environmental monitoring and analysis. For example, despite CLCD’s lower overall accuracy, its average performance across diverse categories suggests its potential utility. Moreover, the distinct advantages of products like GLC_FCS30 in forested areas, and FROM_GLC30 and ESRI in snow and ice regions, highlight the importance of selecting land cover products according to the ecological focus and unique environmental features of the study area.

4.3. Inconsistency Factors

In the assessment of consistency among the five land cover products, notable variations were observed across them. These discrepancies can be attributed to multifactor.
(1)
The disparity in sources of remote sensing images stands as a primary determinant of the inconsistency observed across land cover products. GlobeLand30 employs a combination of a single-phase Landsat TM/ETM+ image with HJ-1A/B and GF-1 [30] for its classification process. In contrast, CLCD integrates MODIS with Landsat imagery, and ESRI relies on the Sentinel-2 satellite image. Both FROM_GLC30 and GLC_FCS30 derive their classifications from the Landsat series of satellite images. Given the varied origins of these images, they inherently possess different spectral attributes, which in turn, profoundly influence the consistency of the classification outcomes. Furthermore, the spatial resolution cannot be overlooked in this context. While ESRI boasts a resolution of 10 m, GlobeLand30, FROM_GLC30, GLC_FCS30, and CLCD operate at a 30 m resolution. It is evident from studies that products with a higher resolution tend to have a purer pixel quality compared to their low-resolution counterparts. This translates to a depiction of more intricate spatial nuances and, typically, a more accurate classification.
(2)
Differences in classification methods and systems can result in inconsistencies in classification outcomes [60]. Specifically, in terms of classification approaches, three products, FROM_GLC30, GLC_FCS30, and CLCD, utilize the random forest classification algorithm, which is evaluated as the best in terms of computational efficiency and performance in global land cover mapping [61]. Notably, GLC_FCS30 is developed on the GEE (Google Earth Engine) platform using a locally adaptive random forest model combined with time-series Landsat images and a global prior training dataset from GSPECLib [51]. GlobeLand30 employs a pixel–object–knowledge (POK) classification approach to categorize each type one by one, and incorporates various information and experiences. The advantage of this method is that it can effectively suppress misclassification due to the phenomena of “same object, different spectrum” and “different object, same spectrum” [30]. ESRI employs deep learning models, notably convolutional neural networks (CNN), for land cover classification. Such models excel in handling complex data and discerning intricate patterns within them. When comparing classification systems, GlobeLand30, FROM_GLC30, CLCD, and ESRI categorize land cover into broad primary categories, whereas GLC_FCS30 offers a more detailed system. Although the five products have roughly analogous names for land cover types in their overarching classification systems, they differ in their specific thematic definitions of the same land cover type, as demonstrated in Table 3. Taking bare land as an example, GlobeLand30 defines it as areas with less than 10% vegetation cover, while GLC_FCS30 sets the threshold at 15%. Such a distinction might mean that what is classified as grassland in GlobeLand30 could be labeled as bare land in the GLC_FCS30. This naturally leads to discrepancies, especially between classifications of bare ground and grassland across the products. In essence, while the products have stark differences in the detailed definitions of identical land cover types, it is these very differences that introduce variances and uncertainties between the products that are hard to rectify. As a result, inaccuracies observed in broad land cover type assessments stem not only from the products themselves but also from the thematic nuances within each product’s classification system.
(3)
The quantity and precision of validation samples are crucial for the results of consistency analysis. Validation samples from the visual interpretation of Google Earth might be influenced by subjectivity and human interference. This can result in biases towards specific land types during sample selection, leading to an uneven distribution of the samples. Additionally, the number of actual measured samples is often limited, which could cause instability and inaccuracy in the evaluation outcomes. Therefore, obtaining scientifically robust and reasonable validation sample points is an essential research direction in future global land cover mapping. This might involve using higher accuracy ground observation data, field validations through drones or satellite imagery, and machine learning techniques, among others.

5. Conclusions

To offer guidance for selecting appropriate land cover products for diverse studies in arid regions, this study focused on Xinjiang as the research area, and analyzed the consistency and accuracy of five high-resolution products. The main conclusions are as follows: (1) The five land cover products are essentially consistent in describing the composition and pattern characteristics of Xinjiang’s land cover. That is, they primarily represent bare land, which, along with grasslands and cropland, constitutes the main land cover types in Xinjiang. The area correlation between different land cover products is strong, exhibiting correlation coefficients that range from 0.88 to 0.99. (2) The analysis of spatial consistency showed that the proportion of the areas with complete consistency among the five products was 49.01%. These regions are mainly distributed in areas with relatively homogeneous land cover types and low surface heterogeneity. The accuracy of the five products in recognizing types such as permanent snow and ice, water bodies, and bare land is high, while the accuracy in identifying grassland and forest is relatively low. (3) The overall accuracy of the five products ranged from 70.05% to 84.06%. GlobeLand30 exhibited the highest overall accuracy, at 84.06%. The five products each cater to specific research needs: GlobeLand30 offers the best overall performance, GLC_FCS30 is suited to forest studies, FROM_GLC30 and ESRI excel in identifying permanent ice and snow, and the performance of CLCD is generally average. Therefore, when carrying out research related to land cover changes in Xinjiang or arid regions, and to meet the practical needs of users, we recommend that the selection of a GlobeLand30 product is prioritized.
In view of the continuous development of geographic information technology, a range of new high-resolution global land cover products have emerged from multiple institutions, demonstrating notable potential. As research progresses, it is important to focus on the integration of diverse remote sensing land cover sources. The creation of a coherent classification system, the adoption of standard benchmarks, and the establishment of a collaborative database for training and evaluation will be key in improving land cover classification accuracy.

Author Contributions

Conceptualization, S.L. and Z.X.; methodology, S.L. and F.X.; software, S.L.; funding acquisition, Z.X., Y.G. and Y.W.; supervision, Z.X., Y.G. and Y.W.; validation, S.L.; formal analysis, S.L.; investigation, S.L., Z.X. and T.Y.; resources, Z.X.; data curation, S.L.; writing—original draft preparation, S.L.; writing—review and edit, S.L., Z.X., Y.G., T.Y., F.X. and Y.W.; visualization, S.L., T.Y. and F.X.; project administration, Z.X. and Y.G. All authors have read and agreed to the published version of the manuscript.

Funding

This research was funded by the Natural Science Foundation of Xinjiang Uygur Autonomous Region (No. 2022D01C399 and No. 2022E01052) and the National Natural Science Foundation of China (No. 41961003).

Data Availability Statement

The data used in this study are: GlobeLand30 (http://www.globallandcover.com/, accessed on 12 July 2023) from the National Geomatics Center of China (NGCC); GLC_FCS30 (https://data.casearth.cn/, accessed on 16 July 2023) from the Aerospace Information Research Institute, Chinese Academy of Sciences (AIR); FROM_GLC30 from Tsinghua University (http://data.ess.tsinghua.edu.cn/, accessed on 19 July 2023); CLCD (https://zenodo.org/records/5816591, accessed on 24 July 2023) from Wuhan University; and ESRI land cover products from the Environmental System Research Institute (ESRI) (https://www.arcgis.com/apps/instant/media/index.html?appid=fc92d38533d440078f17678ebc20e8e2, accessed on 30 July 2023).

Acknowledgments

The authors sincerely thank the production agencies that provided free land cover datasets.

Conflicts of Interest

The authors declare no conflict of interest.

References

  1. Liao, A.; Chen, L.; Chen, J.; He, C.; Cao, X.; Chen, J.; Peng, S.; Sun, F.; Gong, P. High-resolution remote sensing mapping of global land water. Sci. China Earth Sci. 2014, 57, 2305–2316. [Google Scholar] [CrossRef]
  2. Chen, Y.; Shao, H.; Li, Y. Consistency analysis and accuracy assessment of multi-source land cover products in the Yangtze River Delta. Trans. Chin. Soc. Agric. Eng. 2021, 37, 142–150. [Google Scholar] [CrossRef]
  3. Kayet, N.; Pathak, K.; Chakrabarty, A.; Sahoo, S. Spatial impact of land use/land cover change on surface temperature distribution in Saranda Forest, Jharkhand. Model. Earth Syst. Environ. 2016, 2, 127. [Google Scholar] [CrossRef]
  4. Sterling, S.M.; Ducharne, A.; Polcher, J. The impact of global land-cover change on the terrestrial water cycle. Nat. Clim. Chang. 2013, 3, 385–390. [Google Scholar] [CrossRef]
  5. Salazar, A.; Baldi, G.; Hirota, M.; Syktus, J.; McAlpine, C.J.G.; Change, P. Land use and land cover change impacts on the regional climate of non-Amazonian South America: A review. Glob. Planet. Chang. 2015, 128, 103–119. [Google Scholar] [CrossRef]
  6. Keola, S.; Andersson, M.; Hall, O. Monitoring economic development from space: Using nighttime light and land cover data to measure economic growth. World Dev. 2015, 66, 322–334. [Google Scholar] [CrossRef]
  7. Cao, Q.; Yu, D.; Georgescu, M.; Han, Z.; Wu, J. Impacts of land use and land cover change on regional climate: A case study in the agro-pastoral transitional zone of China. Environ. Res. Lett. 2015, 10, 124025. [Google Scholar] [CrossRef]
  8. Giri, C.; Defourny, P.; Shrestha, S. Land cover characterization and mapping of continental Southeast Asia using multi-resolution satellite sensor data. Int. J. Remote Sens. 2003, 24, 4181–4196. [Google Scholar] [CrossRef]
  9. Wang, Z.; Yang, X.; Lu, C.; Yang, F. A scale self-adapting segmentation approach and knowledge transfer for automatically updating land use/cover change databases using high spatial resolution images. Int. J. Appl. Earth Obs. Geoinf. 2018, 69, 88–98. [Google Scholar] [CrossRef]
  10. LaFontaine, J.H.; Hay, L.E.; Viger, R.J.; Regan, R.S.; Markstrom, S.L. Effects of climate and land cover on hydrology in the Southeastern US: Potential impacts on watershed planning. J. Am. Water Resour. Assoc. 2015, 51, 1235–1261. [Google Scholar] [CrossRef]
  11. Ran, Y.; Li, X.; Lu, L. Evaluation of four remote sensing based land cover products over China. Int. J. Remote Sens. 2010, 31, 391–401. [Google Scholar] [CrossRef]
  12. Mora, B.; Tsendbazar, N.-E.; Herold, M.; Arino, O. Global land cover mapping: Current status and future trends. Land Use Land Cover Mapp. Eur. Pract. Trends 2014, 18, 11–30. [Google Scholar] [CrossRef]
  13. Weiss, M.; Jacob, F.; Duveiller, G. Remote sensing for agricultural applications: A meta-review. Remote Sens. Environ. 2020, 236, 111402. [Google Scholar] [CrossRef]
  14. Abdikan, S.; Sanli, F.B.; Ustuner, M.; Calò, F. Land cover mapping using sentinel-1 SAR data. Int. Arch. Photogramm. Remote Sens. Spat. Inf. Sci. 2016, 41, 757–761. [Google Scholar] [CrossRef]
  15. Ban, Y.; Gong, P.; Giri, C. Global land cover mapping using Earth observation satellite data: Recent progresses and challenges. ISPRS J. Photogramm. Remote Sens. 2015, 103, 1–6. [Google Scholar] [CrossRef]
  16. Loveland, T.R.; Reed, B.C.; Brown, J.F.; Ohlen, D.O.; Zhu, Z.; Yang, L.; Merchant, J.W. Development of a global land cover characteristics database and IGBP DISCover from 1 km AVHRR data. Int. J. Remote Sens. 2000, 21, 1303–1330. [Google Scholar] [CrossRef]
  17. Bartholome, E.; Belward, A.S. GLC2000: A new approach to global land cover mapping from Earth observation data. Int. J. Remote Sens. 2005, 26, 1959–1977. [Google Scholar] [CrossRef]
  18. Defourny, P.; Schouten, L.; Bartalev, S.; Bontemps, S.; Arino, O.J.N.L.W. Accuracy assessment of a 300 m global land cover map: The GlobCover experience. New Libr. World 2009, 112, 236–247. [Google Scholar] [CrossRef]
  19. Lamarche, C.; Santoro, M.; Bontemps, S.; d’Andrimont, R.; Radoux, J.; Giustarini, L.; Brockmann, C.; Wevers, J.; Defourny, P.; Arino, O. Compilation and validation of SAR and optical data products for a complete and global map of inland/ocean water tailored to the climate modeling community. Remote Sens. 2017, 9, 36. [Google Scholar] [CrossRef]
  20. Hansen, M.; DeFries, R.; Townshend, J.R.G.; Sohlberg, R. Umd Global Land Cover Classification, 1 Kilometer, 1981–1994, 1.0; Department of Geography, University of Maryland: College Park, MD, USA, 1998. [Google Scholar]
  21. Friedl, M.A.; Sulla-Menashe, D.; Tan, B.; Schneider, A.; Ramankutty, N.; Sibley, A.; Huang, X. MODIS Collection 5 global land cover: Algorithm refinements and characterization of new datasets. Remote Sens. Environ. 2010, 114, 168–182. [Google Scholar] [CrossRef]
  22. Li, Y.; Viña, A.; Yang, W.; Chen, X.; Zhang, J.; Ouyang, Z.; Liang, Z.; Liu, J. Effects of conservation policies on forest cover change in giant panda habitat regions, China. Land Use Policy 2013, 33, 42–53. [Google Scholar] [CrossRef] [PubMed]
  23. Dong, J.; Xiao, X.; Sheldon, S.; Biradar, C.; Duong, N.D.; Hazarika, M. A comparison of forest cover maps in Mainland Southeast Asia from multiple sources: PALSAR, MERIS, MODIS and FRA. Remote Sens. Environ. 2012, 127, 60–73. [Google Scholar] [CrossRef]
  24. Zhang, H.K.; Roy, D.P. Using the 500 m MODIS land cover product to derive a consistent continental scale 30 m Landsat land cover classification. Remote Sens. Environ. 2017, 197, 15–34. [Google Scholar] [CrossRef]
  25. Verburg, P.H.; Neumann, K.; Nol, L. Challenges in using land use and land cover data for global change studies. Glob. Chang. Biol. 2011, 17, 974–989. [Google Scholar] [CrossRef]
  26. Congalton, R.G.; Gu, J.; Yadav, K.; Thenkabail, P.; Ozdogan, M. Global land cover mapping: A review and uncertainty analysis. Remote Sens. 2014, 6, 12070–12093. [Google Scholar] [CrossRef]
  27. Gómez, C.; White, J.C.; Wulder, M.A. Optical remotely sensed time series data for land cover classification: A review. ISPRS J. Photogramm. Remote Sens. 2016, 116, 55–72. [Google Scholar] [CrossRef]
  28. Zhang, X.; Liu, L.; Chen, X.; Xie, S.; Gao, Y. Fine land-cover mapping in China using Landsat datacube and an operational SPECLib-based approach. Remote Sens. 2019, 11, 1056. [Google Scholar] [CrossRef]
  29. Liu, L.; Zhang, X.; Gao, Y.; Chen, X.; Shuai, X.; Mi, J. Finer-resolution mapping of global land cover: Recent developments, consistency analysis, and prospects. J. Remote Sens. 2021, 38, 5289697. [Google Scholar] [CrossRef]
  30. Chen, J.; Chen, J.; Liao, A.; Cao, X.; Chen, L.; Chen, X.; He, C.; Han, G.; Peng, S.; Lu, M.; et al. Global land cover mapping at 30 m resolution: A POK-based operational approach. ISPRS J. Photogramm. Remote Sens. 2015, 103, 7–27. [Google Scholar] [CrossRef]
  31. Zhang, X.; Liu, L.; Chen, X.; Gao, Y.; Xie, S.; Mi, J. GLC_FCS30: Global land-cover product with fine classification system at 30 m using time-series Landsat imagery. Earth Syst. Sci. Data 2020, 13, 2753–2776. [Google Scholar] [CrossRef]
  32. Gong, P.; Wang, J.; Yu, L.; Zhao, Y.; Zhao, Y.; Liang, L.; Niu, Z.; Huang, X.; Fu, H.; Liu, S. Finer resolution observation and monitoring of global land cover: First mapping results with Landsat TM and ETM+ data. Int. J. Remote Sens. 2013, 34, 2607–2654. [Google Scholar] [CrossRef]
  33. Zanaga, D.; Van De Kerchove, R.; Daems, D.; De Keersmaecker, W.; Brockmann, C.; Kirches, G.; Wevers, J.; Cartus, O.; Santoro, M.; Fritz, S. ESA WorldCover 10 m 2021 v200. Zenodo 2022. [Google Scholar]
  34. Karra, K.; Kontgis, C.; Statman-Weil, Z.; Mazzariello, J.C.; Mathis, M.; Brumby, S.P. Global land use/land cover with Sentinel 2 and deep learning. In Proceedings of the 2021 IEEE International Geoscience and Remote Sensing Symposium IGARSS, Brussels, Belgium, 11–16 July 2021; pp. 4704–4707. [Google Scholar]
  35. Chen, B.; Xu, B.; Zhu, Z.; Yuan, C.; Suen, H.P.; Guo, J.; Xu, N.; Li, W.; Zhao, Y.; Yang, J. Stable classification with limited sample: Transferring a 30-m resolution sample set collected in 2015 to mapping 10-m resolution global land cover in 2017. Sci. Bull. 2019, 64, 3. [Google Scholar] [CrossRef]
  36. Wang, J.; Yang, X.; Wang, Z.; Cheng, H.; Kang, J.; Tang, H.; Li, Y.; Bian, Z.; Bai, Z. Consistency Analysis and Accuracy Assessment of Three Global Ten-Meter Land Cover Products in Rocky Desertification Region—A Case Study of Southwest China. ISPRS Int. J. Geo-Inf. 2022, 11, 202. [Google Scholar] [CrossRef]
  37. Pérez-Hoyos, A.; Rembold, F.; Kerdiles, H.; Gallego, J. Comparison of global land cover datasets for cropland monitoring. Remote Sens. 2017, 9, 1118. [Google Scholar] [CrossRef]
  38. Olofsson, P.; Stehman, S.V.; Woodcock, C.E.; Sulla-Menashe, D.; Sibley, A.M.; Newell, J.D.; Friedl, M.A.; Herold, M. A global land-cover validation data set, part I: Fundamental design principles. Int. J. Remote Sens. 2012, 33, 5768–5788. [Google Scholar] [CrossRef]
  39. Li, C.; Gong, P.; Wang, J.; Zhu, Z.; Biging, G.S.; Yuan, C.; Hu, T.; Zhang, H.; Wang, Q.; Li, X. The first all-season sample set for mapping global land cover with Landsat-8 data. Sci. Bull. 2017, 62, 508–515. [Google Scholar] [CrossRef]
  40. Tchuenté, A.T.K.; Roujean, J.-L.; De Jong, S.M. Comparison and relative quality assessment of the GLC2000, GLOBCOVER, MODIS and ECOCLIMAP land cover data sets at the African continental scale. Int. J. Appl. Earth Obs. 2011, 13, 207–219. [Google Scholar] [CrossRef]
  41. Bai, Y.; Feng, M.; Jiang, H.; Wang, J.; Zhu, Y.; Liu, Y. Assessing consistency of five global land cover data sets in China. Remote Sens. 2014, 6, 8739–8759. [Google Scholar] [CrossRef]
  42. Giri, C.; Zhu, Z.; Reed, B. A comparative analysis of the Global Land Cover 2000 and MODIS land cover data sets. Remote Sens. Environ. 2005, 94, 123–132. [Google Scholar] [CrossRef]
  43. Song, H.; Zhang, X. Exploratory analysis of category accuracy for multi-sources land cover products. Res. Soil Water Conserv. 2015, 22, 36–41. [Google Scholar]
  44. Song, H.; Zhang, X. Precision analysis and validation of multi-sources landcover products derived from remote sensing in China. Trans. Chin. Soc. Agric. Eng. 2012, 28, 207–214. [Google Scholar] [CrossRef]
  45. Wickham, J.; Stehman, S.V.; Gass, L.; Dewitz, J.A.; Sorenson, D.G.; Granneman, B.J.; Poss, R.V.; Baer, L.A. Thematic accuracy assessment of the 2011 national land cover database (NLCD). Remote Sens. Environ. 2017, 191, 328–341. [Google Scholar] [CrossRef] [PubMed]
  46. Xu, Y.; Yu, L.; Feng, D.; Peng, D.; Li, C.; Huang, X.; Lu, H.; Gong, P. Comparisons of three recent moderate resolution African land cover datasets: CGLS-LC100, ESA-S2-LC20, and FROM-GLC-Africa30. Int. J. Remote Sens. 2019, 40, 6185–6202. [Google Scholar] [CrossRef]
  47. Kang, J.; Wang, Z.; Sui, L.; Yang, X.; Ma, Y.; Wang, J. Consistency analysis of remote sensing land cover products in the tropical rainforest climate region: A case study of Indonesia. Remote Sens. 2020, 12, 1410. [Google Scholar] [CrossRef]
  48. Hu, Y.; Zhang, Q.; Dai, Z.; Huang, M.; Yan, H. Agreement analysis of multi-sensor satellite remote sensing derived land cover products in the Europe Continent. Geogr. Res. 2015, 34, 1839–1852. [Google Scholar]
  49. Hou, X.; Di, X.; Hou, W.; Wu, L.; Liu, J.; Wang, J.; Su, H.; Lu, X.; Ying, L.; Yu, X. Accuracy evaluation of land use mapping using remote sensing techniques in coastal zone of China. J. Geo-Inf. Sci. 2018, 20, 1478–1488. [Google Scholar] [CrossRef]
  50. Clark, M.L.; Aide, T.M.; Grau, H.R.; Riner, G. A scalable approach to mapping annual land cover at 250 m using MODIS time series data: A case study in the Dry Chaco ecoregion of South America. Remote Sens. Environ. 2010, 114, 2816–2832. [Google Scholar] [CrossRef]
  51. Zhang, X.; Liu, L.; Wang, Y.; Hu, Y.; Zhang, B. A SPECLib-based operational classification approach: A preliminary test on China land cover mapping at 30 m. Int. J. Appl. Earth Obs. Geoinf. 2018, 71, 83–94. [Google Scholar] [CrossRef]
  52. Zhao, Y.; Gong, P.; Yu, L.; Hu, L.; Li, X.; Li, C.; Zhang, H.; Zheng, Y.; Wang, J.; Zhao, Y. Towards a common validation sample set for global land-cover mapping. Int. J. Remote Sens. 2014, 35, 4795–4814. [Google Scholar] [CrossRef]
  53. Fritz, S.; McCallum, I.; Schill, C.; Perger, C.; See, L.; Schepaschenko, D.; Van der Velde, M.; Kraxner, F.; Obersteiner, M. Geo-Wiki: An online platform for improving global land cover. Environ. Model. Softw. 2012, 31, 110–123. [Google Scholar] [CrossRef]
  54. Huang, Y.; Liao, S. Regional accuracy assessments of the first global land cover dataset at 30-meter resolution: A case study of Henan province. Geogr. Res. 2016, 35, 1433–1446. [Google Scholar]
  55. Zhang, Q.; Singh, V.P.; Li, J.; Jiang, F.; Bai, Y. Spatio-temporal variations of precipitation extremes in Xinjiang, China. J. Hydrol. 2012, 434, 7–18. [Google Scholar] [CrossRef]
  56. Luo, N.; Yu, R.; Mao, D.; Wen, B.; Liu, X. Spatiotemporal variations of wetlands in the northern Xinjiang with relationship to climate change. Wetl. Ecol. Manag. 2021, 29, 617–631. [Google Scholar] [CrossRef]
  57. Zheng, L.; Xia, Z.; Xu, J.; Chen, Y.; Yang, H.; Li, D. Exploring annual lake dynamics in Xinjiang (China): Spatiotemporal features and driving climate factors from 2000 to 2019. Clim. Chang. 2021, 166, 36. [Google Scholar] [CrossRef]
  58. Jiang, G.; Wang, J.; Li, K.; Xu, C.; Li, H.; Jin, Z.; Liu, J. Consistency Analysis and Accuracy Evaluation of Multi-Source Land Cover Data Products in the Eastern European Plain. Remote Sens. 2023, 15, 4254. [Google Scholar] [CrossRef]
  59. Wang, B.; Cheng, W. Geomorphic influences on land use/cover diversity and pattern. Catena 2023, 230, 107245. [Google Scholar] [CrossRef]
  60. Yang, Y.; Xiao, P.; Feng, X.; Li, H. Accuracy assessment of seven global land cover datasets over China. ISPRS J. Photogramm. Remote Sens. 2017, 125, 156–173. [Google Scholar] [CrossRef]
  61. Yu, L.; Wang, J.; Li, X.; Li, C.; Zhao, Y.; Gong, P. A multi-resolution global land cover dataset through multisource data aggregation. Sci. China Earth Sci. 2014, 57, 2317–2329. [Google Scholar] [CrossRef]
Figure 1. (a) Location of the study area within China; (b) digital elevation model (m) of Xinjiang.
Land 12 02178 g001
Figure 2. Spatial distribution of five land cover products in Xinjiang: (a) GlobeLand30, (b) FROM_GLC30, (c) CLCD, (d) GLC_FCS30, and (e) ESRI.
Land 12 02178 g002
Figure 3. Spatial overlay schematic diagram using bare land as an example. Land cover type: 1: bare land, 0: non-bare land. Spatial overlay results: 1: Inconsistency, 2: low consistency, 3: moderate consistency, 4: high consistency, 5: full consistency, 0: background.
Land 12 02178 g003
Figure 4. Spatial distribution of validation sample points for visual interpretation in Google Earth.
Land 12 02178 g004
Figure 5. Coefficient of deviation (CD) of land cover types across different products.
Land 12 02178 g005
Figure 6. Composition of predominant land types in Xinjiang.
Land 12 02178 g006
Figure 7. Spatial consistency of major land cover types in Xinjiang: (a) cropland, (b) forest, (c) grassland, (d) bare land, (e) water, (f) impervious surface.
Land 12 02178 g007
Figure 8. Spatially consistent distribution of all land cover types in Xinjiang.
Land 12 02178 g008
Figure 9. Comparative of five land cover products with Google Earth imagery: (A) central Tian Shan, (B) Burzin, (C) Lake Bosten.
Land 12 02178 g009
Table 1. Main characteristics of the five land cover products.
NameProduction InstitutionResolution (m)MethodTimeSatelliteOverall Accuracy (%)
GlobeLand30National Geomatics Center of China30POK 2020Landsat TM/ETM+, HJ-1/GF-185.72
GLC_FCS30Aerospace Information Research Institute, Chinese Academy of Sciences30Local random forest2020Landsat TM/ETM+/OLI82.5
FROM_GLC30Tsinghua University30Random forest2017Landsat TM/ETM+/OLI75.39
CLCDWuhan University30Random forest2020Landsat/Modis80
ESRI
Land Cover
Environmental System Research Institute10Deep learning model2020Sentinel-285.96
Table 2. Category correspondence between different land cover classification systems.
CodeTypeGlobeLand30GLC_FCS30FROM_GLC30CLCDESRI
1Cropland1010, 11, 201015
2Forest20, 4050–90, 120, 121, 12220, 402, 32, 6
3Grassland30130, 140, 1533043
4Bare land90150, 200–2029078
5Wetland501805094
6Water602106051
7Snow/Ice10022010069
8Impervious surface801908087
Table 3. Land cover product classification system and merging relationship.
CodeGlobeLand30CodeFROM_GLC30CodeCLCDCodeGLC_FCS30CodeESRI
10Cropland10Cropland1Cropland10Rainfed cropland1Water
20Forest20Forest2Forest11Herbaceous cover2Trees
30Grassland30Grassland3Shrub12Tree or shrub cover (Orchard)3Grass
40Shrubland40Shrubland4Grassland20Irrigated cropland4Flooded vegetation
50Wetland50Wetland5Water61Open deciduous broadleaved forest (0.15 < fc < 0.4)5Crops
60Water60Water6Snow/Ice62Closed deciduous broadleaved forest (fc > 0.4)6Scrub/shrub
70Tundra70Tundra7Barren71Open evergreen needle-leaved forest (0.15 < fc < 0.4)7Built Area
80Impervious surface80Impervious surface8Impervious72Closed evergreen needle-leaved forest (fc > 0.4)8Bare ground
90Bare land90Bare land9Wetland81Open deciduous needle-leaved forest (0.15 < fc < 0.4)9Snow/Ice
100Snow/Ice100Snow/Ice 82Closed deciduous needle-leaved forest (fc > 0.4)10Clouds
92Closed mixed leaf forest (broadleaved and needle-leaved)
120Shrubland
121Evergreen shrubland
122Deciduous shrubland
130Grassland
140Lichens and mosses
150Sparse vegetation (fc < 0.15)
(255, 235, 175)
153Sparse herbaceous (fc < 0.15)
180Wetlands
190Impervious surfaces
200Bare areas
201Consolidated bare areas
210Water body
220Permanent ice and snow
Table 4. Area correlation coefficients among the products.
GlobeLand30FROM_GLC30CLCDGLC_FCS30ESRI
GlobeLand301.0000.9920.9990.9970.908
FROM_GLC300.9921.0000.9900.9950.848
CLCD0.9990.9901.0000.9960.915
GLC_FCS300.9970.9950.9961.0000.883
ESRI0.9080.8480.9150.8831.000
Table 5. Accuracy assessment results based on Google Earth validation samples.
Google Samples
12345678OA (%)Kappa
GlobeLand30PA (%)92.4482.5889.9384.0957.8477.8491.4485.2684.060.82
UA (%)89.6291.2165.6788.1090.0378.2198.2289.74
FROM_GLC30PA (%)84.7791.8392.5588.4716.3469.1492.8235.5373.480.69
UA (%)88.4786.7955.4262.8669.8174.2099.1286.70
CLCDPA (%)87.3389.8988.3282.316.6265.2888.4031.5870.050.65
UA (%)76.0187.6346.0873.9110080.5999.3878.14
GLC_FCS30PA (%)87.4494.8457.3788.1514.3564.6991.7160.9071.180.66
UA (%)72.9459.3561.7965.2673.0378.1496.5192.57
ESRIPA (%)82.2185.1693.7253.7327.1572.4092.2790.2375.570.72
UA (%)94.5296.1247.1069.8393.8980.2699.7089.39
Note: 1: cropland; 2: forest; 3: grassland; 4: bare land; 5: wetland; 6: water; 7: snow/ice; 8: impervious surface.
Disclaimer/Publisher’s Note: The statements, opinions and data contained in all publications are solely those of the individual author(s) and contributor(s) and not of MDPI and/or the editor(s). MDPI and/or the editor(s) disclaim responsibility for any injury to people or property resulting from any ideas, methods, instructions or products referred to in the content.

