


Investigating Urban Flooding and Nutrient Export under Different Urban Development Scenarios in the Rouge River Watershed in Michigan, USA
 ,
,
Abstract
:1. Introduction
2. Materials and Methods
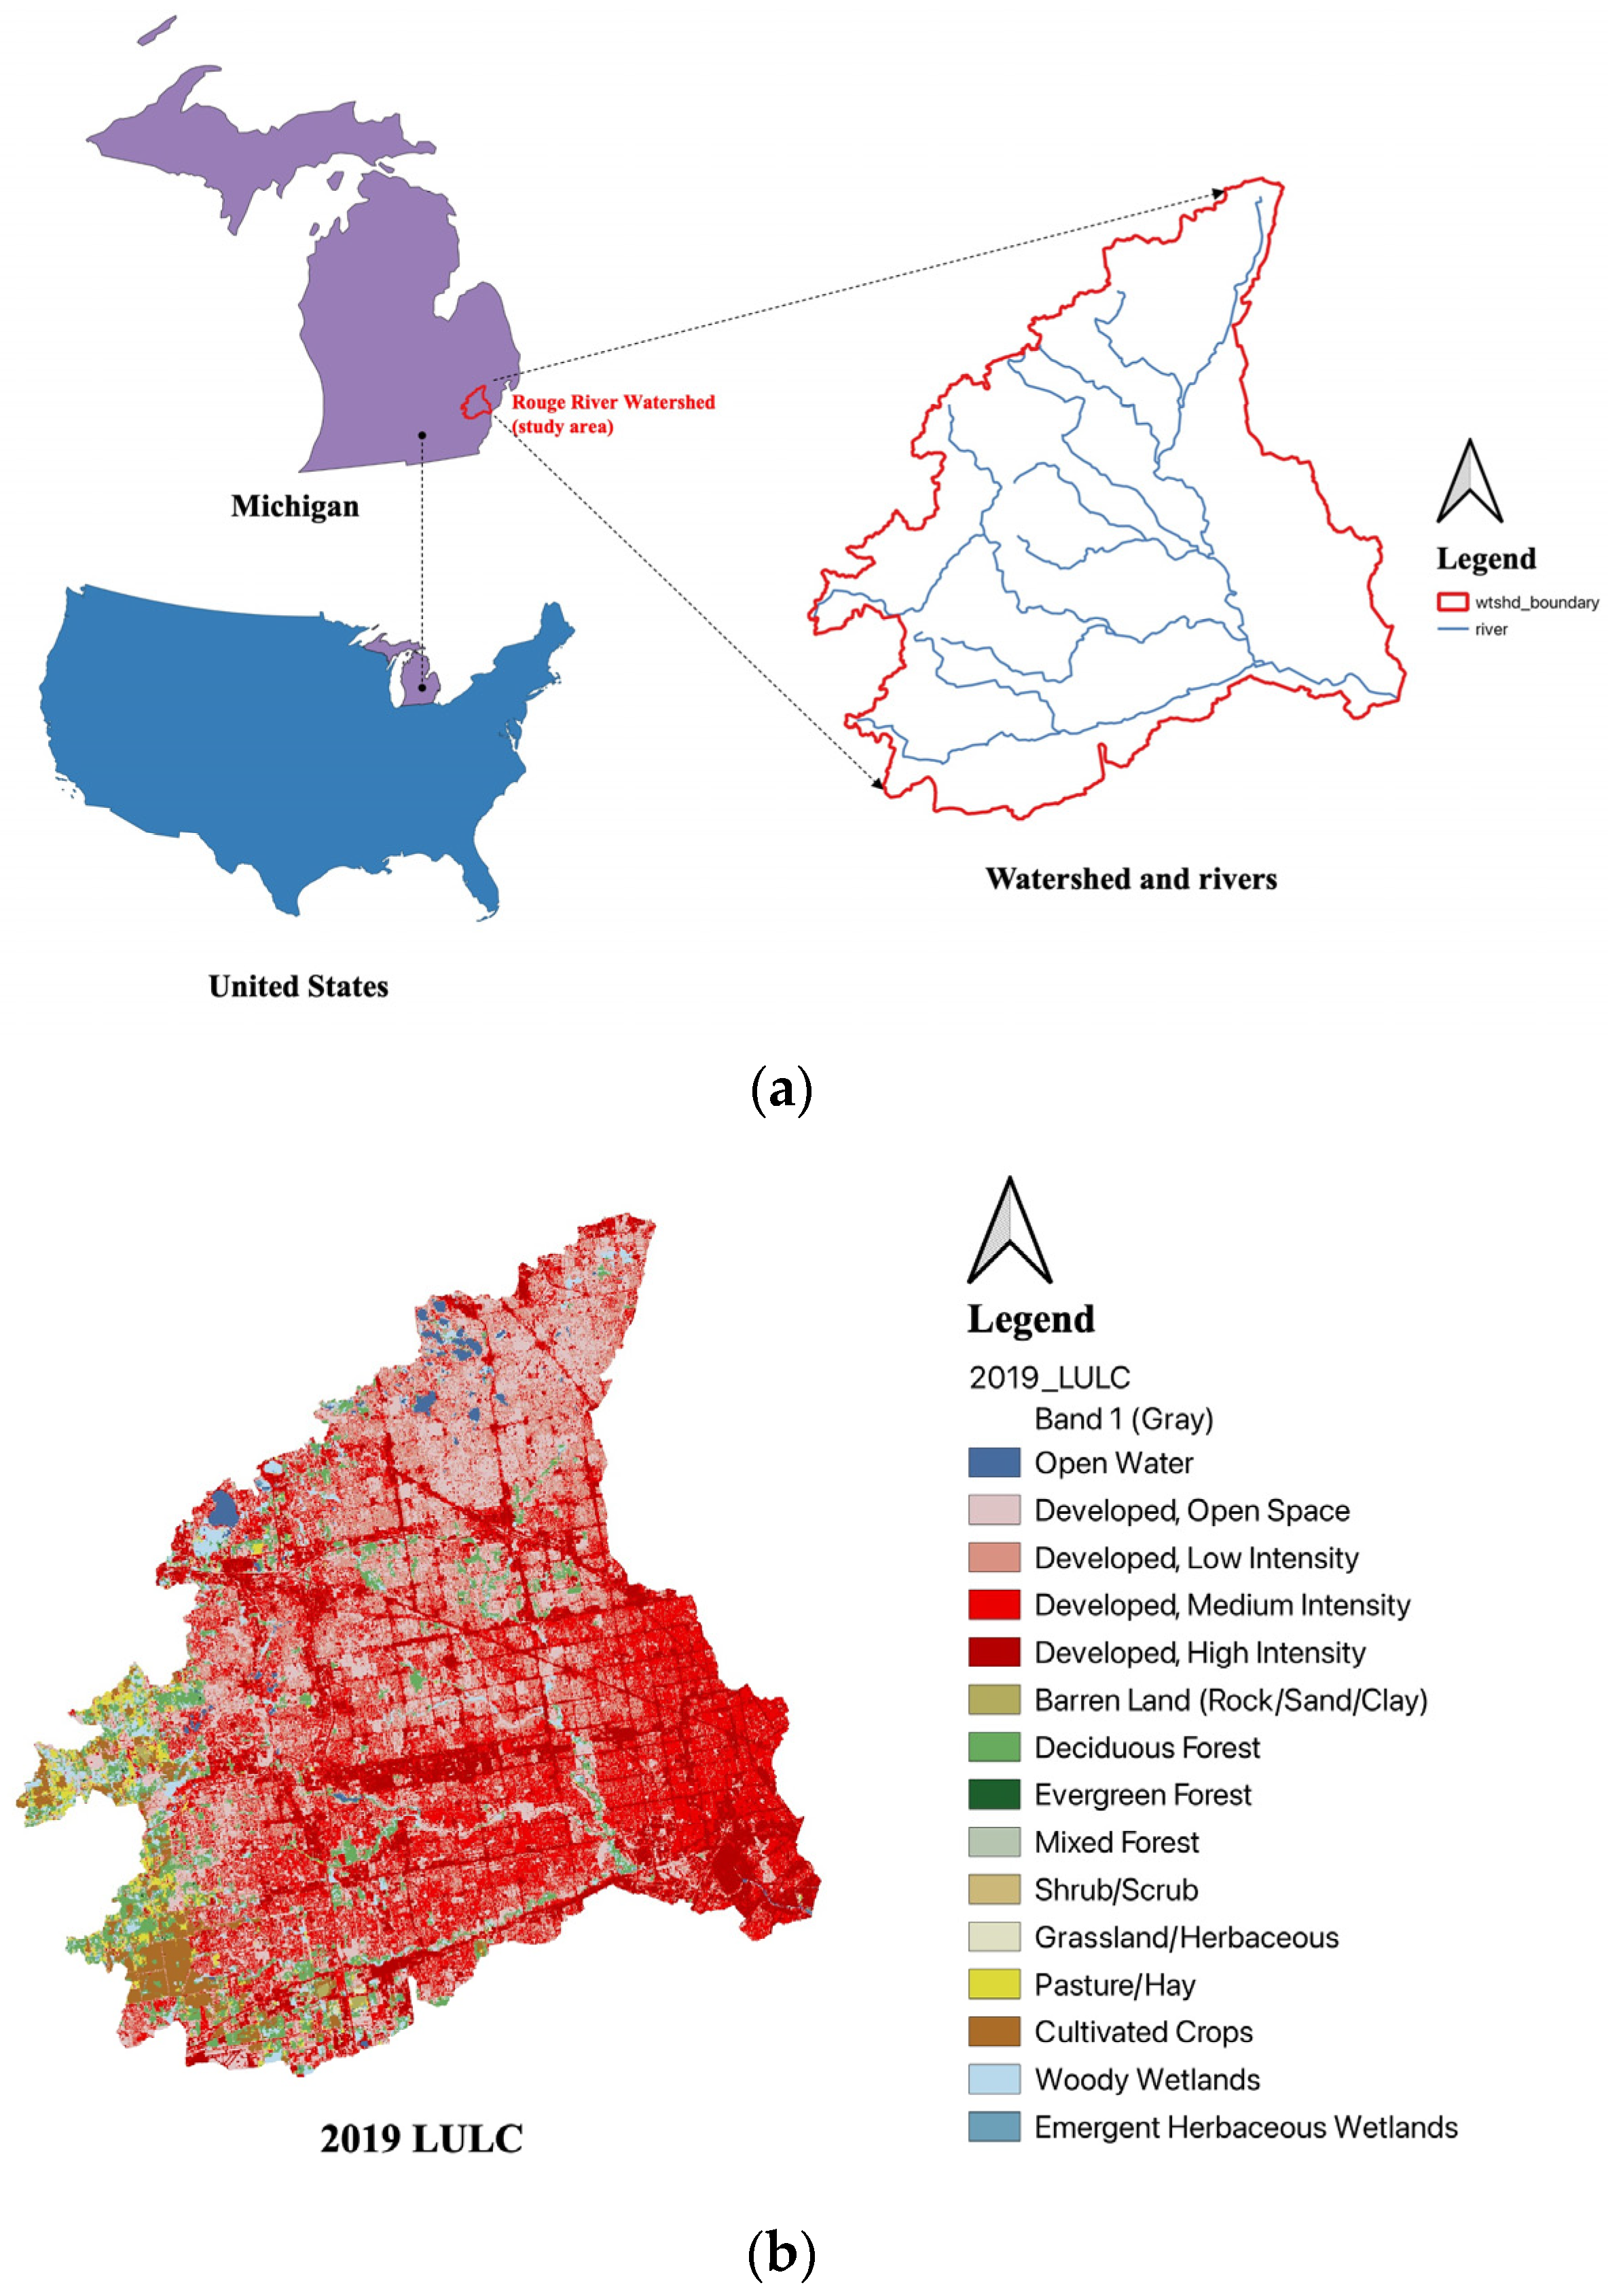
2.1. Study Area and Its Environmental Challenges
2.2. Nutrient Delivery Model (NDR) and Urban Flood Risk Mitigation Model (UFRM)
2.2.1. NDR Model Foundation
2.2.2. NDR Setup and Calibration
2.2.3. UFRM Model Foundations
2.2.4. UFRM Setup
2.3. Scenario Design and Land Change Modeler (LCM)
3. Results
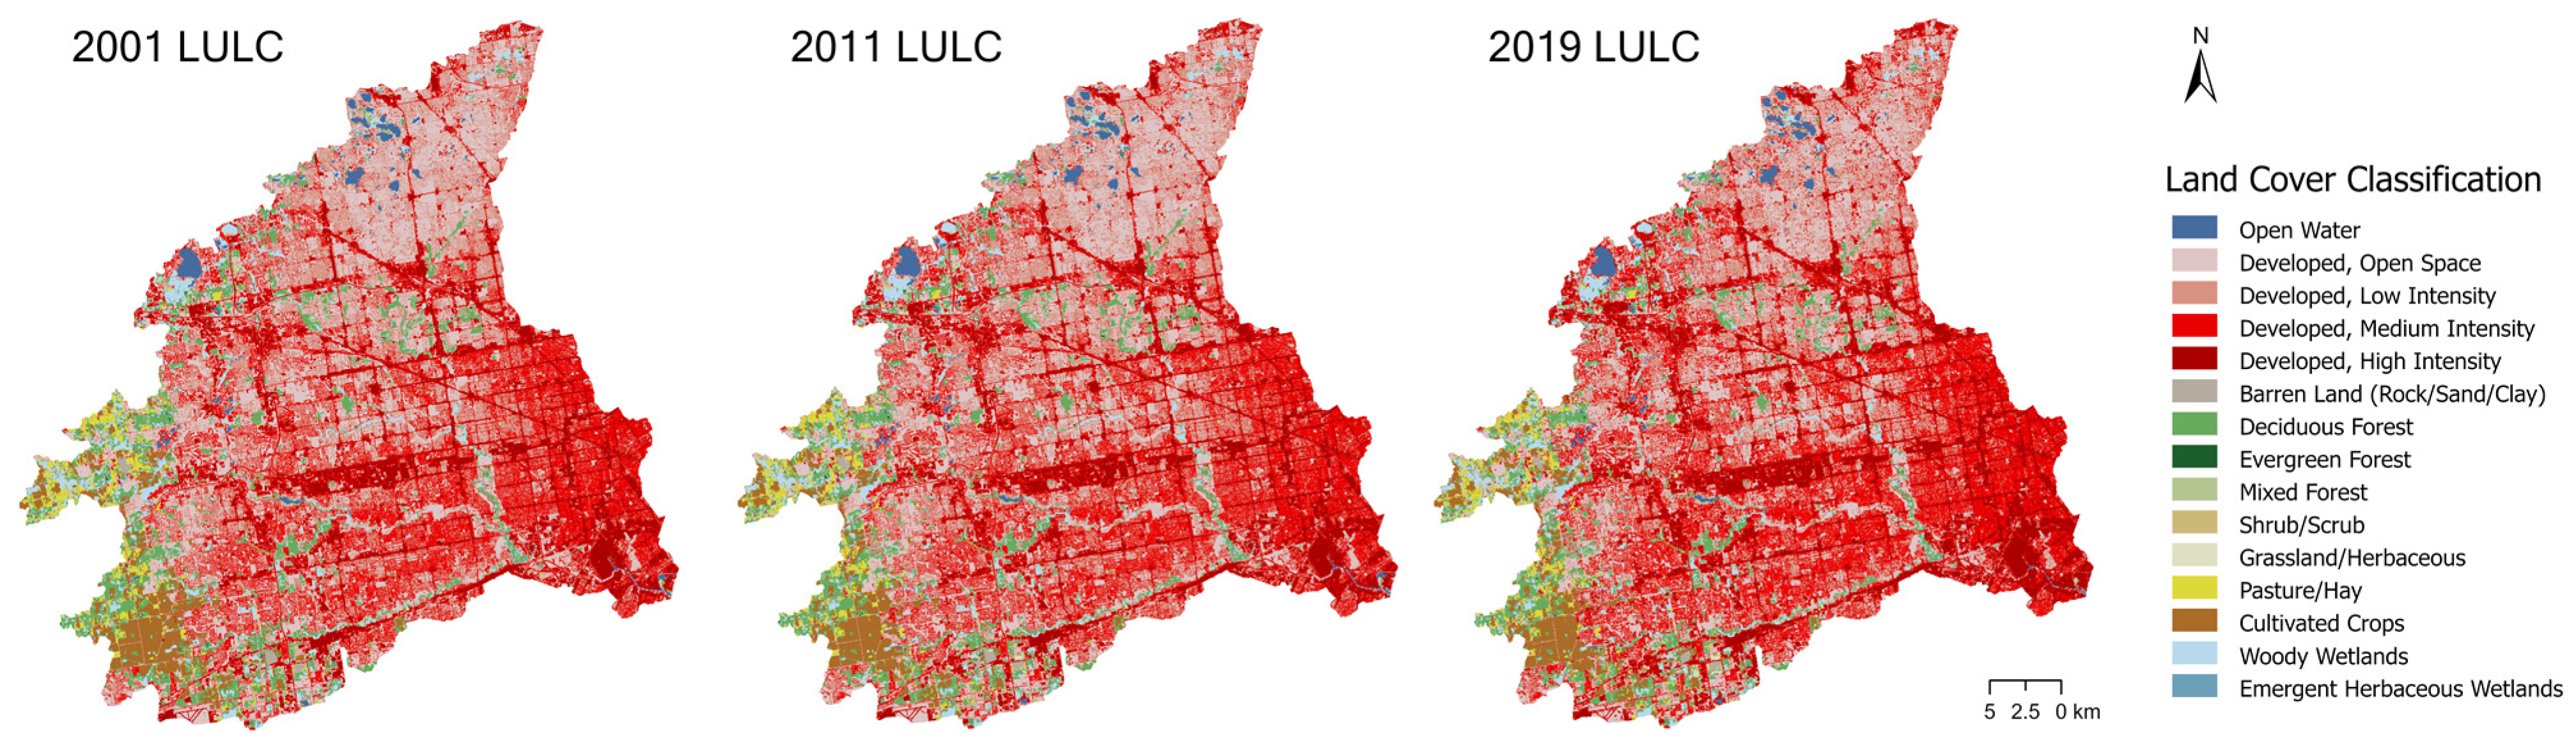
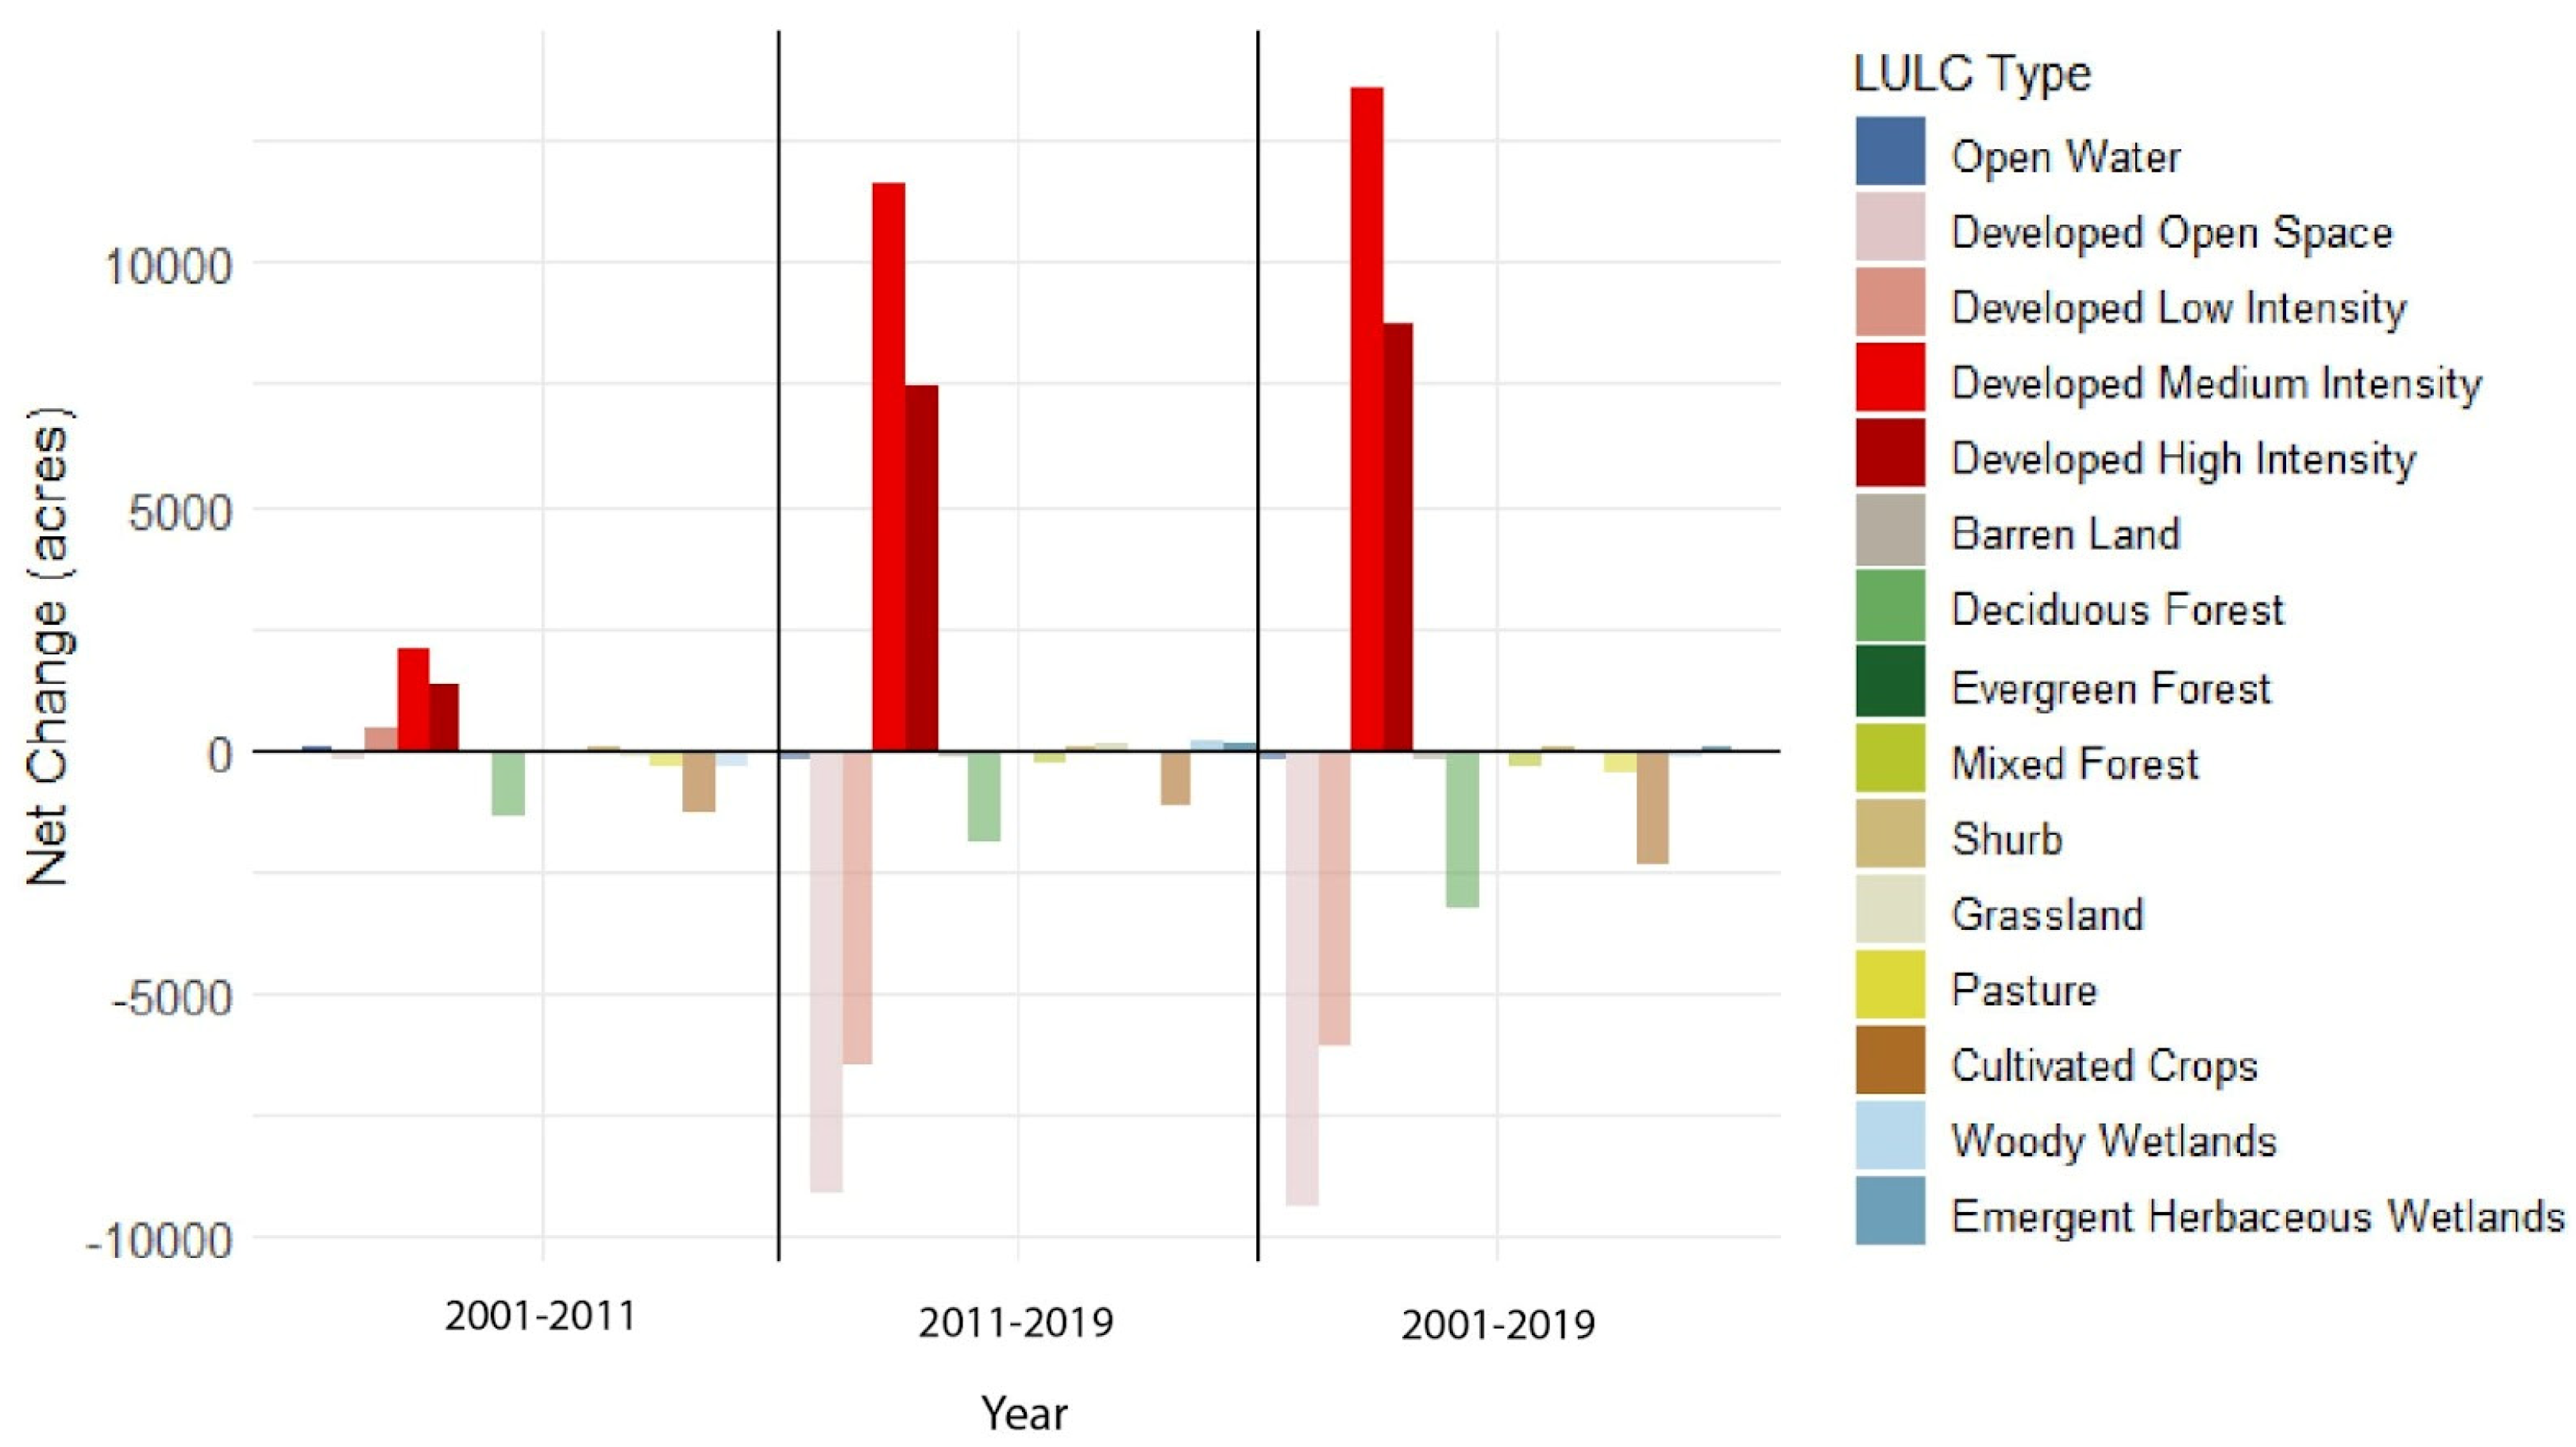
3.1. Historical LULC Changes
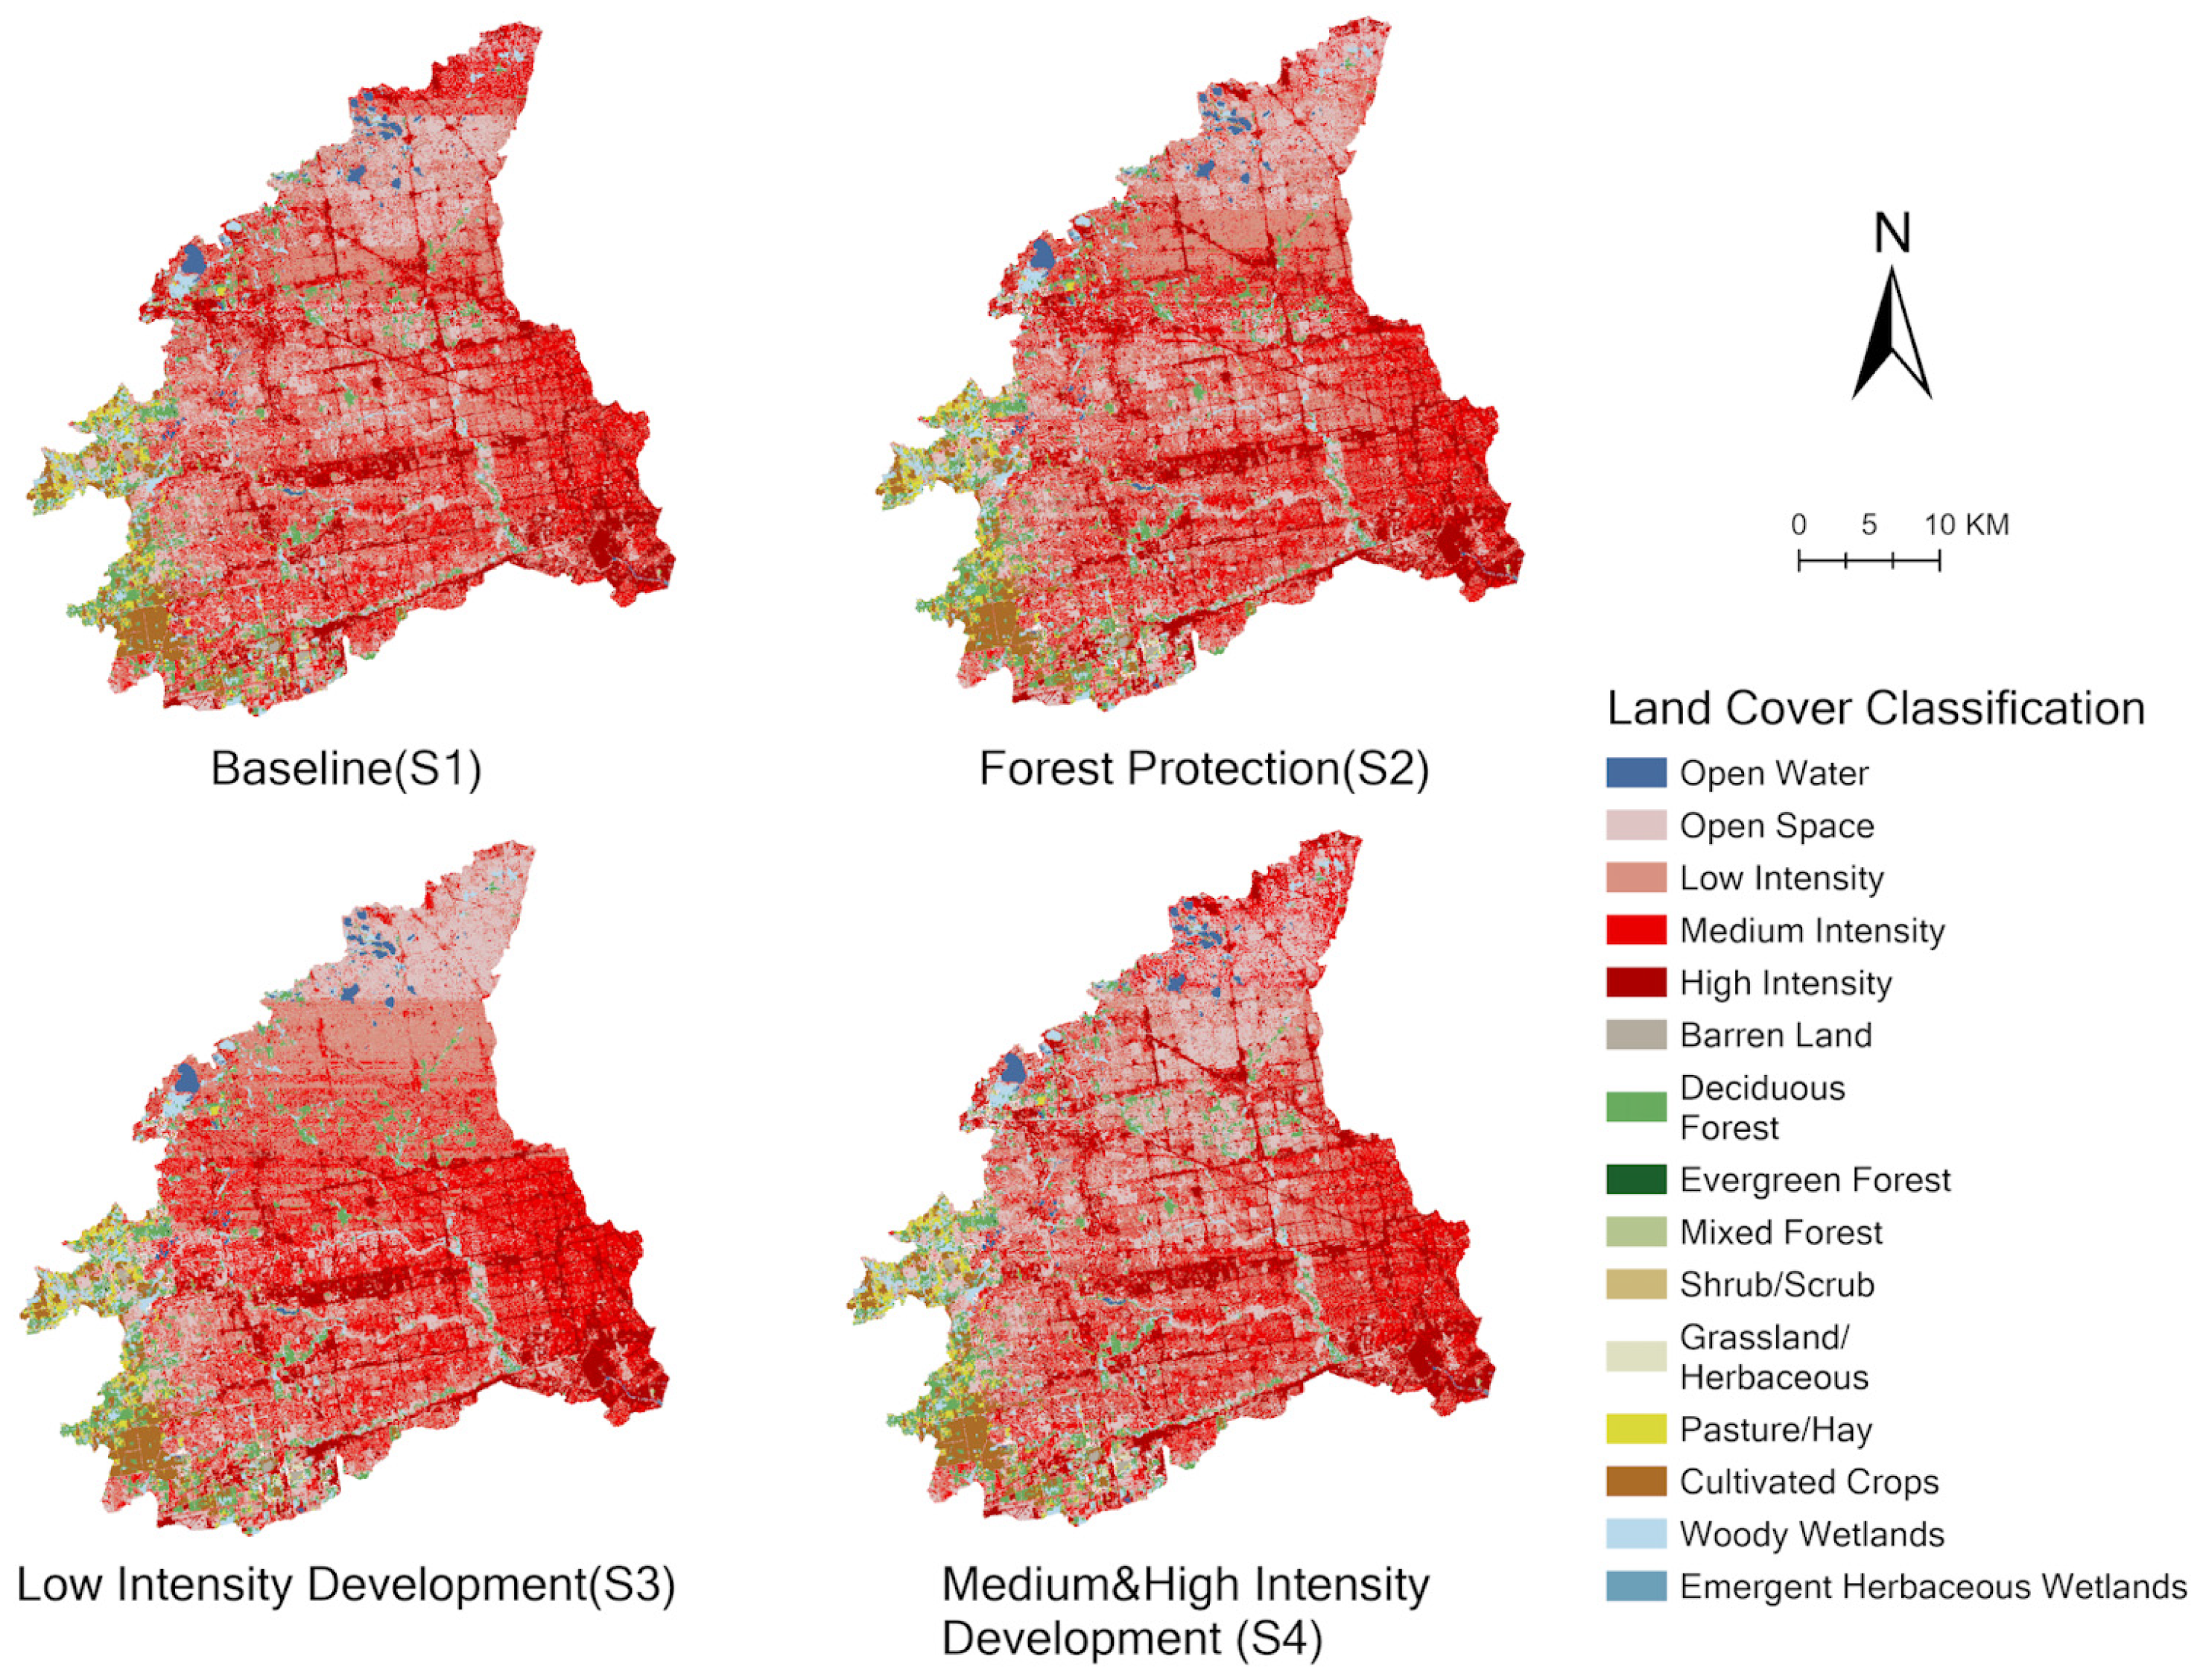
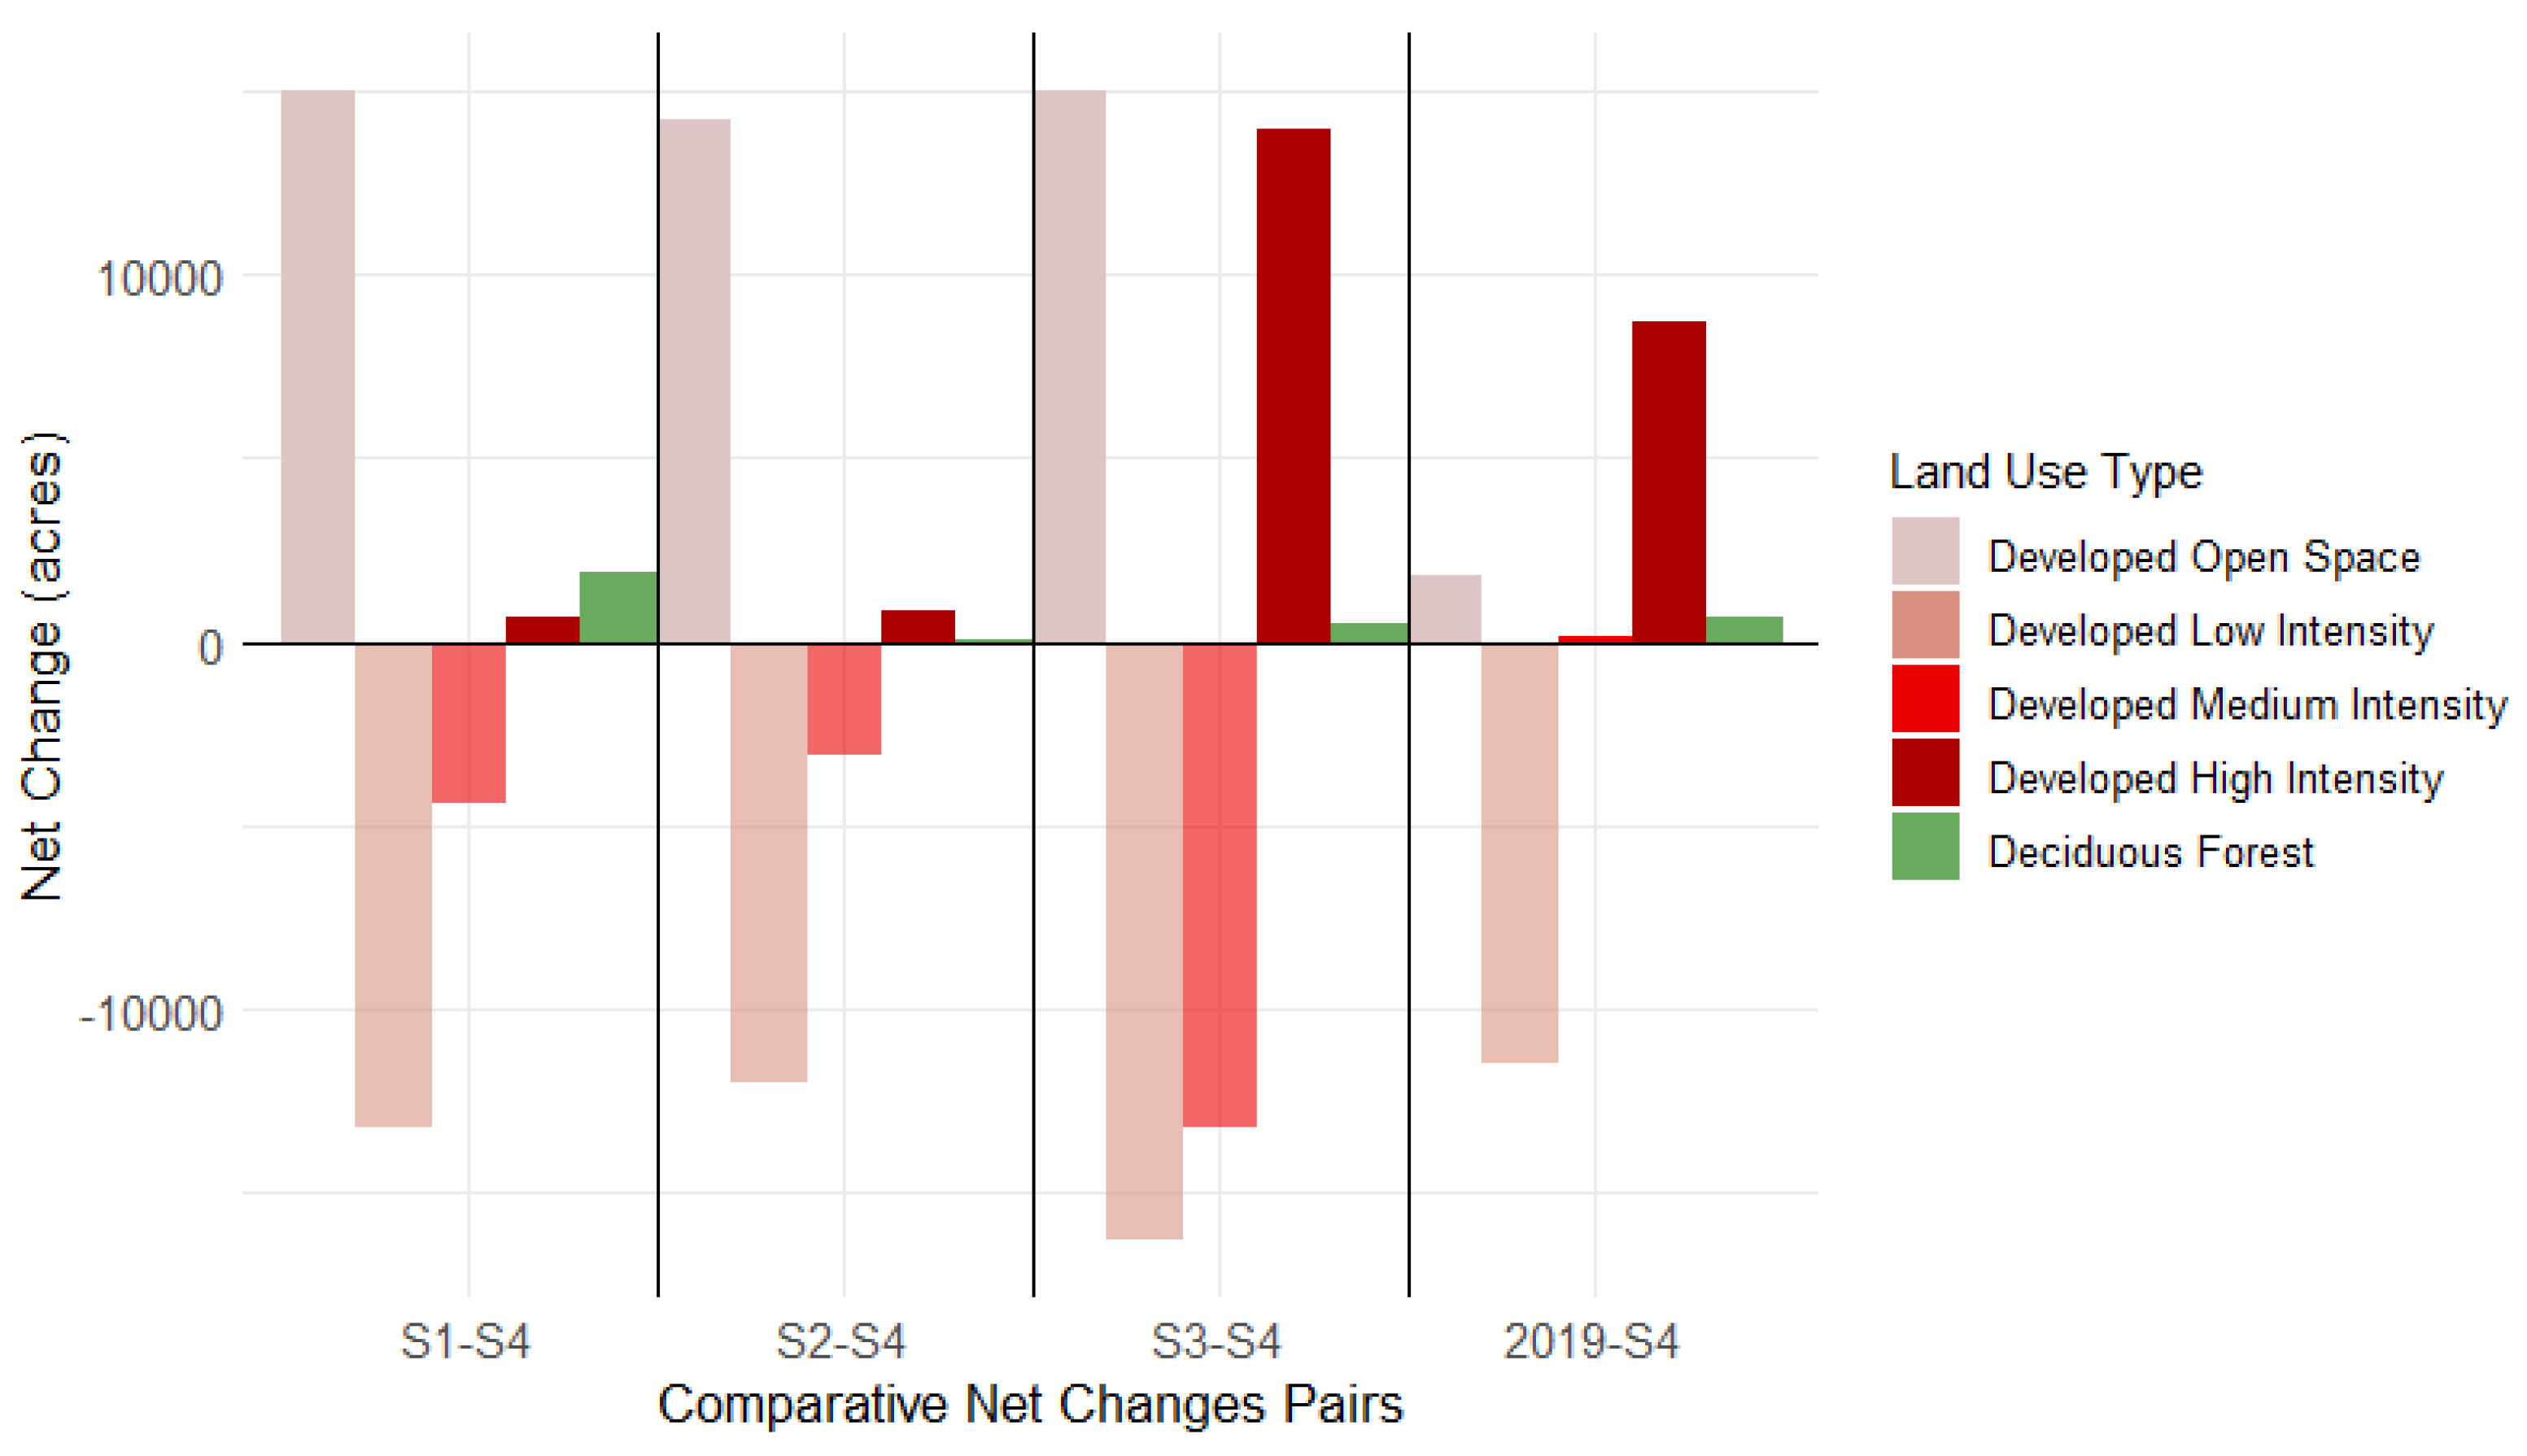
3.2. Variations in LULC under Future Scenarios
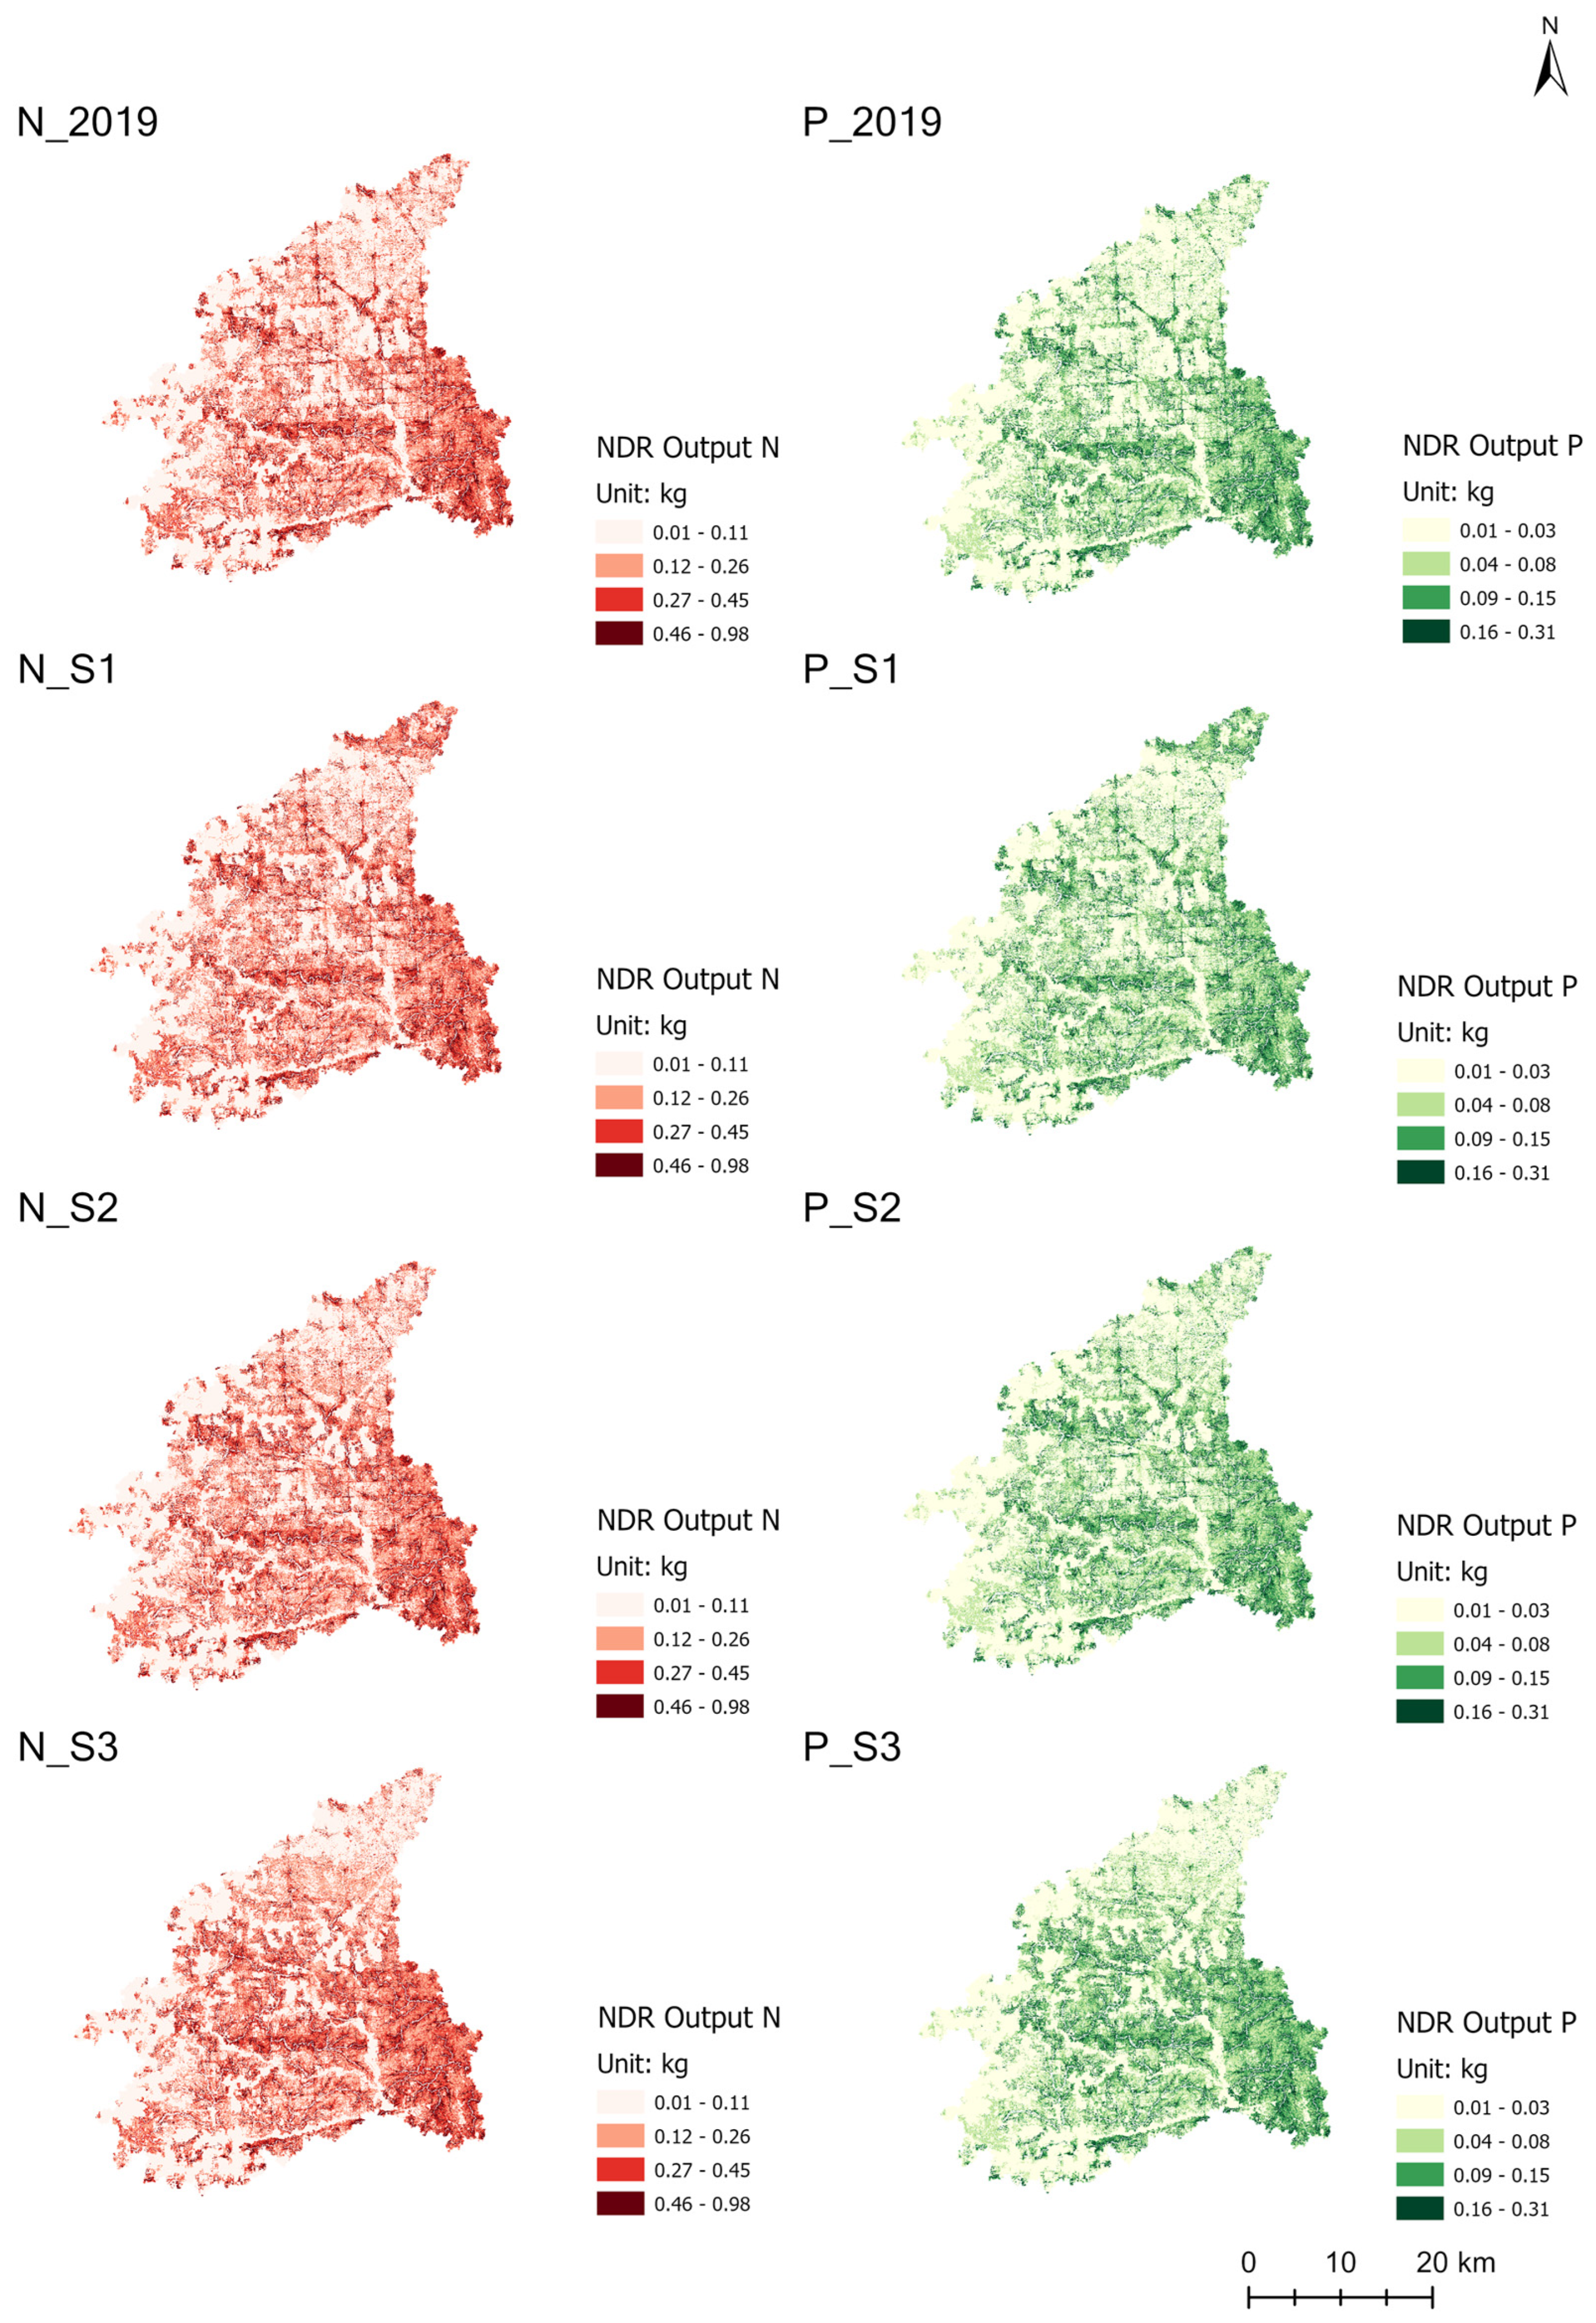
3.3. NDR Results
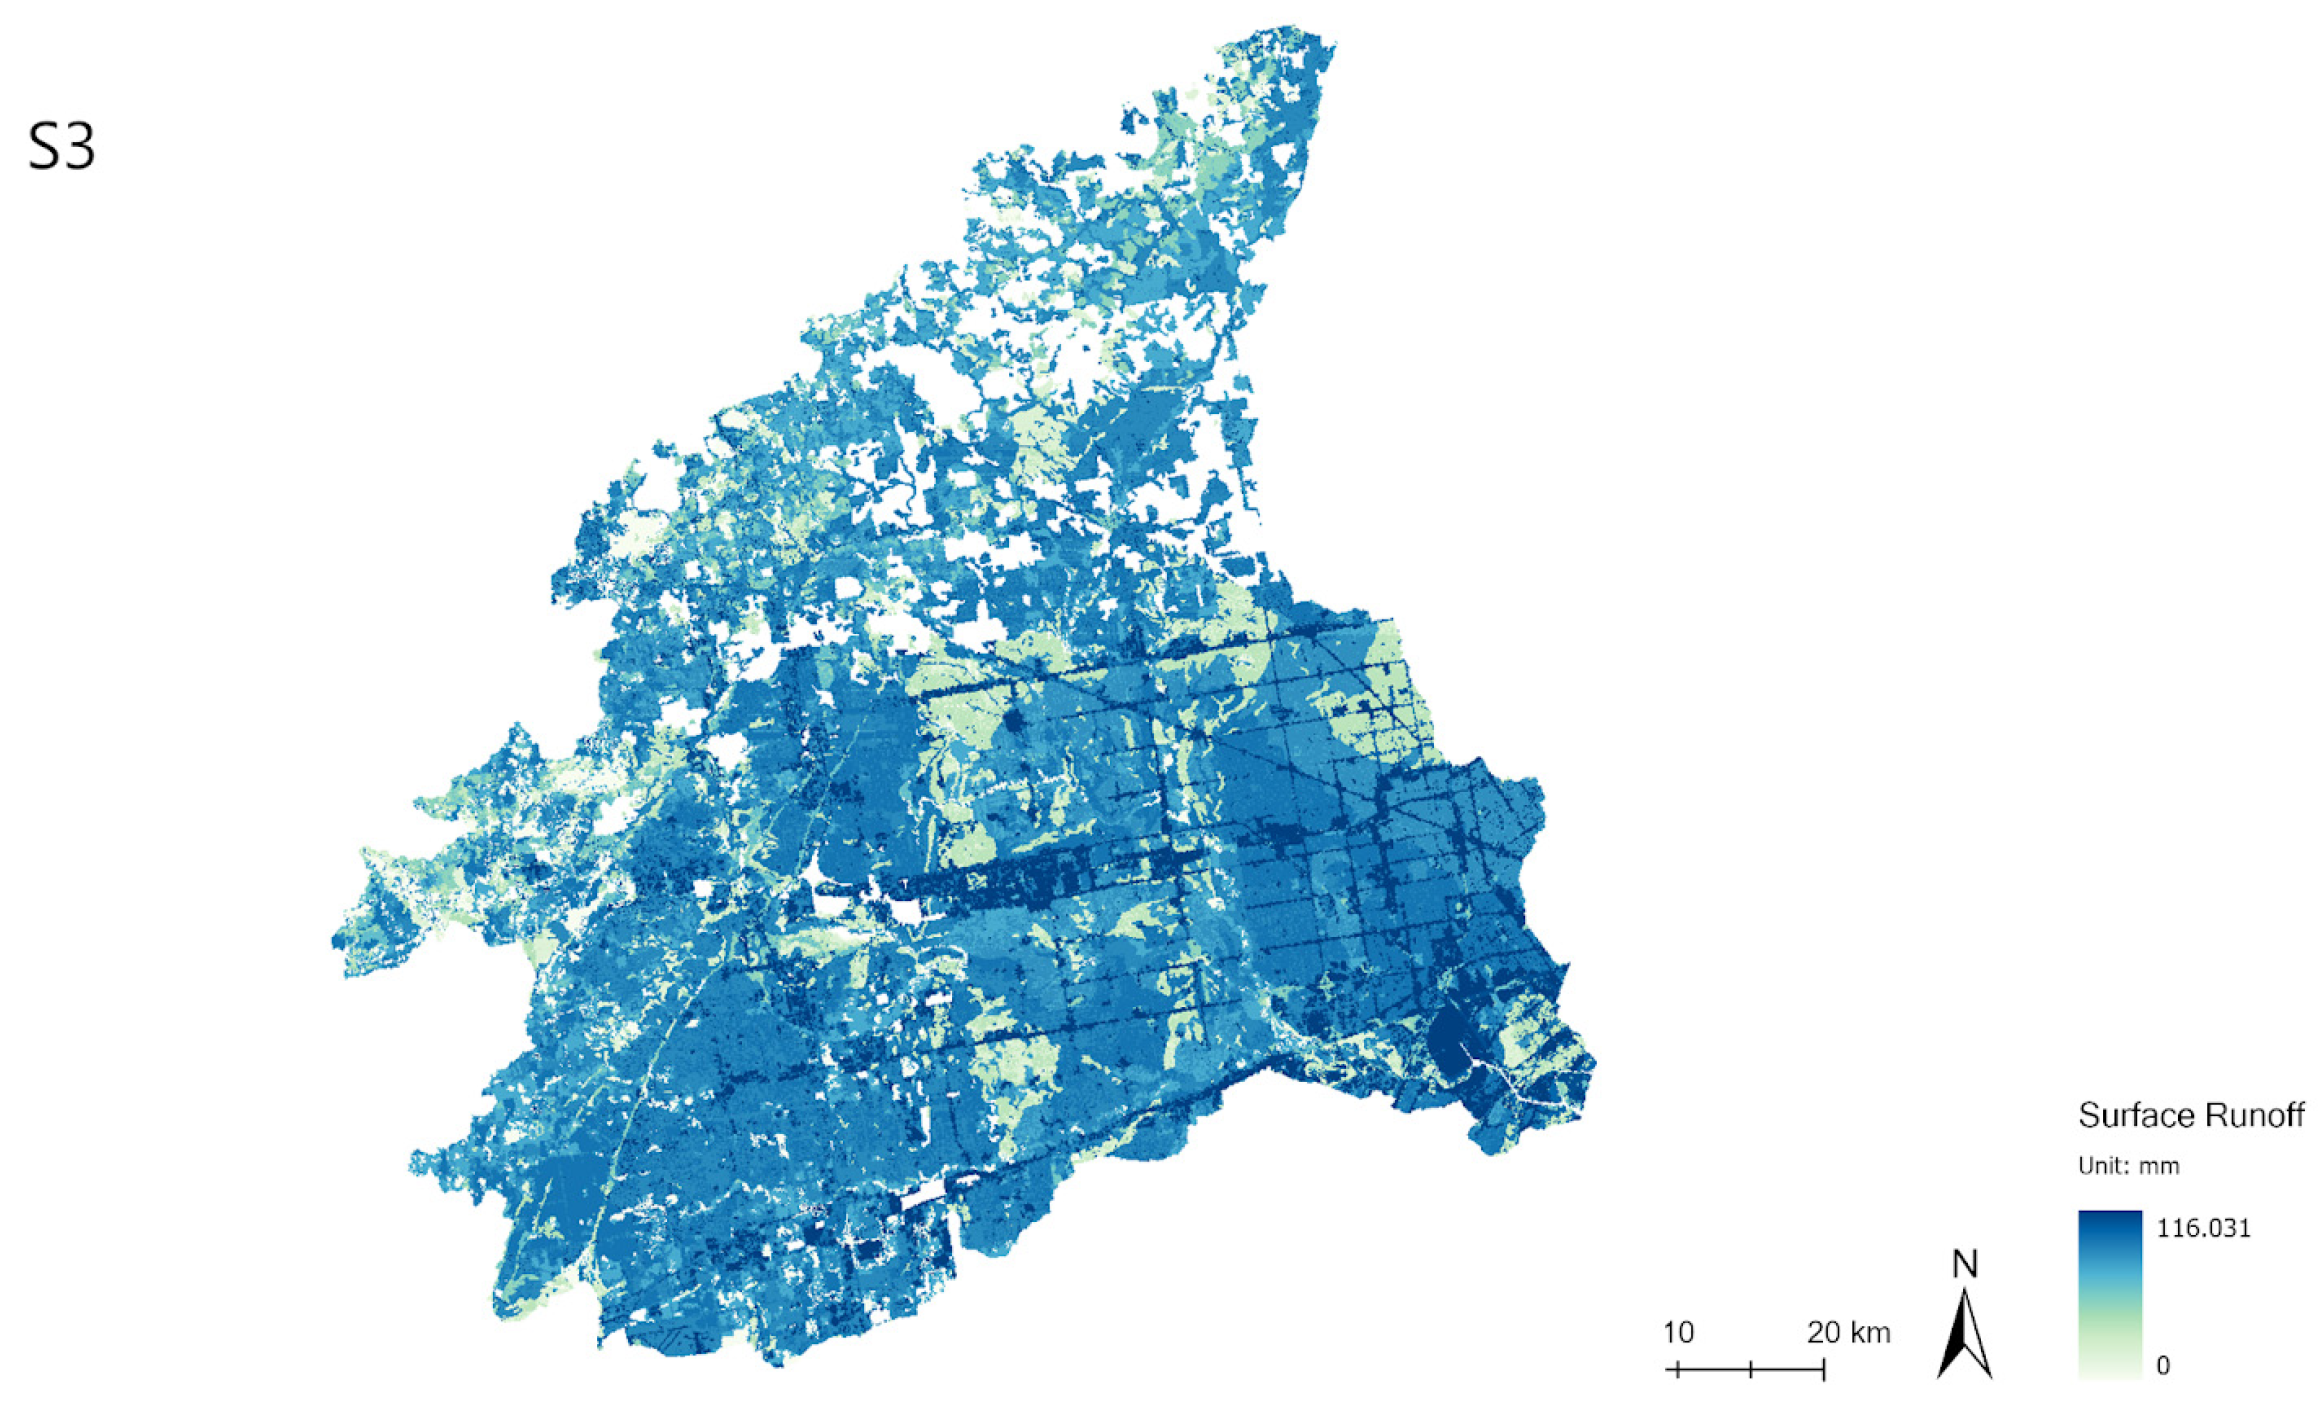
3.4. UFRM Results
4. Discussion
4.1. Factors Influencing Historical Nutrient Export and Urban Flooding
4.1.1. Factors Influencing Nutrient Export
4.1.2. Factors Influencing Urban Flooding
4.2. Factors Influencing Nutrient Export and Urban Flooding under Future Scenarios
4.2.1. Discussion of Future LULC Scenarios
4.2.2. Factors Influencing Nutrient Export under Future Scenarios
4.2.3. Factors Influencing Urban Flooding under Future Scenarios
4.3. Planning Implications
4.4. Limitation
5. Conclusions
Author Contributions
Funding
Data Availability Statement
Conflicts of Interest
Appendix A


| TFA | kb | Correlation P 1 | Correlation N 2 |
|---|---|---|---|
| 2000 | 8 | 0.494298 | 0.57489 |
| 2000 | 4 | 0.494298 | 0.57489 |
| 2000 | 2 | 0.544141 | 0.612917 |
| 2000 | 1 | 0.599834 | 0.667834 |
| 2000 | 0.5 | 0.581968 | 0.642988 |
| 1000 | 8 | 0.567762 | 0.604707 |
| 1000 | 4 | 0.567763 | 0.605331 |
| 1000 | 2 | 0.571693 | 0.62014 |
| 1000 | 1 | 0.629356 3 | 0.677009 3 |
| 1000 | 0.5 | 0.582942 | 0.655857 |
| 800 | 8 | 0.133197 | 0.135486 |
| 800 | 4 | 0.133222 | 0.135511 |
| 800 | 2 | 0.133201 | 0.135499 |
| 800 | 1 | 0.133193 | 0.135502 |
| 800 | 0.5 | 0.133227 | 0.135542 |
| 500 | 8 | 0.133197 | 0.135486 |
| 500 | 4 | 0.133177 | 0.135464 |
| 500 | 2 | 0.133165 | 0.135454 |
| 500 | 1 | 0.135472 | 0.133163 |
| 500 | 0.5 | 0.133171 | 0.135474 |
| 200 | 8 | 0.041551 | 0.04784 |
| 200 | 4 | 0.041553 | 0.047854 |
| 200 | 2 | 0.041543 | 0.047845 |
| 200 | 1 | 0.047843 | 0.04154 |
| 200 | 0.5 | 0.041552 | 0.047862 |
| No. | Previous LULC Type | Following LULC Type |
|---|---|---|
| 1 | Developed, open space | Developed, low intensity 1 |
| 2 | Developed, open space | Developed, medium intensity 2 |
| 3 | Developed, low intensity | Developed, open space |
| 4 | Developed, low intensity | Developed, medium intensity |
| 5 | Developed, low intensity | Developed, high intensity 3 |
| 6 | Developed, medium intensity | Developed, low intensity |
| 7 | Developed, medium intensity | Developed, high intensity |
| 8 | Developed, high intensity | Developed, medium intensity |
| 9 | Deciduous forest | Developed, medium intensity |
Appendix B
References
- Pittini, M.; Rahman, M.; Defra, U.K. Social cost of carbon: Key issues arising from a UK review. In The Benefits of Climate Change Policies; OECD-Publication: Washington, DC, USA, 2004; pp. 189–220. [Google Scholar]
- Zadbagher, E.; Becek, K.; Berberoglu, S. Modeling land use/land cover change using remote sensing and geographic information systems: Case study of the Seyhan Basin, Turkey. Environ. Monit. Assess. 2018, 190, 494. [Google Scholar] [CrossRef] [PubMed]
- Watson, S.B.; Miller, C.; Arhonditsis, G.; Boyer, G.L.; Carmichael, W.; Charlton, M.N.; Confesor, R.; Depew, D.; Höök, T.O.; Ludsin, S.A.; et al. The re-eutrophication of Lake Erie: Harmful algal blooms and hypoxia. Harmful Algae 2016, 56, 44–66. [Google Scholar] [CrossRef]
- Dhillon, G.S.; Inamdar, S. Extreme storms and changes in particulate and dissolved organic carbon in runoff: Entering uncharted waters? Geophys. Res. Lett. 2013, 40, 1322–1327. [Google Scholar] [CrossRef]
- Sharpley, A.N.; Kleinman, P.J.A.; Heathwaite, A.L.; Gburek, W.J.; Folmar, G.J.; Schmidt, J.P. Phosphorus Loss from an Agricultural Watershed as a Function of Storm Size. J. Environ. Qual. 2008, 37, 362–368. [Google Scholar] [CrossRef]
- Natural Capital Project. InVEST 3.14.0. Stanford University, University of Minnesota, Chinese Academy of Sciences, The Nature Conservancy, World Wildlife Fund, Stockholm Resilience Centre, and the Royal Swedish Academy of Sciences. 2023. Available online: https://naturalcapitalproject.stanford.edu/software/invest (accessed on 13 October 2023).
- Michalak, A.M.; Anderson, E.J.; Beletsky, D.; Boland, S.; Bosch, N.S.; Bridgeman, T.B.; Chaffin, J.D.; Cho, K.; Confesor, R.; Zagorski, M.A.; et al. Record-setting algal bloom in Lake Erie caused by agricultural and meteorological trends consistent with expected future conditions. Proc. Natl. Acad. Sci. USA 2013, 110, 6448–6452. [Google Scholar] [CrossRef]
- Redhead, J.W.; May, L.; Oliver, T.H.; Hamel, P.; Sharp, R.; Bullock, J.M. National scale evaluation of the InVEST nutrient retention model in the United Kingdom. Sci. Total Environ. 2018, 610–611, 666–677. [Google Scholar] [CrossRef]
- Bose, S.; Mazumdar, A. Urban flood risk assessment and mitigation with InVEST-UFRM model: A case study on Kolkata city, West Bengal state (India). Arab. J. Geosci. 2023, 16, 320. [Google Scholar] [CrossRef]
- Wang, Z.; Nassauer, J.I.; Marans, R.W.; Brown, D.G. Different Types of Open Spaces and Their Importance to Exurban Homeowners. Soc. Nat. Resour. 2012, 25, 368–383. [Google Scholar] [CrossRef]
- Boyd, J.; Banzhaf, S. What are ecosystem services? The need for standardized environmental accounting units. Ecol. Econ. 2007, 63, 616–626. [Google Scholar] [CrossRef]
- Zhao, J. Multi-dimensional Perspectives and Differentiated Strategies of Basin-Scale Water Ecological Conservation and Restoration. Landsc. Arch. Front. 2021, 9, 8–11. [Google Scholar] [CrossRef]
- Lei, Y.; Yang, K.; Wang, B.; Sheng, Y.; Bird, B.W.; Zhang, G.; Tian, L. Response of inland lake dynamics over the Tibetan Plateau to climate change. Clim. Chang. 2014, 125, 281–290. [Google Scholar] [CrossRef]
- Qiu, M.; Liu, L.; Ling, Q.; Cai, Y.; Yu, S.; Wang, S.; Fu, D.; Hu, B.; Wang, X. Biochar for the removal of contaminants from soil and water: A review. Biochar 2022, 4, 19. [Google Scholar] [CrossRef]
- Kowe, P.; Mutanga, O.; Odindi, J.; Dube, T. Effect of landscape pattern and spatial configuration of vegetation patches on urban warming and cooling in Harare metropolitan city, Zimbabwe. GIScience Remote Sens. 2021, 58, 261–280. [Google Scholar] [CrossRef]
- Lischka, S.A.; Teel, T.L.; Johnson, H.E.; Reed, S.E.; Breck, S.; Carlos, A.D.; Crooks, K.R. A conceptual model for the integration of social and ecological information to understand human-wildlife interactions. Biol. Conserv. 2018, 225, 80–87. [Google Scholar] [CrossRef]
- Arbury, J. From Urban Sprawl to Compact City: An Analysis of Urban Growth Management in Auckland; University of Auckland: Auckland, New Zealand, 2005. [Google Scholar]
- Bibri, S.E.; Krogstie, J.; Kärrholm, M. Compact city planning and development: Emerging practices and strategies for achieving the goals of sustainability. Dev. Built Environ. 2020, 4, 100021. [Google Scholar] [CrossRef]
- Bibri, S.E.; Krogstie, J. Smart sustainable cities of the future: An extensive interdisciplinary literature review. Sustain. Cities Soc. 2017, 31, 183–212. [Google Scholar] [CrossRef]
- Bibri, S.E. A novel model for data-driven smart sustainable cities of the future: The institutional transformations required for balancing and advancing the three goals of sustainability. Energy Inform. 2021, 4, 4. [Google Scholar] [CrossRef]
- Agarwal, C. A Review and Assessment of Land-Use Change Models: Dynamics of Space, Time, and Human Choice; U.S. Department of Agriculture, Forest Service, Northeastern Research Station: Newton Square, PA, USA, 2002.
- Motlagh, S.K.; Sadoddin, A.; Haghnegahdar, A.; Razavi, S.; Salmanmahiny, A.; Ghorbani, K. Analysis and prediction of land cover changes using the land change modeler (LCM) in a semiarid river basin, Iran. Land Degrad. Dev. 2021, 32, 3092–3105. [Google Scholar] [CrossRef]
- Murray, K.S.; Cauvet, D.; Lybeer, M.; Thomas, J.C. Particle size and chemical control of heavy metals in bed sediment from the rouge river, southeast michigan. Environ. Sci. Technol. 1999, 33, 987–992. [Google Scholar] [CrossRef]
- Tiquia, S.M. Metabolic diversity of the heterotrophic microorganisms and potential link to pollution of the Rouge River. Environ. Pollut. 2010, 158, 1435–1443. [Google Scholar] [CrossRef]
- Pirrone, N.; Keeler, G.J.; Nriagu, J.O.; Warner, P.O. Historical trends of airborne trace metals in Detroit from 1971 to 1992. Water Air Soil Pollut. 1996, 88, 145–165. [Google Scholar] [CrossRef]
- Hughes, C.; Rathbun, J.; Kluitenberg, E.; Cave, K.; Catalfio, C. Water Quality Trends in the Rouge River Watershed; Water Environment Federation: Alexandria, VA, USA, 2004; Volume 2004, pp. 1645–1670. [Google Scholar]
- Pirrone, N.; Keeler, G.J. The Rouge River watershed pollution by trace elements: Atmospheric depositions and emission sources. Water Sci. Technol. 1996, 33, 267–275. [Google Scholar] [CrossRef]
- Baker, B.B.; Haimbaugh, A.S.; Sperone, F.G.; Johnson, D.M.; Baker, T.R. Persistent contaminants of emerging concern in a great lakes urban-dominant watershed. J. Great Lakes Res. 2022, 48, 171–182. [Google Scholar] [CrossRef]
- Lin, B.; Chen, X.; Yao, H.; Chen, Y.; Liu, M.; Gao, L.; James, A. Analyses of landuse change impacts on catchment runoff using different time indicators based on SWAT model. Ecol. Indic. 2015, 58, 55–63. [Google Scholar] [CrossRef]
- Qin, X.; Wu, Y.; Lin, T.; Gao, L. Urban Flood Dynamic Risk Assessment Based on Typhoon Rainfall Process: A Case Study of Typhoon “Lupit” (2019) in Fuzhou, China. Remote Sens. 2023, 15, 3116. [Google Scholar] [CrossRef]
- Zhou, H.; Shi, P.; Wang, J.A.; Yu, D.; Gao, L. Rapid urbanization and implications for river ecological services restoration: Case study in Shenzhen, China. J. Urban Plan. Dev. 2011, 137, 121–132. [Google Scholar] [CrossRef]
- Martinuzzi, S.; Withey, J.C.; Pidgeon, A.M.; Plantinga, A.J.; McKerrow, A.J.; Williams, S.G.; Helmers, D.P.; Radeloff, V.C. Future land-use scenarios and the loss of wildlife habitats in the southeastern United States. Ecol. Appl. 2015, 25, 160–171. [Google Scholar] [CrossRef]
- Beam, J.D.; Braunscheidel, J.J. Rouge River Assessment; Michigan Department of Natural Resources, Fisheries Division: Lansing, MI, USA, 1998; Volume 1.
- Ellison, G. Rogue River PFAS Contamination. Mlive. 2021. Available online: https://www.mlive.com (accessed on 22 June 2021).
- Yan, Y.; Guan, Q.; Wang, M.; Su, X.; Wu, G.; Chiang, P.; Cao, W. Assessment of nitrogen reduction by constructed wetland based on InVEST: A case study of the Jiulong River Watershed, China. Mar. Pollut. Bull. 2018, 133, 349–356. [Google Scholar] [CrossRef]
- Dewitz, J.; Geological Survey. National Land Cover Database (NLCD) 2019 Products (ver. 2.0, June 2021); U.S. Geological Survey: Reston, VA, USA, 2021. [CrossRef]
- Wickham, J.; Stehman, S.V.; Sorenson, D.G.; Gass, L.; Dewitz, J.A. Thematic accuracy assessment of the NLCD 2019 land cover for the conterminous United States. GIScience Remote Sens. 2023, 60, 2181143. [Google Scholar] [CrossRef]
- Dillon, P.; Kirchner, W. The effects of geology and land use on the export of phosphorus from watersheds. Water Res. 1975, 9, 135–148. [Google Scholar] [CrossRef]
- Mas, J.-F.; Kolb, M.; Paegelow, M.; Olmedo, M.T.C.; Houet, T. Inductive pattern-based land use/cover change models: A comparison of four software packages. Environ. Model. Softw. 2014, 51, 94–111. [Google Scholar] [CrossRef]
- Anand, J.; Gosain, A.; Khosa, R. Prediction of land use changes based on Land Change Modeler and attribution of changes in the water balance of Ganga basin to land use change using the SWAT model. Sci. Total Environ. 2018, 644, 503–519. [Google Scholar] [CrossRef]
- Krushinsky, D.; Makarenko, A. Cellular automata with anticipation: Examples and presumable applications. AIP Conf. Proc. 2010, 1303, 246–254. [Google Scholar]
- Chen, Y.; Yu, F.; Cheng, Z.; Jin, Q.; Pei, Z.; Yi, W. Academic Insights and Perspectives: Cellular Automata and Production Scheduling. Math. Probl. Eng. 2020, 2020, 6327314. [Google Scholar] [CrossRef]
- Liping, C.; Yujun, S.; Saeed, S. Monitoring and predicting land use and land cover changes using remote sensing and GIS techniques—A case study of a hilly area, Jiangle, China. PLoS ONE 2018, 13, e0200493. [Google Scholar] [CrossRef] [PubMed]
- Zhang, Z.; Hu, B.; Jiang, W.; Qiu, H. Identification and scenario prediction of degree of wetland damage in Guangxi based on the CA-Markov model. Ecol. Indic. 2021, 127, 107764. [Google Scholar] [CrossRef]
- Fathizad, H.; Rostami, N.; Faramarzi, M. Detection and prediction of land cover changes using Markov chain model in semi-arid rangeland in western Iran. Environ. Monit. Assess. 2015, 187, 629. [Google Scholar] [CrossRef]
- Subedi, P.; Subedi, K.; Thapa, B. Application of a hybrid cellular automaton–markov (camarkov) model in land-use change prediction: A case study of saddle creek drainage basin, Florida. Appl. Ecol. Environ. Sci. 2013, 1, 126–132. [Google Scholar]
- Leta, M.K.; Demissie, T.A.; Tränckner, J. Modeling and Prediction of Land Use Land Cover Change Dynamics Based on Land Change Modeler (LCM) in Nashe Watershed, Upper Blue Nile Basin, Ethiopia. Sustainability 2021, 13, 3740. [Google Scholar] [CrossRef]
- Masud, S.; Ali, Z.; Haq, M.; Ghauri, B. Monitoring and predicting landuse/landcover change using an integrated ahiwa chain & multilayer perceptron model: A case study of ahiwal tehsil. J. GeoSpace Sci. 2016, 2, 43–59. [Google Scholar]
- Sang, L.; Zhang, C.; Yang, J.; Zhu, D.; Yun, W. Simulation of land use spatial pattern of towns and villages based on CA–Markov model. Math. Comput. Model. 2011, 54, 938–943. [Google Scholar] [CrossRef]
- Zarandian, A.; Mohammadyari, F.; Mirsanjari, M.M.; Visockiene, J.S. Scenario modeling to predict changes in land use/cover using Land Change Modeler and InVEST model: A case study of Karaj Metropolis, Iran. Environ. Monit. Assess. 2023, 195, 273. [Google Scholar] [CrossRef] [PubMed]
- Hanrahan, B.R.; King, K.W.; Duncan, E.W.; Shedekar, V.S. Cover crops differentially influenced nitrogen and phosphorus loss in tile drainage and surface runoff from agricultural fields in Ohio, USA. J. Environ. Manag. 2021, 293, 112910. [Google Scholar] [CrossRef] [PubMed]
- Li, X.-N.; Zhang, W.-W.; Wu, J.-Y.; Li, H.-J.; Zhao, T.-K.; Zhao, C.-Q.; Shi, R.-S.; Li, Z.-S.; Wang, C.; Li, C. Loss of nitrogen and phosphorus from farmland runoff and the interception effect of an ecological drainage ditch in the North China Plain—A field study in a modern agricultural park. Ecol. Eng. 2021, 169, 106310. [Google Scholar] [CrossRef]
- McDowell, W.G.; Potter, J.D.; Ramírez, A. Nutrient export and elemental stoichiometry in an urban tropical river. Ecol. Appl. 2018, 29, e01839. [Google Scholar] [CrossRef]
- Manning, D.W.P.; Rosemond, A.D.; Benstead, J.P.; Bumpers, P.M.; Kominoski, J.S. Transport of N and P in U.S. streams and rivers differs with land use and between dissolved and particulate forms. Ecol. Appl. 2020, 30, e02130. [Google Scholar] [CrossRef] [PubMed]
- Phan, N.-T.; Kim, K.-H.; Shon, Z.-H.; Jeon, E.-C.; Jung, K.; Kim, N.-J. Analysis of ammonia variation in the urban atmosphere. Atmos. Environ. 2013, 65, 177–185. [Google Scholar] [CrossRef]
- Li, Y.; Schwab, J.J.; Demerjian, K.L. Measurements of ambient ammonia using a tunable diode laser absorption spectrometer: Characteristics of ambient ammonia emissions in an urban area of New York City. J. Geophys. Res. 2006, 111. [Google Scholar] [CrossRef]
- Decina, S.M.; Hutyra, L.R.; Templer, P.H. Hotspots of nitrogen deposition in the world’s urban areas: A global data synthesis. Front. Ecol. Environ. 2019, 18, 92–100. [Google Scholar] [CrossRef]
- Zampella, R.A.; Procopio, N.A.; Lathrop, R.G.; Dow, C.L. Relationship of land-use/land-cover patterns and surface-water quality in the Mullica River basin. J. Am. Water Resour. Assoc. 2007, 43, 594–604. [Google Scholar] [CrossRef]
- Hibbs, B.J.; Sharp, J.M., Jr. Hydrogeological Impacts of Urbanization. Environ. Eng. Geosci. 2012, 18, 3–24. [Google Scholar] [CrossRef]
- Zhou, F.; Xu, Y.P.; Chen, Y.; Xu, C.Y.; Gao, Y.Q.; Du, J.K. Hydrological response to urbanization at different spa-tio-temporal scales simulated by coupling of CLUE-S and the SWAT model in the Yangtze River Delta region. J. Hydrol. 2013, 485, 113–125. [Google Scholar] [CrossRef]
- Angrill, S.; Petit-Boix, A.; Morales-Pinzón, T.; Josa, A.; Rieradevall, J.; Gabarrell, X. Urban rainwater runoff quantity and quality—A potential endogenous resource in cities? J. Environ. Manag. 2017, 189, 14–21. [Google Scholar] [CrossRef]
- Fletcher, T.; Andrieu, H.; Hamel, P. Understanding, management and modelling of urban hydrology and its consequences for receiving waters: A state of the art. Adv. Water Resour. 2013, 51, 261–279. [Google Scholar] [CrossRef]
- Weng, Q. Modeling Urban Growth Effects on Surface Runoff with the Integration of Remote Sensing and GIS. Environ. Manag. 2001, 28, 737–748. [Google Scholar] [CrossRef]
- Huang, H.J.; Cheng, S.J.; Wen, J.C.; Lee, J.H. Effect of growing watershed imperviousness on hydrograph parameters and peak discharge. Hydrol. Process. 2008, 22, 2075–2085. [Google Scholar] [CrossRef]
- Olang, L.O.; Fürst, J. Effects of land cover change on flood peak discharges and runoff volumes: Model estimates for the Nyando River Basin, Kenya. Hydrol. Process. 2010, 25, 80–89. [Google Scholar] [CrossRef]
- Quan, R.-S.; Liu, M.; Zhang, L.-J.; Wang, J.-J.; Xu, S.-Y. Waterlogging risk assessment based on land use/cover change: A case study in Pudong New Area, Shanghai. Environ. Earth Sci. 2010, 61, 1113–1121. [Google Scholar] [CrossRef]
- Richert, E.; Bianchin, S.; Heilmeier, H.; Merta, M.; Seidler, C. A method for linking results from an evaluation of land use scenarios from the viewpoint of flood prevention and nature conservation. Landsc. Urban Plan. 2011, 103, 118–128. [Google Scholar] [CrossRef]
- Yao, L.; Chen, L.; Wei, W. Exploring the Linkage between Urban Flood Risk and Spatial Patterns in Small Urbanized Catchments of Beijing, China. Int. J. Environ. Res. Public Health 2017, 14, 239. [Google Scholar] [CrossRef] [PubMed]
- Thorslund, J.; Jarsjo, J.; Jaramillo, F.; Jawitz, J.W.; Manzoni, S.; Basu, N.B.; Chalov, S.R.; Cohen, M.J.; Creed, I.F.; Goldenberg, R.; et al. Wetlands as large-scale nature-based solutions: Status and challenges for research, engineering and management. Ecol. Eng. 2017, 108, 489–497. [Google Scholar] [CrossRef]
- Esperon-Rodriguez, M.; Tjoelker, M.G.; Lenoir, J.; Baumgartner, J.B.; Beaumont, L.J.; Nipperess, D.A.; Power, S.A.; Richard, B.; Rymer, P.D.; Gallagher, R.V. Climate change increases global risk to urban forests. Nat. Clim. Change 2022, 12, 950–955. [Google Scholar] [CrossRef]
- Xu, W.; Lin, T.; Lei, X.; Chen, Y.; Gao, L. Anthropogenic emissions and land use/cover change contributions to extreme temperature changes over China. Atmos. Res. 2023, 292, 106845. [Google Scholar] [CrossRef]
- Reisinger, A.J.; Lusk, M.; Smyth, A. Sources and Transformations of Nitrogen in Urban Landscapes: SL468/SS681, 3/2020. EDIS 2020. [Google Scholar] [CrossRef]
- Beusen, A.; Doelman, J.; Van Beek, L.; Van Puijenbroek, P.; Mogollón, J.; Van Grinsven, H.; Stehfest, E.; Van Vuuren, D.; Bouwman, A. Exploring river nitrogen and phosphorus loading and export to global coastal waters in the Shared Socio-economic pathways. Glob. Environ. Change 2021, 72, 102426. [Google Scholar] [CrossRef]
- Alexander, C. Towards a sustainable neighborhood: The role of open spaces. Archit. Res. 2008, 2, 162–177. [Google Scholar]
- Parks, P.J.; Schorr, J.P. Sustaining Open Space Benefits in the Northeast: An Evaluation of the Conservation Reserve Program. J. Environ. Econ. Manag. 1997, 32, 85–94. [Google Scholar] [CrossRef]
- Maaroufi, N.I.; De Long, J.R. Global change impacts on forest soils: Linkage between soil biota and car-bon-nitrogen-phosphorus stoichiometry. Front. For. Glob. Change 2020, 3, 16. [Google Scholar] [CrossRef]
- Makuch, J.R. The role of trees and forests in healthy watersheds: Managing stormwater, reducing flooding, and improving water quality. For. Steward. Bull. 2008, 10. [Google Scholar]
- Rall, E.L.; Haase, D. Creative intervention in a dynamic city: A sustainability assessment of an interim use strategy for brownfields in Leipzig, Germany. Landsc. Urban Plan. 2011, 100, 189–201. [Google Scholar] [CrossRef]
- Santos, R.M.B.; Fernandes, L.S.; Pereira, M.G.; Cortes, R.M.V.; Pacheco, F.A.L. A framework model for investigating the export of phosphorus to surface waters in forested watersheds: Implications to management. Sci. Total Environ. 2015, 536, 295–305. [Google Scholar] [CrossRef] [PubMed]
- Homer, C.G.; Fry, J.A.; Barnes, C.A. The National Land Cover Database 2012. USGS Publications Warehouse. 2012. Available online: https://pubs.usgs.gov/publication/fs20123020 (accessed on 13 October 2023).
- Janke, B.D.; Finlay, J.C.; Hobbie, S.E. Trees and Streets as Drivers of Urban Stormwater Nutrient Pollution. Environ. Sci. Technol. 2017, 51, 9569–9579. [Google Scholar] [CrossRef] [PubMed]
- Fennessy, M.S.; Cronk, J.K. The effectiveness and restoration potential of riparian ecotones for the management of nonpoint source pollution, particularly nitrate. Crit. Rev. Environ. Sci. Technol. 1997, 27, 285–317. [Google Scholar] [CrossRef]
- Álvarez, X.; Valero, E.; Santos, R.M.; Varandas, S.G.P.; Fernandes, L.S.; Pacheco, F.A.L. Anthropogenic nutrients and eutrophication in multiple land use watersheds: Best management practices and policies for the protection of water resources. Land Use Policy 2017, 69, 1–11. [Google Scholar] [CrossRef]
- Wu, J.; Wang, H.; Li, G.; Ma, W.; Wu, J.; Gong, Y.; Xu, G. Vegetation degradation impacts soil nutrients and enzyme activities in wet meadow on the Qinghai-Tibet Plateau. Sci. Rep. 2020, 10, 21271. [Google Scholar] [CrossRef]
- Talib, A.; Randhir, T.O. Long-term effects of land-use change on water resources in urbanizing watersheds. PLoS Water 2023, 2, e0000083. [Google Scholar] [CrossRef]
- Claessens, L.; Hopkinson, C.; Rastetter, E.; Vallino, J. Effect of historical changes in land use and climate on the water budget of an urbanizing watershed. Water Resour. Res. 2006, 42, W03426. [Google Scholar] [CrossRef]
- Li, C.; Sun, G.; Caldwell, P.V.; Cohen, E.; Fang, Y.; Zhang, Y.; Oudin, L.; Sanchez, G.M.; Meentemeyer, R.K. Impacts of Urbanization on Watershed Water Balances Across the Conterminous United States. Water Resour. Res. 2020, 56, e2019WR026574. [Google Scholar] [CrossRef]
- Roberts, A.D.; Prince, S.D. Effects of urban and non-urban land cover on nitrogen and phosphorus runoff to Chesapeake Bay. Ecol. Indic. 2010, 10, 459–474. [Google Scholar] [CrossRef]
- Bossio, D.; Geheb, K.; Critchley, W. Managing water by managing land: Addressing land degradation to improve water productivity and rural livelihoods. Agric. Water Manag. 2010, 97, 536–542. [Google Scholar] [CrossRef]
- Vlek, P.L.G.; Khamzina, A.; Azadi, H.; Bhaduri, A.; Bharati, L.; Braimoh, A.; Martius, C.; Sunderland, T.; Taheri, F. Trade-Offs in Multi-Purpose Land Use under Land Degradation. Sustainability 2017, 9, 2196. [Google Scholar] [CrossRef]
- Dickinson, N.M. Soil degradation and nutrients. In The Restoration and Management of Derelict Land: Modern Approaches; World Scientific: Singapore, 2003; pp. 50–65. [Google Scholar]
- Ferreira, C.S.; Walsh, R.P.; Ferreira, A.J. Degradation in urban areas. Curr. Opin. Environ. Sci. Health 2018, 5, 19–25. [Google Scholar] [CrossRef]
- Safransky, S. Greening the urban frontier: Race, property, and resettlement in Detroit. Geoforum 2014, 56, 237–248. [Google Scholar] [CrossRef]
- Land, M.; Granéli, W.; Grimvall, A.; Hoffmann, C.C.; Mitsch, W.J.; Tonderski, K.S.; Verhoeven, J.T.A. How effective are created or restored freshwater wetlands for nitrogen and phosphorus removal? A systematic review. Environ. Évid. 2016, 5, 9. [Google Scholar] [CrossRef]
- Kaplan, R.; Austin, M.E.; Kaplan, S. Open Space Communities: Resident Perceptions, Nature Benefits, and Problems with Terminology. J. Am. Plan. Assoc. 2004, 70, 300–312. [Google Scholar] [CrossRef]
- Lee, A.C.K.; Maheswaran, R. The health benefits of urban green spaces: A review of the evidence. J. Public Health 2010, 33, 212–222. [Google Scholar] [CrossRef]
- Stone, E. The benefits of community-managed open space: Community gardening in New York City. In Restorative Commons: Creating Health and Well-Being through Urban Landscapes; Campbell, L., Wiesen, A., Eds.; USDA Forest Service: Newtown Square, PA, USA, 2009. [Google Scholar]
- Mwendwa, P.; Giliba, R.A. Benefits and challenges of urban green spaces. Chin. J. Popul. Resour. Environ. 2012, 10, 73–79. [Google Scholar] [CrossRef]
- Douglas, O.; Lennon, M.; Scott, M. Green space benefits for health and well-being: A life-course approach for urban planning, design and management. Cities 2017, 66, 53–62. [Google Scholar] [CrossRef]
- Mell, I.C. Green infrastructure: Concepts and planning. Forum Ejournal 2008, 8, 69–80. [Google Scholar]
- Coutts, C.; Hahn, M. Green infrastructure, ecosystem services, and human health. Int. J. Environ. Res. Public Health 2015, 12, 9768–9798. [Google Scholar] [CrossRef]
- Ahern, J. Planning for an extensive open space system: Linking landscape structure and function. Landsc. Urban Plan. 1991, 21, 131–145. [Google Scholar] [CrossRef]
- Maruani, T.; Amit-Cohen, I. Open space planning models: A review of approaches and methods. Landsc. Urban Plan. 2007, 81, 1–13. [Google Scholar] [CrossRef]
- Line, D.; White, N. Effects of Development on Runoff and Pollutant Export. Water Environ. Res. 2007, 79, 185–190. [Google Scholar] [CrossRef]
- Chang, H. Comparative streamflow characteristics in urbanizing basins in the Portland Metropolitan Area, Oregon, USA. Hydrol. Process. 2006, 21, 211–222. [Google Scholar] [CrossRef]
- Sun, Z.; Guo, H.; Li, X.; Huang, Q.; Zhang, D. Effect of LULC change on surface runoff in urbanization area. In Proceedings of the ASPRS 2011 Annual Conference, Milwaukee, WI, USA, 1–5 May 2011; Volume 1. [Google Scholar]
- Li, C.; Liu, M.; Hu, Y.; Shi, T.; Qu, X.; Walter, M.T. Effects of urbanization on direct runoff characteristics in urban functional zones. Sci. Total Environ. 2018, 643, 301–311. [Google Scholar] [CrossRef] [PubMed]
- Burley, J.B.; Russcher, K.; Schutzki, R.; Jing, Z. Visual Metrics for the Maxton Plains Alvars in Michigan, USA. Landsc. Archit. Front. 2021, 9, 26–37. [Google Scholar]
- Golden, S.M. Occupied by design: Evaluating performative tactics for more sustainable shared city space in private-led regeneration projects. WIT Trans. Ecol. Environ. 2014, 191, 441–452. [Google Scholar]
- Bélanger, H.; Cameron, S.; de la Mora, C. Revitalization of public spaces in a working class neighborhood: Appropriation identity and urban imaginary, Chapter 4. In The Role of Place Identity in the Perception, Understanding, and Design of Built Environments; Casakin, H., Bernardo, F., Eds.; Bentham Science: Sharjah, United Arab Emirates, 2012; pp. 47–62. [Google Scholar]
- Salone, C.; Baraldi, S.B.; Pazzola, G. Cultural production in peripheral urban spaces: Lessons from Barriera, Turin (Italy). Eur. Plan. Stud. 2017, 25, 2117–2137. [Google Scholar] [CrossRef]
- Julier, G. Urban Designscapes and the Production of Aesthetic Consent. Urban Stud. 2005, 42, 869–887. [Google Scholar] [CrossRef]
- Ihaylov, N.; Perkins, D.D. Community place attachment and its role in social capital development, Chapter 5. In Place Attachment: Advances in Theory, Methods and Application; Manzo, L.C., Devine-Wright, P., Eds.; Routledge: New York, NY, USA, 2014; pp. 61–74. [Google Scholar]
- Wolch, J.R.; Byrne, J.; Newell, J.P. Urban green space, public health, and environmental justice: The challenge of making cities ‘just green enough’. Landsc. Urban Plan. 2014, 125, 234–244. [Google Scholar] [CrossRef]
- French, E.L.; Birchall, S.J.; Landman, K.; Brown, R.D. Designing public open space to support seismic resilience: A systematic review. Int. J. Disaster Risk Reduct. 2018, 34, 1–10. [Google Scholar] [CrossRef]
- Orsetti, E.; Tollin, N.; Lehmann, M.; Valderrama, V.A.; Morató, J. Building resilient cities: Climate change and health interlinkages in the planning of public spaces. Int. J. Environ. Res. Public Health 2022, 19, 1355. [Google Scholar] [CrossRef] [PubMed]
- Elewa, A.K.A. Flexible Public Spaces through Spatial Urban Interventions, Towards Resilient Cities. Eur. J. Sustain. Dev. 2019, 8, 152. [Google Scholar] [CrossRef]
- Campbell, L.K.; Svendsen, E.S.; Sonti, N.F.; Johnson, M.L. A social assessment of urban parkland: Analyzing park use and meaning to inform management and resilience planning. Environ. Sci. Policy 2016, 62, 34–44. [Google Scholar] [CrossRef]
- Khodadad, M.; Aguilar-Barajas, I.; Khan, A.Z. Green Infrastructure for Urban Flood Resilience: A Review of Recent Literature on Bibliometrics, Methodologies, and Typologies. Water 2023, 15, 523. [Google Scholar] [CrossRef]
- Lerner, S.; Poole, W. The Economic Benefits of Parks and Open Space: How Land Conservation Helps Communities Grow Smart and Protect the Bottom Line; U.S. Department of Transportation: Washington, DC, USA, 1999.
- Correll, M.R.; Lillydahl, J.H.; Singell, L.D. The effects of greenbelts on residential property values: Some findings on the political economy of open space. Land Econ. 1978, 54, 207–217. [Google Scholar] [CrossRef]
- Iddamalgoda, I.D.M.P.; Warusavitharana, E. Investigation of Application of Green Infrastructure Practices for Storm Water Management in Urban Areas: A Case Study of Diyatha Uyana; University of Moratuwa: Moratuwa, Sri Lanka, 2022. [Google Scholar]
- Assumma, V.; Quagliolo, C.; Comino, E.; Mondini, G. Definition of an integrated theoretical framework to assess the NBS suitability in flood risk areas. In Proceedings of the International Conference on Computational Science and Its Applications, Malaga, Spain, 4–7 July 2022; pp. 228–237. [Google Scholar]
- Quagliolo, C.; Comino, E.; Pezzoli, A. Experimental Flash Floods Assessment Through Urban Flood Risk Mitigation (UFRM) Model: The Case Study of Ligurian Coastal Cities. Front. Water 2021, 3, 663378. [Google Scholar] [CrossRef]
- Marino, D.; Palmieri, M.; Marucci, A.; Soraci, M.; Barone, A.; Pili, S. Linking Flood Risk Mitigation and Food Secu-rity: An Analysis of Land-Use Change in the Metropolitan Area of Rome. Land 2023, 12, 366. [Google Scholar] [CrossRef]
- Benez-Secanho, F.J.; Dwivedi, P. Does quantification of ecosystem services depend upon scale (resolution and extent)? A case study using the InVEST nutrient delivery ratio model in Georgia, United States. Environments 2019, 6, 52. [Google Scholar] [CrossRef]
- Ding, L.; Qi, C.; Li, G.; Zhang, W. TP Concentration Inversion and Pollution Sources in Nanyi Lake Based on Landsat 8 Data and InVEST Model. Sustainability 2023, 15, 9678. [Google Scholar] [CrossRef]
- Kopacz, M.T.; Kowalewski, Z.; Santos, L.; Mazur, R.; Lopes, V.; Kowalczyk, A.; Bar-Michalczyk, D. Modelling of long term low water level in the mountain river catchments area. J. Water Land Dev. 2023, 51, 225–232. [Google Scholar] [CrossRef]


| Scenario Name | Limit Transition Type | Force Transition Type | Scenario Description |
|---|---|---|---|
| S1: Baseline | / | / | Keep original (2011–2019) 9 LULC’s changes. |
| S2: Forest Conservation | Deciduous forest to developed, open space | Developed, open space to deciduous forest | Protect greenfield land types dominated by deciduous trees and convert open space to woodland. |
| S3: Low-Intensity Development | Deciduous forest to developed, open space | Developed, open space to deciduous forest | Based on S1, limit the conversion of low and medium densities to high densities to minimize the creation of excessive high-intensity sites in urban development. |
| Developed, low intensity to developed, high intensity | |||
| Developed, medium intensity to developed, high intensity | |||
| S4: Medium- and High-Intensity Development | Deciduous forest to developed, open space | Developed, open space to deciduous forest | Based on S1, further, protect open space. Allow the city to develop incrementally on the original developed sites. |
| Developed, open space to developed, low intensity | |||
| Developed, open space to developed, medium intensity |
| Nutrient Export (kg) | 2019 | S1 | S2 | S3 | S4 |
|---|---|---|---|---|---|
| N | 80,435 | 87,165 (8.37%) 1 | 87,250 (8.47%) | 84,731 (5.34%) | 84,600 (5.18%) |
| P | 8462 | 9212 (8.86%) | 9259 (9.42%) | 9110 (7.66%) | 8974 (6.05%) |
Disclaimer/Publisher’s Note: The statements, opinions and data contained in all publications are solely those of the individual author(s) and contributor(s) and not of MDPI and/or the editor(s). MDPI and/or the editor(s) disclaim responsibility for any injury to people or property resulting from any ideas, methods, instructions or products referred to in the content. |
© 2023 by the authors. Licensee MDPI, Basel, Switzerland. This article is an open access article distributed under the terms and conditions of the Creative Commons Attribution (CC BY) license (https://creativecommons.org/licenses/by/4.0/).
Share and Cite
Zhao, Y.; Rong, Y.; Liu, Y.; Lin, T.; Kong, L.; Dai, Q.; Wang, R. Investigating Urban Flooding and Nutrient Export under Different Urban Development Scenarios in the Rouge River Watershed in Michigan, USA. Land 2023, 12, 2163. https://doi.org/10.3390/land12122163
Zhao Y, Rong Y, Liu Y, Lin T, Kong L, Dai Q, Wang R. Investigating Urban Flooding and Nutrient Export under Different Urban Development Scenarios in the Rouge River Watershed in Michigan, USA. Land. 2023; 12(12):2163. https://doi.org/10.3390/land12122163
Chicago/Turabian StyleZhao, Yilun, Yan Rong, Yiyi Liu, Tianshu Lin, Liangji Kong, Qinqin Dai, and Runzi Wang. 2023. "Investigating Urban Flooding and Nutrient Export under Different Urban Development Scenarios in the Rouge River Watershed in Michigan, USA" Land 12, no. 12: 2163. https://doi.org/10.3390/land12122163
APA StyleZhao, Y., Rong, Y., Liu, Y., Lin, T., Kong, L., Dai, Q., & Wang, R. (2023). Investigating Urban Flooding and Nutrient Export under Different Urban Development Scenarios in the Rouge River Watershed in Michigan, USA. Land, 12(12), 2163. https://doi.org/10.3390/land12122163