Article

Demand Analysis Models to Support Cultural Tourism Strategy: Application of Conjoint Analysis in North Sardinia (Italy)

by
Cristina Coscia
1,* and
Francesca Pasquino
2
1
Department of Architecture and Design (DAD), Politecnico di Torino, 10125 Turin, Italy
2
Independent Researcher, 10126 Torino, Italy
*
Author to whom correspondence should be addressed.
Land 2023, 12(12), 2150; https://doi.org/10.3390/land12122150
Submission received: 13 November 2023 / Revised: 3 December 2023 / Accepted: 7 December 2023 / Published: 11 December 2023
(This article belongs to the Special Issue Land Outlooks, Local Marketplaces and Tourism Advancement)

Abstract

:
This study focuses on an inner area in Northern Sardinia (Italy) currently experiencing depopulation and considered ‘fragile’ due to its lack of typical regional summer tourism. However, this area boasts an intriguing cultural heritage, currently under-recognized and undervalued. The aim of this contribution is to apply to this territory the Conjoint Analysis methodology, which examines target demand and constructs scenarios. Drawing from the regional plan for tourism, an exploratory phase was employed to support future strategies in cultural and touristic enhancement by stakeholders. In this regard, the experiment, involving a survey of 600 interviews among inhabitants (301) and tourists (299), aims to: (1) estimate the economic value of the cultural heritage and tourist consumption preferences using WTP, (2) raise awareness among decision-makers about the varied value perceptions of the territory and its heritage by its users, (3) craft a knowledge framework of this territory to diversification of the tourism offer. The study showcases innovative elements both in terms of internal technical aspects and strategic approach. The collection of preferences, based on a set of nine itinerary cards, highlights undervalued aspects related to intangible components, community well-being, sustainable consumption habits, sustainable mobility, and microeconomies not strictly tied to traditional tourism types.

1. Introduction

It is now well known that inland and rural areas are undergoing a demographic decline in favor of areas with more services; this phenomenon in the case of the region of Sardinia, results in the depopulation of inner areas in favor of coastal or peri-coastal territories.
In the common imagination, the word Sardinia is always associated almost exclusively with the word Sea. In reality, the Sardinian territory possesses numerous archaeological, landscape, artistic, cuisine and folklore treasures [1,2,3].
Historically, in Sardinia, policies have been purely aimed at seaside tourism, proposing the typical holiday that is concentrated along the coasts and focuses on the summer months, especially July and August, thus favoring the phenomenon of seasonality, i.e., the fluctuation of demand or supply in the travel and leisure sector due to multiple factors [4]. However, in the Strategic Tourism Marketing and Development Plan 2018–2021 there is a willingness on the part of the administration to enhance the island throughout the year, seeking to propose varied tourism offers that can reach a broader spectrum of visitors.
By now, “those who choose a city of art do not exclude a sports holiday, those who go to the seaside do not avoid cultural events. The segment tourist has been replaced by a hybrid figure, who manifests different needs depending on the moment and tends not to exclude anything” [5] (p. 25).
Simultaneously, while acknowledging the cross-sectional curiosity among tourists, it is imperative to avoid fostering mass tourism. Instead, an emphasis on measured and sustainable tourism, characterized by visits to locales and cultural heritage sites with reverence and genuine interest, should be advocated. This approach remains integral for cultivating cultural tourism, which not only yields economic advantages but also fosters cultural engagement, thereby enhancing historical consciousness [6].
Based on this new vision of the island’s enhancement, the analysis obviously does not want to focus on a single municipality, but rather to enhance a network of municipalities each with its own characteristics that can be competitive in terms of tourism and at the same time, thanks to these strategies, can improve the quality of life of its citizens.
In fact, when the valorization scenarios, as in the case of the itineraries proposed in this experimentation, do not coincide with the mere conservation of the artefacts, present themselves as complex projects, especially since several actors (public, private, non-profit) are involved who necessarily have different interests. Moreover, the complexity may be greater when the investment does not concern a specific asset (a single piece of architecture or a single museum), but a cultural system, i.e., a set of different assets (a set of minor goods spread throughout the territory). According to the latter approach, the asset should never be separated from its con-text and the territorial network of relations of which it is an organic part [7], although unfortunately to date in Italy this is the most widespread practice for cultural and landscape investments, which are often floating and fragmented.
To better understand how to act in the area, a competitive framework was first constructed. This operation is fundamental and propaedeutic for the acquisition of data to understand the problems and peculiarities of places. This inevitably leads to the reworking of the information acquired and the definition of sensitive issues and strategic objectives that will then form the basis of the enhancement of the municipalities in question. In addition, this work presents the innovative Conjoint Analysis methodology and its evolution called Choice Experiment, analyzing all the various aspects and characteristics, in order to show how these methodologies, although little used, are particularly useful in the field of cultural and landscape heritage, as they allow a greater investigative capacity since they identify different characteristics of the assets analyzed.
Such methods not only identify the most compatible features to ensure the success of the intervention, but also assess their potential to produce future economic flows that are indispensable to guarantee the autonomous maintenance and valorization of the territory.
Indeed, tourism, particularly cultural tourism, confronts a contemporary imperative: the prioritization of quality over quantity, while concurrently fostering job creation and income generation for the local populace.
The aim of this work is the valorization of small rural centers by exploiting their intrinsic features, demonstrating that the inland area can generate an economy by offering new types of tourism, different from that currently predominant in Sardinia. In this work, an attempt will be made to estimate the economic value of the area through a variety of different attractions, so as to diversify the tourist offer and promote all the capital the area has to offer. In addition to this, using this method the citizen (not only the tourist) has a leading role, since choices are to be co-responsibly constructed.

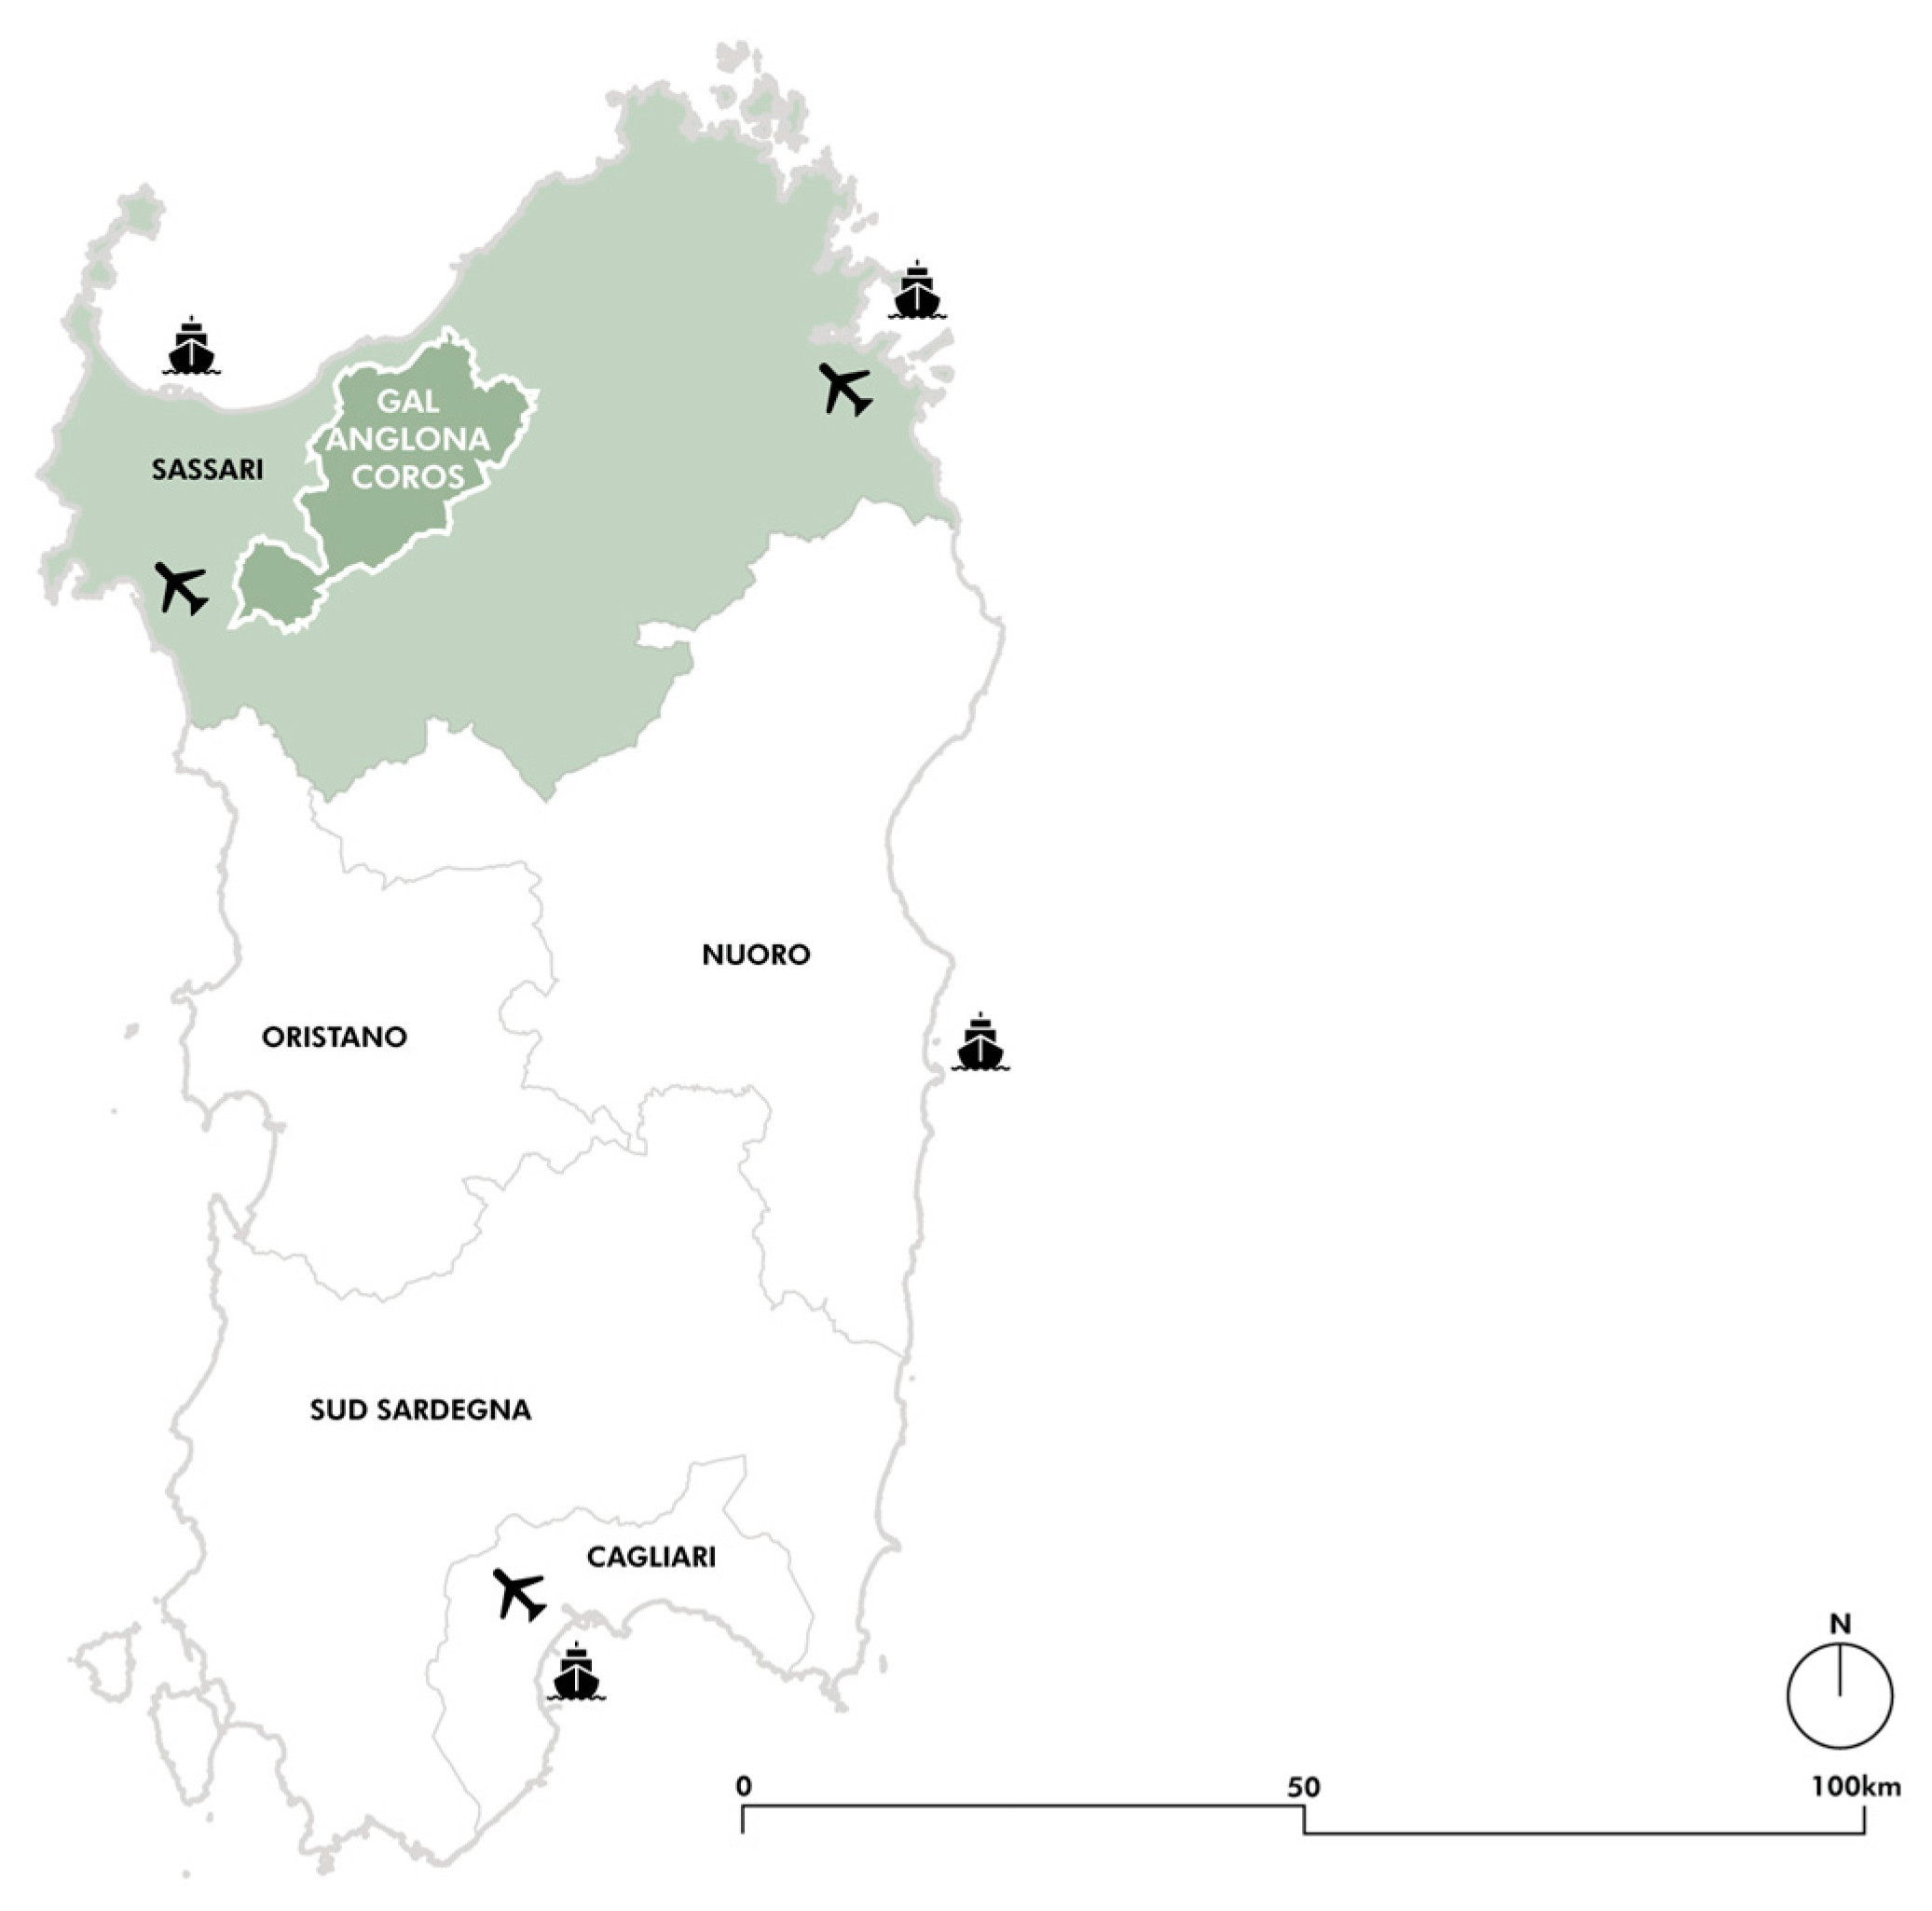
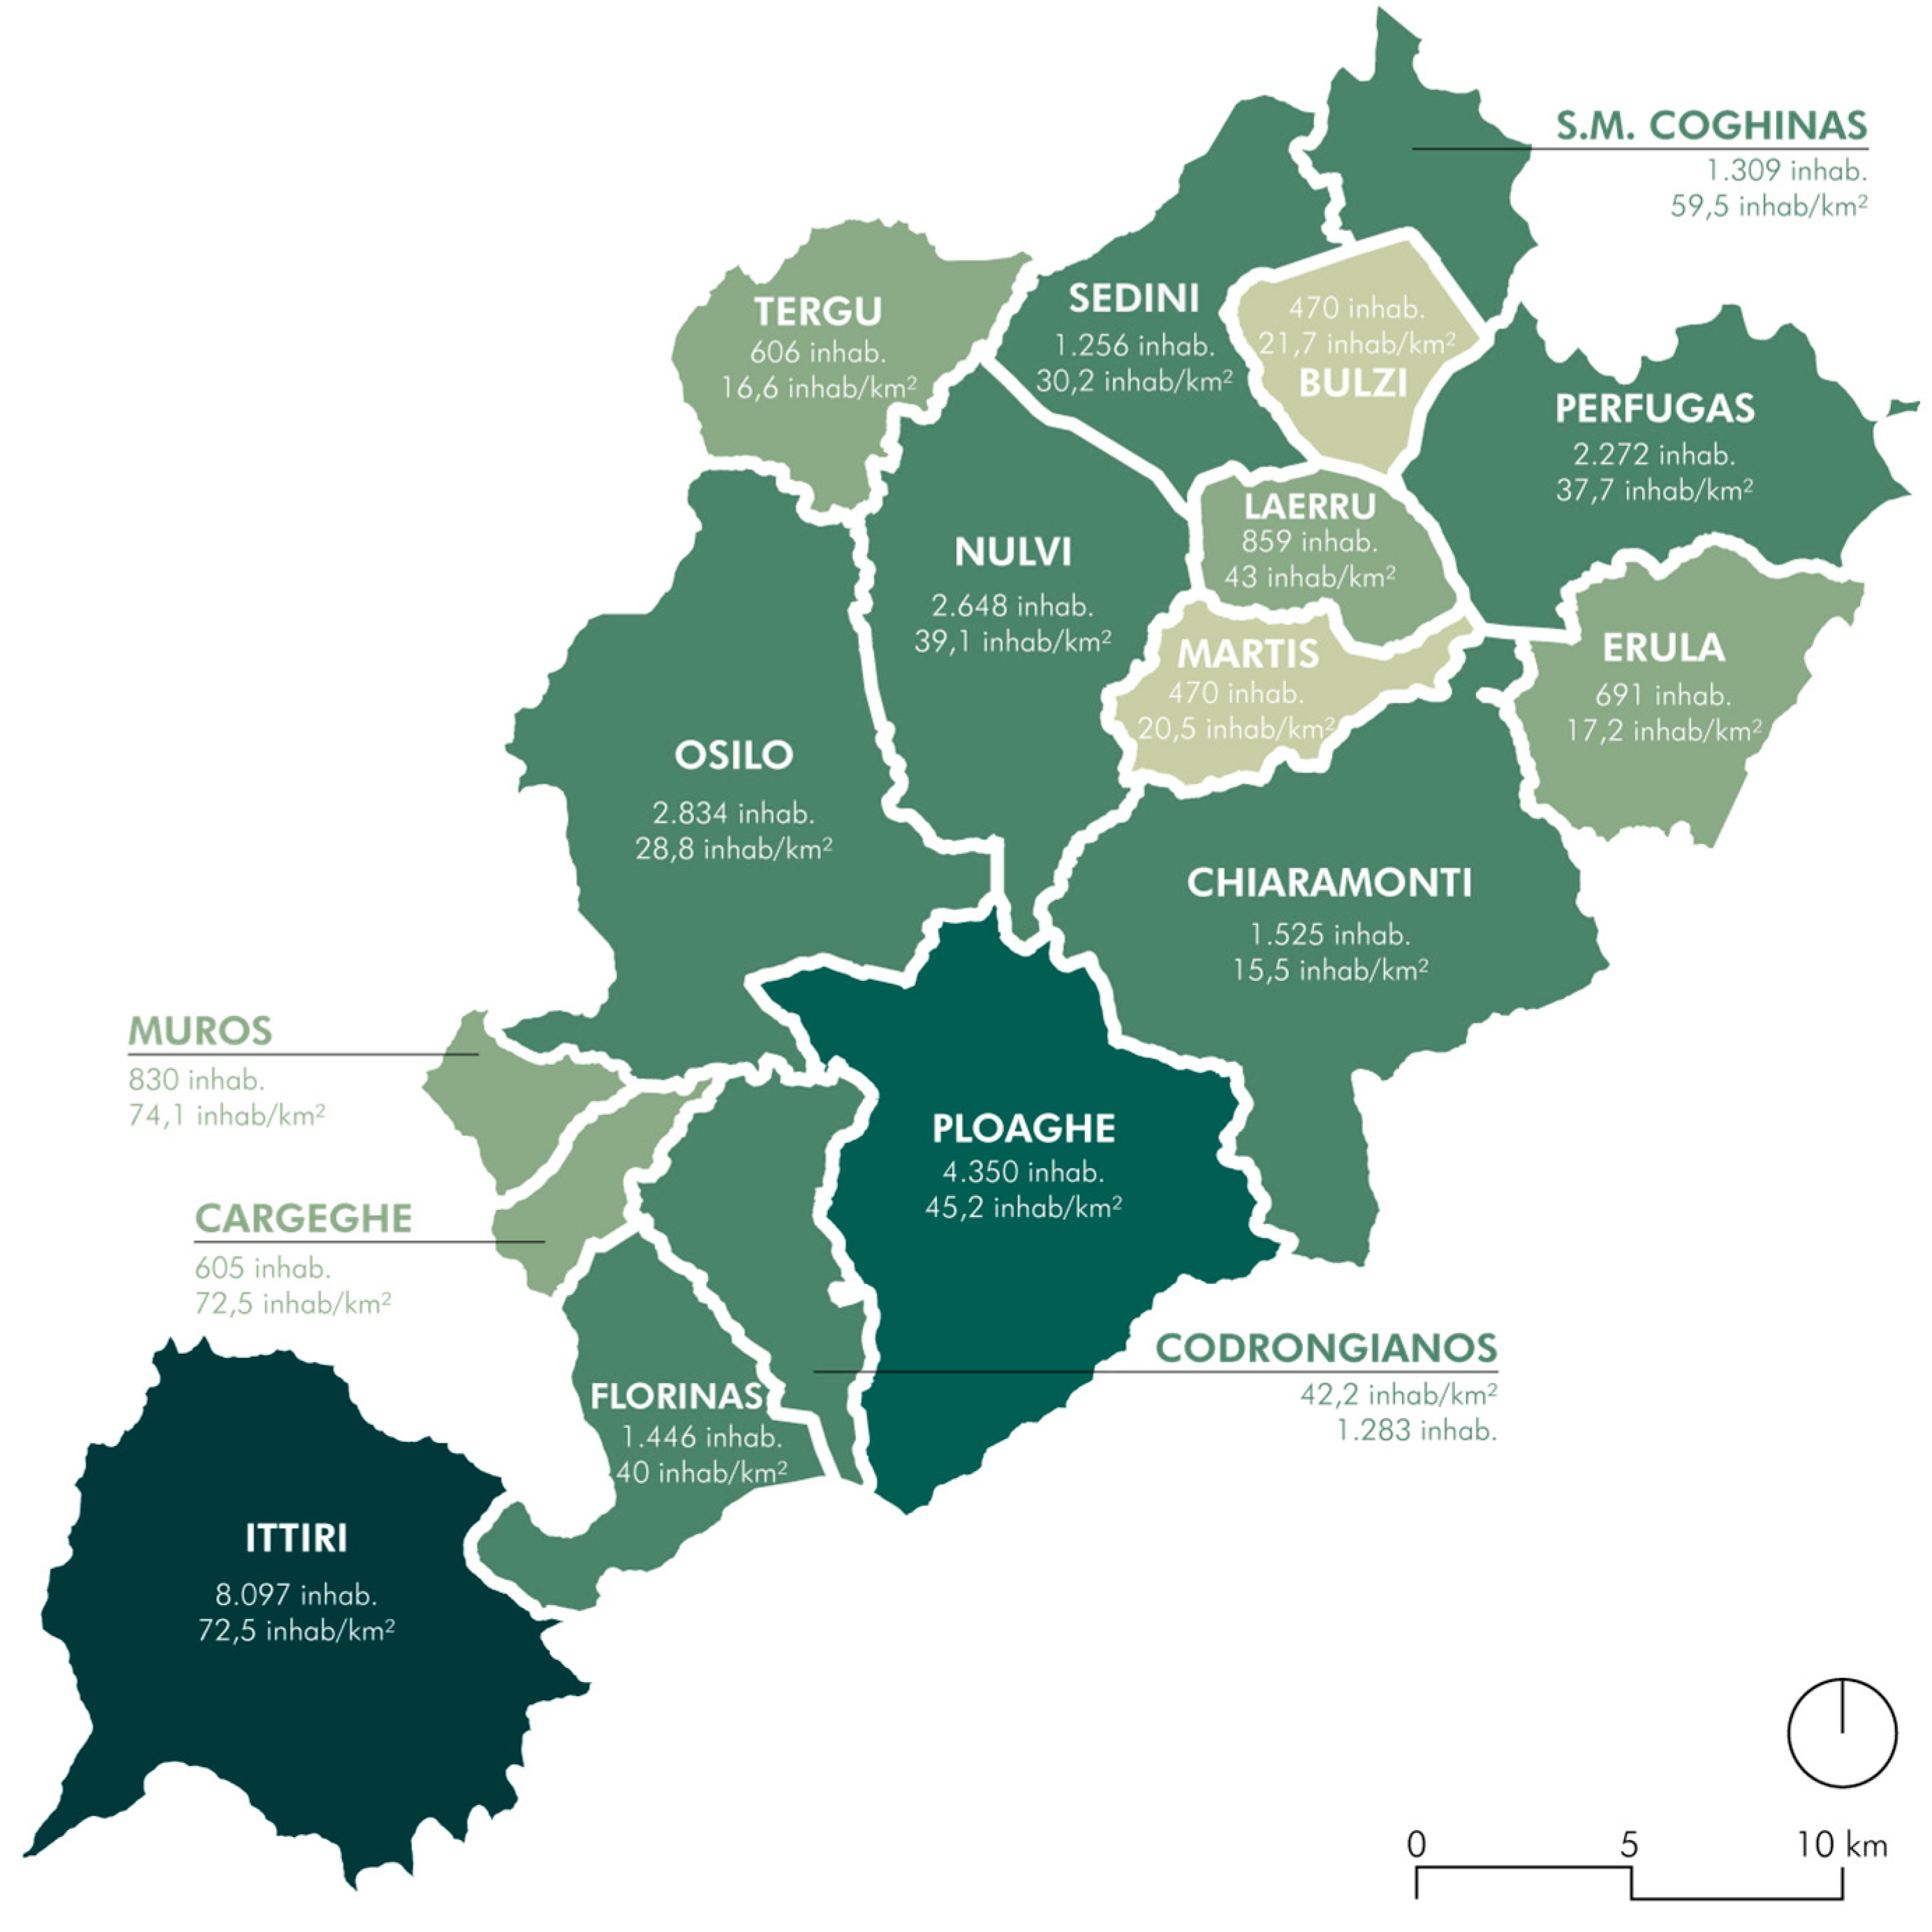
2. Study Area: The Anglona and Coros Region in North Sardinia

2.1. The Tourism Offer

It was decided to analyze the territory located in the center-north of the Sardinia region (Italy), which does not have any sea views and at the same time is not considered an inland area since it is close to strategic points, such as the city of Sassari, the airport of Alghero and the port of Porto Torres. Consequently, the area cannot benefit from the policies of the inner areas SNAI (Strategia Nazionale Aree Interne) [8]. There are currently two SNAI areas in Sardinia: the Unione dei Comuni dell’Alta Marmilla and the Comunità Montana del Gennargentu Mandrolisai, both located in the center of the region; in this sense, the application illustrated in this paper could also be in support of the process of declaring the areas examined as SNAI areas.
This makes it an area that, despite its high architectural and landscape value, is currently little developed and known. Given these characteristics, there is an obvious urgency to initiate processes of promotion and enhancement of the territory, to date, weak, but which can make use of regional directives and territorial plans for the development of areas considered marginal, such as the programs “Strategic Plan for Tourism Development and Marketing of Sardinia 2018–2021”, “RESET 2022–2023” [9] tourism project of the Province of Sassari, “AnCoRA Project 2023–2025” [10] of the GAL Anglona Coros.
The analysis began with the municipality of Osilo, which possesses a considerable artistic heritage (composed of traditional Sardinian material and immaterial heritage, linked to rocky, rural, nuragic and religious architecture and traditions) and the morphology of its territory gives the area some interesting features (the presence of several cliffs, the Valle dei Mulini, and the mountainous relief on which the town of Osilo itself stands, which allows one to observe the surrounding valley as far as the Gulf of Asinara). Its situation is also unique from the point of view of administrative arrangements: it is not part of the North Sardinia Metropolitan Network, to which many neighboring municipalities have joined, such as Sassari, the most important center in North Sardinia and leader of the network, from which Osilo is only 15 km away. The municipalities of Sorso (20 km away), Porto Torres (whose port is 35 km away), and Alghero (whose airport is only 45 km away) have also joined the network. This, in fact, sometimes creates factors of complexity in supra-local decision-making processes.
Obviously, the municipality of Osilo alone does not constitute a sufficient element of attraction for tourists, especially foreign ones, who decide to spend several days in the territory of North Sardinia, although it certainly constitutes a valid starting and support point for visiting this territory. From this municipality of less than three thousand inhabitants, the analysis has been extended to several surrounding municipalities, seventeen to be precise, located within the Province of Sassari and constituting the ancient regions of Anglona and Coros and currently included in the GAL Anglona Coros.
The “Gruppo Azione Locale” (GAL) is one of the 17 GALs in the Sardinian territory that have been financed by the 2007–2013 Rural Development Programme [11], thanks to the European Agricultural Fund for Rural Development (EAFRD) [12]. The GAL Anglona-Coros aims to implement an economic, social and cultural development strategy in the area in question with tasks and purposes dictated by European regulations, through the preparation and implementation of Action Plans (PdA). The municipalities that are part of this area are: Bulzi, Cargeghe, Chiaramonti, Codrongianos, Erula, Florinas, Ittiri, Laerru, Martis, Muros, Nulvi, Osilo, Perfugas, Ploaghe, Santa Maria Coghinas and Tergu (Figure 1).
The territory identified can also be considered to be on the border between two Sardinian sub-regions: Logudoro (which coincides largely with the municipality of Sassari) and Gallura (which coincides with the old province of Olbia-Tempio). This puts this area in a strategical position as it could attract tourist flows from the north-eastern part of Sardinia, which is particularly visited during the summer months. Moreover, one of the particularities of this territory is that it is predominantly hilly and at different panoramic points one can see the Gulf of Asinara and the coast of Bonifacio in Corsica.
The territories of Anglona and Coros are predominantly hilly, with small plateaus of volcanic or calcareous nature lying on a tuffaceous base. The average altitude of the inhabited centers varies between 21 m above sea level in Santa Maria Coghinas and 615 m in Osilo; the total territorial extension is 1041 sq. km. Overall, this is an inner area with predominantly rural characteristics, a landscape configuration diffusely shaped by agricultural crops, and a human settlement with a wide mesh and low population density, with an economy predominantly based on the primary sector and an extremely fragmented entrepreneurial sector. The geomorphology of the area is characterized by the Oligo-Miocene volcanic complex, which occupies almost the entire territory. The morphology of the terrain changes from almost flat or slightly undulating areas, intersected by a dense hydrographic network and destined for agricultural crops and grazing, to those that are rugged and criss-crossed by broad stretches of rocky outcrops, often destined for woodland or scrubland (Figure 2) [14].
Beyond the focus on certain territorial areas made in the research presented here, as well as the degree of notoriety and recognizability of the punctual elements, much of the potential of the area’s environmental and cultural elements still remains unexpressed due to the frequent constraints of accessibility and usability that characterize the potential attractors, as well as a systemic vision in the valorization processes that is struggling to produce the hoped-for effects on the economic and employment front. As a result, the area as a whole suffers from an endemic process of depopulation, suffice it to say that in 2011 the inhabitants of the Anglona-Coros GAL numbered 35,529, while ten years later, in 2021, they were 31,081 (−12.52%).
The GAL’s population currently stands at 31,551, Ittiri being the town with the most inhabitants (8097), while Bulzi is the municipality with the fewest (470 inhabitants). The average density is around 39.8 inhabitants/km2, which is significantly lower than the regional (68 inhabitants/km2) and Italian (196 inhabitants/km2) average (Figure 3).
The employed population (about 38% of the total) works mainly in the tertiary and extra-commercial sector (43%), while about 11% works in the agricultural sector (within the Province of Sassari only 3% of the total population works in this sector). In general, the average individual annual income of the various municipalities is about €14,000, lower than the provincial (€16,665), regional (€18,364) and Italian (€33,798) average.
This synthesis of data confirms the report provided by the regional 2007–2013 “Programma di sviluppo rurale (PSR)” (Rural development program) that defines the GAL area as a “rural area with overall development problems” and places the territory in a state of demographic malaise (SMD) [15] among the most serious in the region; the situation of the municipality of Osilo is defined by the PSR as “very serious”, while that of Florinas, Laerru, Erula and Chiaramonti is “serious”.
This socio-economic situation does not allow a satisfactory valorization and protection of the cultural and landscape heritage, despite the great variety of assets that the territory offers.
Based on the assumption that an exact knowledge of the heritage of cultural assets (both architectural and landscape) is essential to make the most of an area, because an asset has economic value as a potential resource: “cultural heritage is no longer to be understood as a static heritage, rich only in ethical implications, but must necessarily be considered as a source of income and profit, therefore active and dynamic” [16] (p. 127). In particular, from an economic point of view, this has great importance for tourism activity, as it constitutes a possibility of development. Development is understood not only as economic growth but, above all, as an overall improvement in the quality of life of citizens, greater respect for the environment, and further wellbeing of the community.
The territory examined coincides with the territorial perimeter of the Anglona-Coros GAL: it possesses a significant historical-archaeological, cultural and identity heritage that stretches across different centuries and epochs (Figure 4), from the first Paleolithic settlements, through the Nuragic period, to the Early Middle Ages [17]. This area of Northern Sardinia is home to 70% of the Romanesque churches of the entire island [18], some of which are already included in a tour itinerary called “Romanesque Itinerary in Sardinia” [19] financed by the European Regional Development Fund INTERREG [20] and the Region of Sardinia. The territorial analysis reveals a relative abundance of cultural institutes in the territory, with a proposal articulated in ten realities, all under non-state management and mostly as museums, galleries or collections.
However, the territory also offers a varied range of landscape and natural assets, both areas for mere relaxation (with the presence of various parks and the natural thermal baths of Casteldoria), and areas with a greater sporting vocation thanks to the conformation of the territory and the natural presence of numerous cliffs and caves (there is the SIC site [21] Grotta de Su Coloru [22] in Laerru) [23]. However, the lack of adequate signage and signposting, as well as accessibility to the sites, is highlighted. This represents an obstacle to the enjoyment and valorisation of the assets.
Furthermore, there is a limited online presence of tourist sites and information, with only a few attractions having websites or information pages. Not even the GAL Anglona-Coros website has a section dedicated to the assets in the area. Online communication could improve the dissemination of information and the sharing of cultural content [24].
However, in terms of intangible heritage, the local food and wine offer should not be underestimated, as one of the most popular types of tourism at present is experiential and linked to traditional food. There are products with certified brands, such as Pecorino di Osilo and Carciofo spinoso di Sardegna, as well as vines for the production of Vermentino di Sardegna and Cannonau, and typical Sardinian honey. Additionally, there are businesses that produce local sweets and ravioli [25].

2.2. The Tourism Demand

Referring to the data collected in the document “Strategic Tourism-Territorial Marketing Plan for the creation of the Tourist Destination—Anglona Coros, Lands that Regenerate (2022–2025)”, developed within the framework of the AnCoRA Programme of the GAL Anglona-Coros, financed by the EAFRD, the type of tourist visiting the area was studied [26].
The survey was conducted by means of two separate questionnaires: one administered to guests of accommodation facilities and one to those who visited the cultural sites during the summer of 2022 (July–September). Both questionnaires were written in both Italian and English. Fourteen accommodation businesses and four associations responsible for the management of cultural sites participated in the project. The objective of this research is to outline the profile of tourists in order to understand their target audience for the development of new markets. Users were divided into visitors, i.e., those who visited one of the cultural sites, and guests, who stayed in one of the facilities within the GAL.
Initially, the geographical origin of each user was analyzed. In line with the trends of previous years, the majority of tourists in the area are Italian (74.42%), while about 25% come from abroad. In particular, guests come mainly from northern Italy, with regions such as Lombardy (33.75%), Emilia-Romagna and Tuscany (both 11.25%). Tourists from Sardinia account for 13.75%. With regard to foreign visitors, the majority come from Spain (24.24%), France (21.21%) and Germany (18.18%), data that are consistent with ISTAT (Istituto Nazionale di Statistica) information from previous years [27,28].
Generally speaking, the tourist visiting the GAL area, according to the Strategic Plan data, is between 26 and 55 years old, usually employed (78% of the total) with a medium-high education and has a highly specialized profession (39%). Their spending preference is around 50€. They mainly travel as a couple (53%) or with their family (32%) and the duration of their stay is on average more than a week (57%), but they usually sleep outside the GAL’s municipalities. Within the territory they mainly travel by car (73%).
Most tourists in the area indicated ‘going to the beach’ as their main interest (80%), followed immediately by visiting cultural sites (79%). Other relevant interests include walking and hiking in nature (59%), wine and food tasting (57%) and buying typical products (45%).
A further analysis was conducted by cross-referencing tourists’ preferences according to their origin and travel company. It was observed that visitors from France and Germany, in addition to enjoying the beach experience (about 20%), also show interest in cultural (15%) and gastronomic (15%) activities. On the other hand, those coming from the United Kingdom or the Netherlands seem to be more oriented towards relaxation (about 25%). In the case of tourists from Lombardy and Sardinia, they show an evenly distributed interest in different activities.

3. Literature Review: Techniques for Evaluating Preferences and Estimating “Non-Market” Goods

The issue of estimating market-free goods and assessing the preferences of the related demand remain an established line of research with recent methodological developments.
The experiment conducted on the case study falls within this theoretical-methodological framework, as it aims to investigate utility curves and the reconstruction of cultural consumption preferences of visitors to Sardinia in the absence of explicit markets.
In the literature, it is well known that the methods of valuation and estimation of cultural and landscape assets are based on the simulation of the demand curve of hypothetical markets, on the estimation of consumer surplus and on the detection of the WTP (Willingness to Pay) of consumers [29] (users of Cultural Heritage) in order to preserve and improve the utility that the community can draw from such public assets. The estimation, as is well known, refers to the Total Economic Value (TEV), which can be identified through the processes of consumer choice and preference, declined into revealed and affirmed preferences. There are numerous studies dealing with applications of revealed preference methods (hedonic price method, travel cost method, compensation cost method, discrete choice model, etc.), as well as case studies with the simulation of affirmed preference methods (contingent valuation method, Delphi Technique and Conjoint Analysis) [30].
In particular, the term Conjoint Analysis (CA), coined by Green P.E. [31], is used to indicate methodologies that have long been widespread in the literature of marketing and transport economics, but not only, aimed at analyzing multi-attribute scenarios.
At present, Conjoint Analysis has not yet found particular and sufficient application in the field of cultural heritage, and has only recently begun to be used in the field of landscape [32,33]. In fact, given the multi-attribute nature of cultural assets, it lends itself very well to carrying out an estimative analysis of such assets. Davies [34] presents a classification of the services rendered by cultural institutions and defines which attributes are characteristic for the cultural offer and on which one can express a preference, such as opening hours or better additional services. This classification offers support for the definition of cultural property as a multi-attribute resource.
The idea behind this methodology is that each user develops preferences towards public goods and that these, through simulated markets, can be translated into monetary measures of value thanks to the Hicksian notion of economic value [35].
In the literature, the term CA encompasses a number of techniques that differ from each other, but share several characteristics:
  • possessing the ability to manage and analyze contexts in which the good and its changes from the status quo are multi-dimensional. This implies that one can assess the different WTP referring to individual attributes and consequently rank them according to the importance given to them;
  • avoid the explicit question of willingness to pay, but price is entered as a characteristic of the good (cost attribute) and varies according to the different scenarios proposed;
  • measuring each type of use and non-use value.
Three variants of CA analysis exist in the literature: Contingent Ranking (CR), Contingent Rating and Paired comparison.
CR consists of users ranking several alternatives, which differ in terms of characteristics and costs. In this way, each user will have a ranking from the most preferred alternative down to the least preferred alternative, which leads to more information on preferences but also to a higher risk of bias.
In the Contingent Rating method, respondents have to rank the alternatives according to a numerical or semantic scale (e.g., low-medium-high levels). However, the assigned score is not an unambiguous measure of utility in the economic sense, but rather an entirely subjective preference since the weight of this score has a different value for each individual.
The Paired Comparison technique requires respondents to express their preference between two alternatives, indicating the weight of this preference on a semantic or numerical scale.
Lastly, a method, which can be considered an evolution of CA and which is gaining increasing interest for its potential in the field of environmental asset valuations, is the Choice Experiment (CE) technique. This involves the user indicating which product they prefer within a set of products with different attributes (Most Preferred Choice).
In addition, it is possible to reduce some of the potential errors typical of previous techniques, collect more information for each user, perform internal consistency tests of the responses obtained, and a “status quo” choice must be included in each choice set.
The methodological foundations of this technique can be found in the Random Utility Model (RUM). Although the other RUM models, such as the Contingent Valuation (CV), have reached a fair level of theoretical-practical knowledge, this is not yet the case for the CE model, as experimentation with this method in relation to cultural and landscape heritage is still in its early applications.
This technique proposes a disaggregation of the good that allows one to examine the differences between its various constituent attributes, and it seems clear how this disaggregation allows one to grasp the trade-offs that the consumer is called upon to face at the moment of choice and, if price is among the attributes considered, this technique can be adopted to calculate the Marginal Willingness to Pay (WTP).
In addition, the inclusion among the other attributes of the “cost” element allows the WTP not to be detected through a direct question (as happens in CV), but rather in an indirect and implicit manner through the use of this attribute.
The main steps of the CA method are: definition of the policy scenario, definition of the attributes and their levels, choice of the preference analysis model, combination of choice sets, questionnaire structuring and presentation to users, econometric analysis, estimation results (Figure 5).
Hereafter, we delineate the specific steps converging within the scientific discourse (refer to Section 4 for practical application aspects):
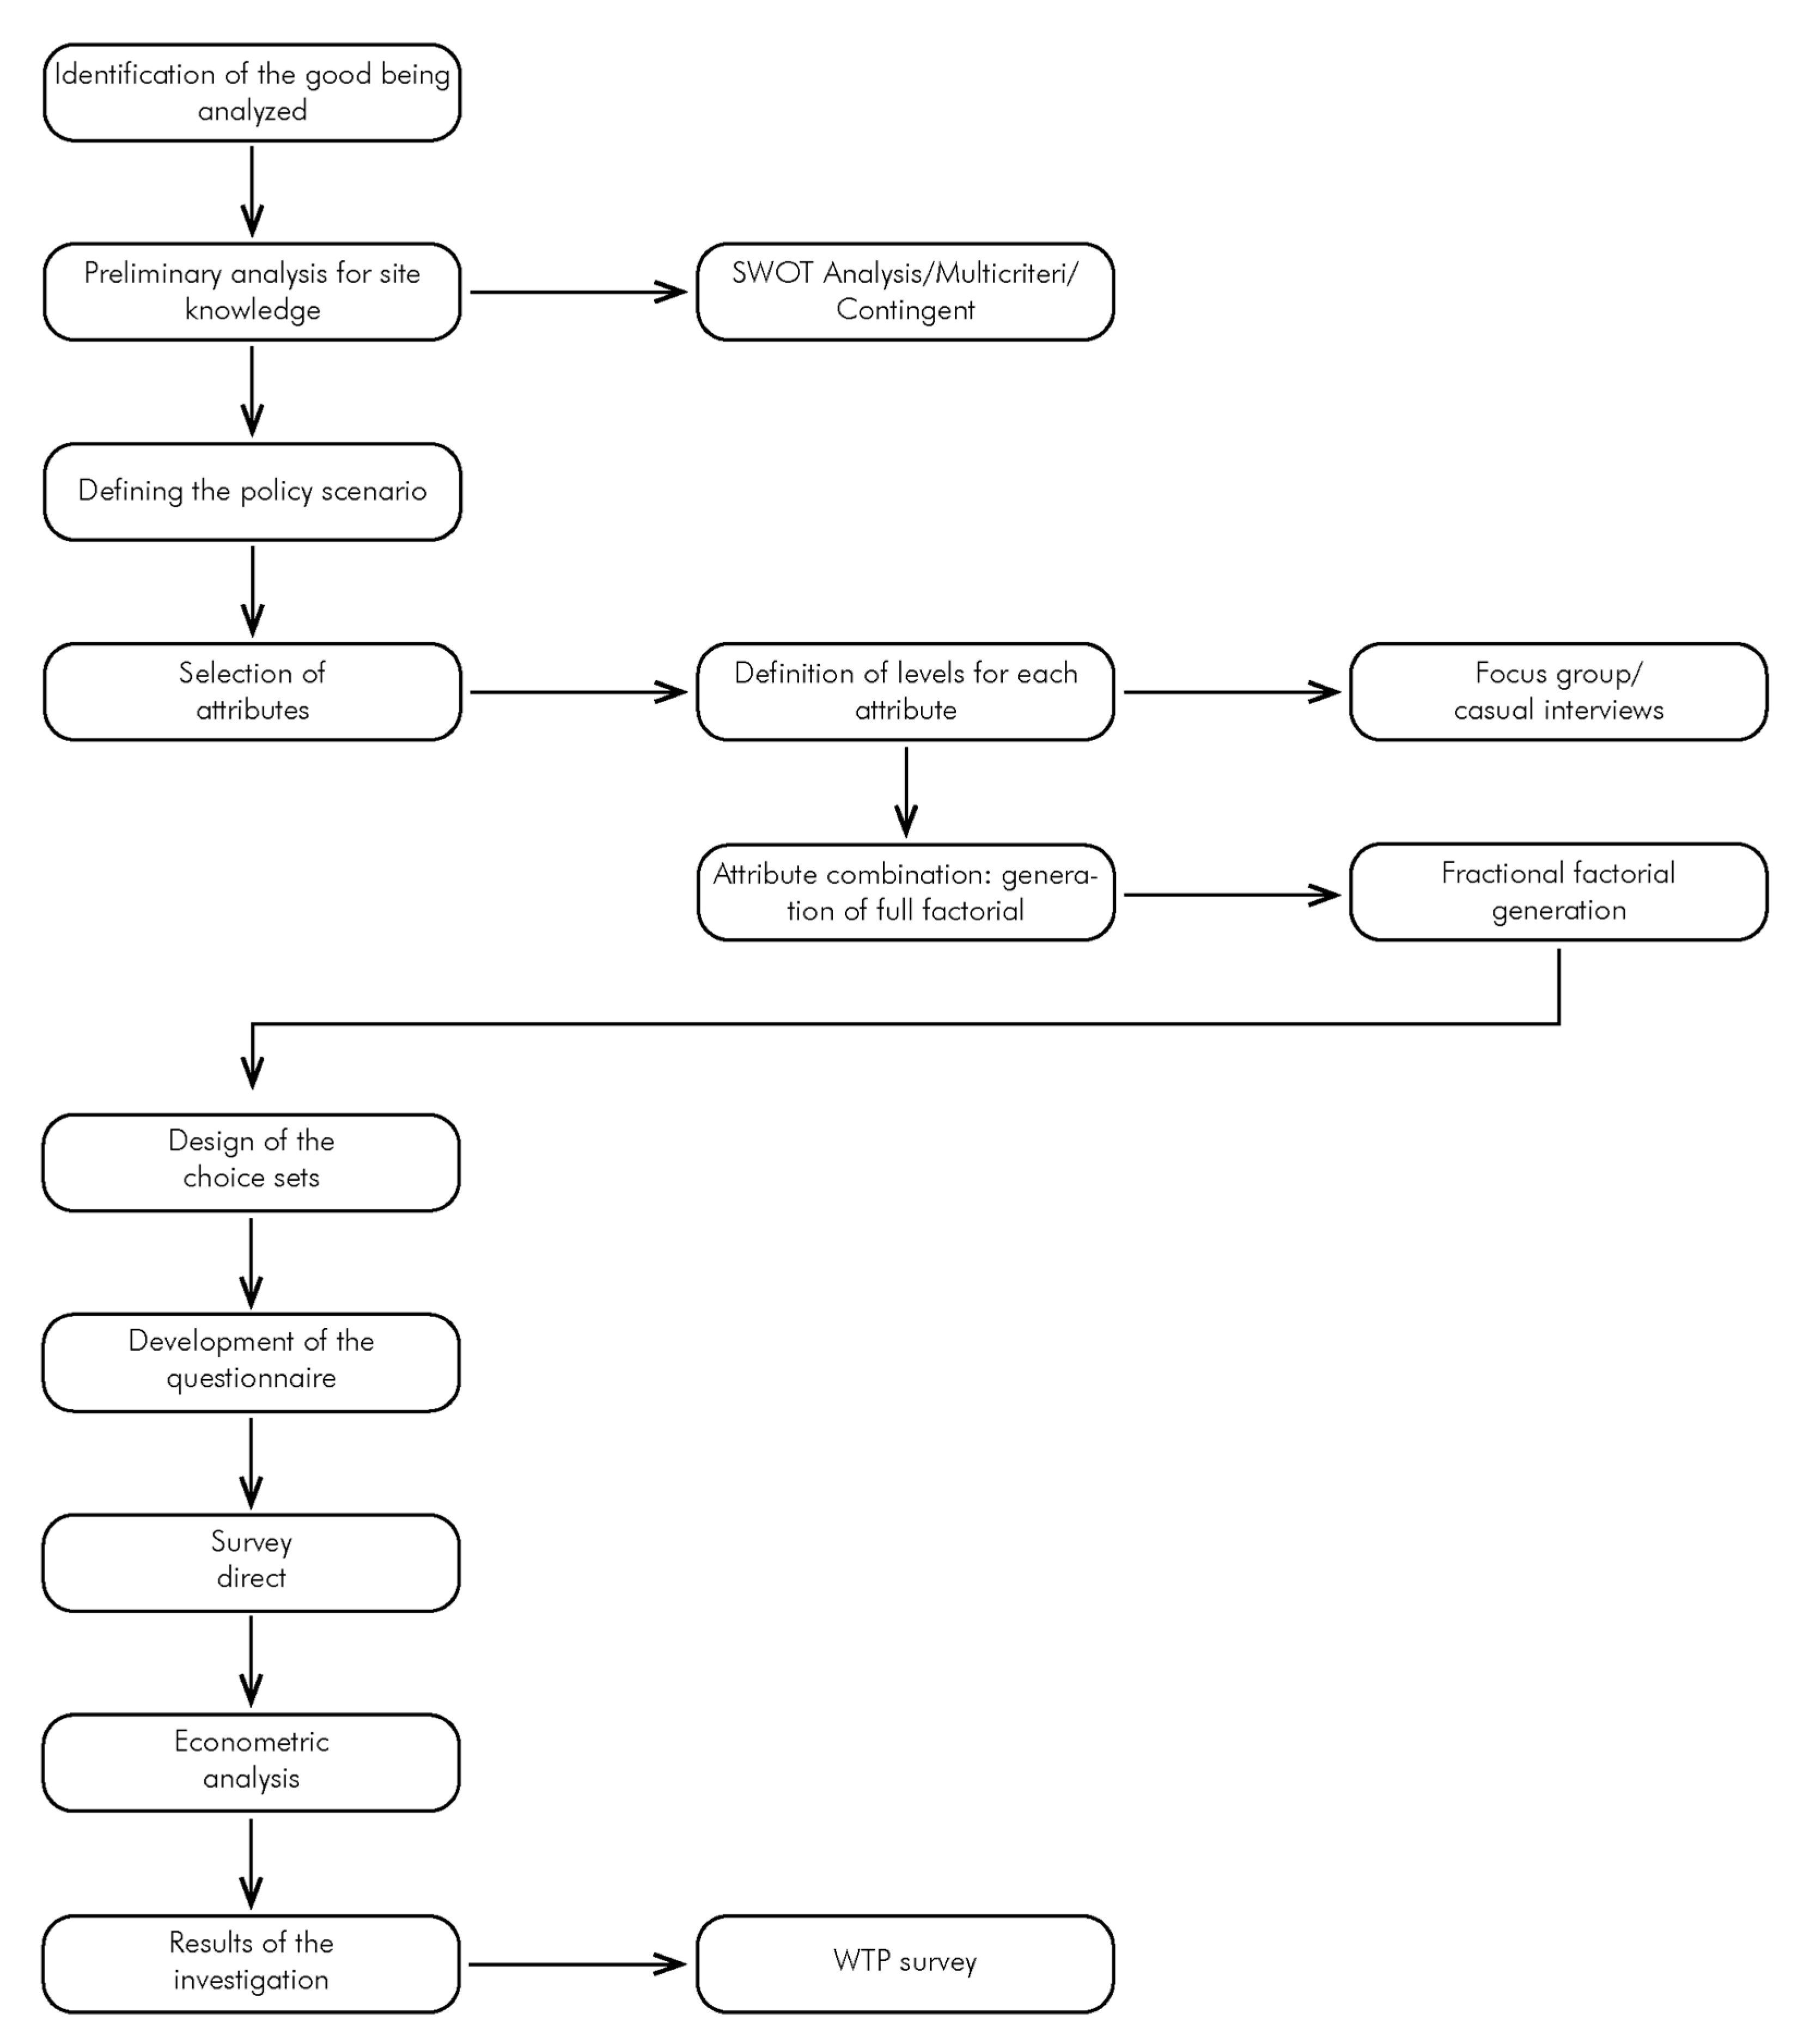
  • Policy scenario: it must be based on and defined by the status quo scenario, this may not only represent the current situation, but also what will emerge if no action is taken on the current situation. This last aspect is very useful when applying the method to cultural or landscape assets, as the status quo situation may represent the absence of restoration and enhancement interventions, or only the presence of ordinary maintenance of the asset.
  • Attribute and level selection: this phase is the core of CA techniques. In fact, one has to choose those attributes that are relevant and significant for the user and the researcher in the definition of the good, then one has to choose the levels proper to each attribute, these must present substantial differences between them so as to be easily understood by the respondent. The levels can be represented as an alternative to the status quo, this type has advantages in structuring the scenario and should therefore be used more. Preliminary investigative tools such as informal interviews or focus groups are useful at this stage, as they allow one to understand whether the chosen attributes and levels are ambiguous or not.
  • Preference analysis model: all possible combinations of attributes with their levels will make up the so-called full factorial, e.g., with two attributes defined on three levels the full factorial will be equal to 9, which correspond to the possible combinations. Obviously, as the number of attributes and, consequently, the number of levels increases, the number of combinations will be higher and higher, which is why it will be complicated for the respondent to administer the questionnaire. According to the literature, there are several possibilities regarding the maximum number of choices to be presented to the user: Adamowicz and Boxail propose a number ranging from 1 to 32 choices [36]; Hanley, Wright and Adamowicz suggest a maximum of eight choices [37]; Kroes and Sheldon suggest limiting the choices to between 9 and 16 [38]. Thus, given the difficulty in presenting too many choices, two methods are used to reduce complexity: the fractional factorial which represents a selection of the full factorial, which, obviously, the smaller it is, the lesser the model’s ability to understand certain interactions between attributes; and the blocking method which consists of segmenting the full factorial into blocks of combinations [39]. The first method, fractional factorial, is the most widely used since it allows unrealistic combinations to be excluded.
  • Combination of the choice sets: involves the creation of the different choice sets, in each of which the previously defined ‘status quo’ option must be present, as it allows the measurement of the variation in well-being and the marginal WTP. Furthermore, such a large number of alternatives must be chosen so as not to incur distortions during the decision-making process; this can occur when the alternatives are so numerous that “tiredness” and “repetitiveness” in responses occur. The presentation of alternatives to respondents takes place on random processing of the profiles (or cards) obtained. These may be labeled or unlabeled. The former, as opposed to the latter, present a concise description of the policy scenario.
  • The structure of the questionnaire: it is presented by interview according to the usual methods. The typology chosen varies according to the persons interviewed and the resources present, but it is preferable to conduct direct interviews on site so as to accompany the interviewees throughout the questionnaire, especially during the first choices. The questionnaire is composed of three different sections: the first includes an introductory part where the reason and purpose of the research will be explained, but also the scenario to which it refers and possible variations; the second part consists of the presentation of the various choice sets and the users’ choice; finally, the third part is used to obtain information on the respondent’s socio-economic situation, thus with questions concerning the level of education, income and age. As far as the number of respondents is concerned, one can rely on McCallum’s “rule of thumb” [40], which states that at least 50 respondents should be assigned to each choice set. Or, according to Roscelli [41]:
    (n × t × a)/c > 500.
    (n: sample size; t: number of choice collected for each respondent; a: the number of scenarios (excluding the status quo); c: the number of attributes to be estimated).
  • Econometric analysis: once the answers have been obtained, the results are analyzed. “The reference theoretical model implies that for each individual i, a given level of utility is associated with each alternative j. Alternative j will be chosen if and only if the relative utility associated with it is, in the set of choices, the higher one. This utility may depend both on the characteristics (attributes) of the good and on the socio-economic characteristics of individuals” [39] (p. 137). Hanemann [42] then specifies the indirect utility function composed of an observable element (V) and an unobservable, stochastic one (ε) by the researcher and is therefore considered as random. This function is expressed according to the following formula:
    Uij = Vij + εij
    the need to include the stochastic element leads to the formation of a probabilistic reference structure, hence the “possibility that the respondent prefers option g to each of alternatives h can in fact be expressed as the probability that the utility associated with option g exceeds that associated with option h”, thus:
    P[Uig > Uih) ∀ h ≠ g] = P[(x′ igβ − x′ ihβ) > (εih − εig)]
    Traditionally, the data collected in choice experiments are analyzed using the McFadden Multinomial Logit (MNL) model [43], in which each ε is assumed to be Independently and Identically Distributed (IID), according to a variable called Gumbel with zero mean and parameter θ. The β coefficients of the model are used to understand how respondents evaluate different attributes and, when one of the attributes is monetary, the trade off expresses the measure of the marginal value of the attribute:
    −β non-market attribute/β monetary attribute = marginal WTP for the attribute
    (β non-market attribute: are the β coefficients showing the effect each attribute has on the probability of choice; β monetary attribute: coefficient of the market attribute, this is expected to always be negative as in fact users rarely choose the more expensive alternatives).

4. Materials and Methods

The Conjoint Analysis methodology has the advantage that it can be applied to both market and nonmarket goods, in fact, the so-called “non-market” goods are those that can most benefit from this methodology due to its inherent characteristic of disgregating the good [44], in this case the GAL territory, into different characteristics (attributes), which allows for the expansion of the elements of supply and therefore attractive and preferred by demand (the intended users) and the time frame in which this can be visited.
Four attributes were chosen, each divided into three levels that would go to represent different aspects of the attribute itself (Table 1). The four attributes were chosen to represent all the offerings and potentials that the area under consideration encompasses, not limited to the enhancement and enjoyment of mere cultural heritage understood as architecture, but rather other non-tangible cultural aspects as well (Figure 6).
Regarding the cost attribute, also an essential feature if the CA model is used, it was decided to design a preliminary questionnaire to be administered to a limited number of people to understand their willingness to pay (WTP) for each proposed scenario. The pre-test is an exploratory survey aimed at assessing ex ante, which means the stage before the questionnaire is issued, the preferences of the subjects and to refine the final questionnaire. For this reason, it is preparatory to the actual questionnaire. In this case, those who answered the questions were chosen to represent the sample for the final questionnaire. More specifically, 15 people were interviewed who reside within the GAL territory, 11 who reside in the province of Sassari, two who reside in Sardinia but outside the province of Sassari, and two who reside in another Italian region.
In addition, the use of the pre-test is useful in understanding attitudes and how the questionnaire itself is received by users; therefore, the questionnaire was presented in person or via telephone so as to better understand respondents’ reactions. In addition to this, questions were included regarding their knowledge of the area and their tourist habits, as well as socio-economic questions. In order to find out each user’s WTP, it was decided to use a multiple-choice question (with three different price ranges and an “Other” option) so as not to risk getting biased responses and also to understand the level of liking (one to five) of each scenario.
Once the pre-test results were analyzed, assessing their robustness and then understanding the various critical issues and especially the willingness to pay that each person assigned to each of the scenarios, we proceeded with the use of the statistical software IBM SPSS 27 [45].
Fractional factorial was used as it allows the exclusion of unrealistic combinations. Accordingly, attributes with corresponding levels were entered within the program. Once all the data were entered, it was necessary to start the simulation, and the software independently proceeded to create the cards (Table 2).
The questionnaire was distributed exclusively online, through the most widely used web and social platforms. A total of 600 responses were collected, including 301 from residents (people who live in one of the 17 GAL’s municipality) and 299 from visitors. If we consider Bennet’s “rule of thumb”, which states that at least 50 respondents should be assigned to each choice set, we will see that the minimum needed in this case was 200 respondents, a number far exceeded not only in the total but also with regard to the two categories of people surveyed, namely visitors and residents. If instead we consider Roscelli’s formula, we will have:
(600 × 4 × 8)/5 > 500
where 600 is the sample number, 4 is the number of choices collected for each respondent, 8 is the number of scenarios except the status quo, and finally 5 is the number of attributes to be estimated. As can be seen, even in this case the number of respondents, whether visitors or residents, far exceeds the minimum sample number.

5. Results

5.1. Socio-Economic Survey

The table below (Table 3) shows the answers to the questions regarding the social and economic status of each respondent, in order to make a comparison between the profile (and representation of the sample) with data on the reference population. The questions asked are those regarding gender, age, household, occupation, level of education, and finally income. The latter two questions were not answered by some respondents.
Therefore, in general, the profile of the respondent corresponds to a person who is between 36 and 50 years old (151 responses, 26%), his household consists of four people (199 responses, 34%), and his level of education coincides with high school diploma (268 responses, 47%). He works as an employee (240 responses, 41%) and has a per capita annual income between 10,000€ and 26,000€ (220 responses, 40%). These data collected through the questionnaire submission were in line with the data reported by ISTAT.

5.2. Econometric Analysis

To understand which of the scenarios and which of the attributes respondents preferred, SPSS 27 software was again used. The theoretical reference model implies that for each individual i, a given level of utility is associated with each alternative j. Alternative j will be chosen if and only if the relative utility associated with it is, in the set of choices, the higher one. This utility may depend both on the characteristics (attributes) of the good and on the socioeconomic characteristics of individuals [35].
In this study, the Random Utility Model (RUM) is used to estimate the preference values of individual attributes and levels, “the starting assumption being that the respondent’s choice among different alternatives is derived directly from his utility function” [39] (p. 175).
This utility function is expressed according to the following formula:
Vij = V (xij, β) + εij
(i: i-th individual; j: j-th alternative; x: vector of respondent attributes and characteristics; ε: error term).
Assuming a linear combination of the factors:
Vij = β0 + xijβ1 + (y1 − Cj) β2 + εij
(y: income; C: monetary outlay relative to preferred alternative k).
We then assume that the respondent chooses the preferred scenario (alternative k) based on the highest level of utility, the formula expressing the probability of choice is:
Pr(k) = Pr(Vk > Vj) ∀ j ≠ k
If we substitute the values and isolate the error term we will have:
Pr(k) = Pr [εi − εk) < (xk − xj) β1 − (Ck − Cj) β2] ∀ j ≠ k
This shows how the probability of one alternative over another is given by the difference in levels and attributes and not by their similarity.
Thus, according to McFadden (1974), the probability of choosing an alternative k over an alternative j is:
Pri = expVij/expVij + expVik
This equation constitutes the maximum likelihood contribution of the conditional logit model, which forms the formula:
log L = Σ_(i = 1) ^ n Σ_(k = 1) ^ K[yik.logPr(k)]
(yik: binary variable; 1: chosen alternative; 0: not chosen alternative).
The analysis performed by the software was based on the previously created database, termed “orthogonal design”, which created the choice-sets proposed in the questionnaire and on a database containing the responses of each respondent.
It was decided to divide the responses into two distinct clusters: one represented by residents and one by visitors to the GAL.
The database created with the users’ responses consists of a variable called ID, which is the identity of each individual respondent, and nine other variables each indicating the corresponding scenario. In line with the RUM model, each response was assigned a value: 0 if the scenario was not chosen and 1 if the scenario was the preferred one.
The table below (Table 4) covers the utility of each attribute and level and accordingly shows the β coefficient and standard error of each.
The level with the highest value is the one most preferred by users. In the case of both residents (+0.143) and visitors (+0.244), this is configured with the level “Experience in a local production activity”, followed then by the level “Enhancement of traditional dishes” for residents, and “Outdoor sports activities” for visitors. In contrast, the least preferred levels for residents of GAL municipalities are the “Medieval” level (−0.161) and the “Nuragic” level (−0.112), while for tourists the least preferred level is “Electric car” (−0.03). It is interesting to note that for residents, the two most preferred levels are within the attribute Enogastronomy, while the two least preferred belong to the attribute Cultural Heritage, showing how residents do not appreciate, or even in some cases do not know, the assets within their area, in line with the policies of weak promotion of cultural heritage carried out over the years. Generally speaking, the only attributes that have consistently positive β coefficients in both clusters are “Food and Wine” and “Sports, fitness and green”. On the other hand, with regard to the attribute “Cost”, we note that in the residents’ table it is not only always positive, a situation that rarely happens, but rather that the more the cost increases, the more the β coefficient increases. In contrast, the attribute in the table of tourists is always negative and shows a diametrically opposite trend to that of residents.
Table 5 shows the utility values for each scenario defined through the β coefficient of each level and the constant, which in this case is 0.21 for visitors and 0.378 for residents. Both residents and tourists prefer scenario 6, which includes the conservation and protection of cultural heritage in the state of fact, outdoor sports activities, experiences within a local business, and the use of an electric car to move within the area for a willingness to pay that could be described as average (€30 to €50). The least preferred scenario for tourists is the one that corresponds to the state of affairs (number 7 in the table below) where the value is 0.317; on the other hand, for GAL residents it is scenario number 8 (0.316), which corresponded to the Medieval itinerary, preservation of green areas, enhancement of traditional dishes, and the use of an electric car to get around.

5.3. Willingness to Pay

Measuring WTP is the most important feature of the CA method because it makes it possible to decompose and evaluate attributes related to use values and attributes related to non-use values (Table 6). As can be seen from the results, in line with the β coefficients previously illustrated, both visitors and residents are willing to pay more for the experience in a local activity and for practicing outdoor sports activities; in the former case, the highest marginal WTP ever is applied: 17.81€ for visitors and 6.19€ for residents. The two clusters are unwilling to pay for the Medieval cultural itinerary; even the residents show a WTP of −7.27€, the lowest value among all willingness to pay considered in both clusters.

5.4. Relationship between Choice and Socioeconomic Context

As a final analysis, it was decided to study the correlation between scenario preferences and the socioeconomic data collected in order to understand whether the social and economic situation of the respondent could influence the choice of scenario. In this case, the responses analyzed are not 600, as in the econometric analysis, but rather 547 because some respondents did not answer questions about their education, profession, and income, effectively making it impossible to correlate their choices with their socioeconomic situation. The decision was made due to the mandatory nature of questions concerning scenario preferences (an essential characteristic of CA), as opposed to those related to socio-demographic data, in consideration of privacy concerns. This resulted in a disparity within the sample between the two conducted analyzes, without, however, implying a direct opposition between the two.
Again, the results were processed using the software IBM SPSS 27.
The categories analyzed are “Level of Education” (Table 7), “Occupation” (Table 8), and “Income” (Table 9), as these were considered most influential in choosing the proposed scenarios.
In this table, the WTP shows that the “High school” group is the one willing to spend the most (€29.9) to perform a sports activity, but also those willing to pay the least for the Medieval itinerary (−€12.7). In contrast, those in the “PhD” group are always willing to pay in positive contribution for each attribute, albeit not large sums. The other categories behave consistently with each other and with the previously mentioned results; therefore they are willing to pay for a trade off of the attributes “Sport, fitness and green” and for “Food and Wine”.
This table shows the WTP in concordance with the utility estimate values. The level for which the categories “Student” and “Homemaker” are most willing to pay is “Places for Sports Activities”. While the categories “Retiree”, “Freelancer”, “Unemployed” and “Employee” prefer to pay more for the level “Experience in a local business” belonging to the attribute “Food and Wine”. In contrast, the “Homemaker”, “Employee” and “Retiree” groups show their lowest WTP in the “Use of electric car” level, while the rest in the “Enhancement of the Medieval era itinerary” level.
The table shown here shows a peculiar trend regarding the “Less than 10,000€” category, in that those who belong to this group are willing to spend positively on the levels of preservation and protection of the state of Cultural Heritage and on the enhancement of the Nuragic route; however, they are not willing to pay for the enhancement of the medieval route. This category shows the highest WTP (38.2€ for the experience in a local activity) and the lowest WTP (−13.8€ for the enhancement of the medieval itinerary). In general, the “less than 10,000€” and “26,000–55,000€” categories (which correspond to 71% of the total) show consistently positive trends, except for the “Transportation” attribute.
Generally speaking, a pattern can be seen in each of the clusters analyzed: the attribute “Cultural Heritage” is negative as is “Transportation” while the attributes “Sports, fitness and green” and “Food and Wine” are positive, “Cost”, on the other hand, being the attribute with the most swinging values.
Within each attribute, the levels that were more preferred than the others were then identified, and again the response seemed to be mostly unanimous (Table 10).
The analyzes of β coefficients and WTP reported the levels in the table above as preferred, consequently the most preferred scenarios will coincide with those possessing these levels.
Thus, it can be said that regardless of the category analyzed, the most preferred scenario is number 6, followed by number 4; this is because both scenarios possess within them three levels that were found to be most preferred, like “Enhancement of places for sports activities” and “Experience inside a local business” (both present in scenario 6). On the contrary, we do not see the same homogeneity of response regarding the least preferred scenario as each cluster expressed discordant opinions; but the least appreciated levels, in general, are “Use of an electric car” (in stark contrast to the pre-test responses) and “Enhancement of the Medieval era itinerary”, although with some exceptions to the average not considered significant enough with respect to the sample size. Furthermore, it can be said that there is an intention present in all categories under consideration to spend on a trade off from the current situation to a different scenario. In other words, there is an interest on the part of the user in an area that is currently little known but could be a destination for visitors if enhanced for its systems, landscape validity, and intangible heritage. The scenario presented here as the prevailing one, however, remains open to modifications as it serves as a foundational framework, developed on robust statistical elements, for the future strategies that decision-makers intend to implement in this territory.

6. Discussion

In light of the results illustrated in § 5, we believe it is useful to focus attention on how our application fits into and brings further elements of discussion into the current debate on the relationships between the use of free time and quality of life. This relationship was partially implemented in the brief phase of the construction of the cards, the attributes of which urged respondents to choose between factors also linked to eco-innovation infrastructures [46] and to explain preferences, tastes and sensitivities in regard to circuits that involve the use of services accompanying the visit. Furthermore, some questions have been structured to verify green sensitivity in relation to mobility, which often does not effectively accommodate the concepts of landscape sustainability and sense of place [47].
The results of the survey also highlight a further aspect of interest that will be developed in the future: this method holds promise for guiding policy-makers towards cohesive measures aimed at enhancing the well-being of the community, preserving cultural heritage and safeguarding the integrity of the territory. This strategic indication can constitute a very strong request in recommending that public bodies prepare and systematize data, information and tools, such as, for example, spatial patterns, to preserve rural communities, ecosystems and anthropic values in the context of land abandonment [48].
In the end, the preferences and choices of the sample that were investigated with the CA represent elements of reflection for a subsequent phase (which will constitute an advancement of the research), which involves a process of co-design of the circuits with the decision-makers in a comparison also with the GAL, experts and local communities.

7. Conclusions

This work has shown how a currently devalued, and often unknown, territory can find new life through the enhancement and enjoyment of its cultural assets and territory, putting the citizens themselves in the foreground. In order to understand the particularly complex situation in which these municipalities find themselves, it was therefore decided to carry out an in-depth and timely analysis of the territory. To build a strong foundation for research, various official databases, both regional and national, were employed. These databases facilitated the utilization of different software, such as the Geographical Information System (GIS). This tool was pivotal in handling the substantial volume of information required for the territorial analysis of a vast area, as in the case of this study. This aspect vividly demonstrates how the CA methodology seamlessly integrates with other tools [49].
The territory in question, as repeatedly specified, is rural and currently with little margin for development; confirming this is the social and economic picture of the inhabitants, which shows a propensity for depopulation and a decline in births (the population change between 2016 and 2021 records a decrease of about 1.5%), thus making the population increasingly elderly and without a real generational turnover. This precarious situation, combined with weak policies for rural areas in Sardinia, meant that this area for our methodology could fall into the category of collective territories “without a market” and therefore not valorized.
The enhancement prospects examined, although highlighting the potential of the area, go beyond the simple preservation of buildings. They all present a certain complexity, especially in terms of coordination among the various actors involved. This complexity is further exacerbated as cultural investment is not limited to punctual interventions but involves a system of locally sized cultural goods spread throughout the territory. Starting from the assumption that a good should never be separated from its context and the territorial network of which it is an integral part, the goal of this work has been to propose a systemic enhancement of the territory, certainly starting with the conservation of architectural and landscape elements and then focusing on their fruition, which can also take place through intangible components such as sports activities, food and wine events or simply moments of relaxation. This approach has fostered the involvement of the inhabitants of the 17 municipalities of the GAL Anglona Coros, who possess in-depth knowledge of the area.
Throughout the course of this study, the CA technique has emerged as notably efficacious in appraising cultural assets, particularly those categorized as lacking a market presence. Its adeptness in deconstructing assets into distinct attributes enables the quantification of cultural, symbolic, spiritual, and intangible values that evade direct communication through cultural heritage, inherently detached from commercial paradigms. This proficiency facilitates an expansion of offerings and, subsequently, a wider reach to a more extensive user base. This has made it possible to identify new demands, targets and markets for this area, allowing it to differentiate itself from seasonal beach tourism and encourage a more conscious tourism oriented towards a “slow” and rural experience that takes into account the intrinsic characteristics of the area. In fact, the work aims not only to redevelop the area but also to verify the actual inclination of demand (the users) to recognize these values and invest in the area (WTP). In other words, based on the users’ interest, it is possible to assume a consensus regarding improvement policies that may also require financial involvement [50].
It should also be specified that the CA model is useful in creating a relationship between figures of experts, stakeholders and citizens who experience the area, thus promoting a cohesive decision-making environment and helping to simplify an equally complex decision-making process [51]. Moreover, it has the characteristic of being easily adaptable to different approaches and planning situations; in fact, the application areas are wide and heterogeneous, ranging from forest areas with high environmental value to cultural landscapes, from archaeological sites to rural landscapes.
The findings of this research underscore the intricate and time-intensive nature of the CA methodology’s analytical process. Consequently, effective application in specific contexts necessitates the involvement of a professional equipped with comprehensive expertise not only in economics but also in the legislative frameworks governing cultural and landscape heritage, alongside with a nuanced understanding of architectural heritage. This specialized profile is instrumental in maximizing the efficacy of this methodology in formulating scenarios and assessments, thereby yielding substantiated and particularly impactful results crucial for informed decision-making processes.
In conclusion, this paper has shown that a tool that is still little associated with the valorization of cultural heritage and landscape can actually be advantageous and useful in the identification of determining factors for a territory’s development both at the cultural and purely economic level; moreover, the wealth of data that can be obtained using CA allows for diversification of the analyzes to be carried out and consequently the objectives to be pursued.
This work, looking at possible future developments, attempts to identify with statistical robustness strategic elements that are useful in the territorial enhancement choices of public authorities and attempts to help the decision-maker in the formulation of the time schedule with which to carry out the actions, based, precisely, on the values of the β coefficients that show the preference levels of the different aspects analyzed and proposed to the user.

Author Contributions

Conceptualization: C.C. and F.P.; methodology: C.C. and F.P.; software: C.C. and F.P.; validation: C.C. and F.P.; formal analysis: C.C. and F.P.; investigation: F.P.; resources: C.C. and F.P.; data curation, F.P.; writing—original draft preparation: C.C. and F.P.; writing—review and editing: C.C. and F.P.; visualization, F.P.; supervision; C.C. and F.P. All authors have read and agreed to the published version of the manuscript.

Funding

This research received no external funding.

Data Availability Statement

The data presented in this study are available on request from the corresponding author. The data are not publicly available, because the survey data are anonymized and have been reworked by the authors.

Acknowledgments

The support of GAL Anglona-Coros and Daniela Ciaffi is acknowledged.

Conflicts of Interest

The authors declare no conflict of interest.

References

  1. Carboni, D. Beni Culturali e Territorio: Il Caso Della Sardegna, 1st ed.; Università degli studi di Sassari: Sassari, Italy, 1998. [Google Scholar]
  2. Caredda, G. Sardegna. In Guida Turistica, 1st ed.; Istituto Geografico DeAgostini: Novara, Italy, 1993. [Google Scholar]
  3. Pasquino, F. Come Valorizzare i Territori “Senza Mercato”? Applicazione della Conjoint Analysis a Supporto di Scenari di Fruizione Nell’area Nord Sardegna. Master Thesis, Politecnico di Torino, Torino, Italy, 21 July 2023. [Google Scholar]
  4. Alshuqaiqi, A.; Irwana, S.O. Causes and Implication of Seasonality in Tourism. JARDCS 2019, 11, 1480–1485. [Google Scholar]
  5. Regione Sardegna, Destinazione Sardegna 2018-2021: Piano Strategico di Sviluppo e Marketing Turistico della Sardegna. 2018. Available online: https://www.regione.sardegna.it/documenti/1_231_20181221121007.pdf (accessed on 3 January 2023).
  6. Munsters, W. Culture and tourism: From antagonizm to synergizm. Ido Mov. Cult. 2008, 8, 165–173. [Google Scholar]
  7. Stanghellini, S. La selezione dei Progetti e il Controllo dei Costi Nella Riqualificazione Urbana e Territoriale, 1st ed.; Alinea Editrice: Firenze, Italy, 2004. [Google Scholar]
  8. La Strategia per le Aree Interne. Available online: https://www.sardegnaprogrammazione.it (accessed on 2 January 2023).
  9. Progetto RESET. Available online: https://reset.provincia.sassari.it/ (accessed on 5 January 2023).
  10. Progetto AnCoRA. Available online: https://www.galac.it/it/progetti-gal-anglona-romangia/progetto-ancora/ (accessed on 6 January 2023).
  11. Programma di Sviluppo Rurale 2007–2013. Available online: https://www.regione.sardegna.it/documenti (accessed on 2 January 2023).
  12. Fondo Europeo Agricolo per lo Sviluppo Rurale (FEASR). Available online: https://eur-lex.europa.eu/IT/legal-content/summary/european-agricultural-fund-for-rural-development-eafrd.html (accessed on 10 January 2023).
  13. Sardegna Geoportale. Available online: https://www.sardegnageoportale.it/ (accessed on 15 January 2023).
  14. Brandis, P.; Brigaglia, M.; Dettori, S.; Idda, L.; Lepori, G.N.; Milella, A.; Mossa, V.; Paba, A.; Pala, M.; Pietracaprina, A.; et al. La Provincia di Sassari: L’ambiente e L’uomo, 1st ed.; Editore Silvana: Milano, Italy, 1983. [Google Scholar]
  15. Dinamiche e Tendenze dello Spopolamento in Sardegna Focus Sulle aree LEADER—Un aggiornamento Funzionale alle Politiche di Sviluppo Rurale dell’Autorità di Gestione del Programma di Sviluppo Rurale della Regione Sardegna. Available online: https://www.regione.sardegna.it/documenti/ (accessed on 1 January 2023).
  16. Tosco, C. I Beni Culturali. Storia, Tutela e Valorizzazione, 1st ed.; Mulino Itinerari: Bologna, Italy, 2014. [Google Scholar]
  17. Brigaglia, M.; Castellaccio, A.; Contu, E.; Doneddu, G.; Fois, G.; Lo Schiavo, F.; Manconi, F.; Mastino, A.; Meloni, G.; Tanda, G.; et al. La Provincia di Sassari. I Secoli e la Storia, 1st ed.; Editore Silvana: Milano, Italy, 1985. [Google Scholar]
  18. Tola, M.M. Carta Degli Itinerari del Romanico della Sardegna, 1st ed.; Carlo Delfino Editore: Sassari, Italy, 2021. [Google Scholar]
  19. Chiese Romaniche della Sardegna. Available online: https://www.chieseromanichesardegna.it/ (accessed on 13 March 2023).
  20. Interreg Europe. Available online: https://www.interregeurope.eu/ (accessed on 13 March 2023).
  21. SIC, ZSC e ZPS. Available online: https://portal.sardegnasira.it/sic-e-zps (accessed on 11 March 2023).
  22. SIC Grotta de su Coloru. Available online: https://portal.sardegnasira.it/-/zsc-grotta-de-su-coloru (accessed on 11 March 2023).
  23. Arca, M.; Idda, R.; Ligios, S. Paesi di Collina: Antopologia Visuale della Sardegna, 1st ed.; Chiarella Editore: Sassari, Italy, 1985. [Google Scholar]
  24. Battino, S.; Lampreu, S. La regione Sardegna e il turismo 4.0 per lo sviluppo e la promozione smart del territorio. Ann. Tur. 2018, 7, 59–76. [Google Scholar]
  25. Sale, M. Itinerari Agrituristici Nell’aglona: Guida alla Scoperta dell’Anglona e delle sue Aziende Agrituristiche, 1st ed.; Poddighe Editore: Sassari, Italy, 2003. [Google Scholar]
  26. Indagine sui Visitatori e gli Ospiti dell’Area Anglona Coros. Available online: https://www.galac.it/it/progetti-gal-anglona-romangia (accessed on 2 February 2023).
  27. Demografia in Cifre. Available online: https://demo.istat.it/ (accessed on 20 April 2023).
  28. 8milaCensus. Available online: https://ottomilacensus.istat.it/ (accessed on 18 April 2023).
  29. Bragolusi, P.; D’Alpaos, C. The Willingness to Pay for Residential PV Plants in Italy: A Discrete Choice Experiment. Sustainability 2021, 13, 10544. [Google Scholar] [CrossRef]
  30. Coscia, C.; Fregonara, E. Strumenti Economico-Estimativi nella Valorizzazione delle Risorse Architettoniche e Culturali, 1st ed.; Celid Edizioni: Torino, Italy, 2004. [Google Scholar]
  31. Green, P.E.; Srinavasen, V. Conjoint Analysis in Consumer Research: Issues and Outlook. J. Consum. Res. 1978, 5, 103–123. [Google Scholar] [CrossRef]
  32. Bottero, M.; Mondini, G. Valutazione e Sostenibilità: Piano, Programmi, Progetti, 1st ed.; Celid Edizioni: Torino, Italy, 2009. [Google Scholar]
  33. Bottazzi, C.; Mondini, G. L’Analisi della Domanda Turistica nei processi di gestione dei paesaggi culturali. AESTIMUN 2006, 49, 15–29. [Google Scholar]
  34. Davies, S. By Popular Demand a Strategic Analysis of the Market Potential for Museums and Art Galleries in the UK, 1st ed.; Museum & Galleries Commision: London, UK, 1994. [Google Scholar]
  35. Mazzanti, M. Metodi e Strumenti di Analisi per la Valutazione Economica del Patrimonio Culturale, 1st ed.; Franco Angeli: Milano, Italy, 2003. [Google Scholar]
  36. Adamowicz, W.; Boxall, P.; Williams, M.; Louviere, J. Stated Preference Approaches for Measuring Passive Use Values: Choice Experiments and Contingent Valuation. Am. J. Agric. Econ. 1998, 80, 64–75. [Google Scholar] [CrossRef]
  37. Adamowicz, W.; Hanley, N.; Wright, R. Using Choice Experiments to Value the Environment. Environ. Resour. Econ. 1998, 11, 413–428. [Google Scholar]
  38. Kroes, E.P.; Sheldon, R.J. Stated Preference Methods: An Introduction. JTEP 1988, 22, 11–25. [Google Scholar]
  39. Mazzanti, M. Discrete Choice Models and Valuation Experiments. An application to cultural heritage. J. Econ. Stud. 2003, 30, 584–604. [Google Scholar] [CrossRef]
  40. McCallum, B.T. Issues in the design of monetary policy rules. Handb. Econ. Growth. 1999, 1, 1483–1530. [Google Scholar]
  41. Roscelli, R. Manuale di Estimo. In Valutazione Economiche ed Esercizio della Professione, 1st ed.; DeAgostini Scuola: Novara, Italy, 2014. [Google Scholar]
  42. Hanemann, W.M. Valuing the Environment through Contingent Valuation. JEP 1994, 8, 19–43. [Google Scholar] [CrossRef]
  43. Hausman, J.; McFadden, D. Specification Tests for the Multinomial Logit Model. Econometrica 1984, 52, 1219–1240. [Google Scholar] [CrossRef]
  44. Alpizar, F.; Carlsson, F.; Martinsson, P. Using Choice Experiments for Non-Market Valuation. Econ. Div. Work. Pap. 2001, 52, 1–37. [Google Scholar]
  45. Software IBM SPSS. Available online: https://www.ibm.com/it-it/spss (accessed on 20 June 2023).
  46. Cynarski, W.; Woźniak, L. Innovation in Urban Infrastructure for Development of Physical Culture: An Example of a Little Town in Poland. In Transitioning to Sustainable Industry, Innovation and Infrastructure; MDPI: Basel, Switzerland, 2023; Volume 2. [Google Scholar]
  47. Nikologianni, A.; Larkham, P.J. The Urban Future: Relating Garden City Ideas to the Climate Emergency. Land 2022, 11, 147. [Google Scholar] [CrossRef]
  48. Salis, M.; Del Giudice, L.; Jahdi, R.; Alcasena-Urdiroz, F.; Scarpa, C.; Pellizzaro, G.; Bacciu, V.; Schirru, M.; Ventura, A.; Casula, M.; et al. Spatial Patterns and Intensity of Land Abandonment Drive Wildfire Hazard and Likelihood in Mediterranean Agropastoral Areas. Land 2022, 11, 1942. [Google Scholar] [CrossRef]
  49. Atzeni, C.; Colavitti, A.M.; Cadoni, S.; Floris, A.; Marras, F.; Serra, S. Cross-Disciplinary Approaches to the Regeneration of Minor Historical Centers: The Case of Mogoro in Sardinia. Sustainability 2022, 14, 14439. [Google Scholar] [CrossRef]
  50. Coscia, C.; Curto, R. Valorising in the absence of public resources and weak markets: The case of “Ivrea, the 20th century industrial city”. Green Energy Technol. 2017, 0, 79–99. [Google Scholar] [CrossRef]
  51. Coscia, C.; Rubino, I. Fostering new value chains and social impact-oriented strategies in urban regeneration processes: What challenges for the evaluation discipline? In Proceedings of the 4th International Symposium on New Metropolitan Perspectives, NMP 2020, Reggio Calabria, Italy, 26–28 May 2020. [Google Scholar]
Figure 1. Geolocation of the GAL Anglona Coros within the region of Sardinia. Source: Authors’ reprocessing from data from sardegnageoportale.it [13] using QGIS (version 2.18; 3.22.11) software.
Land 12 02150 g001
Figure 2. Accessibility inside the GAL. Source: Authors’ reprocessing from data from sardegnageoportale.it using QGIS software.
Land 12 02150 g002
Figure 3. Number of inhabitants and population density in the municipalities of the GAL. Source: Authors’ reprocessing from data from sardegnageoportale.it using QGIS software.
Land 12 02150 g003
Figure 4. Typical landscape of the GAL territory. (a) Church San Nicola di Sinis, Sedini; (b) Basilica of Saccargia, Codrongianos. Source: Authors (date: March 2023).
Land 12 02150 g004
Figure 5. Stages of Conjoint Analysis. Source: Authors.
Land 12 02150 g005
Figure 6. Typical landscape of the GAL territory. (a) Climbing near Osilo; (b) Domus de janas, Sedini. Source: Authors (date: April 2023).
Land 12 02150 g006
Table 1. Attributes and related levels. Source: Authors.
AttributesLevels
Cultural heritage
(CH)
Conservation and protection of cultural heritage in the state of fact
(Cons. CH)
Enhancement of the Nuragic period itinerary
(Nuragic)
Enhancement of the Medieval era itinerary
(Medieval)
Sports, fitness and green
(SFITGR)
Conservation and protection of green areas in the state of fact
(Cons. Green)
Enhancement of recreation places and green areas
(Green Areas)
Enhancement of places for sports activities
(Sport)
Food and wine
(F and W)
No food and wine experience
(No F and W)
Enhancement of stops for tasting of traditional dishes
(Trad. Dishes)
Experience inside a local business
(Experience)
Transportation
(TRAN)
Transportation vehicle to be provided by the user
(NoTran)
Use of a shuttle
(Shuttle)
Use of an electric car
(Electric Car)
Table 2. The nine cards generated by IBM SPSS 27 software. Source: Authors.
ID CardCultural
Heritage
Sport, Fitness and GreenFood and WineTransportationCost
1MedievalGreen AreasExperienceNo Tran31–50€
2MedievalSportNo F and WShuttleAbove 50€
3NuragicCons. GreenExperienceShuttlesAbove 50€
4NuragicSportTrad. DishesNo Tran31–50€
5NuragicGreen AreasNo F and WNo Tran31–50€
6Cons. CHSportExperienceElectric car31–50€
7Cons. CHCons. GreenNo F and WNo Tran10–30€
8MedievalCons. GreenTrad. DishesElectric carAbove 50€
9Cons. CHGreen AreasTrad. DishesShuttle30–50€
Table 3. Analysis of the social and economic background of the respondents. Source: Authors.
CharacteristicsTotalResidentsVisitors
SexFemale57%53%60%
Male41%45%38%
I prefer not to answer2%2%2%
Age18–25 years9%9%9%
26–35 years19%9%30%
36–50 years20%22%17%
55–65 years26%37%14%
Above 65 years26%23%30%
Household1 person9%9%10%
2 persons21%22%22%
3 persons28%35%35%
4 persons34%27%27%
More than 4 persons8%7%7%
Level of studiesMiddle school5%6%5%
High school47%53%41%
Bachelor’s degree15%13%17%
Master’s degree28%25%30%
PhD5%3%7%
EmploymentEmployee41%42%38%
Homemaker4%6%1%
Freelancer17%21%14%
Student18%9%28%
Unemployed6%8%3%
Retiree9%9%10%
In other condition5%5%6%
IncomeLess than 10,000€31%27%35%
10,000–26,000€40%45%34%
26,0005–55,000€25%24%26%
55,000–75,000€2%2%3%
75,000–120,000€1%1%1%
More than 120,000€1%1%1%
Table 4. Attributes and levels utility by IBM SPSS 27 software. Source: Authors.
ResidentsVisitors
AttributesLevelsβ coeff.Std. Err.β coeff.Std. Err.
CHCons. CH−0.0560.047−0.0070.08
Nuragic−0.1120.094−0.0130.159
Medieval−0.1680.141−0.020.239
SFITGRCons. Green0.0270.0310.0570.053
Green Areas0.0540.0630.1150.107
Sport0.0810.0940.1720.160
F and WNo F and W0.0480.0330.0810.057
Trad. Dishes0.0950.0670.1630.114
Experience0.1430.10.2440.171
TRANNo Tran−0.0280.039−0.010.066
Shuttle−0.0560.078−0.020.133
Electric car−0.0850.117−0.030.199
Cost10–30€0.0230.07−0.0140.118
31–50€0.0460.139−0.0270.236
More than 50€0.0690.209−0.0410.355
Constant 0.3780.1290.210.219
Table 5. Utility values by IBM SPSS 27 software. Source: Authors.
ScenarioResidentsVisitors
10.4250.512
20.3250.382
30.4490.437
40.460.495
50.3260.336
60.5070.562
70.3920.317
80.3160.339
90.4610.434
Table 6. WTP values. Source: Authors.
AttributesLevelsResidentsVisitors
CHCons. CH−2.42€−0.51€
Nuragic−4.85€−0.95€
Medieval−7.27€−1.46€
SFITGRCons. Green1.17€4.16€
Green Areas2.34€8.39€
Sport3.51€12.55€
F and WNo F and W2.08€5.91€
Trad. Dishes4.11€11.9€
Experience6.19€17.81€
TRANNo Tran−1.21€−0.73€
Shuttle−2.42€−1.46€
Electric car−3.68€−2.19€
Table 7. Level of Education’s WTP values. Source: Authors.
AttributesLevelsMiddle SchoolHigh SchoolBachelor’s DegreeMaster’s
Degree
PhD
CHCons. CH−4.65€−4.19€−1.16€−1.42€1.32€
Nuragic9.3€−8.54€−2.32€−2.89€2.62€
Medieval14€−12.7€−3.48€−4.31€3.93€
SFITGRCons. Green4.82€5.48€2.48€3€1.63€
Green Areas9.7€10.96€4.97€6.15€3.26€
Sport14.53€16.61€7.51€9.21€4.89€
F and WNo F and W2.85€10€3.15€3.94€2.19€
Trad. Dishes5.17€19.83€6.34€7.89€4.39€
Experience 7.73€29.83€9.5€11.84€6.63€
TRANNo Tran−0.98€−2.9€−0.19€−1€0.95€
Shuttle−1.97€−5.64€−1.82€−2€1.87€
Electric car −3€−8.54€−2.73€−3€2.83€
Table 8. “Occupation’s WTP values. Source: Authors.
AttributesLevelsEmployeeFreelancerStudentUnemployedRetireeIn Other ConditionHomemaker
CHCons. CH−0.13€−1.83€−5.91€−0.05€−2.85€−0.72€−4.28€
Nuragic0.64€−3.66€−11.8€−0.1€−5.71€−1.45€−8.57€
Medieval0.99€−5.49€−17.6€−0.16€−8.92€−2.18€−12.8€
SFITGRCons. Green0.88€0.95€12.5€0.36€9.64€0.11€26€
Green Areas1.76€1.94€25€0.7€19.2€0.22€52€
Sport2.64€2.9€37.6€1.07€29.2€0.34€78.2€
F and WNo F and W1.52€1.36€11.9€1.25€15.7€0.09€22.1€
Trad. Dishes3€2.73€24€2.53€31€0.16€44.2€
Experience4.6€4€36€3.79€46.7€0.29€66.4€
TRANNo Tran−0.05€−0.98€−3.52€0.56€−7.5€−0.25€−26.4€
Shuttle−0.13€−2€−7.04€1.11€−15.3€−0.51€−52.8€
Electric car −0.19€−3€−10.5€1.67€−22.8€−0.77€−79.2€
Table 9. “Income’s WTP values. Source: Authors.
AttributesLevelsLess than 10,000€10,000–26,000€26,000–55,000€55,000–75,000€75,000–120,000€More than 120,000€
CHCons. CH4.67€−1.79€−1.15€1.23€0.6€−1.87€
Nuragic9.19€−3.49€−2.21€2.46€0.99€−3.75€
Medieval −13.8€−5.28€−3.36€3.7€1.5€−5.62€
SFITGRCons. Green11.1€3.39€4.33€0.11€0.56€0.61€
Green Areas22€6.69€8.58€0.23€1.12€1.83€
Sport33.2€10€12.9€0.4€2.69€2.75€
F and WNo F and W12.6€6.41€5.66€0.17€0.44€0.29€
Trad. Dishes25.4€12.7€11.3€0.32€0.89€0.58€
Experience 38.2€19.1€16.9€0.5€1.35€0.88€
TRANNo Tran−2.9€−2.07€−0.44€0.32€0.33€−1.7€
Shuttle−5.8€−4.15€−0.88€0.67€0.67€−3.42€
Electric car 8.7€−6.22€−6.22€1€0.99€−5.12€
Table 10. Favorite levels. Source: Authors.
Cultural HeritageSport, Fitness And GreenFood and WineTransportation
Conservation and protection of cultural heritage in the state of factEnhancement of places for sports activitiesExperience inside a local businessTransportation vehicle to be provided by the user
Disclaimer/Publisher’s Note: The statements, opinions and data contained in all publications are solely those of the individual author(s) and contributor(s) and not of MDPI and/or the editor(s). MDPI and/or the editor(s) disclaim responsibility for any injury to people or property resulting from any ideas, methods, instructions or products referred to in the content.

