
Analysis of Temporal and Spatial Dynamics of Ecosystem Services and Trade-Offs/Synergies during Urbanization in the Loess Plateau, China

 and
and 
Abstract
:1. Introduction
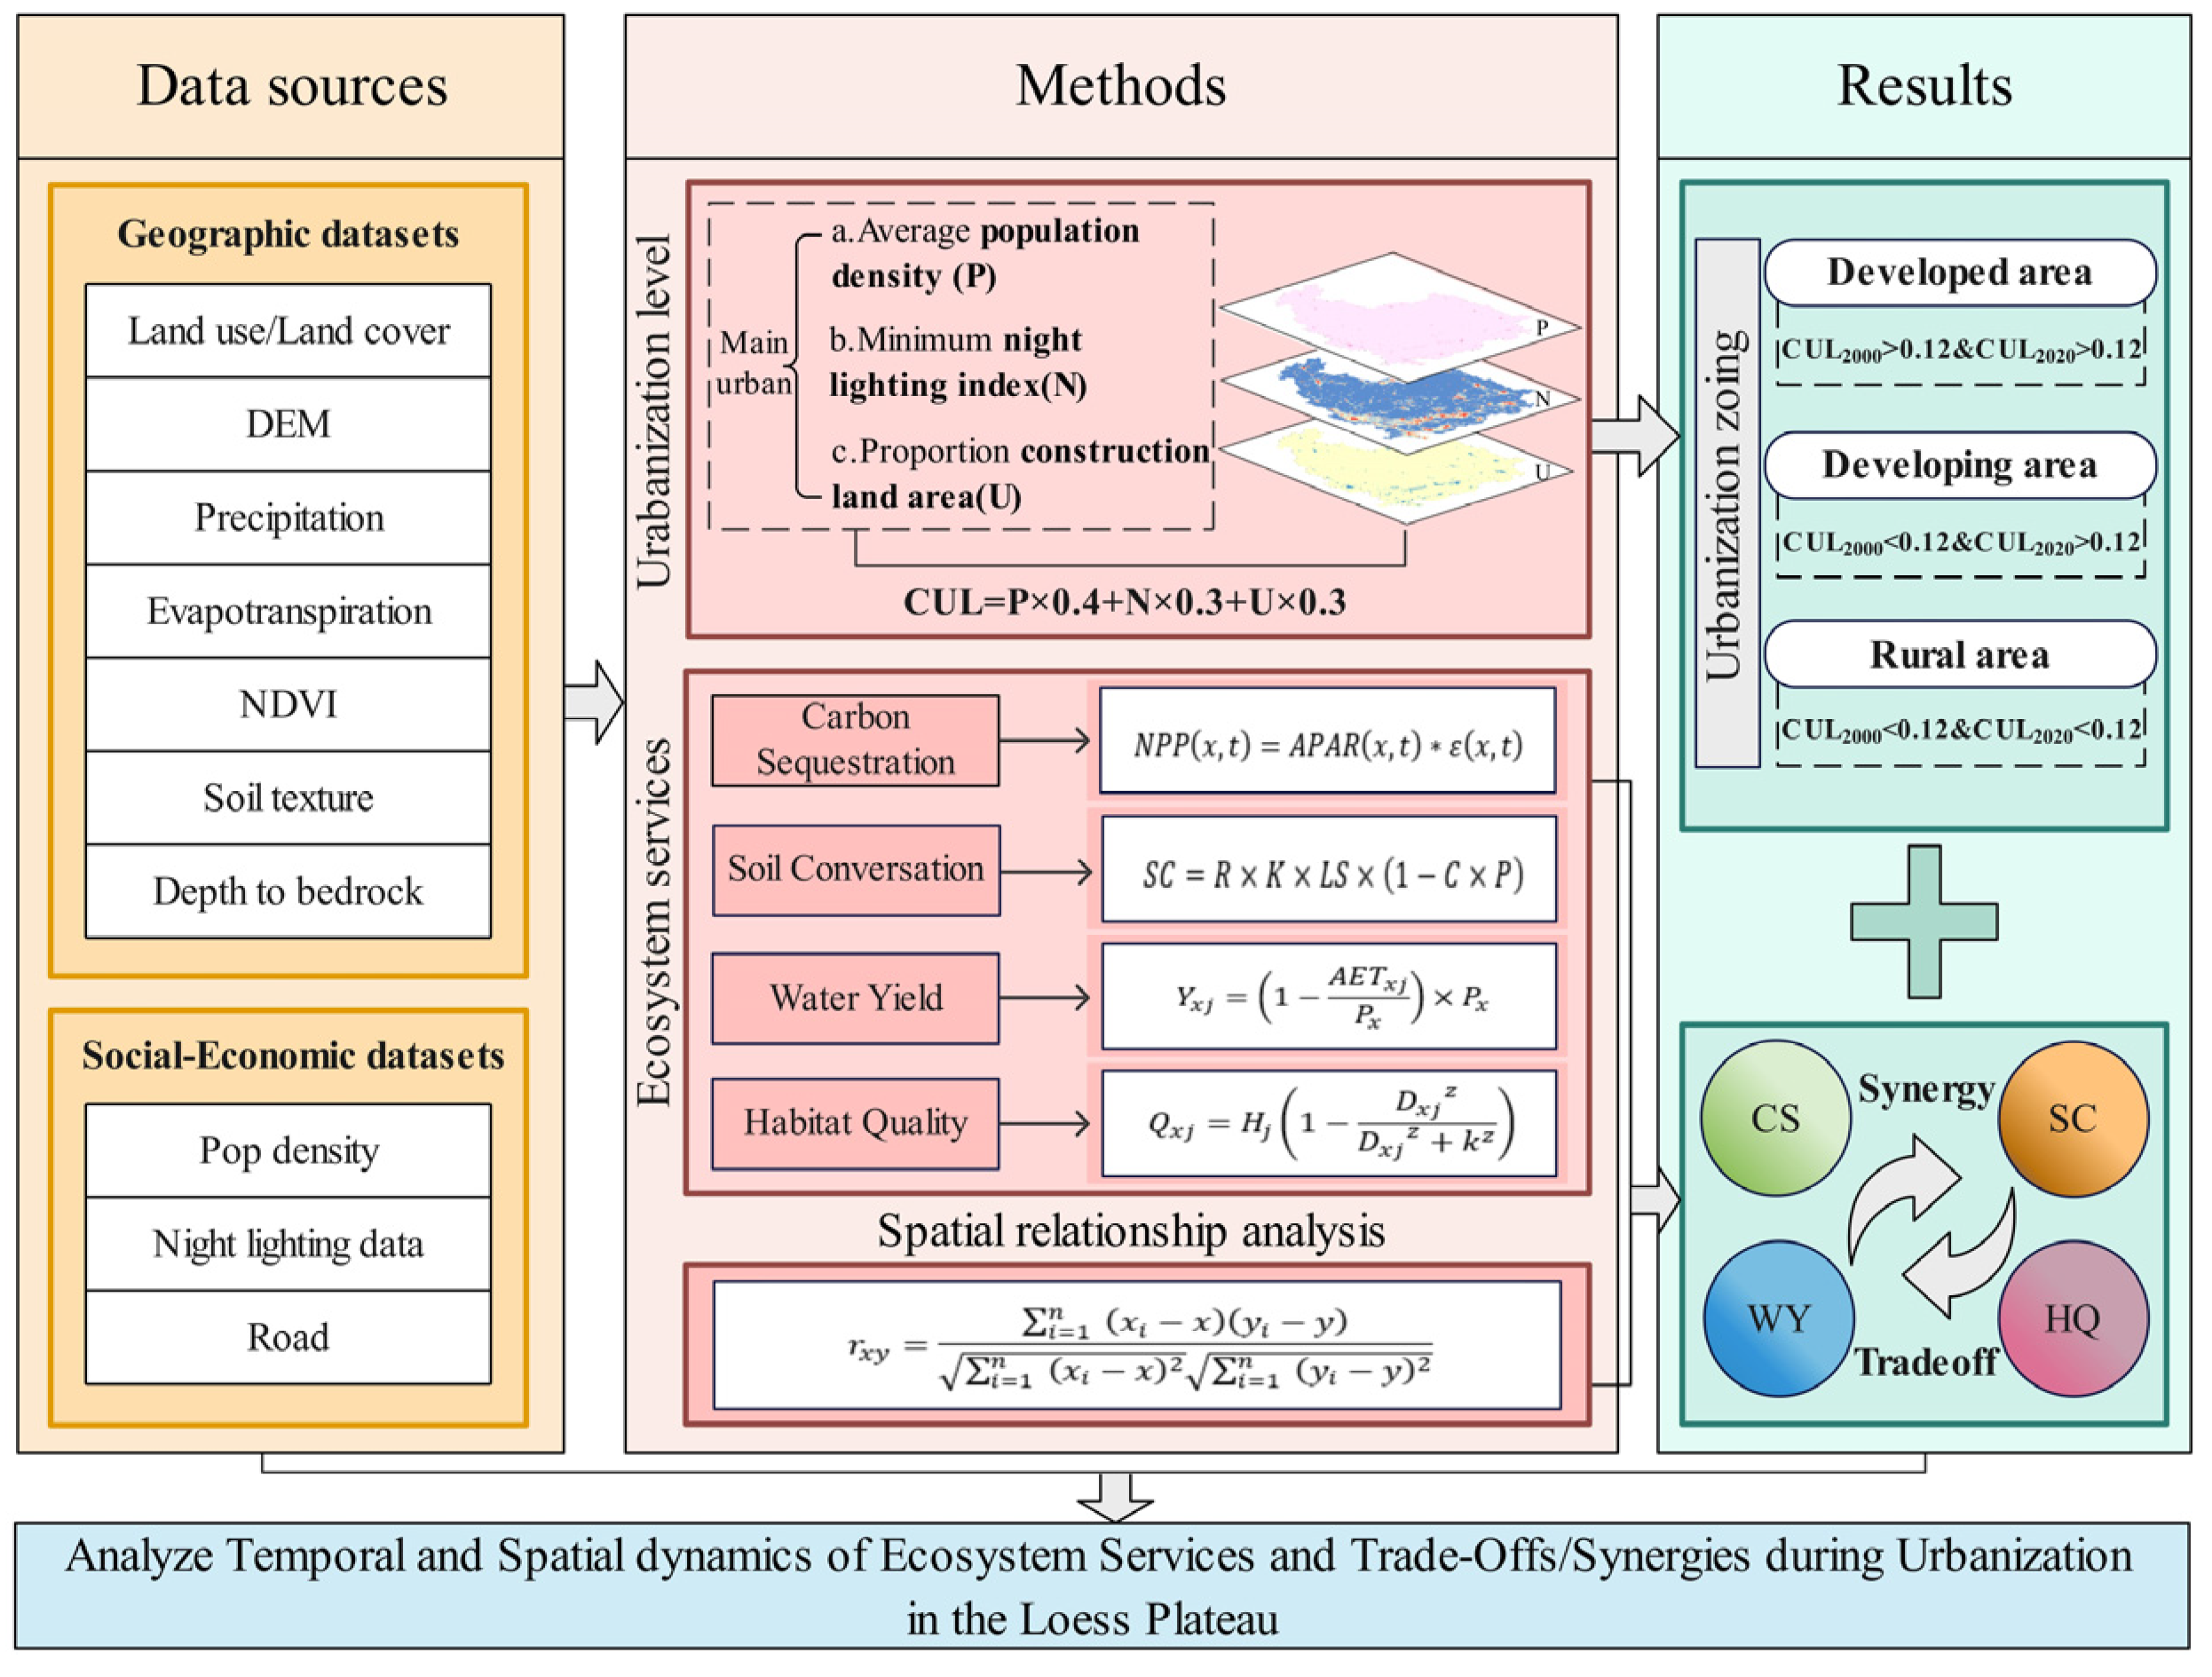
2. Data and Methods
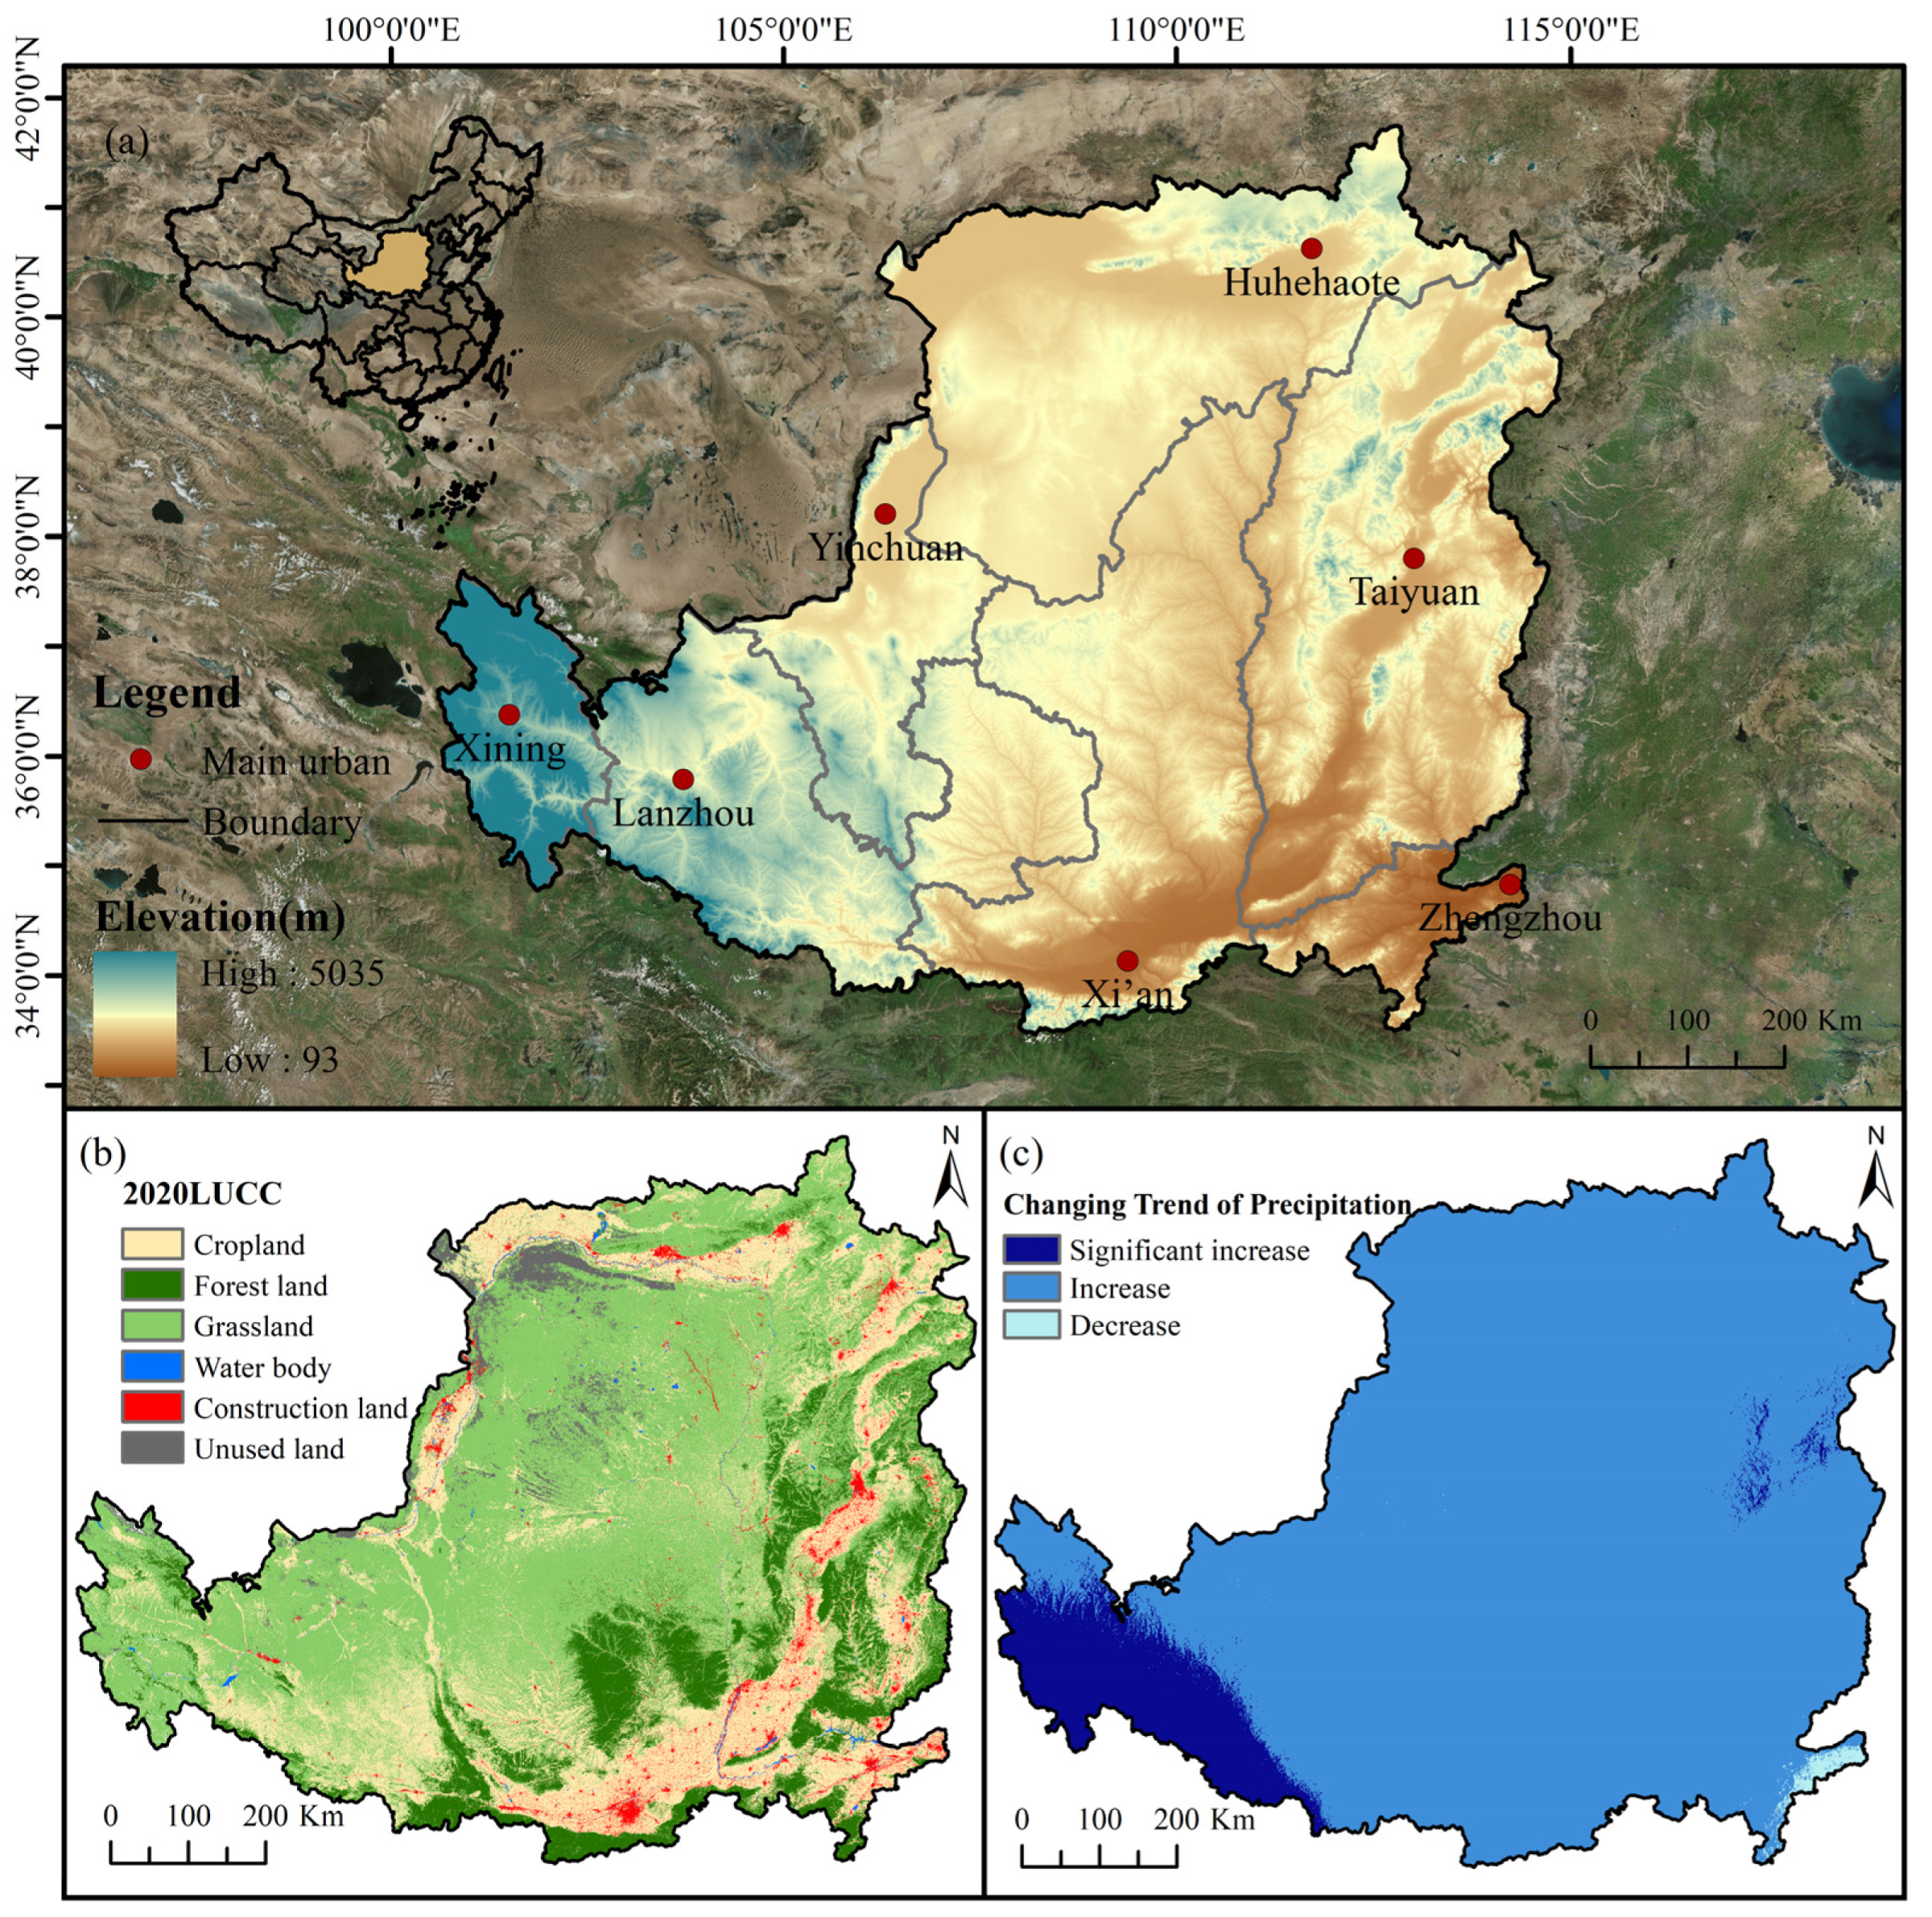
2.1. Study Area
2.2. Data Sources
2.3. Urbanization Level Quantification and Zoning
2.4. Assessment of ESs
- (1)
- Carbon Sequestration
- (2)
- Soil Conservation
- (3)
- Water Yield
- (4)
- Habitat Quality
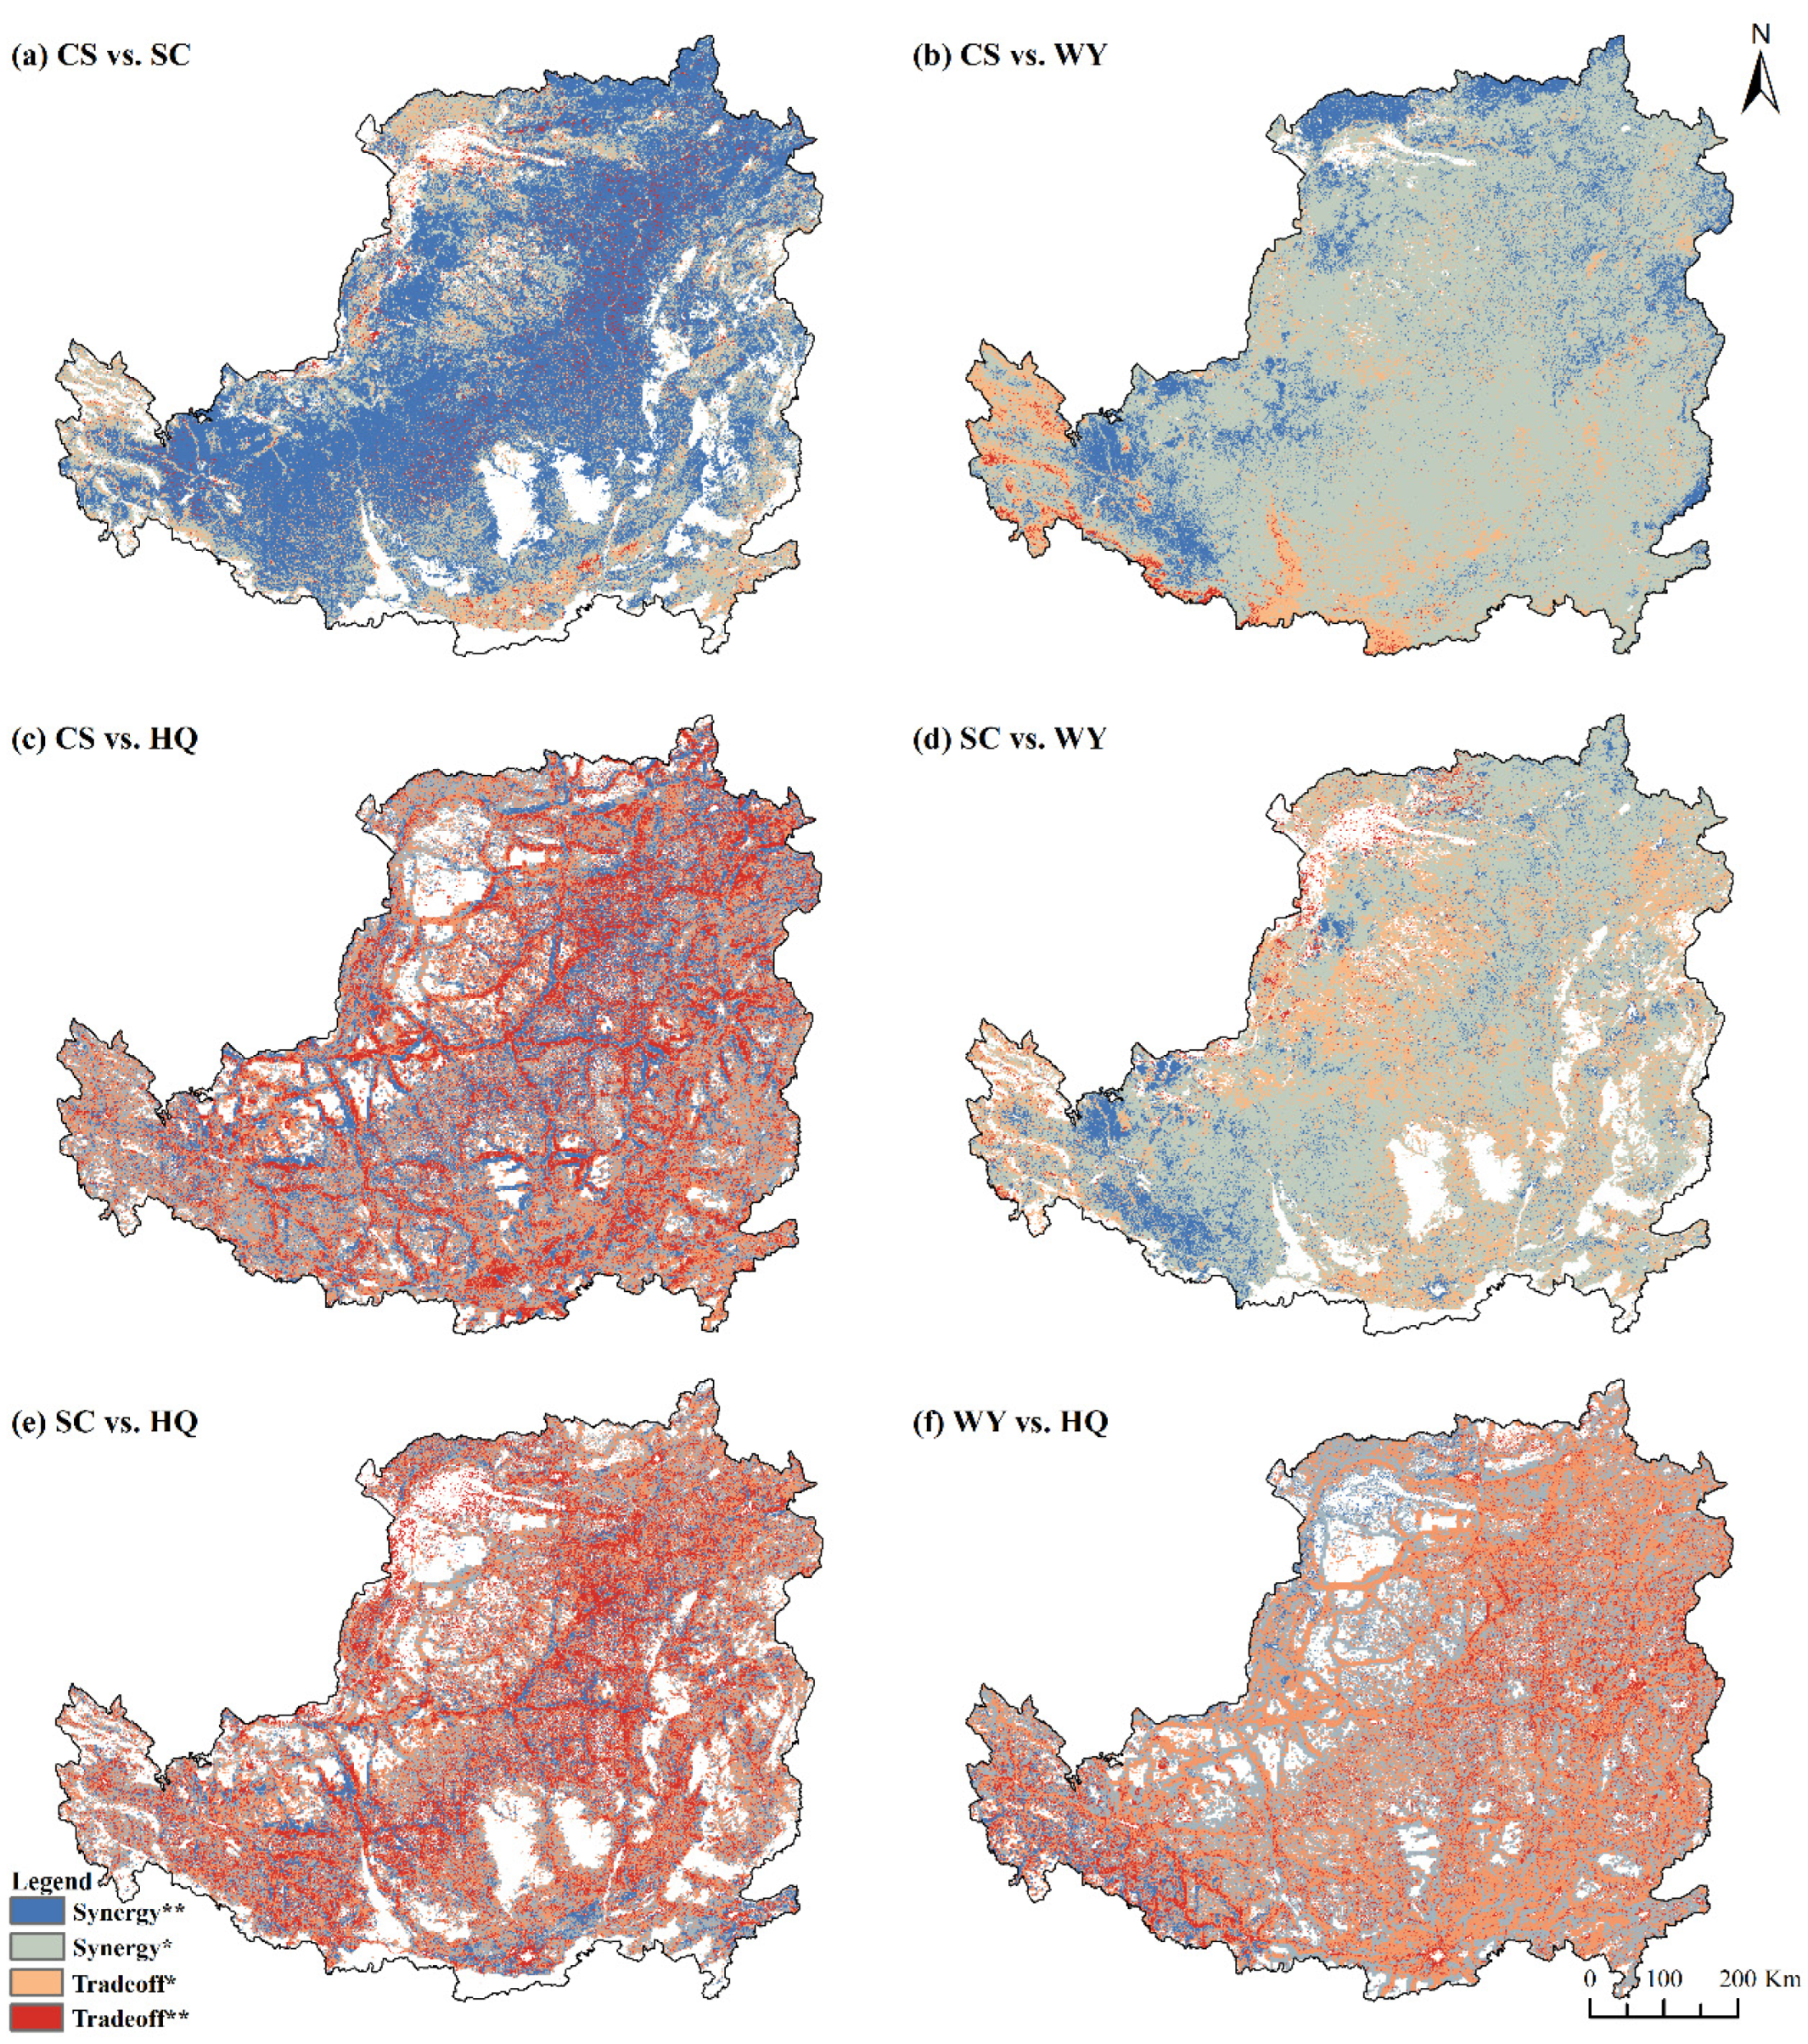
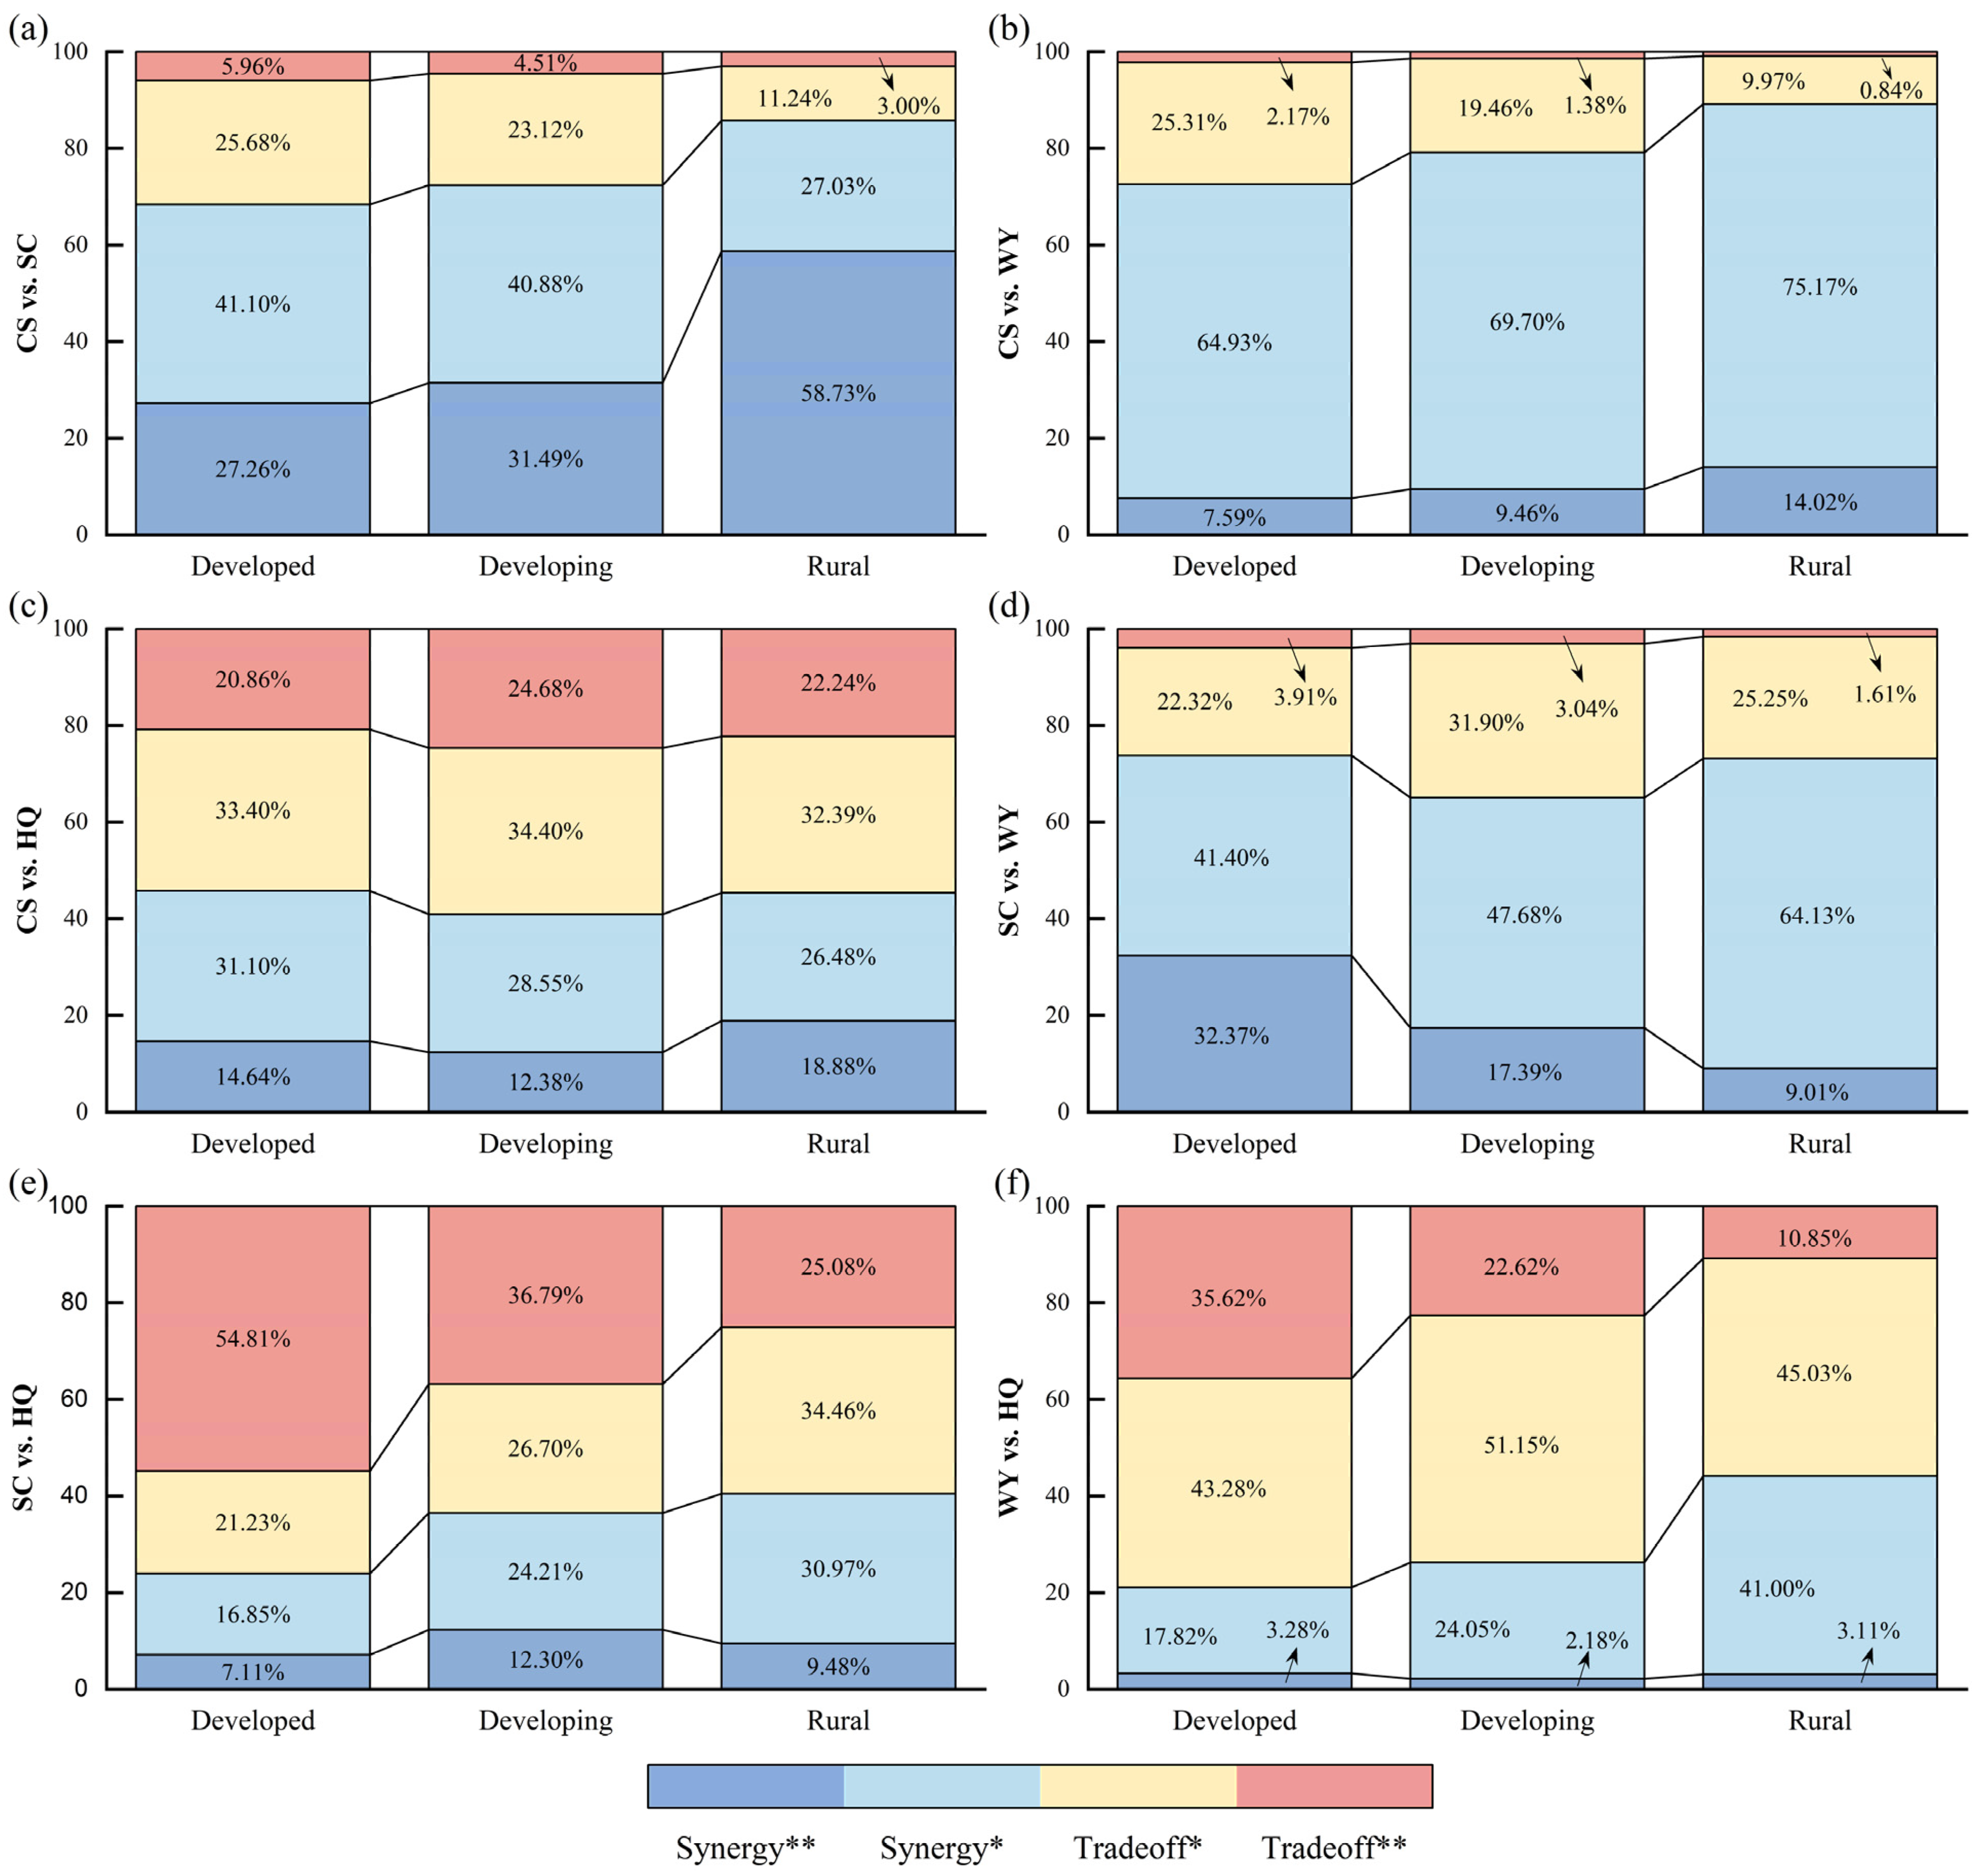
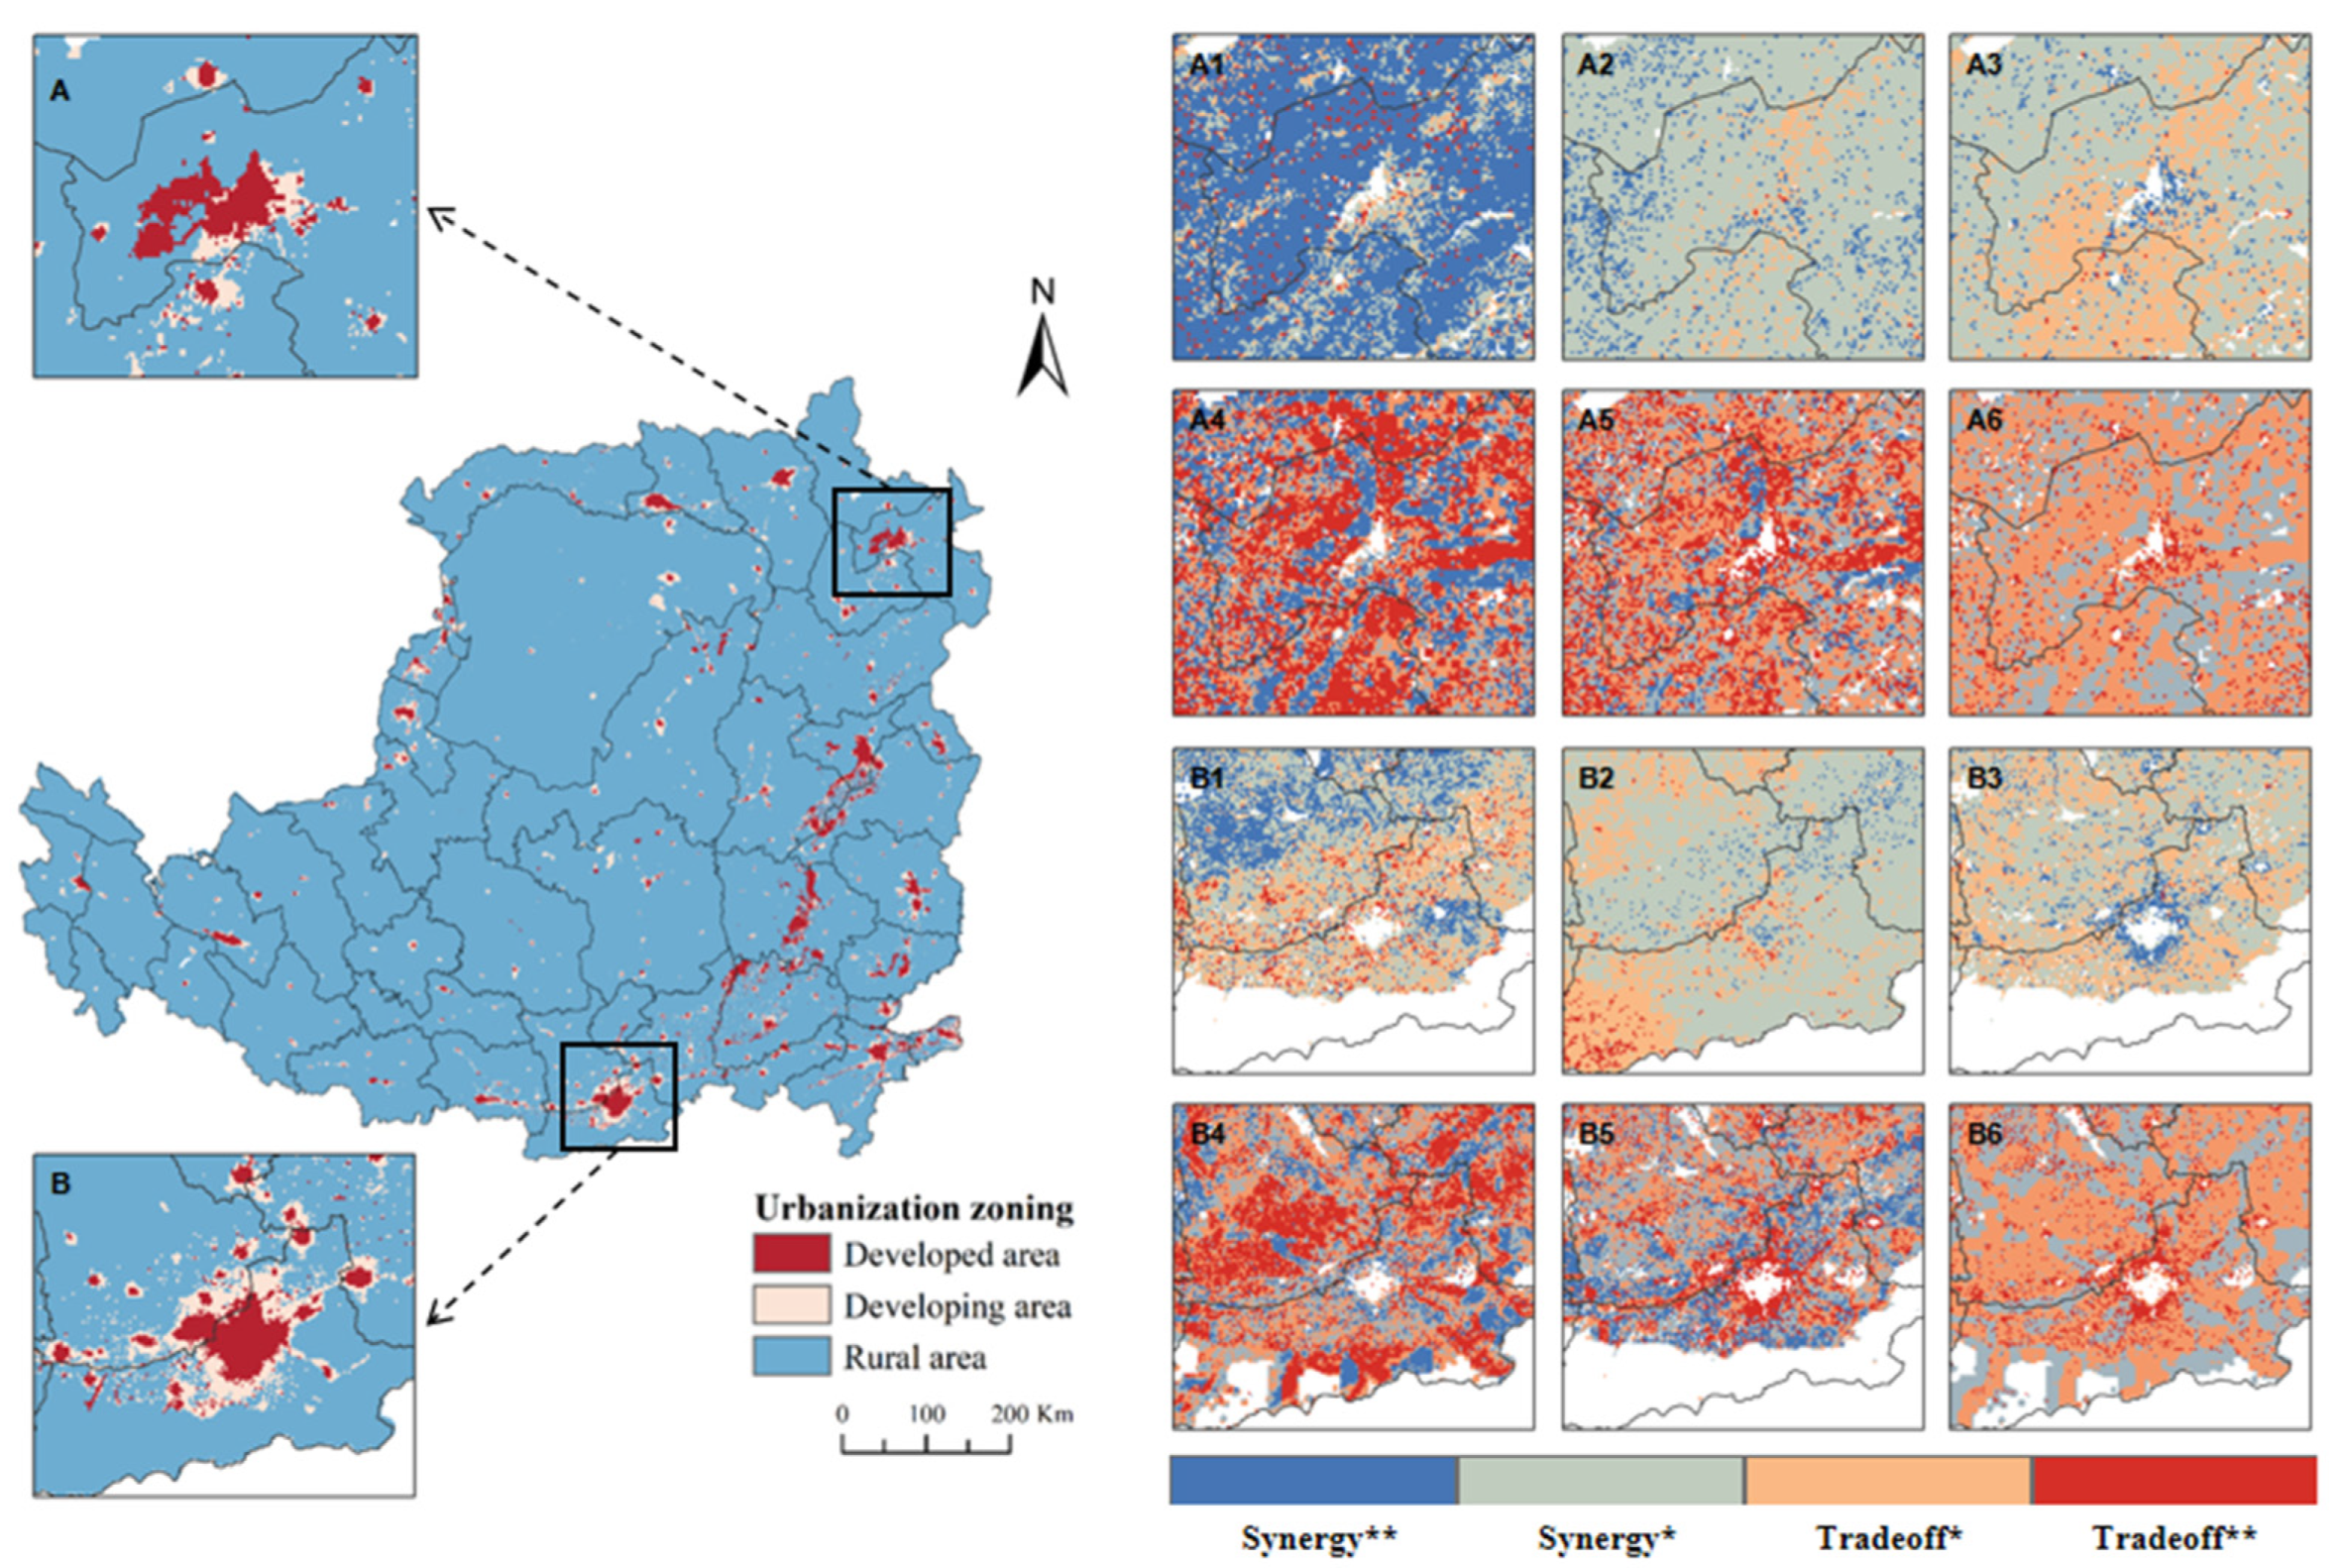
2.5. Spatial Relationship Analysis
3. Results
3.1. Urbanization Zoning
3.2. Changing Trends of ESs
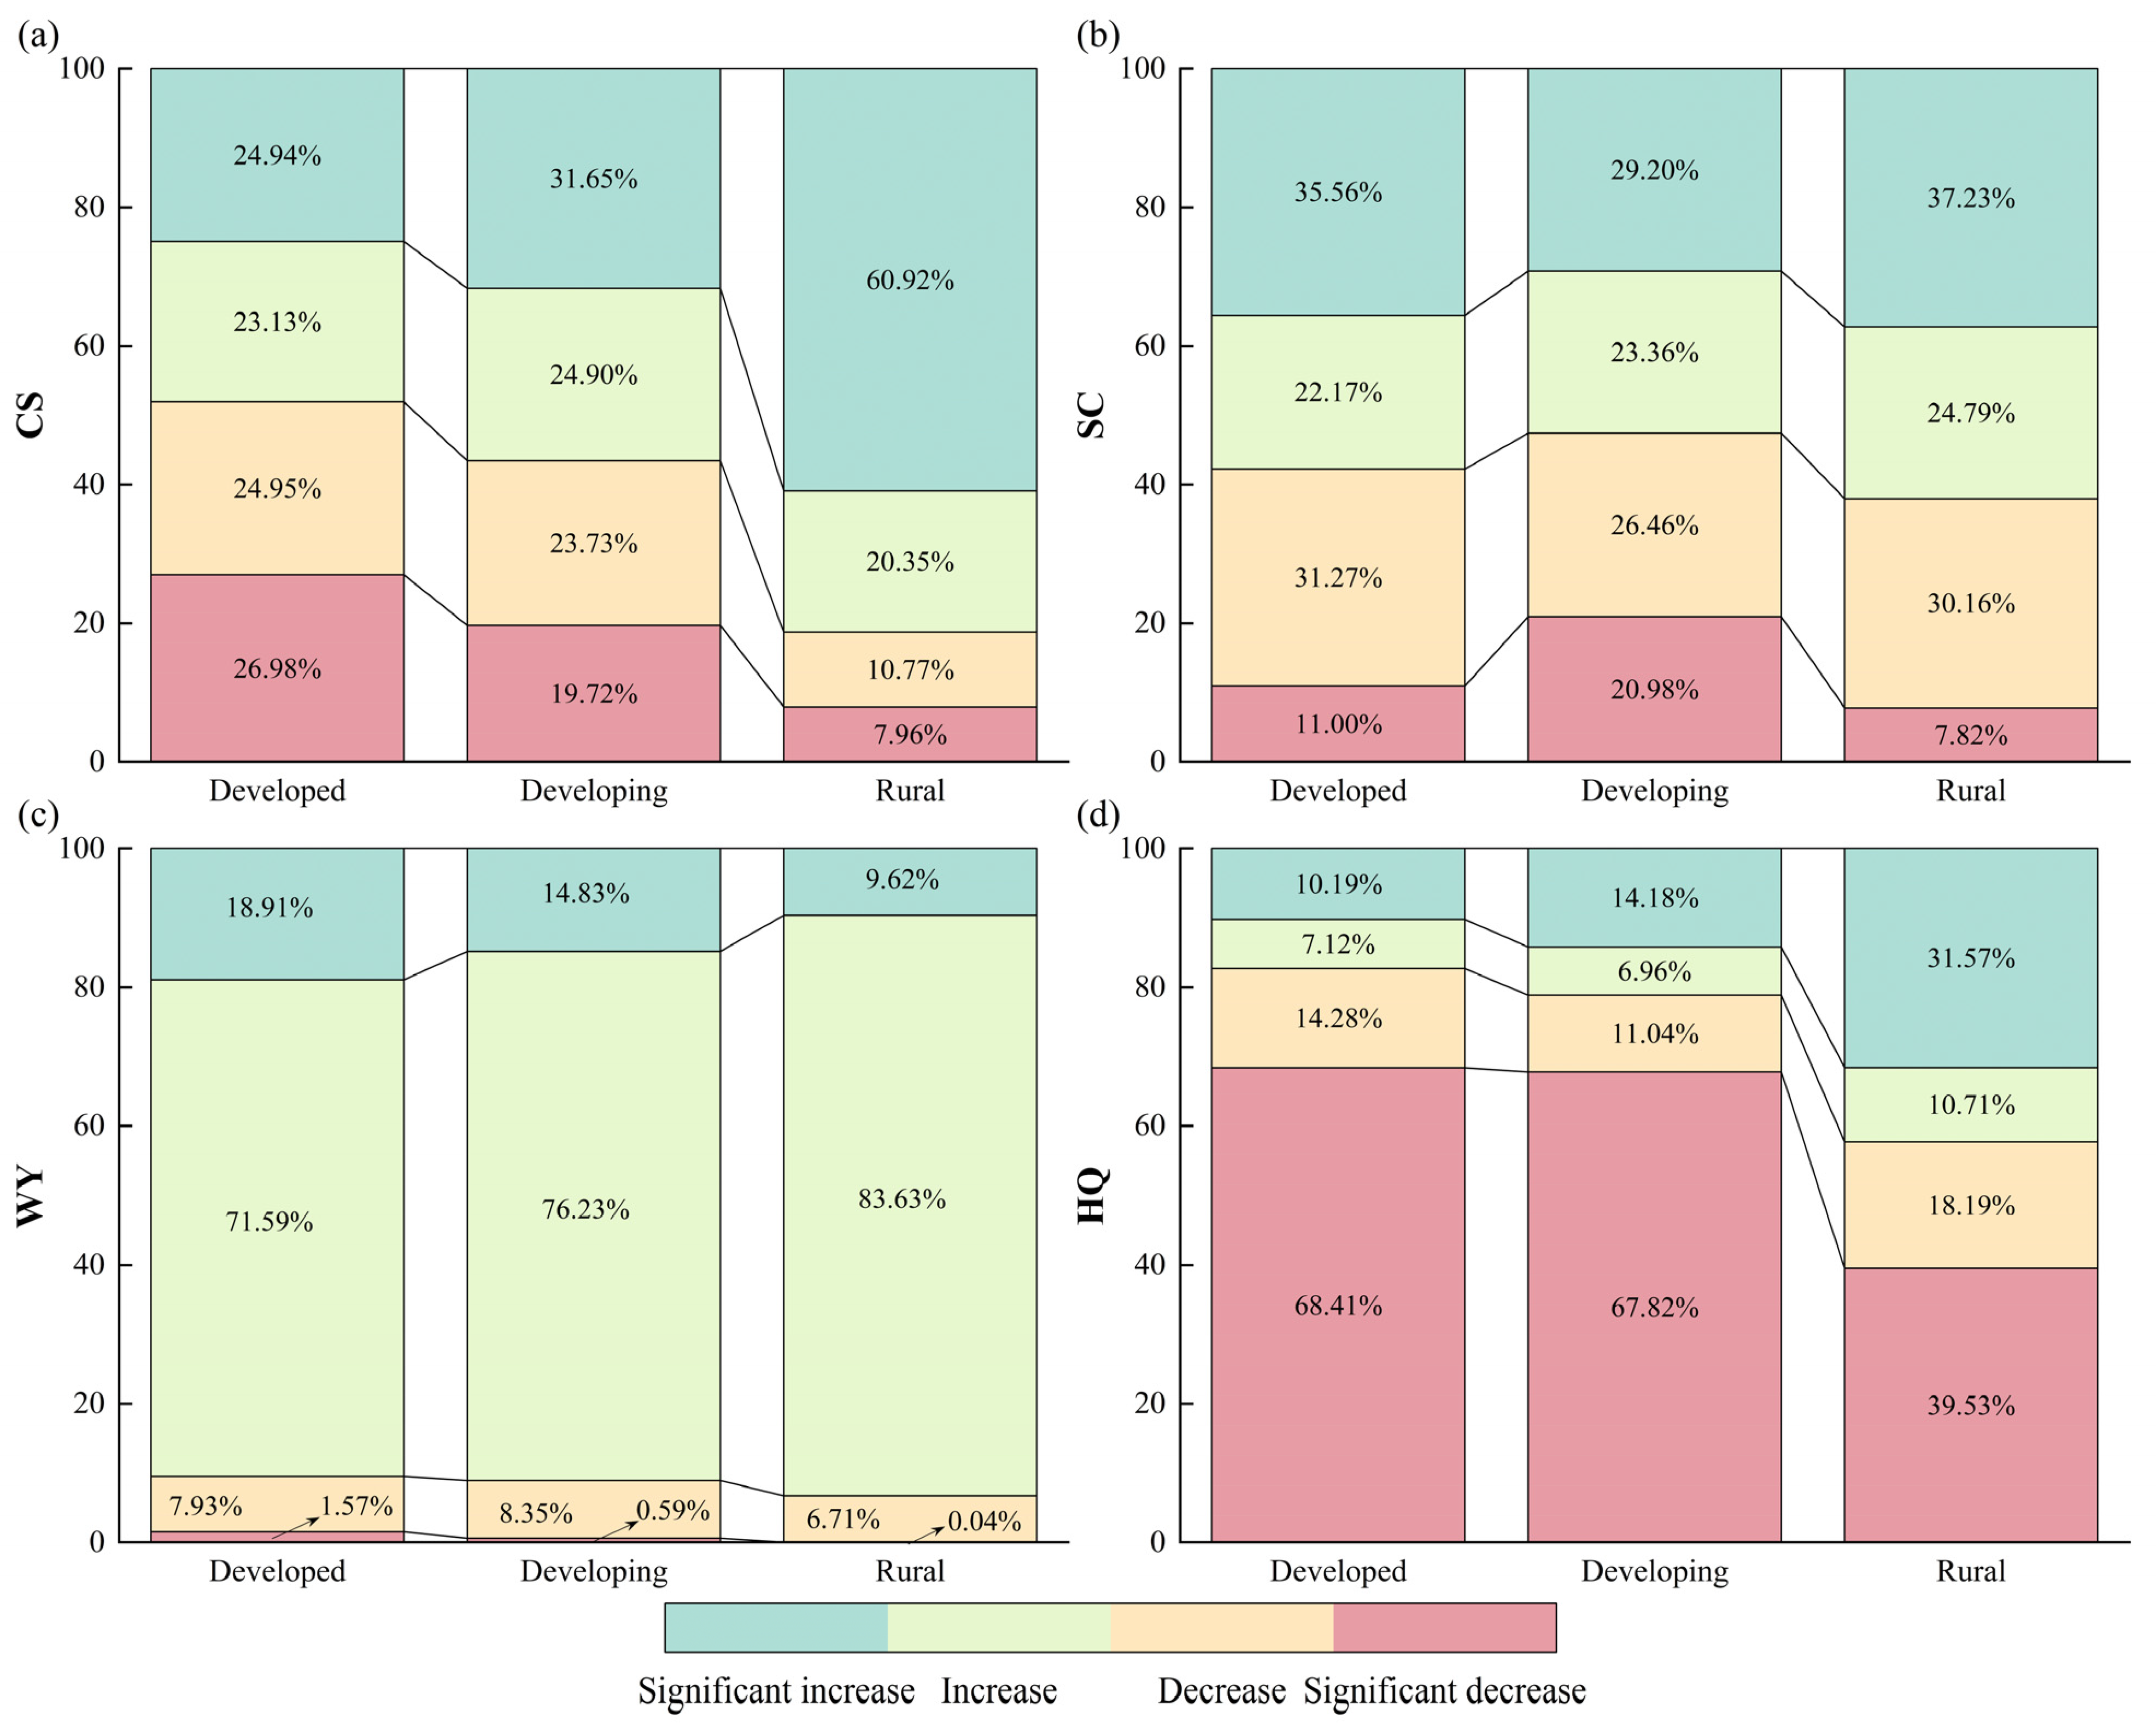
3.3. Changing Trends of ESs in Urbanization Zoning
4. Discussion
4.1. Urbanization Impact on ESs
4.2. Limitations and Prospects
5. Conclusions
Author Contributions
Funding
Data Availability Statement
Conflicts of Interest
References
- Allington, G.R.H.; Li, W.; Brown, D.G. Urbanization and Environmental Policy Effects on the Future Availability of Grazing Resources on the Mongolian Plateau: Modeling Socio-Environmental System Dynamics. Environ. Sci. Policy 2017, 68, 35–46. [Google Scholar] [CrossRef]
- Chen, M.; Ye, C.; Lu, D.; Sui, Y.; Guo, S. Cognition and Construction of the Theoretical Connotations of New Urbanization with Chinese Characteristics. J. Geogr. Sci. 2019, 29, 1681–1698. [Google Scholar] [CrossRef]
- China Statistical Yearbook 2021. Available online: http://www.stats.gov.cn/sj/ndsj/2021/indexeh.htm (accessed on 10 August 2023).
- Haase, D. Continuous Integration in Urban Social-Ecological Systems Science Needs to Allow for Spacing Co-Existence: This Article Belongs to Ambio’s 50th Anniversary Collection. Theme: Urbanization. Ambio 2021, 50, 1644–1649. [Google Scholar] [CrossRef] [PubMed]
- Fu, Q.; Xu, L.; Zheng, H.; Chen, J. Spatiotemporal Dynamics of Carbon Storage in Response to Urbanization: A Case Study in the Su-Xi-Chang Region, China. Processes 2019, 7, 836. [Google Scholar] [CrossRef]
- Li, B.; Chen, D.; Wu, S.; Zhou, S.; Wang, T.; Chen, H. Spatio-Temporal Assessment of Urbanization Impacts on Ecosystem Services: Case Study of Nanjing City, China. Ecol. Indic. 2016, 71, 416–427. [Google Scholar] [CrossRef]
- Leemans, R.; De Groot, R.S. Ecosystems and Human Well-Being: Synthesis; Millennium Ecosystem Assessment (Program), Ed.; Island Press: Washington, DC, USA, 2005; ISBN 978-1-59726-040-4. [Google Scholar]
- Deng, C.; Liu, J.; Nie, X.; Li, Z.; Liu, Y.; Xiao, H.; Hu, X.; Wang, L.; Zhang, Y.; Zhang, G.; et al. How Trade-Offs between Ecological Construction and Urbanization Expansion Affect Ecosystem Services. Ecol. Indic. 2021, 122, 107253. [Google Scholar] [CrossRef]
- Ziter, C. The Biodiversity–Ecosystem Service Relationship in Urban Areas: A Quantitative Review. Oikos 2016, 125, 761–768. [Google Scholar] [CrossRef]
- Feng, Z.; Jin, X.; Chen, T.; Wu, J. Understanding Trade-Offs and Synergies of Ecosystem Services to Support the Decision-Making in the Beijing–Tianjin–Hebei Region. Land Use Policy 2021, 106, 105446. [Google Scholar] [CrossRef]
- Yang, Y.; Li, M.; Feng, X.; Yan, H.; Su, M.; Wu, M. Spatiotemporal Variation of Essential Ecosystem Services and Their Trade-off/Synergy along with Rapid Urbanization in the Lower Pearl River Basin, China. Ecol. Indic. 2021, 133, 108439. [Google Scholar] [CrossRef]
- Agudelo, C.A.R.; Bustos, S.L.H.; Moreno, C.A.P. Modeling Interactions among Multiple Ecosystem Services. A Critical Review. Ecol. Model. 2020, 429, 109103. [Google Scholar] [CrossRef]
- Hein, L.; Remme, R.P.; Schenau, S.; Bogaart, P.W.; Lof, M.E.; Horlings, E. Ecosystem Accounting in the Netherlands. Ecosyst. Serv. 2020, 44, 101118. [Google Scholar] [CrossRef]
- Belaire, J.A.; Higgins, C.; Zoll, D.; Lieberknecht, K.; Bixler, R.P.; Neff, J.L.; Keitt, T.H.; Jha, S. Fine-Scale Monitoring and Mapping of Biodiversity and Ecosystem Services Reveals Multiple Synergies and Few Tradeoffs in Urban Green Space Management. Sci. Total Environ. 2022, 849, 157801. [Google Scholar] [CrossRef]
- Jessop, J.; Spyreas, G.; Pociask, G.E.; Benson, T.J.; Ward, M.P.; Kent, A.D.; Matthews, J.W. Tradeoffs among Ecosystem Services in Restored Wetlands. Biol. Conserv. 2015, 191, 341–348. [Google Scholar] [CrossRef]
- Han, L.; Yang, M.L.; Liu, Z.; Zhao, Y.H.; Zhao, Z.L.; Zhang, Y.F. Ecosystem service tradeoffs and synergies in typical farmland conversion area of the Loess Plateau: Taking Yan’ an City as an example. Acta Ecol. Sin. 2022, 42, 8115–8125. (In Chinese) [Google Scholar] [CrossRef]
- Murali, R.; Suryawanshi, K.; Redpath, S.; Nagendra, H.; Mishra, C. Changing Use of Ecosystem Services along a Rural-Urban Continuum in the Indian Trans-Himalayas. Ecosyst. Serv. 2019, 40, 101030. [Google Scholar] [CrossRef]
- Xie, H.; Zhang, Y.; Choi, Y.; Li, F. A Scientometrics Review on Land Ecosystem Service Research. Sustainability 2020, 12, 2959. [Google Scholar] [CrossRef]
- Lyu, R.; Zhang, J.; Xu, M.; Li, J. Impacts of Urbanization on Ecosystem Services and Their Temporal Relations: A Case Study in Northern Ningxia, China. Land Use Policy 2018, 77, 163–173. [Google Scholar] [CrossRef]
- Shi, H.; Shao, M. Soil and Water Loss from the Loess Plateau in China. J. Arid Environ. 2000, 45, 9–20. [Google Scholar] [CrossRef]
- Sun, W.; Shao, Q.; Liu, J. Soil Erosion and Its Response to the Changes of Precipitation and Vegetation Cover on the Loess Plateau. J. Geogr. Sci. 2013, 23, 1091–1106. [Google Scholar] [CrossRef]
- Niu, L.; Shao, Q.; Ning, J.; Yang, X.; Liu, S.; Liu, G.; Zhang, X.; Huang, H. Evaluation on the degree and potential of ecological restoration in Loess Plateau. J. Nat. Resour. 2023, 38, 779. [Google Scholar] [CrossRef]
- Wu, D.; Zou, C.; Cao, W.; Xiao, T.; Gong, G. Ecosystem Services Changes between 2000 and 2015 in the Loess Plateau, China: A Response to Ecological Restoration. PLoS ONE 2019, 14, e0209483. [Google Scholar] [CrossRef] [PubMed]
- Chen, F.; Yuan, Y.; Zhang, R.; Qin, L. A Tree-Ring Based Drought Reconstruction (AD 1760–2010) for the Loess Plateau and Its Possible Driving Mechanisms. Glob. Planet. Chang. 2014, 122, 82–88. [Google Scholar] [CrossRef]
- Fu, B. Ecological and environmental effects of land-use changes in the Loess Plateau of China. Chin. Sci. Bull. 2022, 67, 3769–3779. [Google Scholar] [CrossRef]
- Wang, S.Q.; Liu, Y.X.; Li, Y.; Fu, B.J. Research progress on the ecosystem services on the Loess Plateau during the recent 20 years. Acta Ecol. Sin. 2023, 43, 26–37. (In Chinese) [Google Scholar] [CrossRef]
- Chen, J.; Chang, K.; Karacsonyi, D.; Zhang, X. Comparing Urban Land Expansion and Its Driving Factors in Shenzhen and Dongguan, China. Habitat Int. 2014, 43, 61–71. [Google Scholar] [CrossRef]
- Wang, J.; Zhou, W.; Pickett, S.T.A.; Yu, W.; Li, W. A Multiscale Analysis of Urbanization Effects on Ecosystem Services Supply in an Urban Megaregion. Sci. Total Environ. 2019, 662, 824–833. [Google Scholar] [CrossRef] [PubMed]
- Shao, Z.; Liu, C. The Integrated Use of DMSP-OLS Nighttime Light and MODIS Data for Monitoring Large-Scale Impervious Surface Dynamics: A Case Study in the Yangtze River Delta. Remote Sens. 2014, 6, 9359–9378. [Google Scholar] [CrossRef]
- Keola, S.; Andersson, M.; Hall, O. Monitoring Economic Development from Space: Using Nighttime Light and Land Cover Data to Measure Economic Growth. World Dev. 2015, 66, 322–334. [Google Scholar] [CrossRef]
- Chu, N.; Zhang, P.; Wu, X. Spatiotemporal Evolution Characteristics of Urbanization and Its Coupling Coordination Degree in Russia—Perspectives from the Population, Economy, Society, and Eco-Environment. Environ. Sci. Pollut. Res. 2022, 29, 61334–61351. [Google Scholar] [CrossRef]
- Luo, Q.; Zhou, J.; Zhang, Y.; Yu, B.; Zhu, Z. What Is the Spatiotemporal Relationship between Urbanization and Ecosystem Services? A Case from 110 Cities in the Yangtze River Economic Belt, China. J. Environ. Manag. 2022, 321, 115709. [Google Scholar] [CrossRef]
- Xiao, Y.; Zhong, J.-L.; Zhang, Q.-F.; Xiang, X.; Huang, H. Exploring the Coupling Coordination and Key Factors between Urbanization and Land Use Efficiency in Ecologically Sensitive Areas: A Case Study of the Loess Plateau, China. Sustain. Cities Soc. 2022, 86, 104148. [Google Scholar] [CrossRef]
- Wei, H.; Fan, W.; Ding, Z.; Weng, B.; Xing, K.; Wang, X.; Lu, N.; Ulgiati, S.; Dong, X. Ecosystem Services and Ecological Restoration in the Northern Shaanxi Loess Plateau, China, in Relation to Climate Fluctuation and Investments in Natural Capital. Sustainability 2017, 9, 199. [Google Scholar] [CrossRef]
- Potter, C.S.; Randerson, J.T.; Field, C.B.; Matson, P.A.; Vitousek, P.M.; Mooney, H.A.; Klooster, S.A. Terrestrial Ecosystem Production: A Process Model Based on Global Satellite and Surface Data. Glob. Biogeochem. Cycles 1993, 7, 811–841. [Google Scholar] [CrossRef]
- Kumar, M.; Sahu, A.P.; Sahoo, N.; Dash, S.S.; Raul, S.K.; Panigrahi, B. Global-Scale Application of the RUSLE Model: A Comprehensive Review. Hydrol. Sci. J. 2022, 67, 806–830. [Google Scholar] [CrossRef]
- Zhao, Y.; Pu, Y.; Lin, H.; Tang, R. Examining Soil Erosion Responses to Grassland Conversation Policy in Three-River Headwaters, China. Sustainability 2021, 13, 2702. [Google Scholar] [CrossRef]
- Jin, T.; Yan, L.; Wang, S.; Gong, J. Spatiotemporal Variation in Ecological Risk on Water Yield Service via Land-Use and Climate Change Simulations: A Case Study of the Ziwuling Mountainous Region, China. Front. Environ. Sci. 2022, 10, 908057. [Google Scholar] [CrossRef]
- Ureta, J.C.; Clay, L.; Motallebi, M.; Ureta, J. Quantifying the Landscape’s Ecological Benefits—An Analysis of the Effect of Land Cover Change on Ecosystem Services. Land 2020, 10, 21. [Google Scholar] [CrossRef]
- Wang, X.; Liu, G.; Lin, D.; Lin, Y.; Lu, Y.; Xiang, A.; Xiao, S. Water Yield Service Influence by Climate and Land Use Change Based on InVEST Model in the Monsoon Hilly Watershed in South China. Geomat. Nat. Hazards Risk 2022, 13, 2024–2048. [Google Scholar] [CrossRef]
- InVEST User Guide—InVEST Documentation. Available online: https://storage.googleapis.com/releases.naturalcapitalproject.org/invest-userguide/latest/en/index.html (accessed on 7 July 2023).
- Admasu, S.; Yeshitela, K.; Argaw, M. Assessing Habitat Quality Using the InVEST Model in the Dire and Legedadi Watersheds, Central Highland of Ethiopia: Implication for Watershed Management. Sustain. Environ. 2023, 9, 2242137. [Google Scholar] [CrossRef]
- Wei, L.; Zhou, L.; Sun, D.; Yuan, B.; Hu, F. Evaluating the Impact of Urban Expansion on the Habitat Quality and Constructing Ecological Security Patterns: A Case Study of Jiziwan in the Yellow River Basin, China. Ecol. Indic. 2022, 145, 109544. [Google Scholar] [CrossRef]
- Hu, T.; Dong, J.; Hu, Y.; Qiu, S.; Yang, Z.; Zhao, Y.; Cheng, X.; Peng, J. Stage Response of Vegetation Dynamics to Urbanization in Megacities: A Case Study of Changsha City, China. Sci. Total Environ. 2023, 858, 159659. [Google Scholar] [CrossRef] [PubMed]
- Bibri, S.E.; Krogstie, J. Smart Sustainable Cities of the Future: An Extensive Interdisciplinary Literature Review. Sustain. Cities Soc. 2017, 31, 183–212. [Google Scholar] [CrossRef]
- Huang, B.; Li, Z.; Dong, C.; Zhu, Z.; Zeng, H. The Effects of Urbanization on Vegetation Conditions in Coastal Zone of China. Prog. Phys. Geogr. Earth Environ. 2021, 45, 564–579. [Google Scholar] [CrossRef]
- Sun, L.; Chen, J.; Li, Q.; Huang, D. Dramatic Uneven Urbanization of Large Cities throughout the World in Recent Decades. Nat. Commun. 2020, 11, 5366. [Google Scholar] [CrossRef] [PubMed]
- Du, J.; Fu, Q.; Fang, S.; Wu, J.; He, P.; Quan, Z. Effects of Rapid Urbanization on Vegetation Cover in the Metropolises of China over the Last Four Decades. Ecol. Indic. 2019, 107, 105458. [Google Scholar] [CrossRef]
- Xue, D.; Wang, Z.; Li, Y.; Liu, M.; Wei, H. Assessment of Ecosystem Services Supply and Demand (Mis)Matches for Urban Ecological Management: A Case Study in the Zhengzhou–Kaifeng–Luoyang Cities. Remote Sens. 2022, 14, 1703. [Google Scholar] [CrossRef]
- Sun, J.; Han, M.; Kong, F.; Wei, F.; Kong, X. Spatiotemporal Analysis of the Coupling Relationship between Habitat Quality and Urbanization in the Lower Yellow River. IJERPH 2023, 20, 4734. [Google Scholar] [CrossRef]
- Tang, F.; Wang, L.; Guo, Y.; Fu, M.; Huang, N.; Duan, W.; Luo, M.; Zhang, J.; Li, W.; Song, W. Spatio-Temporal Variation and Coupling Coordination Relationship between Urbanisation and Habitat Quality in the Grand Canal, China. Land Use Policy 2022, 117, 106119. [Google Scholar] [CrossRef]
- Liang, Y.; Wang, B.; Hashimoto, S.; Peng, S.; Yin, Z.; Huang, J. Habitat Quality Assessment Provides Indicators for Socio-Ecological Management: A Case Study of the Chinese Loess Plateau. Environ. Monit. Assess. 2022, 195, 101. [Google Scholar] [CrossRef]
- Liu, Q.; Zhao, Y.; Zhang, X.; Buyantuev, A.; Niu, J.; Wang, X. Spatiotemporal Patterns of Desertification Dynamics and Desertification Effects on Ecosystem Services in the Mu Us Desert in China. Sustainability 2018, 10, 589. [Google Scholar] [CrossRef]
- Su, C.; Fu, B. Evolution of Ecosystem Services in the Chinese Loess Plateau under Climatic and Land Use Changes. Glob. Planet. Chang. 2013, 101, 119–128. [Google Scholar] [CrossRef]
- Hao, R.; Yu, D.; Wu, J. Relationship between Paired Ecosystem Services in the Grassland and Agro-Pastoral Transitional Zone of China Using the Constraint Line Method. Agric. Ecosyst. Environ. 2017, 240, 171–181. [Google Scholar] [CrossRef]
- Zhang, T.; Gao, Y.; Li, C.; Xie, Z.; Chang, Y.; Zhang, B. How Human Activity Has Changed the Regional Habitat Quality in an Eco-Economic Zone: Evidence from Poyang Lake Eco-Economic Zone, China. IJERPH 2020, 17, 6253. [Google Scholar] [CrossRef] [PubMed]
- Zhu, C.; Zhang, X.; Zhou, M.; He, S.; Gan, M.; Yang, L.; Wang, K. Impacts of Urbanization and Landscape Pattern on Habitat Quality Using OLS and GWR Models in Hangzhou, China. Ecol. Indic. 2020, 117, 106654. [Google Scholar] [CrossRef]
- Peng, X.; Shi, D.; Guo, H.; Jiang, D.; Wang, S.; Li, Y.; Ding, W. Effect of Urbanisation on the Water Retention Function in the Three Gorges Reservoir Area, China. CATENA 2015, 133, 241–249. [Google Scholar] [CrossRef]
- Li, C.; Sun, G.; Caldwell, P.V.; Cohen, E.; Fang, Y.; Zhang, Y.; Oudin, L.; Sanchez, G.M.; Meentemeyer, R.K. Impacts of Urbanization on Watershed Water Balances Across the Conterminous United States. Water Resour. Res. 2020, 56, e2019WR026574. [Google Scholar] [CrossRef]
- Xu, J.; Liu, S.; Zhao, S.; Wu, X.; Hou, X.; An, Y.; Shen, Z. Spatiotemporal Dynamics of Water Yield Service and Its Response to Urbanisation in the Beiyun River Basin, Beijing. Sustainability 2019, 11, 4361. [Google Scholar] [CrossRef]
- Kim, H.; Shoji, Y.; Tsuge, T.; Aikoh, T.; Kuriyama, K. Understanding Services from Ecosystem and Facilities Provided by Urban Green Spaces: A Use of Partial Profile Choice Experiment. For. Policy Econ. 2020, 111, 102086. [Google Scholar] [CrossRef]
- Xiu, L.; Yao, X.; Chen, M.; Yan, C. Effect of Ecological Construction Engineering on Vegetation Restoration: A Case Study of the Loess Plateau. Remote Sens. 2021, 13, 1407. [Google Scholar] [CrossRef]
- Jato-Espino, D.; Capra-Ribeiro, F.; Moscardó, V.; Bartolomé Del Pino, L.E.; Mayor-Vitoria, F.; Gallardo, L.O.; Carracedo, P.; Dietrich, K. A Systematic Review on the Ecosystem Services Provided by Green Infrastructure. Urban For. Urban Green. 2023, 86, 127998. [Google Scholar] [CrossRef]
- Cheng, Y.; Kang, Q.; Liu, K.; Cui, P.; Zhao, K.; Li, J.; Ma, X.; Ni, Q. Impact of Urbanization on Ecosystem Service Value from the Perspective of Spatio-Temporal Heterogeneity: A Case Study from the Yellow River Basin. Land 2023, 12, 1301. [Google Scholar] [CrossRef]
- Zhou, D.; Tian, Y.; Jiang, G. Spatio-Temporal Investigation of the Interactive Relationship between Urbanization and Ecosystem Services: Case Study of the Jingjinji Urban Agglomeration, China. Ecol. Indic. 2018, 95, 152–164. [Google Scholar] [CrossRef]


| Data Type | Data Format | Data Source | Spatial Resolution |
|---|---|---|---|
| Land use/Land cover | Raster | Resource and Environment Science and Data Center (http://www.resdc.cn/ accessed on 3 November 2022) | 1 km |
| Precipitation | Raster | National Earth System Science Data Center, National Science & Technology Infrastructure of China (http://www.geodata.cn accessed on 5 Decemeber 2022) | 1 km |
| Evapotranspiration | Raster | National Earth System Science Data Center, National Science & Technology Infrastructure of China (http://www.geodata.cn accessed on 5 Decemeber 2022) | 1 km |
| Digital elevation model (DEM) | Raster | Resource and Environment Science and Data Center (http://www.resdc.cn/ accessed on 3 November 2022) | 90 m |
| Normalized difference vegetation index (NDVI) | Raster | Resource and Environment Science and Data Center (http://www.resdc.cn/ accessed on 20 Decemeber 2022) | 1 km |
| Depth to bedrock | Raster | (http://globalchange.bnu.edu.cn/research/cdtb.jsp accessed on 16 January 2023) | 1 km |
| Soil texture | Raster | China soil map-based harmonized world soil database (HWSD) (v1.1) (http://data.tpdc.ac.cn/zh-hans/data/611f7d50-b419-4d14-b4dd-4a944b141175/ accessed on 16 January 2023) | 1 km |
| Population density | Raster | WorldPop (https://www.worldpop.org/datacatalog/ accessed on 25 February 2023) | 1 km |
| Night lighting data | Raster | (https://data.tpdc.ac.cn/zh-hans/data/e755f1ba-9cd1-4e43-98ca-cd081b5a0b3e accessed on 28 February 2023) | 1 km |
| Road | Shapefile | OpenStreetMap data (https://www.openstreetmap.org accessed on 28 February 2023) | 1 km |
| Urbanization Areas | Classification Criteria |
|---|---|
| Developed urban area | CUL in 2000 > 0.12, CUL in 2020 > 0.12 |
| Developing urban area | CUL in 2000 < 0.12, CUL in 2020 > 0.12 |
| Rural area | CUL in 2000 < 0.12, CUL in 2020 < 0.12 |
Disclaimer/Publisher’s Note: The statements, opinions and data contained in all publications are solely those of the individual author(s) and contributor(s) and not of MDPI and/or the editor(s). MDPI and/or the editor(s) disclaim responsibility for any injury to people or property resulting from any ideas, methods, instructions or products referred to in the content. |
© 2023 by the authors. Licensee MDPI, Basel, Switzerland. This article is an open access article distributed under the terms and conditions of the Creative Commons Attribution (CC BY) license (https://creativecommons.org/licenses/by/4.0/).
Share and Cite
Liu, J.; Wang, H.; Tang, B.; Hui, L.; Zhang, W.; Zhang, L.; Jiao, L. Analysis of Temporal and Spatial Dynamics of Ecosystem Services and Trade-Offs/Synergies during Urbanization in the Loess Plateau, China. Land 2023, 12, 2136. https://doi.org/10.3390/land12122136
Liu J, Wang H, Tang B, Hui L, Zhang W, Zhang L, Jiao L. Analysis of Temporal and Spatial Dynamics of Ecosystem Services and Trade-Offs/Synergies during Urbanization in the Loess Plateau, China. Land. 2023; 12(12):2136. https://doi.org/10.3390/land12122136
Chicago/Turabian StyleLiu, Jiamin, Hao Wang, Butian Tang, Le Hui, Weijuan Zhang, Liwei Zhang, and Lei Jiao. 2023. "Analysis of Temporal and Spatial Dynamics of Ecosystem Services and Trade-Offs/Synergies during Urbanization in the Loess Plateau, China" Land 12, no. 12: 2136. https://doi.org/10.3390/land12122136
APA StyleLiu, J., Wang, H., Tang, B., Hui, L., Zhang, W., Zhang, L., & Jiao, L. (2023). Analysis of Temporal and Spatial Dynamics of Ecosystem Services and Trade-Offs/Synergies during Urbanization in the Loess Plateau, China. Land, 12(12), 2136. https://doi.org/10.3390/land12122136