Article

Detection of Construction and Demolition Illegal Waste Using Photointerpretation of DEM Models of LiDAR Data

by
Manuel Sánchez-Fernández
1,*,
Lorea Arenas-García
2 and
José Antonio Gutiérrez Gallego
1
1
INTERRA (University Institute of Research for Sustainable Territorial Development), Avda. de la Universidad s/n, 10003 Cáceres, Spain
2
Departamento de Derecho Público, Facultad de Derecho, Universidad de Extremadura, Avda. de la Universidad s/n, 10004 Cáceres, Spain
*
Author to whom correspondence should be addressed.
Land 2023, 12(12), 2119; https://doi.org/10.3390/land12122119
Submission received: 26 September 2023 / Revised: 22 November 2023 / Accepted: 27 November 2023 / Published: 29 November 2023

Abstract

:
Illegal waste is a global problem with negative impacts on human health and the environment. This article focuses on detection using remote sensing of sites of demolition and construction waste. We hypothesise that construction and demolition waste represent a human modification of terrain and, as a result, will be sensible to detection using visualisation models of terrain, specifically DEM (digital elevation model). To this effect, we start with a DEM of 0.25 m per pixel developed using data from the second iteration of the PNOA LiDAR project by the Spanish National Geographic Institute (IGN). We evaluate seven modelling tools of the Relief Visualisation Toolbox (RVT) for the visual detection of waste. The study area includes the city of Mérida (Extremadura, Spain). Our fieldwork identified 494 points of illegal waste in this area. These points were classified according to five categories in relation to land use, and we established a total of 14 areas with a surface area of 450 m by 450 m. Our results suggest that three of the seven models employed allow us to differentiate with clarity what is anthropic from the natural terrain and, in some scenarios, the location of construction and demolition waste. The LD model was the one with the best results, allowing an increase in the number of locations of illegal dumping of CDW in the study area.

1. Introduction

Illegal landfills, due to ineffective waste management in many countries, represent an environmental and global threat [1,2]. The intentional abandonment of waste in unauthorized public or private places [3] is a common practice with impacts on human and environmental health. Illegally dumped materials often contain construction waste (e.g., drywall, tiles, wood, bricks, concrete, appliances, tires, and household garbage) due to urban sprawl [2]. In the region of Extremadura, as in other areas of Spain, its presence is very common in fields, roads, and ditches. In 2015, the European Commission denounced Spain (infringement n.2015/2192) based on a preliminary investigation into the presence of illegal landfills of inert waste, 133 of which were located in Extremadura. The lack of control motivated the creation of the Integrated Waste Plan of Extremadura or PIREX (2016–2022) resulting from PEMAR (State Waste Framework Plan 2016–2022) [4,5]. The main aim, according to this plan, “is to comply with the community and national objectives applicable to waste prevention and the specific ones aimed at the treatment of household waste and construction and demolition waste (CDW)” ([4], p. 6). PIREX refers, in particular, to construction and demolition waste because: “its uncontrolled dumping must be avoided by transferring it to approved facilities for proper treatment” ([4], p. 7).
Indeed, in Spain, the scientific evidence in this regard is scarce. Scientific studies carried out in Spain, mainly in the fields of geography and engineering, highlight the presence of 1700 uncontrolled dumping points in Andalusia [6,7,8,9] and 439 in the Canary Islands [10]. According to Jordá-Borrell et al. ([7], p. 158), “illegal landfills are visible less than 500m from any rural road (93.18%) and the main type of waste comes from construction and demolition (60% of the total)”. However, today we still do not know the exact location of these spill deposits nor do we have tools capable of automatically detecting them.
This article focuses on the detection of construction and demolition waste (CDW) sites using remote-sensing techniques in the urban and semiurban areas of Mérida city (Spain). There are a variety of approaches that have been deployed in the study of CDW. Du et al. carried out a critical review of the different aspects covered by this growing body of literature, such as the identification of possible ground contaminants, the control and monitoring of waste, the detection of waste sites, or how different policies and systems may improve decision making and the management of different kinds of waste [11].
Regarding the location or the geography of waste, the scientific contributions can be broadly classified into two groups: studies oriented to the probabilistic prediction of waste in a given location [7,12,13,14,15] and studies focused on trying to identify existing waste sites [16,17,18,19,20]. The cited studies use spatial data and remote-sensing approaches with GIS. Padubidri et al. [21] propose a methodology for identifying illegal waste through aerial orthophotography using deep learning. Their results suggest a deficit in available information for training and testing and the need to train the model with a classifier using synthetic images. Other authors [22,23] use different classifiers, integrating data from different sources, such as spectral information, aerial orthophotography, spectral and geometrical indices, etc. In this line, Nomaticola et al. [24] carried out an analysis directly over maps generated using multispectral information derived from satellite sensors, orthophotography, and maps of land cover. The various studies conducted suggest that the detected waste sites are often located in areas in which there have been historic waste sites and anthropic zones linked with communication routes and urban development. The studies use land-cover maps to verify the existence or not of illegal dumping with respect to land use.
Our study proposes a methodology for the detection of CDW using geometric indicators obtained through a digital elevation model (DEM). We assume that CDW gets recorded as a topographical singularity in the terrain. The geometric indicators employed are those included in the Relief Visualisation Toolbox (RVT). These tools have been implemented in other disciplines, such as archaeology, with the aim of representing structures hidden in the terrain that provoke a punctual modification of such terrain, generating depressions or mounds [25,26,27,28,29].

2. Study Area

Factors such as the number of inhabitants of a population centre, degree of urban development, orography, and fluvial or coastal influence affect social customs and, therefore, the habits regarding the deposit of waste. Our study focuses on the Spanish city of Mérida (Figure 1) and its surrounding area, covering page 777 of the distribution of pages of scale 50,000 of the Spanish National Geographic Institute (IGN), with a total surface of 576.44 km2. Mérida is the administrative and political capital of Extremadura, one of the 17 regions that divide Spain in a quasi-federal system. The municipality of Mérida is a small city of 59,234 inhabitants, with a density of 68.41 inhabitants per square kilometre. It is located at the intersection of the two main highways of Extremadura (A-5 and A-6). The population grew by 20% in the first decade of the 2000s, and that factor conditioned the process of urbanization. The study area also includes other smaller municipalities, locally connected, in an economic and social sense, to Mérida. Some of these can be described as commuter or dormitory municipalities in relation to Mérida. This dependency implies a daily transit flow of people and professionals between Mérida and these locations. The orography of the area is predominantly plain, marked by the river Guadiana and various water reservoirs. Nevertheless, within the study area, there are some mountain ranges, including the zone of Valverde de Merida, the Cabrerizas mountain range (near Arroyo de San Serván), and part of the Natural Park of Cornalvo (Figure 1).
In an earlier stage of the broader research project encompassing this study, we identified the location of illegal sites of CDW through systematic fieldwork of the urban and, particularly, periurban zone of Mérida. This fieldwork allowed for the direct visual identification of 494 locations that were visited, geocoded and photographed by our researchers. The sites are typically located in nonbuilt land plots, nonconsolidated urbanisations, or in the margins of rural pathways and plots; 84.4% of the localised waste sites identified were located in 14 areas of 450 m by 450 m (Figure 2). These locations have been classified according to land use into five classes:
  • Type A. Plots in nonurban land (three locations). Rural or rustic plots in the middle of which we find illegal CDW. Here we find two types, plots that prior to 2011 were used as illegal waste sites and plots with a natural terrain topography;
  • Type B. Connection zones of urban and nonurban land (four locations). For example, residences directly attached to rural plots;
  • Type C. Rural pathways located in nonurban land (three locations).
  • Type D. Urbanised land (three locations). Nonconsolidated urbanisations in which there are plots that have yet to be developed;
  • Type E. Urban land (one location).
Figure 2. Locations where fieldwork identified CDW.
Land 12 02119 g002

3. Materials and Methods

This study proposes a methodology for the detection of CDW using photointerpretation of the data set obtained through a digital elevation model. The calculated data emphasise the topographic characteristics of terrain at a large scale. The size of the waste is an important factor for this research. The dimension of waste can vary significantly in size in various dimensions (width, height, and length), from 50 cm to various meters. This fact requires us to use digital elevation models with a spatial resolution capable of identifying waste deposits of the smaller dimension. In Figure 3, we show examples of the observed waste in different types of terrain.
Figure 4 shows the workflow followed for the study. For the development of the digital elevation model, we used the point clouds available for the project PNOA LiDAR, the second coverage of IGN. According to the technical specifications of the product, the resolution of the LIDAR product employed is 1 point/m2. The point cloud is classified into 12 classes, of which the second class corresponds with the points on the “ground” [30]. Starting with these points classified as “ground” we obtain a DEM in raster format using a linear interpolation. The size of the pixel in this raster is 0.25 m. For the DEM calculations from the LiDAR point cloud, the WIS ArcMap, software version 10.5, has been used. First, the TIN derived from the point cloud was obtained using the LAS to TIN algorithm and by using TIN to Raster; the DTM was obtained from which the calculations were carried out using the RVT software, version 2.2.1.
The DEM allows us to obtain seen models with different characteristics of the terrain. The models have been estimated using Relief Visualisation Toolbox software, version 2.2.1. The results highlight slopes, shades, and other attributes of the terrain. This allows us to visually assess the topographic particularities of the terrain at a large scale. When using the RVT, we have followed the considerations made by various authors and the software instructions for the parameters used in the calculations [31,32,33,34]. Below, we describe the tools used:
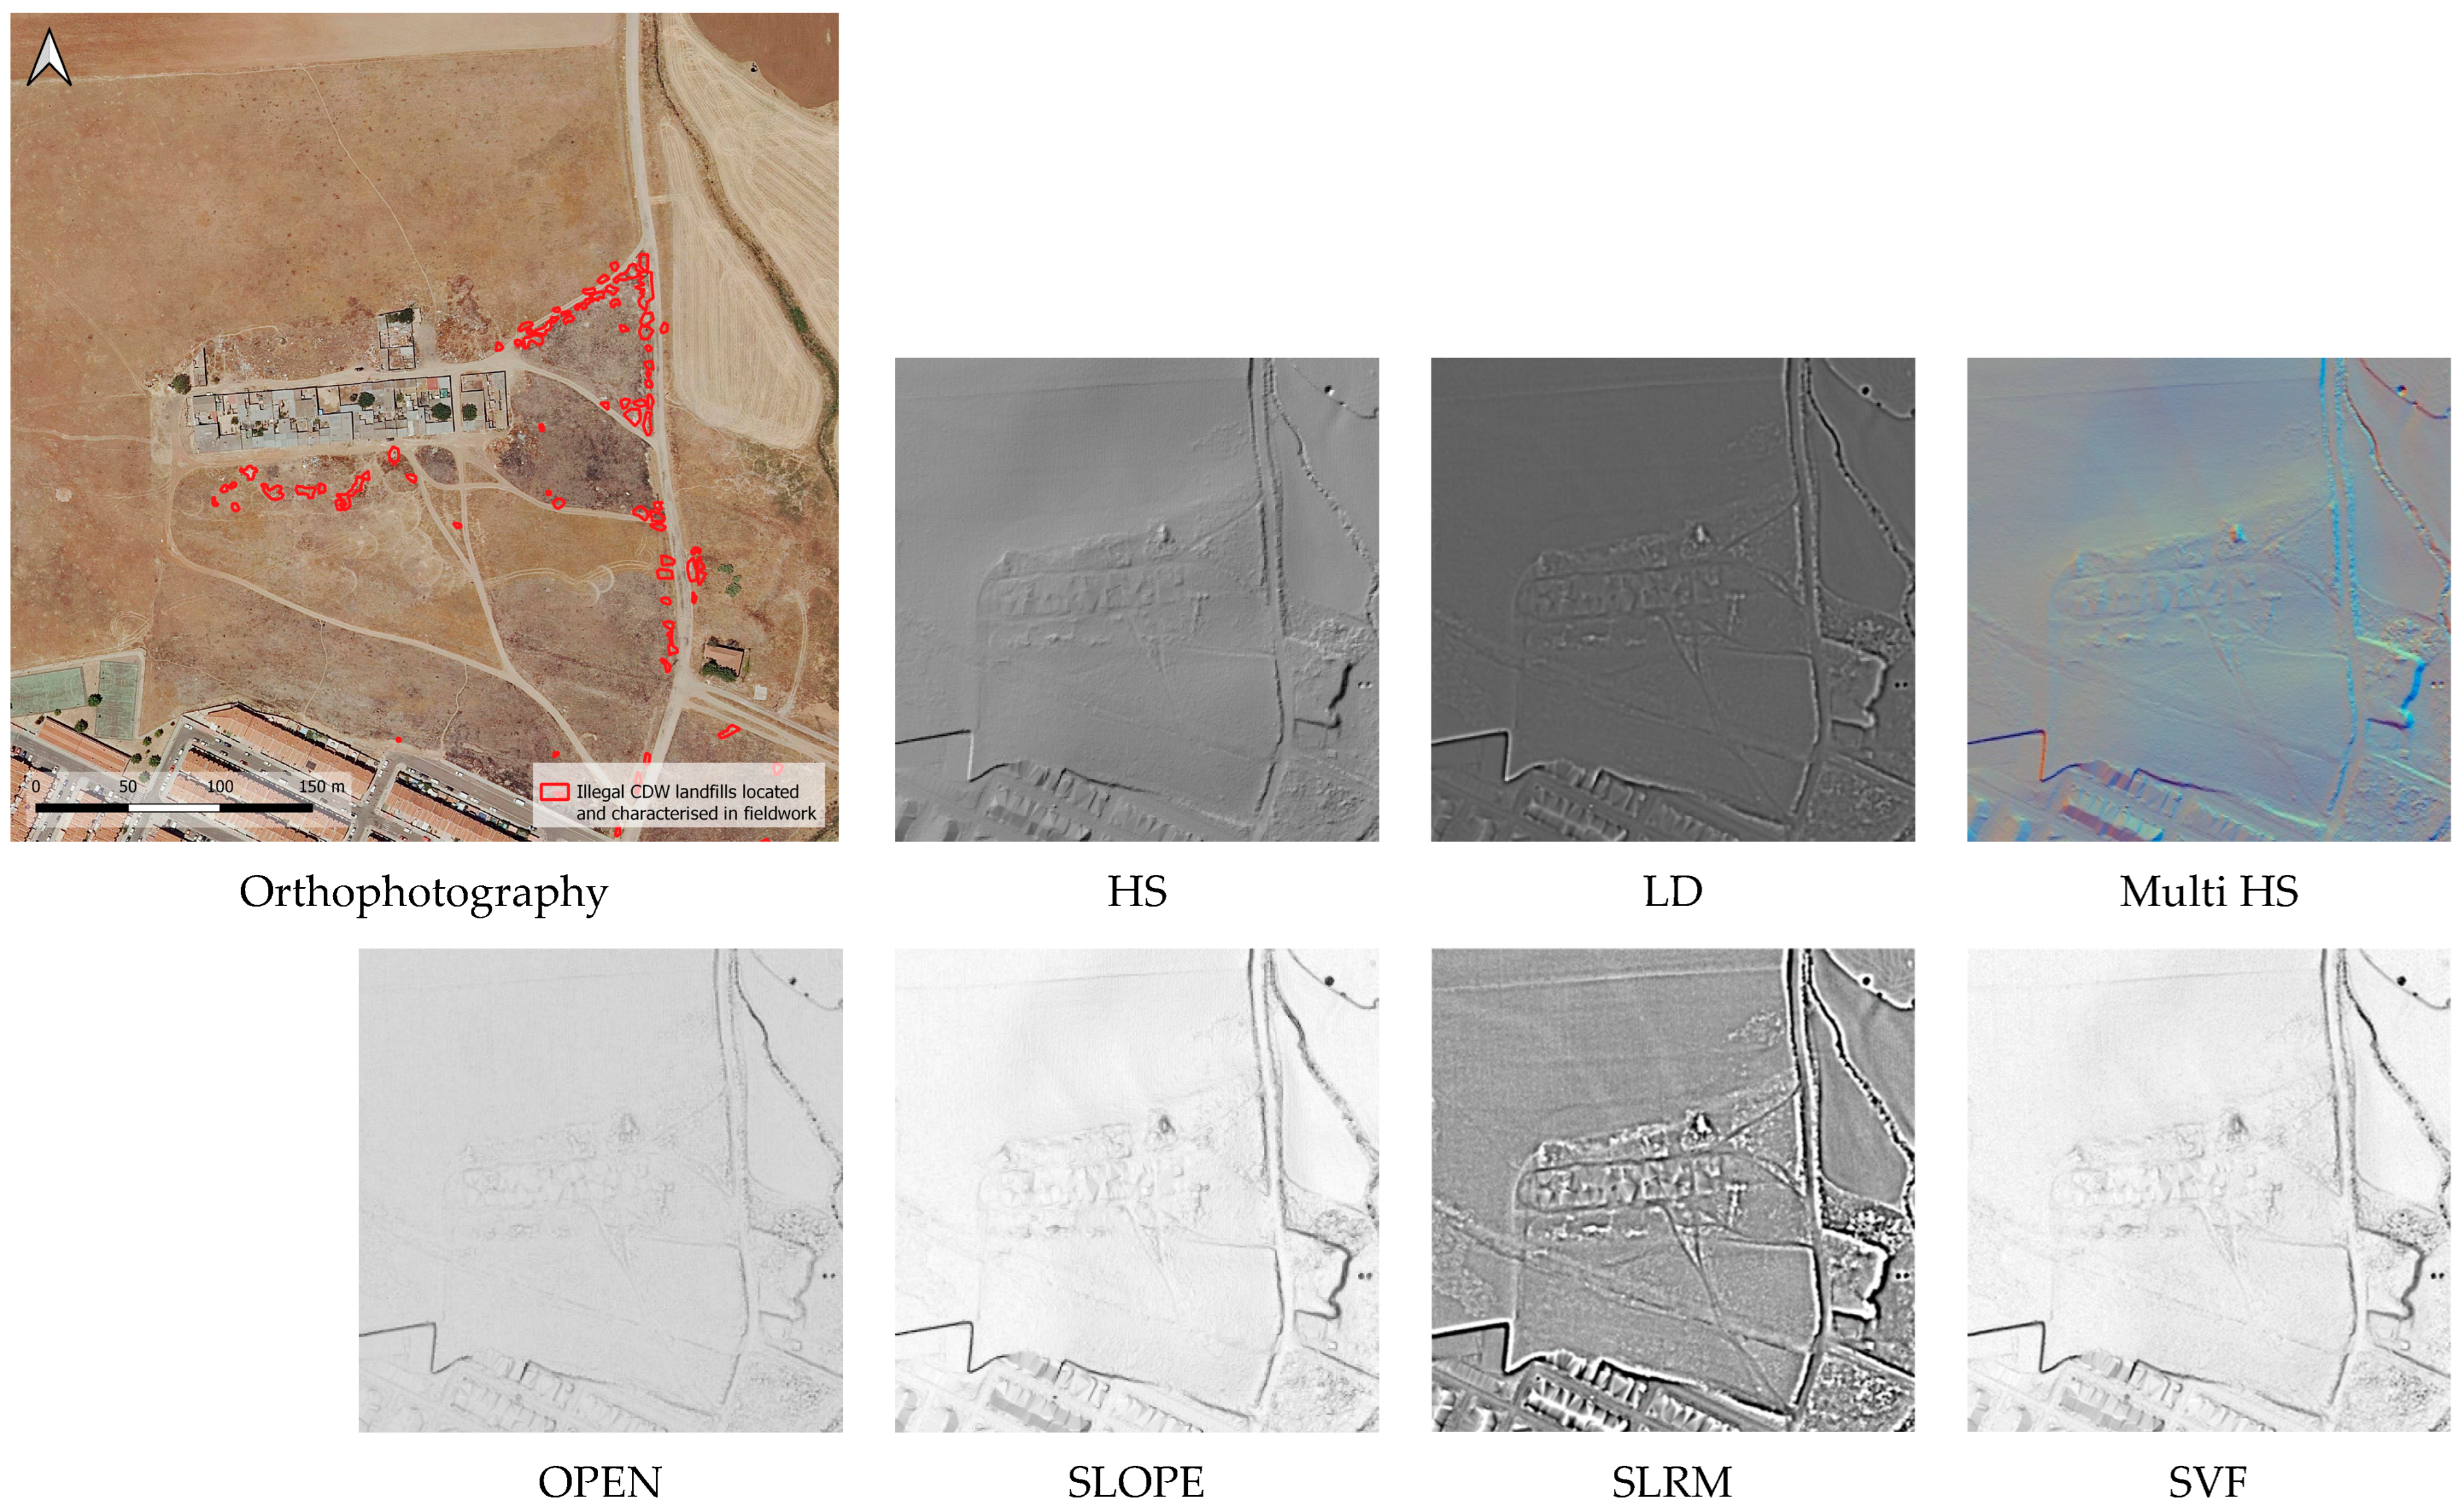
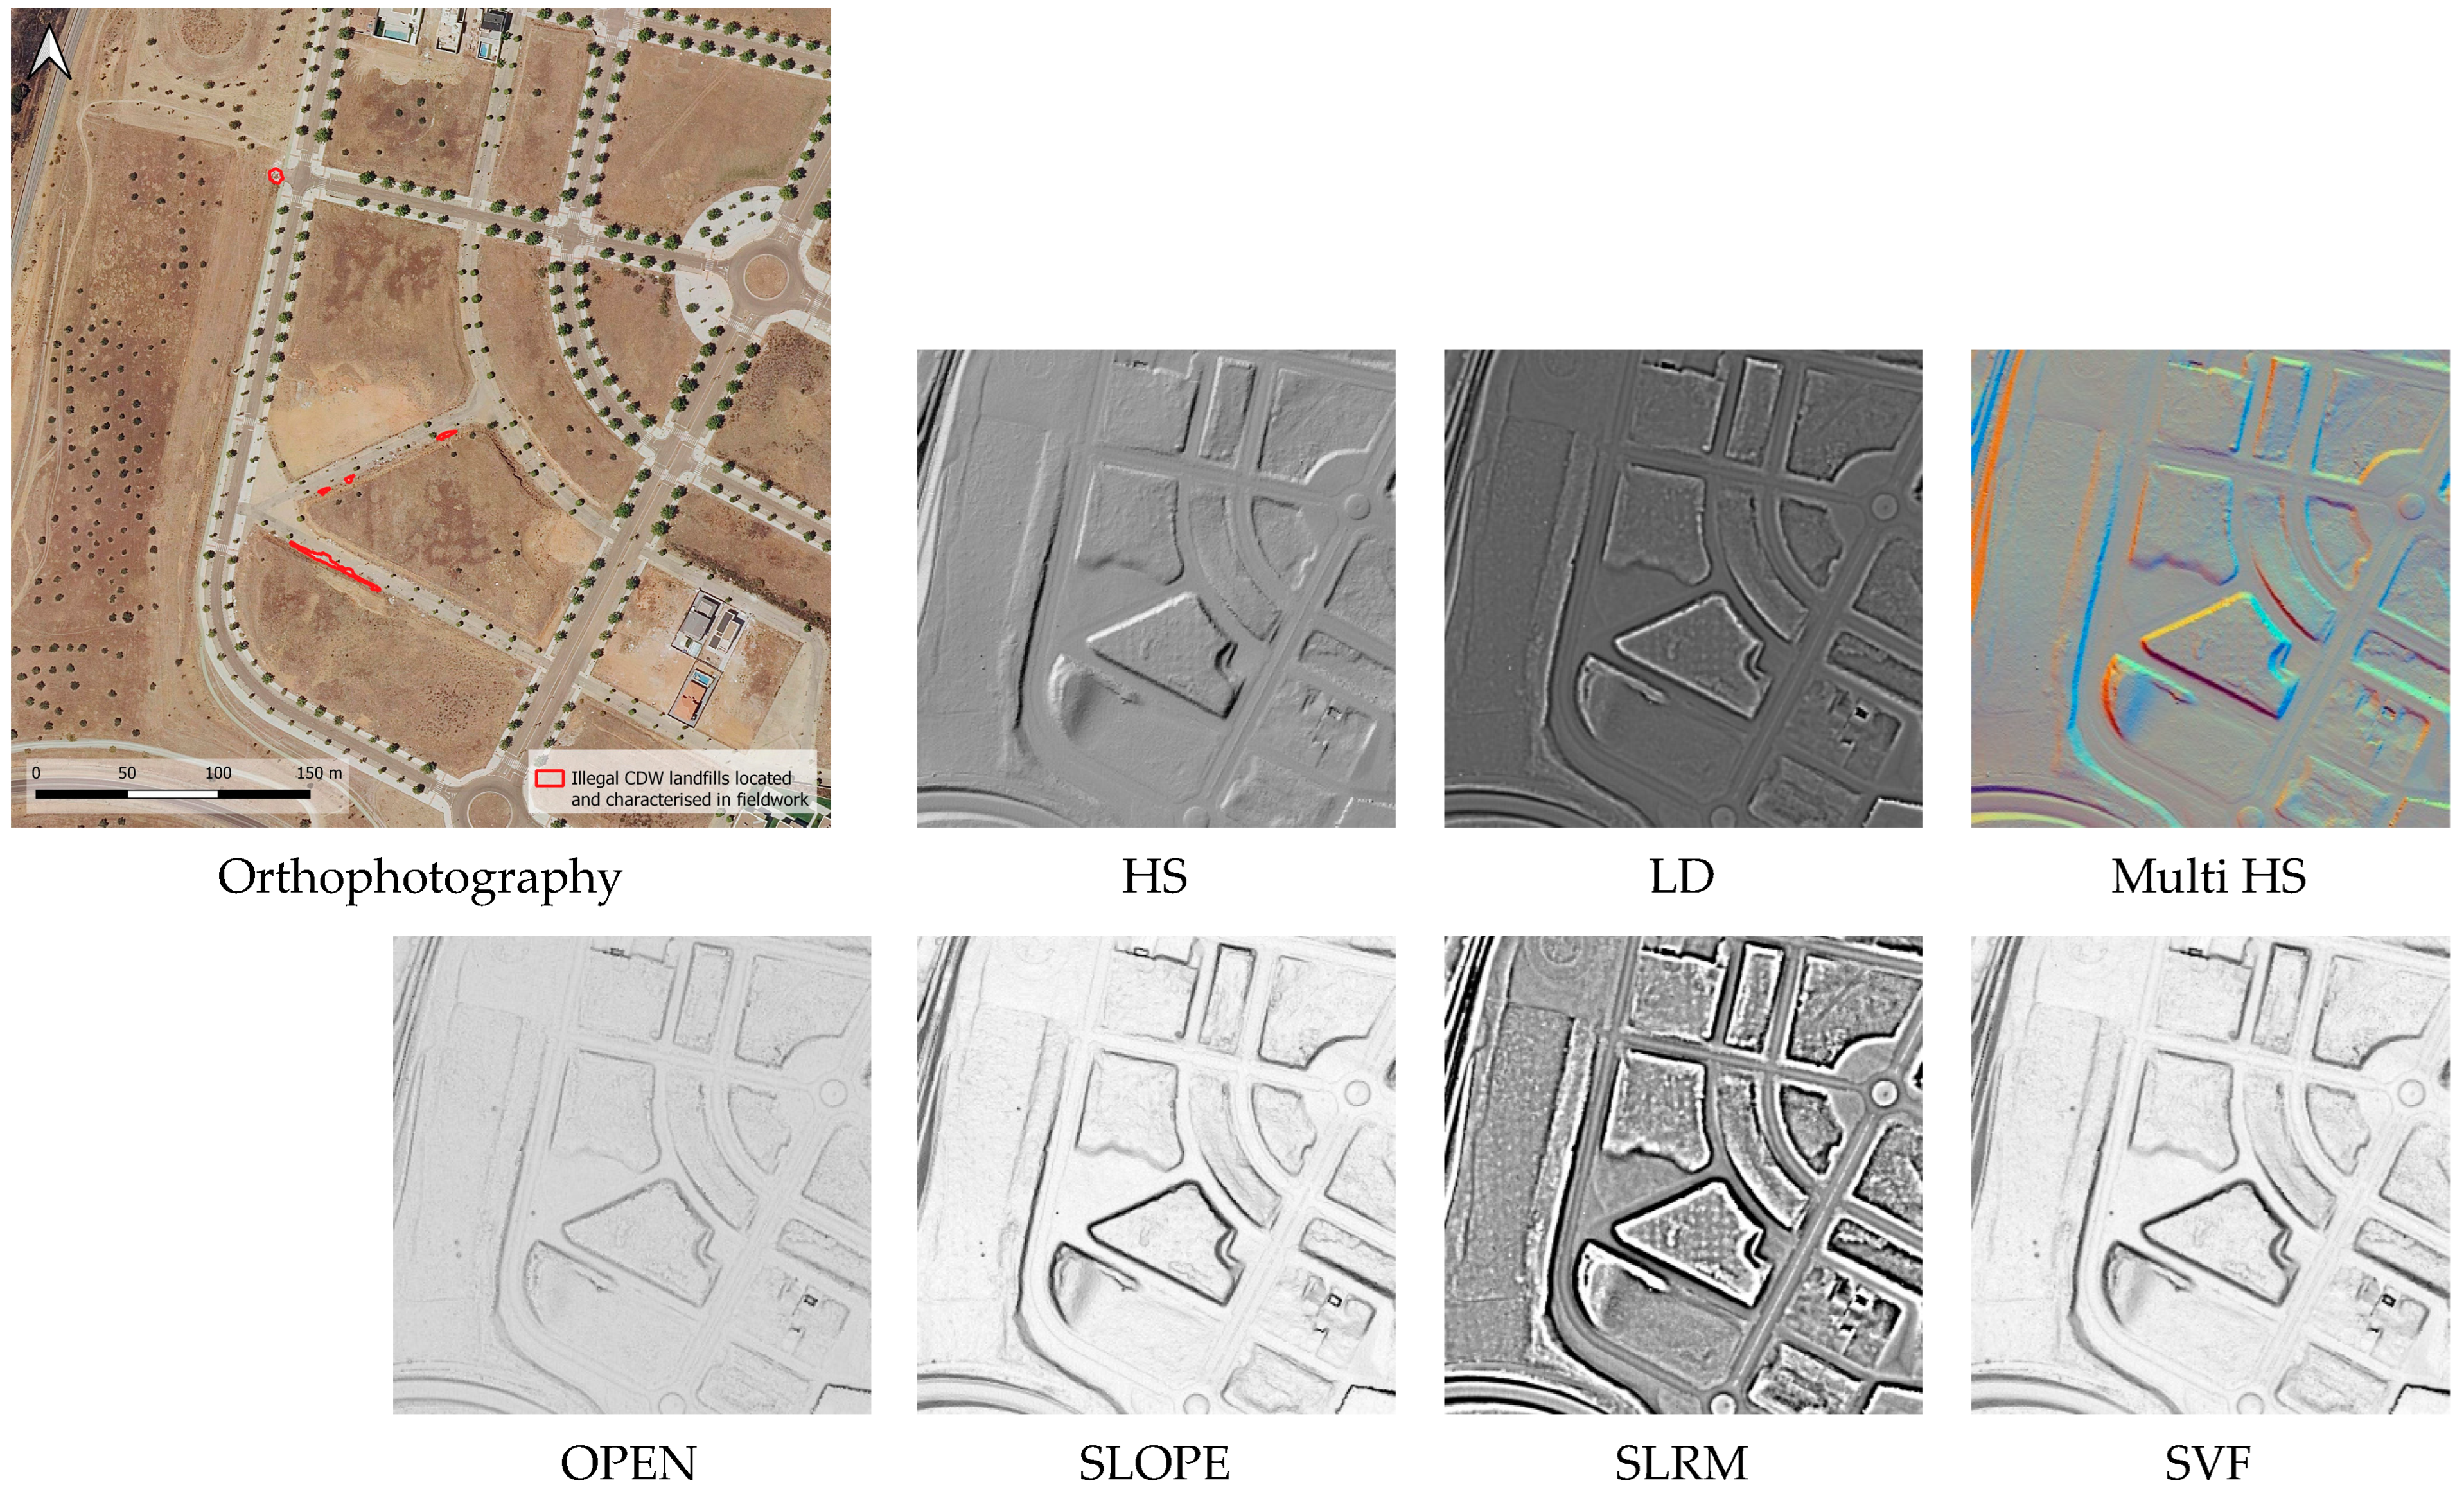
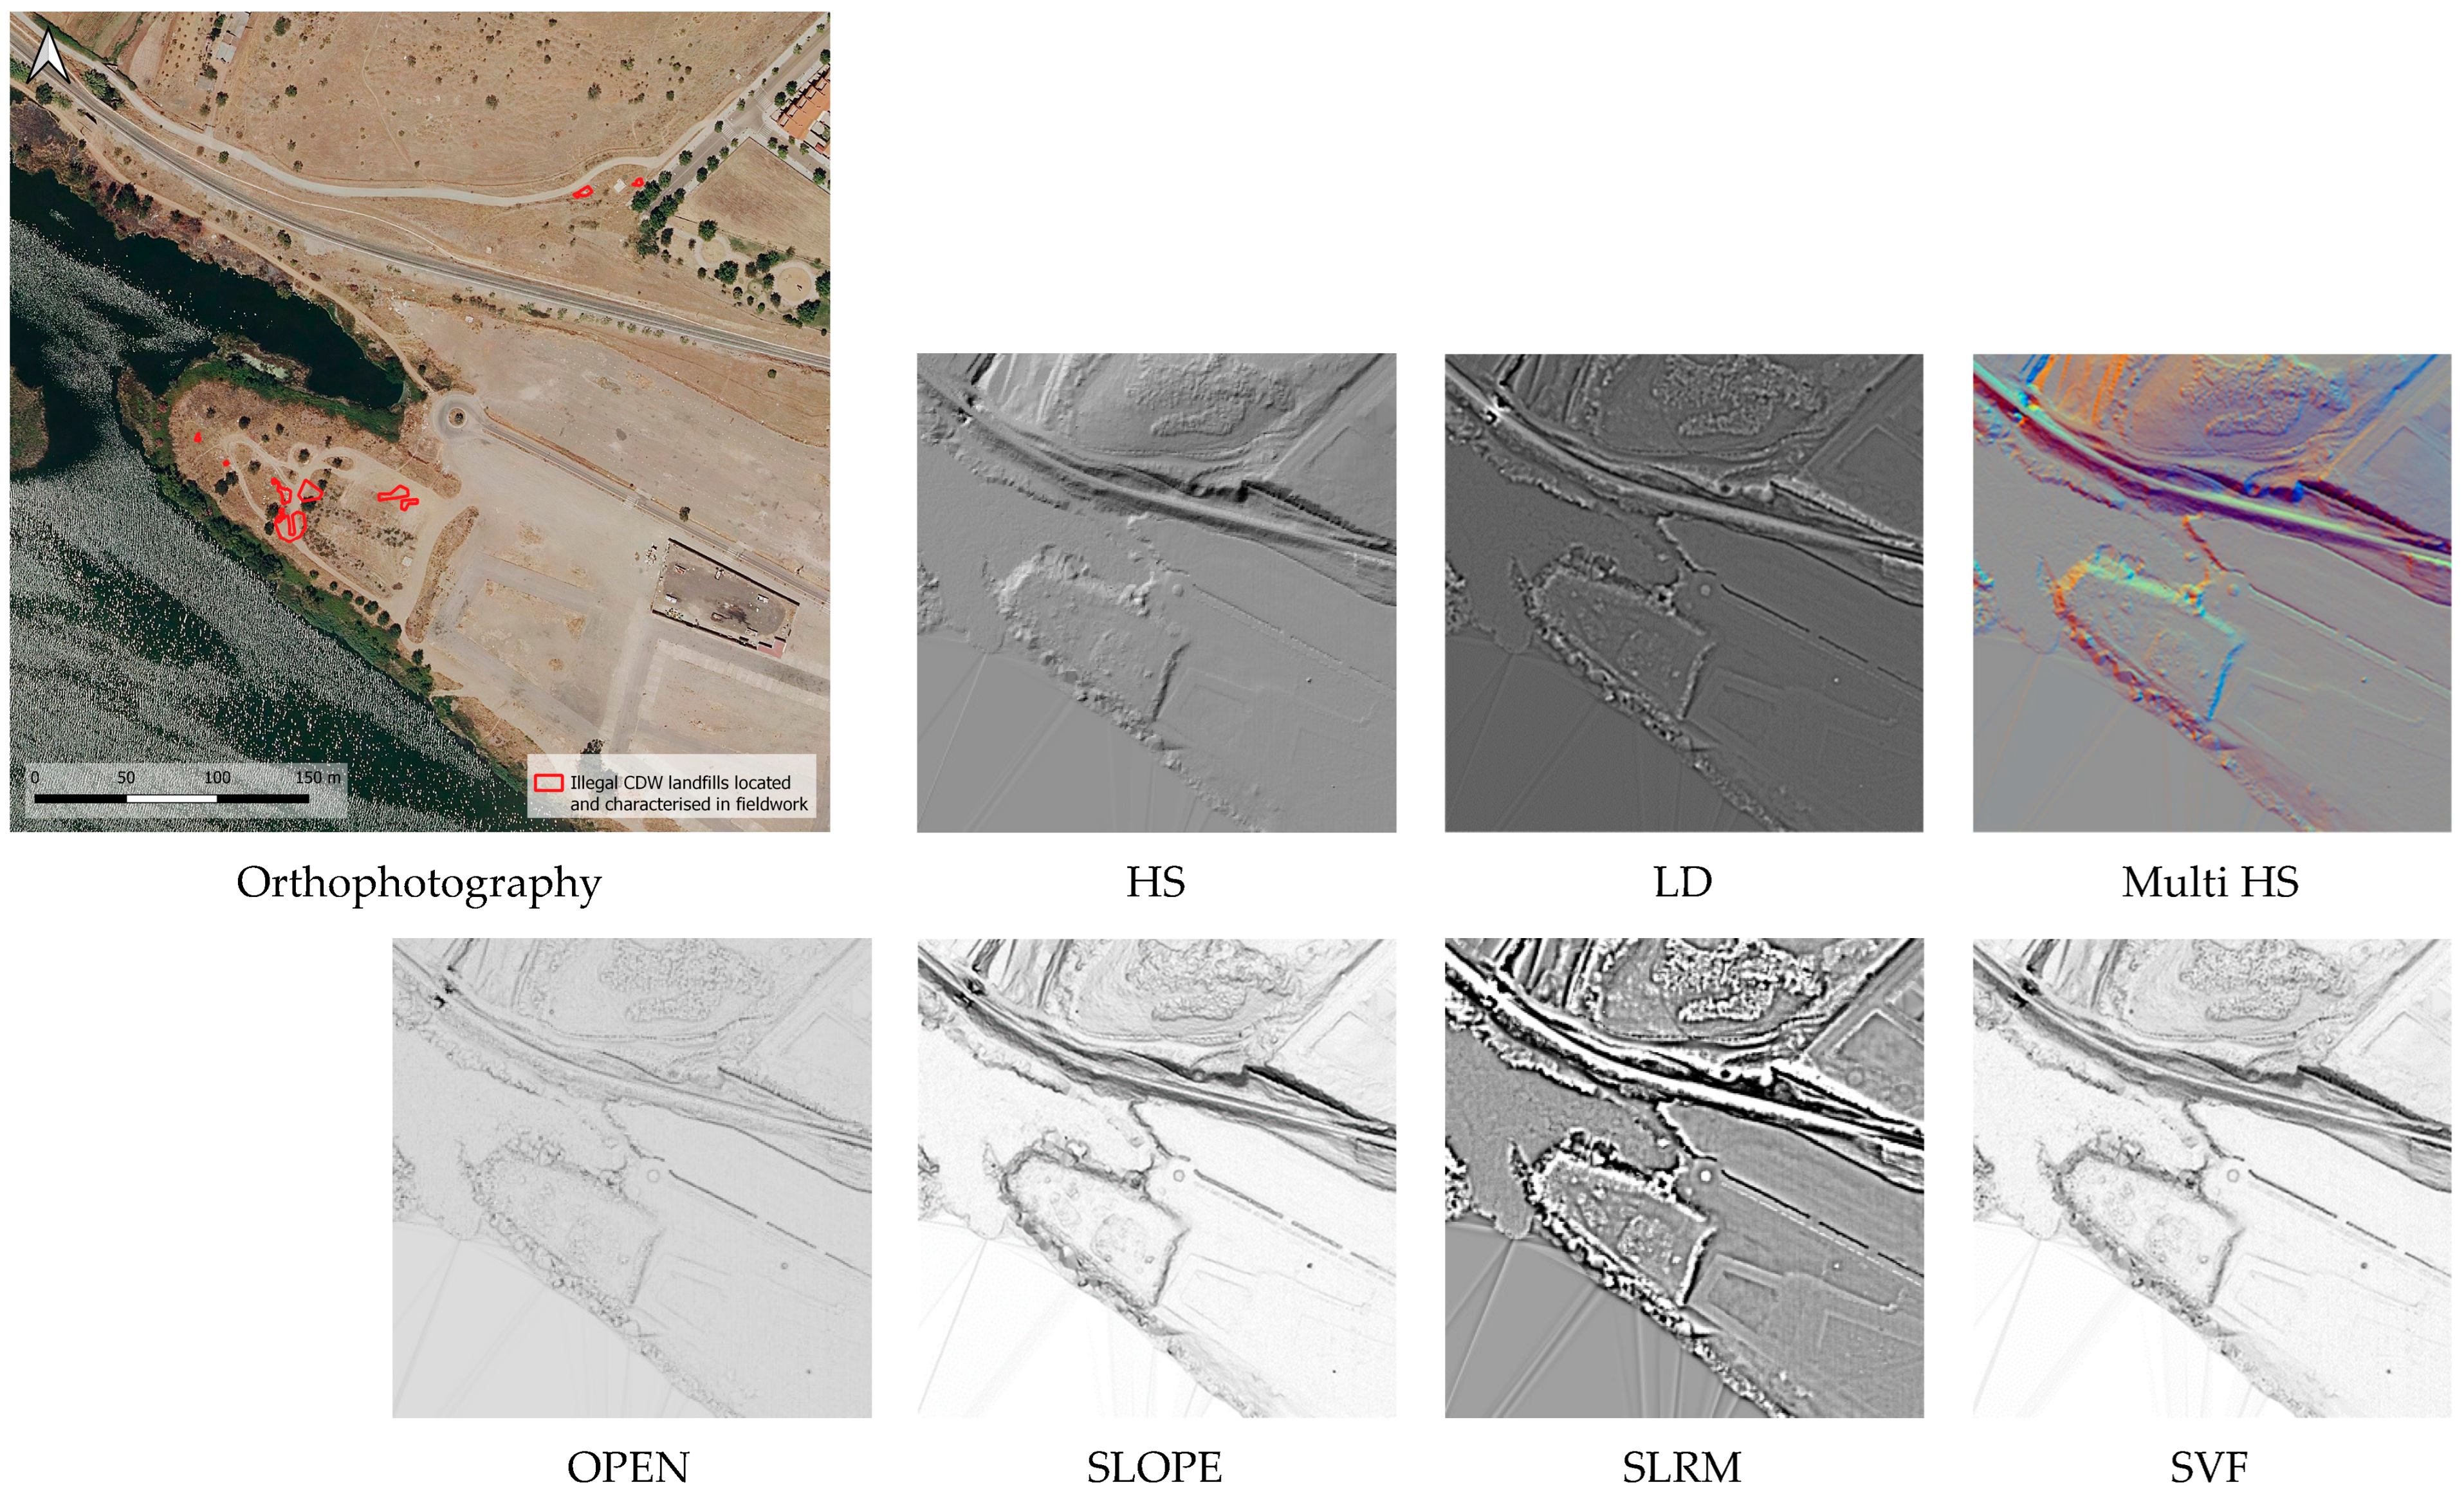
  • Analytical hillshading (HS). It allows for observation of the terrain using shades generated by an illumination pattern with a determined direction and elevation (the parameters used were Sun azimuth 315° and Sun elevation angle 35°);
  • Hillshading from multiple directions (Multi HS). It is a development of analytical hillshading. This tool calculates the illuminated zones and shades in multiple directions and carries out an RGB representation of the calculated shaded patterns. In this case, we carried out the calculations for 16 directions (the parameters used were 15 directions and Sun elevation angle 35°);
  • Slope gradient (SLOPE). It represents the maximum rate of change between each cell and its neighbours. When presented in an inverted greyscale, the more pronounced slopes are darker;
  • Simple local relief model (SLRM). This tool eliminates all morphological elements at large scale (hills, valleys, etc.) from the data so that only traits at a large scale remain (used parameters were 16 pixels of radius for the trend assessment);
  • Sky-view factor (SVF). It is a proxy for diffuse illumination and measures the proportion of visible sky from a particular point. In an SVF image, elevations are highlighted and appear in clear to white colours, and the depressions are in dark colours (the parameters used were 16 search directions and 10 pixels for the search radium).
  • Openness positive (OPEN). The average value of all the zenith angles results in a positive openness, whereas the average value of the nadir results in a negative openness (same parameters as those used for SVF)
  • Local dominance (LD). This tool offers good results in the representation of topographic formations with a difference in level, such as a hill or a gap in the terrain (the used parameters were a minimum radius of 16 pixels and a maximum radius of 25 pixels).
Using these seven tools, we analyse how the waste sites were represented. The analysis is oriented to ascertain whether it is possible to visually identify the waste sites and to identify and characterise the types of terrain in which they are located.
In relation to the results obtained in the initial analysis, the LD model has been used for the evaluation of the existence of waste on the surface of map sheet 777, established as the study area. Using photointerpretation, we marked the areas that, according to the LD model, could be CDW. To optimise the analysis using this procedure, we divided the study area into 32 subareas. Once the whole study area was marked, we proceeded to the verification of waste in the marked zones. The verification was carried out in two stages. In the first stage, we used photointerpretation with the orthophotography of the Spanish PNOA for 2022 (IGN), an orthophotography with pixels of 25 cm obtained by aeroplanes. The identification and visual classification of the images has been carried out in GIS software QGIS version 2.18. In this procedure, we considered four possibilities:
  • Yes. The orthophotography clearly suggests that what the LD model has marked as CDW is indeed CDW;
  • Looks like CDW. When it looks like it could be CDW, but it is not sufficiently clear in the orthophotography;
  • Possibly CDW. When we observe that, in relation to the environmental conditions, proximity to construction sites, etc., it is possible that there may be (or may have been at some point) waste;
  • No. When there is clearly no CDW.
In the second stage, we carried out fieldwork observations in the areas classified as “look like” and “possibly” to establish the presence of CDW. The fieldwork involved a technician visually inspecting the marked area and observing the surrounding areas and access routes.

4. Results and Discussion

The RVT tools show the results in 32 and 8 bits. The software indications suggest that the results expressed in eight bits are optimized for visualization in software other than GIS. We have carried out a previous analysis in both formats, for each of the employed tools. We can observe that, in general, the results expressed in an eight-bit format allow us to distinguish with more clarity the morphology of the terrain. For this reason, we discarded the use of the results expressed in 32 bits in the subsequent processes.

4.1. Analysis of the Areas of CDW Localised through Initial Fieldwork

The morphology of the terrain is conditioned by the orography and geology of the area, the level of urban development, the anthropic presence, etc. This means that, for each land type, the form in which the terrain is represented in the calculated models will vary. Figure 5, Figure 6, Figure 7, Figure 8, Figure 9 and Figure 10 present the results of the models obtained for each of the land typologies we defined earlier. In this way, we can assess which of the models are more adequate for the objectives of this study. For the analysis of nonurban land, we considered it necessary to divide it into two subtypes, on the one hand, land plots that have been modified by humans (such as historic waste sites) and, on the other hand, terrain with natural topography.
Figure 5 shows the result obtained for a nonurban plot that prior to 2011 was the designated official CDW site. The morphology of the terrain is clearly shown in the seven models. The model with a worse definition is the one produced by OPEN, due to the narrow range of gray tones used for the representation of the terrain. Multi HS, on the other hand, offers the best configuration of the terrain thanks to the range of RGB colours that highlight the different orientations of the slopes. The existing waste, topographically representing a singular terrain superelevation, is represented in the LD model as individual white points. This could be hidden from sight, given that the crests of slopes are also shown in clear tones; something similar happens with the SLRM model.
Figure 5. Results obtained for the nonurban land (Type A-2). Nonurban plot that prior to 2011 was the designated official CDW site.
Land 12 02119 g005
Figure 6 shows a nonurban plot with a natural topography, for the most part. The orography is generally plain. In this case, it is complex to observe the morphology of the terrain for many of the calculated models. The LD and SLRM models are the ones that best represent the orography and the various elements included in the plot, such as pathways, borders, or riverbeds. The Multi HS model also allows us to observe the morphology of the terrain, although, in this case, its constitutive elements are less marked. In the area captured in this Figure, the waste is located next to the margin of the rural roads or in the interior of the plots. Only the LD model allows us to observe, in a discrete manner, the existence of waste. In this case, around the waste, we see other points with a higher height, and this means they are also represented in a similar form to the waste, disguising the presence of such waste. The SRLM model also permits the identification of the location of the CDW. Nevertheless, to a large extent, this is eclipsed by the crests of slopes of rural roads and other vertical elements. The remainder of the estimated models do not allow us to determine the presence of possible CDW locations via a visual analysis.
Figure 6. Results obtained for nonurban land (Type A-1). Location of CDW in rural roads and rural plots.
Land 12 02119 g006
The border between urban and nonurban land is an area where we can find nonurban plots situated among built plots. In Figure 7, we show the results obtained for one such type of land; in this particular place, the natural topography is that of a plain zone. As we observed in Figure 6, parts some of the calculated models do not represent in detail the topography of the plot. There are OPEN, SLOPE, and SVF. The other models (HS, LD, Multi HS, and SLRM) in general do provide useful information about the topography of the plots and elements contained in them, such as rural roads, borders, and riverbeds. The detection of CDW in this case is complex, given the terrain orography and the presence of other vertical elements (built elements) that appear as elevated points in the models. The LD model is the only one that, to some extent, allows us to identify CDW points. However, the representation of crests of slopes, built elements, and flattened land makes it difficult to determine with precision the presence of CDW. The SLRM also permits the identification of elevated terrain, though, in this case, the CDW remains hidden by the crests of slopes of rural roads and existing constructions.
Rural roads or pathways are a common area for the deposit of CDW, typically linked to the presence of nearby urban developments or as itineraries between two points of interest [7,12,14]. Figure 8 shows the models obtained in a zone with CDW in the margins of rural roads. This is an edge area between urban and nonurban land. The rural road connects with a small group of houses distant from the city. Due to the orography of the terrain, the OPEN, SLOPE, and SVF models, as we also saw in Figure 7 and Figure 8, do not capture with sufficient detail the terrain elements, unlike the other models that, with different degrees of definition, do manage to represent them. Once more, it is the LD model that is the only one that allows us to distinguish the points of CDW to some extent. In this scenario (borderland between urban and nonurban, with vertical slopes), the crest of the slope eclipses the identification of CDW. Nevertheless, the crests of slopes are reflected in a lineal form and, generally, the CDW is represented as a point. Even multiple CDW deposits together are represented as a collection of points.
Figure 7. Results obtained for plots situated at the edge of the urban and the nonurban land (Type B).
Land 12 02119 g007
Figure 8. Results obtained for rural roads (Type C).
Land 12 02119 g008
Nonconsolidated urbanisations are locations that are often not under any natural surveillance or guardianship nor transited in which there are empty plots yet to be built. This situation makes them particularly vulnerable to their use as spaces for the deposit of CDW or as areas for some preliminary construction work, such as excavations preparing the cementation of future construction. Figure 9 shows the results obtained for an example of this type of land. In this case, we can see that all the models adequately represent the morphology of the terrain, highlighting the built avenues, and even the earthworks in some of the plots. LD and Multi HS seem to be the models that provide greater detail to assess the morphology of the terrain, followed by HS and SLRM. The LD model is also the one that permits, to some extent, the identification of the CDW points, although we saw also in the previous examples for other types of land. Also, here the crests of slopes and other vertical elements may induce some confusion.
Figure 9. Results obtained for urbanised nonconsolidated land (Type D).
Land 12 02119 g009
Finally, Figure 10 shows the results for an example of urban land. This is a singular example, given that it is not a built area. It is the esplanade dedicated to the weekly farm market and annual festive fair, and part of its edges are delimited by the river Guadiana. In some ways, this particular example shows characteristics of the urbanised nonconsolidated land (Figure 9). As we have seen in previous examples, the HS, LD, and Multi HS models are the ones that better represent the morphology of the terrain, and LD is the model that better represents the possible presence of CDW. It is important to highlight that, in this case, the slope of the margin of the river, the slopes of the construction esplanade, and the nearby roads are represented in a similar mode to CDW in the LD model.
Figure 10. Results obtained for this type of urban land (Type E).
Land 12 02119 g010
Table 1 and Table 2 show a summary of the representability of the terrain morphology and the presence of CDW for the 14 locations where the fieldwork identified CDW (Figure 2). We used an ad hoc subjective scale scored from one (bad representation) to five (good representation). The results shown in Table 1 and Table 2 are the rounded averages of the 14 plots analysed. As a general result, we can see that, for the representation of the terrain, the more adequate models are LD and Multi HS and that, for the representation of the deposits of CDW, only the LD model is more adequate.

4.2. Applications of the LD Model to the Study Area and Verification of the Results

Using the LD model for the identification of CDW, we obtained a total of 322 distributed points (Figure 11) for the whole study area. These points have been identified using their representation in the LD model, being consistent with what we observed in the results shown in the study of the different cartographic contexts in Figure 5, Figure 6, Figure 7, Figure 8, Figure 9 and Figure 10. Most of the areas with anthropic plots that may have CDW are located in rows 3 and 4. This is due to the fact that rows 1 and 2 include a greater number of larger estates, a smaller number of population centres, and a lesser number of smaller secondary residences. Proximity to a population centre is an important risk factor identified by the literature [4,5,6,7,8] to determine the possible presence of CDW.
Figure 11 shows the result of the first-stage verification, relying on the interpretation of the orthophotography, having used the 2022 PNOA photo with pixels of size 0.25 m. In the first stage of verification, 13% of the points (n = 43) have been identified as CDW (labelled as “Yes”), 12% have been classed as “Look like” CDW (n = 38), and 8% as “Possible” CDW (25 = n). In contrast, 67% of the points that the LD model identified have been classed as containing “no” CDW through the photointerpretation (n = 216) and that correspond, for the most part, to anthropic objects other than CDW, with similar characteristics to CDW (some forms of vegetation, built elements, landfills, etc.).
The largest proportion of the discharges detected, 35%, are located in areas bordering urban developments. A similar representation, 30%, is made up of discharges detected in natural areas or plots; these are plots with paths and natural vegetation without agricultural use. The first two categories account for 65% of the discharges detected. The remaining 12% correspond to recreational plots (plots without buildings, or with free-standing buildings that occupy a small proportion of the surface area of the plot close to urban centres). These plots are not normally used for agricultural or livestock purposes. The rest of the sites, 23%, correspond to different uses, such as areas bordering the river margin, industrial or urban areas, areas under construction, crop plots, and former landfill sites.
In the second stage of the verification process, we visited the locations (n = 63) classed as “Looks like CDW” and “Possible CDW” to carry out visual inspection of the areas and their access routes. Based on these visits, we classed the locations into one of four categories:
  • “Yes”. There is CDW;
  • “No”. Clearly, there is no CDW;
  • “Not accessible”. Locations in private plots with restricted access and that we were unable to inspect;
  • “Aggregate stockpiling”. Locations where we found temporary stockpiles on the ground.
Figure 12 shows that 27% of the area marked as “look like CDW” and 12% of those classed as “possible CDW” were indeed deposits of CDW. In addition, in one of the routes we followed, we detected a new location of CDW that the model had not identified. We could not access a significant number of plots containing potential CDW locations.

5. Conclusions

This study proposes a methodology for the identification of CDW using visualization models of the topographic characteristics of terrain using DEM. We used seven different models and evaluated their capacity to represent the morphology of the terrain and their capacity to represent the presence of CDW in five anthropic and natural contexts. The LD and Multi HS models were helpful in identifying the morphology of the terrain in the five studied contexts. Both models allowed us to distinguish anthropic morphologies in the terrain, specifically embankment and cutting slopes. In relation to the locations of deposits of CDW, the LD model is the one that did show a better representation.
The detection of CDW using photointerpretation using the LD model has not been satisfactory in those cases where the deposits of CDW were not elevated but were spread out in the terrain. In this case, the topographical modification is not susceptible to appreciation by these models. It has also been difficult to identify the individualised deposits of CDW due to the presence of other represented models, such as crests of slopes or other anthropic elevations, as well as possible errors in the DEM resulting from the presence of undesirable points in the second class of the LiDAR point cloud. These undesirable points potentially can be treetops, covers, or noise inherent to the point cloud that may have been erroneously classified. The LiDAR data used are filtered and processed by the National Geographic Institute of Spain. The document indicates that the errors observed are punctual, being insignificant in the studied plot. Despite these limitations, we have been able to identify deposits of CDW in anthropic zones, such as rural roads and nonconsolidated urbanised areas.
The employed methodology allows us to clearly differentiate between anthropic and natural terrain, allowing us as well to identify at least some forms of deposit of CDW. The results obtained have allowed us to extend the database of locations (originally identified through our previous fieldwork) with illegal deposits of CDW in the study area. The identified deposits are located in proximity to population centres and communication routes. The verification of the points identified as “look like” and “possible” CDW with the LD model suggest that a high percentage of these are not CDW. In the process of photointerpretation, the skills, experience, and training of the analyst is a key element in determining the quality of the results. So, we consider that, with greater practice, the locations marked as not containing CDW after visual analysis would likely diminish.
This study has allowed us to extend the database of locations with CDE in the territory contained on page 777 of the 50,000 cartography of the Spanish IGN. This database can be a departure point for subsequent studies oriented to the detection of CDW through photointerpretation characterising other aspects of the geographical contexts or through machine-learning models. Equally, this analysis can also be helpful to the public authorities in charge of the regulatory monitoring of illegal waste. In future works, the methodology used should be validated for its use in geographical contexts with different topographical characteristics, such as more mountainous areas or more accentuated slopes.

Author Contributions

Conceptualization, M.S.-F., L.A.-G. and J.A.G.G.; methodology, M.S.-F. and J.A.G.G.; software, M.S.-F. and J.A.G.G.; validation, L.A.-G. and J.A.G.G.; formal analysis, M.S.-F., L.A.-G. and J.A.G.G.; investigation, M.S.-F., L.A.-G. and J.A.G.G.; resources, L.A.-G. and J.A.G.G.; data curation, M.S.-F.; writing—original draft preparation, M.S.-F. and L.A.-G.; writing—review and editing, M.S.-F., L.A.-G. and J.A.G.G.; visualization, J.A.G.G.; supervision, L.A.-G. and J.A.G.G.; project administration, M.S.-F. and J.A.G.G.; funding acquisition, L.A.-G. All authors have read and agreed to the published version of the manuscript.

Funding

This study is the result of the project “Remote sensing and environmental analysis of illegal landfills” (IB20050-2021/2024), funded by the Junta de Extremadura and the European Regional Development Fund (FEDER) with 103,447 euros.

Data Availability Statement

Data is unavailable due to privacy or ethical restrictions.

Acknowledgments

Thanks to the collaboration and support of the security forces of Extremadura.

Conflicts of Interest

The authors declare no conflict of interest. The funders had no role in the design of the study; in the collection, analyses, or interpretation of data; in the writing of the manuscript; or in the decision to publish the results.

References

  1. Karak, T.; Bhagat, R.M.; Bhattacharyya, P. Municipal Solid Waste Generation, Composition, and Management: The World Scenario. Crit. Rev. Environ. Sci. Technol. 2012, 42, 1509–1630. [Google Scholar] [CrossRef]
  2. Seeboonruang, U. Geographic Information System–Based Impact Assessment for Illegal Dumping in Borrow Pits in Chachoengsao Province, Thailand. Geol. Soc. Am. Spec. Pap. 2016, 520, 393–405. [Google Scholar]
  3. Lu, W. Big Data Analytics to Identify Illegal Construction Waste Dumping: A Hong Kong Study. Resour. Conserv. Recycl. 2019, 141, 264–272. [Google Scholar] [CrossRef]
  4. Junta de Extremadura. PIREX (Plan Integrado de Residuos de Extremadura 2016–2022); Junta de Extremadura: Mérida, Spain, 2022.
  5. Gobierno de España. Plan Estatal Marco de Residuos 2016–2022 (PEMAR); Gobierno de España: Madrid, Spain, 2022.
  6. Fernández Jurado, J.A.; González Almendros, C.M.; Sabariego Rivero, S. Vertederos Ilegales; Sección de Málaga del Instituto Andaluz Interuniversitario de Criminología: Málaga, Spain, 1995. [Google Scholar]
  7. Jordá-Borrell, R.; Ruiz-Rodríguez, F.; Lucendo-Monedero, Á.L. Factor Analysis and Geographic Information System for Determining Probability Areas of Presence of Illegal Landfills. Ecol. Indic. 2014, 37, 151–160. [Google Scholar] [CrossRef]
  8. Lucendo-Monedero, A.L.; Jordá-Borrell, R.; Ruiz-Rodríguez, F. Predictive Model for Areas with Illegal Landfills Using Logistic Regression. J. Environ. Plan. Manag. 2015, 58, 1309–1326. [Google Scholar] [CrossRef]
  9. Navarro, J.; Grémillet, D.; Afán, I.; Ramírez, F.; Bouten, W.; Forero, M.G. Feathered Detectives: Real-Time GPS Tracking of Scavenging Gulls Pinpoints Illegal Waste Dumping. PLoS ONE 2016, 11, e159974. [Google Scholar] [CrossRef]
  10. Quesada-Ruiz, L.; Rodriguez-Galiano, V.; Jordá-Borrell, R. Identifying the Main Physical and Socioeconomic Drivers of Illegal Landfills in the Canary Islands. Waste Manag. Res. 2018, 36, 1049–1060. [Google Scholar] [CrossRef]
  11. Du, L.; Xu, H.; Zuo, J. Status Quo of Illegal Dumping Research: Way Forward. J. Environ. Manag. 2021, 290, 112601. [Google Scholar] [CrossRef]
  12. Seror, N.; Portnov, B.A. Identifying Areas under Potential Risk of Illegal Construction and Demolition Waste Dumping Using GIS Tools. Waste Manag. 2018, 75, 22–29. [Google Scholar] [CrossRef] [PubMed]
  13. Biotto, G.; Silvestri, S.; Gobbo, L.; Furlan, E.; Valenti, S.; Rosselli, R. GIS, Multi-Criteria and Multi-Factor Spatial Analysis for the Probability Assessment of the Existence of Illegal Landfills. Int. J. Geogr. Inf. Sci. 2009, 23, 1233–1244. [Google Scholar] [CrossRef]
  14. Quesada-Ruiz, L.C.; Rodriguez-Galiano, V.; Jordá-Borrell, R. Characterization and Mapping of Illegal Landfill Potential Occurrence in the Canary Islands. Waste Manag. 2019, 85, 506–518. [Google Scholar] [CrossRef]
  15. Yadav, S.K. GIS Based Approach for Site Selection in Waste Management. Int. J. Environ. Eng. Manag. 2013, 4, 507–514. [Google Scholar]
  16. Angelino, C.V.; Focareta, M.; Parrilli, S.; Cicala, L.; Piacquadio, G.; Meoli, G.; Mizio, M.D. A Case Study on the Detection of Illegal Dumps with GIS and Remote Sensing Images. In Proceedings of the Earth Resources and Environmental Remote Sensing/GIS Applications IX, Berlin, Germany, 11–13 September 2018; Michel, U., Schulz, K., Eds.; SPIE: Bellingham, WA, USA, 2018; Volume 10790, p. 107900M. [Google Scholar]
  17. Torres, R.N.; Fraternali, P. Learning to Identify Illegal Landfills through Scene Classification in Aerial Images. Remote Sens. 2021, 13, 4520. [Google Scholar] [CrossRef]
  18. Glanville, K.; Chang, H.-C. Remote Sensing Analysis Techniques and Sensor Requirements to Support the Mapping of Illegal Domestic Waste Disposal Sites in Queensland, Australia. Remote Sens. 2015, 7, 13053–13069. [Google Scholar] [CrossRef]
  19. Manzo, C.; Mei, A.; Fontinovo, G.; Allegrini, A.; Bassani, C. Integrated Remote Sensing for Multi-Temporal Analysis of Anthropic Activities in the South-East of Mt. Vesuvius National Park. J. Afr. Earth Sci. 2016, 122, 63–78. [Google Scholar] [CrossRef]
  20. Shahab, S.; Anjum, M. Solid Waste Management Scenario in India and Illegal Dump Detection Using Deep Learning: An AI Approach towards the Sustainable Waste Management. Sustainability 2022, 14, 15896. [Google Scholar] [CrossRef]
  21. Padubidri, C.; Kamilaris, A.; Karatsiolis, S. Accurate Detection of Illegal Dumping Sites Using High Resolution Aerial Photography and Deep Learning. In Proceedings of the 2022 IEEE International Conference on Pervasive Computing and Communications Workshops and other Affiliated Events (PerCom Workshops), Pisa, Italy, 21–25 March 2022; pp. 451–456. [Google Scholar]
  22. Parrilli, S.; Cicala, L.; VincenzoAngelino, C.; Amitrano, D. Illegal Micro-Dumps Monitoring: Pollution Sources and Targets Detection in Satellite Images with the Scattering Transform. In Proceedings of the 2021 IEEE International Geoscience and Remote Sensing Symposium IGARSS, Brussels, Belgium, 11–16 July 2021; pp. 4892–4895. [Google Scholar]
  23. Akinina, N.V.; Akinin, M.V.; Taganov, A.I.; Nikiforov, M.B. Methods of Detection in Satellite Images of Illegal Dumps by Using a Method Based on Tree Classifier. In Proceedings of the 2017 6th Mediterranean Conference on Embedded Computing (MECO), Bar, Montenegro, 11–15 June 2017; pp. 1–3. [Google Scholar]
  24. Notarnicola, C.; Angiulli, M.; Giasi, C.I. Southern Italy Illegal Dumps Detection Based on Spectral Analysis of Remotely Sensed Data and Land-Cover Maps. In Proceedings of the Remote Sensing for Environmental Monitoring, GIS Applications, and Geology III, Barcelona, Spain, 9–11 September 2003; Ehlers, M., Kaufmann, H.J., Michel, U., Eds.; SPIE: Bellingham, WA, USA, 2004; Volume 5239, pp. 483–493. [Google Scholar]
  25. Bennett, R.; Welham, K.; Hill, R.A.; Ford, A. A Comparison of Visualization Techniques for Models Created from Airborne Laser Scanned Data. Archaeol. Prospect. 2012, 19, 41–48. [Google Scholar] [CrossRef]
  26. Devereux, B.J.; Amable, G.S.; Crow, P. Visualisation of LiDAR Terrain Models for Archaeological Feature Detection. Antiquity 2008, 82, 470–479. [Google Scholar] [CrossRef]
  27. Hesse, R. LiDAR-Derived Local Relief Models-a New Tool for Archaeological Prospection. Archaeol. Prospect. 2010, 17, 67–72. [Google Scholar] [CrossRef]
  28. Guyot, A.; Lennon, M.; Hubert-Moy, L. Objective Comparison of Relief Visualization Techniques with Deep CNN for Archaeology. J. Archaeol. Sci. Rep. 2021, 38, 103027. [Google Scholar] [CrossRef]
  29. Štular, B.; Eichert, S.; Lozić, E. Airborne LiDAR Point Cloud Processing for Archaeology. Pipeline and QGIS Toolbox. Remote Sens. 2021, 13, 3225. [Google Scholar] [CrossRef]
  30. Martínez, S.L.; Carlos, J.; Manrique, O.; Rodríguez-cuenca, B.; González, E. Procesado y Distribución de Nubes de Puntos En El Proyecto PNOA-LiDAR. In Proceedings of the XVII Congreso de la Asociación Española de Teledetección, Murcia, Spain, 21–23 October 2015; pp. 3–7. [Google Scholar]
  31. Kokalj, Ž.; Hesse, R. Airborne Laser Scanning Raster Data Visualization: A Guide to Good Practice; Založba ZRC: Ljubljana, Slovenia, 2017; Volume 14, ISBN 9612549842. [Google Scholar]
  32. Zakšek, K.; Oštir, K.; Kokalj, Ž. Sky-View Factor as a Relief Visualization Technique. Remote Sens. 2011, 3, 398–415. [Google Scholar] [CrossRef]
  33. Kokalj, Ž.; Somrak, M. Why Not a Single Image? Combining Visualizations to Facilitate Fieldwork and On-Screen Mapping. Remote Sens. 2019, 11, 747. [Google Scholar] [CrossRef]
  34. Kokalj, Ž.; Zakšek, K.; Oštir, K.; Pehani, P.; Čotar, K.; Somrak, M.; Kokalj, Ž.; Kokalj, Ž. Relief Visualization Toolbox, Ver. 2.2. 1 Manual. Remote Sens. 2016, 3, 398–415. [Google Scholar]
Figure 1. Spatial contextualization of the study area. (a) Spain (blue) in Europe; (b) Extremadura (green) in Spain; (c) study area (page 777 of the 50,000 cartography of Spain.
Land 12 02119 g001
Figure 3. Pictures of observed waste by type of land use. (a) In nonurban land; (b) nonconsolidated urbanisations; (c,d) in the limit between the urban and the nonurban; (e) urban; and (f) margin of a rural pathway.
Land 12 02119 g003
Figure 4. Workflow followed by the studio.
Land 12 02119 g004
Figure 11. Points identified by the LD model as potential CDW sites.
Land 12 02119 g011
Figure 12. Results obtained in the second stage of the verification (via fieldwork visits) to points that were classed as “looks like CDW” and as “possible”. (a) “Looks like CDW”, (b) “Possible CDW”.
Land 12 02119 g012
Table 1. Summary of the adequacy of the generated models for the various types of land in relation to their capacity for representing the morphology of the terrain.
HSLDMulti HSOPENSLOPESLRMSVF
Type A-15553445
Type A-23541151
Type B4451141
Type C4451151
Type D5553445
Type E5553343
Average4552243
Land 12 02119 i001.
Table 2. Summary of the adequacy of the generated models for the various types of land in relation to their capacity to represent the presence of CDW.
HSLDMulti HSOPENSLOPESLRMSVF
Type A-11514333
Type A-21311121
Type B1412231
Type C1411121
Type D1411121
Type E1411121
Average1412221
Land 12 02119 i001.
Disclaimer/Publisher’s Note: The statements, opinions and data contained in all publications are solely those of the individual author(s) and contributor(s) and not of MDPI and/or the editor(s). MDPI and/or the editor(s) disclaim responsibility for any injury to people or property resulting from any ideas, methods, instructions or products referred to in the content.

