1. Introduction
Our cities are experiencing serious overheating, which is also contributing to a general increase in the demand for cooling energy in buildings. As a result, there is a rise in peak electricity demand [
1]. Urbanization causes alterations in air temperature and humidity [
2], which significantly affects human thermal comfort perception [
3] and natural ecosystems. It also leads to an increase in harmful pollutants [
4] and ozone concentration. The resulting overheating phenomena were studied and found to be dangerous to human health [
5], leading to increased mortality and morbidity rates, especially among vulnerable populations [
6], as well as related mental health issues [
7]. Among the diverse urban heat mitigation technologies, vegetation, including trees, shrubs, and grasses, can have a significant impact on the local environment. They can provide many health benefits and recreational opportunities for urban populations by lowering the ambient and land surface temperatures in urban areas.
Increasing urban vegetation can significantly reduce urban temperatures through two crucial cooling processes: evapotranspiration and shade, as numerous studies demonstrated [
8,
9].
Additionally, urban green spaces provide ecosystem services (ESs) [
10], which are essential for human health and well-being in urban environments [
11,
12].
The ecosystem services (ESs) include air purification, carbon storage, noise reduction, rainwater runoff retention, cooling, as well as recreational opportunities. The synergistic effects of urban greenery were especially assessed in case of hot and humid climates [
13]; nevertheless, fewer studies focus on moderate and temperate areas.
Urban green spaces are acknowledged to improve people’s physical and mental health [
14], moderate the urban heat island effect [
15,
16], enhance the quality of life, promote social inclusion [
17], and increase real estate prices [
18].
Vegetation regulates the urban microclimate in different ways: (i) by intercepting incoming solar radiation (shading); (ii) through the process of evapotranspiration, and (iii) by modifying air movement and heat exchange. Shading and evapotranspiration contribute most to the cooling effect [
19]. Depending on the surface area, types of vegetation, and spatial aggregation, urban green areas can guarantee a cooling effect of 1–4 °C [
20].
The microclimate is locally influenced by the shape of buildings, the structure of the urban fabric, and the presence of urban vegetation. In the case of a dense and compact city, the urban heat island (UHI) effect influence changes accordingly [
21]. The UHI effect occurs in urbanized areas where asphalt and concrete structures absorb heat, resulting in higher surface temperatures and overall ambient temperature compared to rural environments.
The UHI increases the ambient temperature in cities and worsens the risk of heat-related deaths. Several passive mitigation technologies, such as the use and the implementation of green infrastructure, are applied to reduce the severity of urban overheating. Researchers acknowledge that cooling by evapotranspiration varies depending on local climate, urban morphology [
22,
23,
24], and tree canopy physical and geometrical properties and disposition [
25,
26], but it is generally up to 2–3 °C [
27]. Moreover, in summer, evapotranspiration ensures a greater cooling effect (up to 2.0 °C) than in winter (<0.5 °C) [
28].
While the numerous benefits associated with green spaces in urban environments are recognized, recent research highlighted certain limitations of green areas in terms of mitigating temperature rises.
A recent study [
15] showed that a moderate increase in low-level and non-irrigated vegetation in an urban area with a dense texture has only little capacity to cool the city during the afternoon. In fact, it may even slightly increase the temperature. The moisture content of the soil decreases because of the increased evapotranspiration caused by an expansion in plant cover. The ambient temperature at 12 p.m. only slightly drops or even rises because low-level vegetation and other green masses with shallow roots cannot evaporate and release latent heat adequately. The average ambient temperature is observed to drop between 0.4 °C and 7.2 °C during a 24 h observation period, with an average value of approximately 3.5 °C. At 2:00 p.m. and 6:00 a.m., the ambient temperature decreases on average by 0.6 °C and 2.1 °C, respectively. Additionally, there is a reduction in the number of hours with temperatures above 35.0 °C and 40.0 °C by up to 19.1% and 14.1%, respectively.
Shading and evapotranspiration contribute to the cooling effect of vegetation. As long as plants have access to water for transpiration, the cooling potential increases with the density of the tree canopy. In contrast, in a dry climate where soil water is scarce, the capacity of trees and other vegetation to cool the air is significantly reduced. This puts stress on the plants due to the drought, which in turn reduces evapotranspiration.
Similar studies highlighted that higher air temperatures, combined with drought, result in the closure of plant stomata and an increase in leaf temperature above the ambient temperature [
29]. The increase in the surface temperature of plants leads to an increase in the release of sensible heat, which may cause a rise in ambient air temperature [
30]. These data are particularly relevant in the cases of urban green mass and urban high-vegetated area, where the increase in air temperature is frequent, and the irrigation rate is noticeably low.
Limiting the scope of interest to the cooling effect provided by urban green spaces, previous research highlights that the UHI effect is exacerbated by paved surfaces that hinder evapotranspiration [
31], dense building structures [
32] that decrease wind speed, and dark building materials that absorb solar energy during the day and gradually release heat at night, slowing down the air cooling process [
33].
Wind velocity is a deeply discussed parameter that influences the thermal distribution at an urban scale [
34,
35,
36]: different levels of urban surface roughness, lower mean wind velocity, and as a result, lesser convectional heat removal, and additionally, wind direction is highly variable and the accuracy in predicting future scenarios is still not recognized. While computational fluid dynamics (CFD) models can be highly helpful for certain investigations, when analyzing wind speed distribution, the accuracy is not assured and comes at a very high computational cost [
37].
Since expanding the urban tree canopy is one of the most recommended nature-based solutions (NBS) for mitigating excessive urban heat, the objective of this research is to determine whether and to what extent this solution can be effective in relation to the surrounding urban fabric. The research gap that remains unsolved is determining the extent to which the green coverage of cities can provide a thermal benefit in managing and controlling the increase in temperatures, particularly in future projections.
The aim of this paper is to evaluate whether the capabilities currently offered by the green masses in limiting the rise of temperatures will be confirmed in the near future and to what extent the dense and compact urban texture will be able to play a supporting role in counteracting the raising temperatures. To investigate the potential and limitations of green urban areas in improving the resilience of urban areas, particularly in terms of thermal regulation and average ambient temperature in current and projected future scenarios, this study will conduct a comparative microclimate analysis for two selected case studies with diverse urban textures.
2. Materials and Methods
2.1. Green Areas Selection
This study focuses on Parma, a city in Northern Italy. Parma has a total area of approximately 260 km2 and is located in the western Emilia Romagna region, situated between the Apennines and the Po Valley. The population of Parma is approximately 200,000 residents. It stands out for its tight and dense urban fabric, which incorporates a variety of green areas, parks, and community gardens.
The municipal government of Parma, the city chosen for the case study, registered 1900 hectares of public green space, or 97.7 m2 of public green space for every person, based on a tree heritage of 41,951 trees.
Including 15 social gardens and 66 public neighbourhood parks, the city boasts 161 hectares of green space [
38]. Based on the same report, Parma offers an efficient land use synthetic index of 8/10, calculated as the land consumption/residents and level of urbanization/residents on a 0–10 scale.
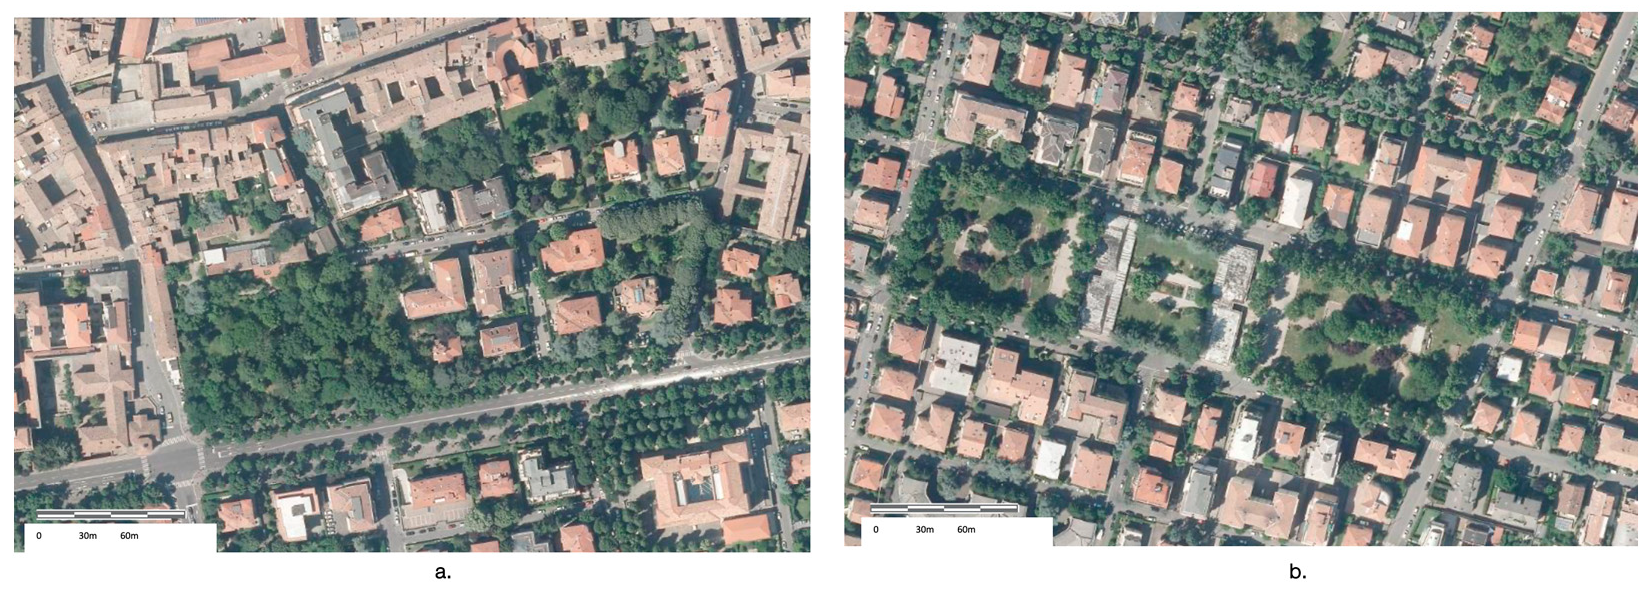
Two different urban fabrics, with different building densities, are considered to evaluate the role of urban vegetation in lowering air temperatures and mitigating outdoor thermal conditions (
Figure 1).
To discriminate different urban areas in the city of Parma, the definition of local climate zones (LCZs) is here considered. LCZs are defined as non-specific urban areas with no specific buildings or emergencies. They are commonly used for performing climatic evaluations, relying on building types and their density [
39]. The LCZ method is here selected since it was extensively employed in studies of the UHI and can profitably depict various climates within urban fabrics according to their surface and physical characteristics that influence the near-surface atmosphere. The LCZ classification does not consider regional or site-specific features such as variations in surface characteristics, specific building materials, or the presence of natural vegetation.
Two green areas were identified to represent samples of urban fabric that are illustrative of the city of Parma.
Study Case 1 (SC1) (
Figure 2a) examines the historical urban fabric in Parma, characterized by a predominance of compact mid-rise buildings. These buildings are comprised of a dense mixture of brick, tile, or concrete masonry. Land cover offers very few trees, and the land cover is mostly paved with asphalt or stone.
Study Case 2 SC2 (
Figure 2b) refers to an open arrangement of tall buildings (over four stories) with an abundance of pervious land cover.
For each case study, a short historical and geometric description is initially presented.
The selected case studies SC1 and SC2 assess different varieties of urban greenery, different building typologies, and different building heights.
The urban vegetation in SC1 (
Figure 2a) is represented by the Orto Botanico (Botanical Garden). Despite its modest size (11,000 m
2), the botanical garden in SC1 hosts plants from a wide range of ecosystems with diverse characteristics. In this case, the green mass is enclosed within the walls of the historical botanical garden, representing a unique anomaly in the densely built and sedimented urban fabric of Parma. Located on the border of the historic centre of the city, the garden occupies the same surface area as it did at the time of its foundation (around 1770). The central part features an Italian garden surrounded by greenhouses. The arboretum, created between the nineteenth and twentieth centuries, still occupies the eastern part. The garden, located in the western part next to Strada Farini, also includes a small wetland area. However, the size of the wetland is considered insignificant in mitigating the local effects, particularly when compared to the extensive green area.
The second selected green urban area SC2 is Piazzale Lubiana, in the suburban area of Quartiere Lubiana, from which its name derives. Piazzale Lubiana (
Figure 2b) is an area delimited on four sides by residential and neighbourhood streets. The entire space is divided into three squares connected to each other by longitudinal paths, bordered by rows of trees and parking areas. The central paved square has two buildings that house commercial activities. The square to the east includes a fenced dog area and a lawn area, while the one to the west includes a large area dedicated to a kid playground. Piazzale Lubiana is a very popular place for socializing, walking, relaxing, and playing.
2.2. Microclimate Workflow
The first stage of the microclimatic evaluation workflow is about the modelling of the climate file associated with the city under study.
The city of Parma has a humid subtropical climate (Cfa), according to the Köppen climate classification [
39,
40]. The city experienced [
41] a significant increase in the average maximum summer temperatures, as well as a rise in the number of days experiencing heat waves.
The average temperature in urban areas was 21.1 °C, according to information gathered by the Meteorological Observatory of the University of Parma for the previous 150 years. In particular, the year 2022 was noted as being the warmest year in the area in the previous 150 years. It was the first time since observations began in 1878 that the average yearly temperature exceeded the 16 °C mark; 16.5 °C was the temperature that was assessed. The urban fabric’s high density and compactness, as well as the predominance of impermeable surfaces, considerably increase the overheating phenomenon [
40].
Furthermore, microclimate evaluations were conducted for the hottest day (5 July) as the most critical in terms of overheating.
A modified EnergyPlus weather file (EPW) was used as a contemporary climatic reference. The temperature data were interpolated from the nearest weather stations, while the radiation data were obtained from satellite data to model an EPW file for the city of Parma.
The thermal behaviour of urban green spaces will be studied in the current scenario (2020) and in the future weather scenario for the year 2050 using the Meteonorm Climate Generator (version 8.1.4) [
42]. This scenario is based on the predictions made by the Intergovernmental Panel on Climate Change (IPCC) scenario SSP2-4.5 [
43].
The SSP2-4.5 scenario envisions slow progress towards sustainability, characterized by uneven development and income growth. According to this scenario, temperatures will rise by 2.7 °C by the end of the century.
The following stage involves the definition of the 3D models. The geometry of the SCs was modelled using Rhino, and then the 3D models were exported to ENVI-met 4.4 [
44], including building materials, land covers, and other significant data to perform the microclimatic appraisal.
The SCs’ 3D models have diverse dimensions in relation to the green area being considered.
The SC1 area measures 300 m × 300 m, and the SC2 model is 400 m × 200 m. The two domains are shaped using a grid cell unit of 3.0 m × 3.0 m × 3.0 m. A set of customized building materials was created using the Envi-met database [
45] to characterize local finishing materials.
The thermophysical properties of the finishes were modelled based on literature sources and on-site survey, than entered into the project database (
Table 1). A specific set of materials, namely
Table 1 and
Table 2, is used to encompass the thermophysical properties of building materials and finishes.
Due to the lack of a comprehensive inventory of greenery in public space in Parma, a limited selection of trees and shrubberies/edges, as in
Table 3, were modelled in the ENVI-met tool Albero [
46]. Some generalizations were made considering the abundance and variety of trees’ species. The following factors were considered in ENVI-Met Albero: trunk height, leaf area density (LAD), sparse tree crown, dense tree crown, and plantation density for each SC.
In the last stage of the workflow, ENVI-met Leonardo is used to extract the microclimatic values of mean radiative temperature (MRT) and relative humidity (RH).
The wind velocity was also calculated in this early study. Nevertheless, since a reliable wind profile for the 2050 scenario is not available, the results are not discussed here.
Moreover, the wind velocity profiles were extensively studied along the Emilia Romagna coastline [
47], while fewer studies were conducted for the Po Plain region [
48]. It is also acknowledged that this area experiences limited air circulation due to its mountainous terrain.
Furthermore, studies on the uncertainty surrounding the slowdown of ground wind velocity [
49] indicate that wind assessment is currently highly unreliable.
The sub-module BIO-met assessed the physiological equivalent temperature (PET) comfort index for both SCs. PET [
50] is based on a prognostic model of the human energy balance to assess how the biometeorological thermal environment affects human thermal comfort [
51]. The PET evaluation is based on the previous microclimatic values of MRT, potential pot air T, WS, and RH, with reference to a male person (35 years old) and 1.75 m tall who is performing light activity (metabolism of 80 W) and wearing a 0.9 clo.
In the final phase, the PET values were calculated for the two scenarios and mapped onto the two SCs areas.
To analyze the perceived outdoor thermal comfort and comparable conditions in the selected case studies, specific receptor points (RP) were established, and all thermophysical and biometeorological data were evaluated. The receptor points were placed in analogous urban and vegetated areas. RP1 was located beneath the denser canopy, RP2 was placed beneath sparse tree crowns, and RP3 was situated in nearby open streets. For the calculation of PET values, an additional receptor point RP4 was considered in both SCs to represent an additional thermal situation in the surrounding urban area.
This was achieved to represent the different thermal behaviours in the densely built areas nearby and to ensure comparability among them. The receptor points were set at a height of 1.5 m to accommodate individual thermal responses.
3. Results
The comparison focuses on the thermal comfort patterns during specific hours of the day, particularly at 4:00 p.m., when the most unfavourable thermal conditions occur at the pedestrian level (1.5 m) for both 2020 and 2050 in the two SCs.
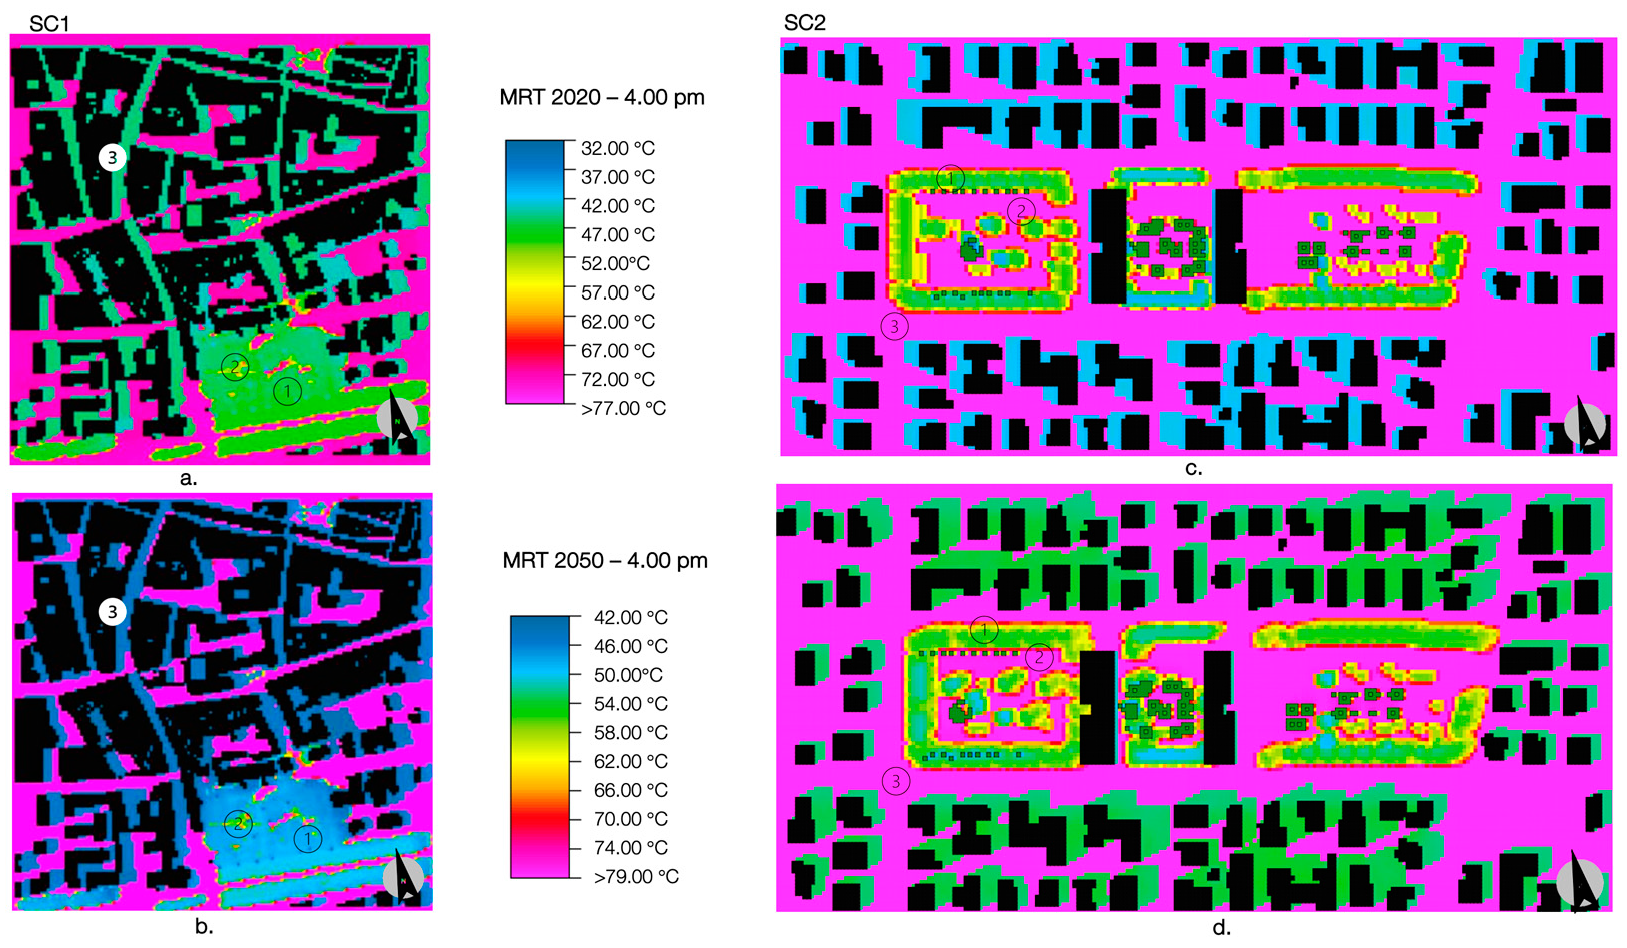
3.1. MRT and RH Comparison in 2020 and 2050
MRT results in SC1 (
Figure 3a,b) show a distinct thermal fluctuation when the green masses being examined are present. Compared to higher values in the 2050 scenario (receptor point RP1), which are approximately 50 °C, the MRT in SC1 is 47 °C in 2020. Higher MRT values (52 °C on receptor point RP2) are reported in the core parts of the botanic garden (where tree canopies are less dense). In 2050, the MRT is projected to reach 58 °C in receptor point RP2. MRT assessed in the nearby urban fabric (receptor point 3) can exceed 47 °C in 2020, and similar values can be detected in the 2050 scenario. Some helpful shadows on the main N-S road lower the MRT values.
In SC1 2020 maps, the ∆ MRT2020 (RP1–RP2) at h 4 p.m., assessed in receptor point 1 and 2, is around 5 °C, and the projected ∆ MRT2050 (RP1–RP2) at h 4 p.m. is equal to 7 °C.
Due to a large rise in air temperature, this gap suggests that in the future, green mass’ aptitude to lower MRT will be less effective.
The difference in the MRT distribution in SC2 (
Figure 3c) is primarily due to a less dense urban fabric and a less thick tree canopy. Rows of trees dramatically reduce the MRT values on the square borders, from 74 °C (RP2) in the unshaded area to 47 °C (RP1) under the dense tree canopy nearby the streets. In the eastern part of Piazzale Lubiana, where some trees are missing on the border, the MRT profiles are quite similar.
Wherever dispersed trees and bushes are located, they offer widespread and dense shade that reduces MRT by up to 54 °C.
The same trend in 2050 MRT projections can be seen in
Figure 3d where RP1 is around 54 °C and RP2, on the unpaved area, and fully exposed to the direct solar radiation is higher than 75 °C.
Unaffected by the shadows of the surrounding residential buildings, a significant portion of the direct solar radiation is received and accumulated on the large impervious roads, as in RP3 in 2020 and 2050 scenarios.
In SC2, the ∆ MRT2020 (RP1–RP2) at h 4 p.m. is 28 °C, and the projected ∆ MRT2050 (RP1–RP2) at h 4 p.m. is equal to 21 °C.
This gap indicates that the ability of green mass to reduce MRT will become less effective in the future due to a significant increase in air temperature.
It is remarkable to observe that the highly regular and rectilinear distribution of MRT values in residential areas is not as effective in reducing the increasing temperatures.
The tall buildings serve as a shield, preventing direct radiation from reaching the neighbourhood’s streets and private areas.
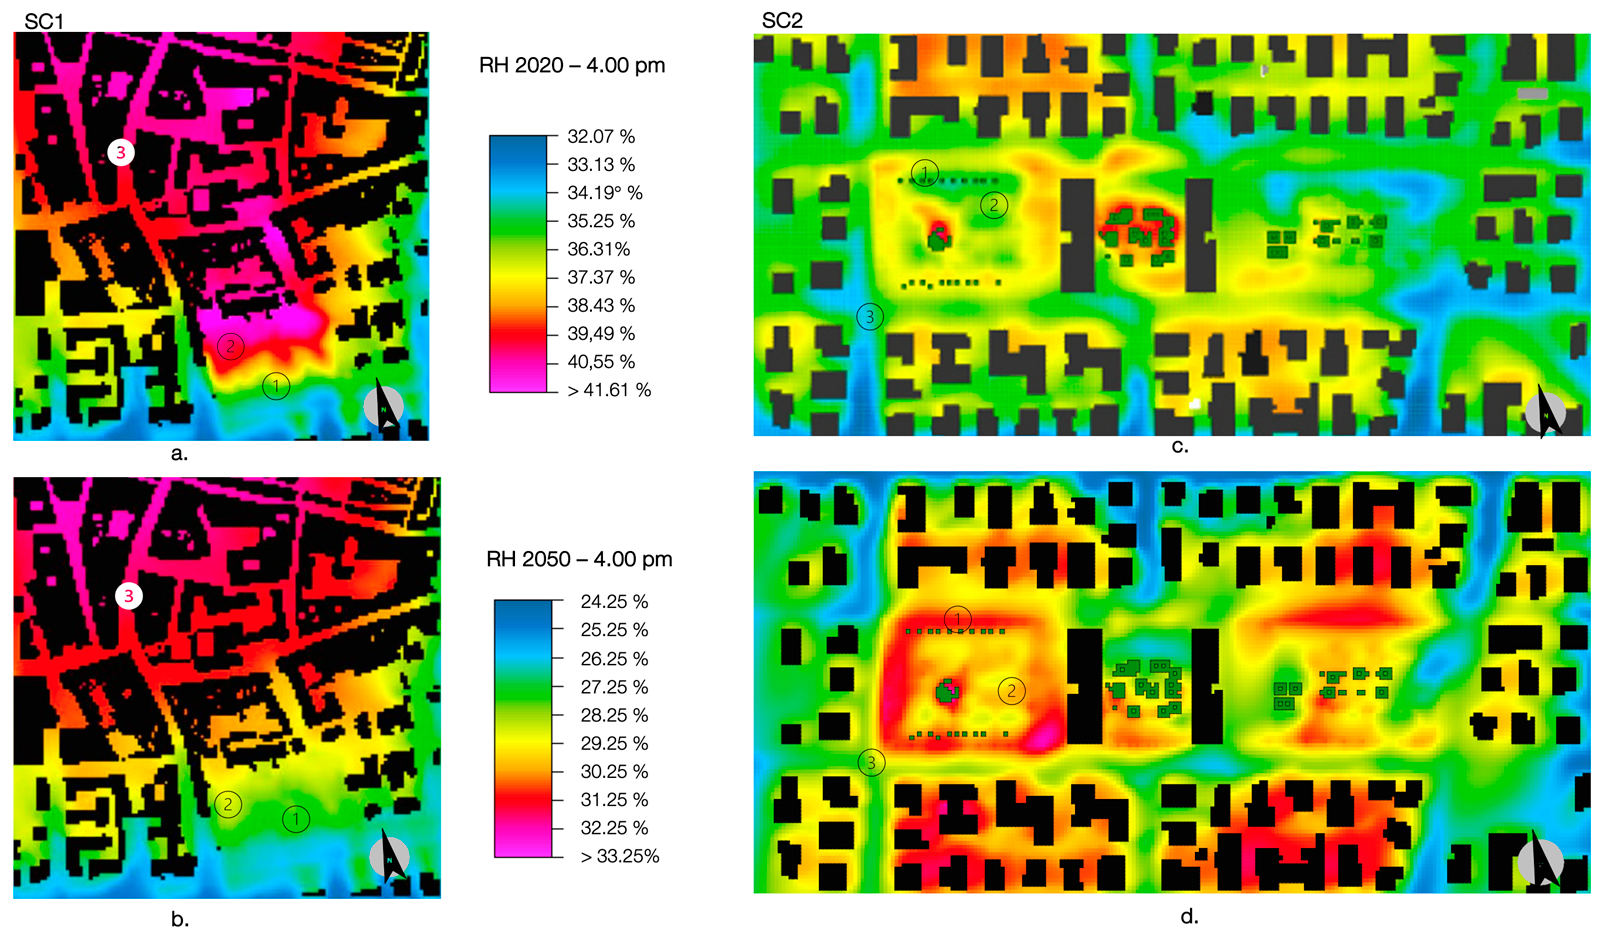
As numerous studies indicated, global warming is causing an increase in temperatures over land surfaces, which in turn leads to a significant decrease in relative humidity over land. Relative humidity at h 4 p.m. in 2050 is, in fact, predicted to be lower than 2020 by more than 7 percentage points.
With reference to RH values in SC1 (
Figure 4a and
Figure 5b), ∆ RH
2020 (RP1–RP3) at h 4 p.m. is around 6%, while the projected ∆ RH
2050 (RP1–RP3) at h 4 p.m. is around 4%.
This difference is less evident in SC2, mainly due to the less dense canopy trees and sparse vegetation.
In SC2 in the 2020 scenario (
Figure 4c), the RH in RP1 is slightly higher than in RP3, respectively, 35.25% and 34.19%. In the 2050 scenario (
Figure 4d), the higher RH values are under the tree canopy (RP1 is 31.25%), if compared to what is registered on the paved street surfaces, where RP3 is 27.25%.
3.2. PET Comparison in 2020 and 2050
The PET temperature in 2020 under the Orto Botanico canopy (
Figure 5a) is registered as 37.50 °C in RP1 and 39.50 °C in RP2, both categorized as strong heat stress in accordance with the PET classification.
The PET temperature on the street and other non-porous surfaces in the surrounding areas show a more thermal stressed area (RP4,
Figure 5a), reaching 43.50 °C (severe heat stress) in the larger street section, where no shading can be provided by building facades. Where buildings facades ensure a denser shade in RP3 (
Figure 4a), PET value is equal to 35.50 °C.
In the district’s impermeable areas (
Figure 5b, RP 4), the 2050 map displays PET temperatures exceeding 48 °C (severe heat stress). In contrast, the Orto Botanico canopy reports a lower PET temperature (RP1 is 43,70 °C and RP2 is 48.70 °C beneath the unshaded area). The 4.3 °C PET difference (∆ PET
2050 1–4) between the green space of the botanic garden and the surrounding street of the urban fabric highlights the evapotranspiration power of the green mass.
When comparing the average PET values of the green mass to those found in the small, shadow-cast streets beneath tall building facades, the discrepancy is reduced to just 2 °C (∆ PET2050 1–3).
The difference between the PET values in the 2050 scenario (∆ PET2050 1–3) suggests that the green mass’s capacity to counterbalance the raising temperatures decreases as temperature raises. Instead, the average PET values in the areas covered by the dense shadows cast by the buildings or the small streets of the historic fabric are consistent with those found in the botanical garden.
The PET values estimated in the SC2 scenarios (
Figure 5c,d) show a significantly distinct distribution of thermal stress in the area. The park’s permeable surface (RP2) highlights a slight thermal stress with PET values as 43.50 °C (
Figure 5c, RP1) in the area where the tree canopies are denser.
The absence of shade causes heat to rise where the absence of shadow is prevalent (
Figure 5c, RP2) and the PET values in these areas exceed 53.70 °C, comparable to what happens on the residential streets covered with asphalt (RP3). Tall and close buildings in the surrounding urban area provide shadows that assist in keeping the immediate vicinity of the buildings from heating up too much and where RP4 reaches lower PET value, around 41.50 °C.
The periphery of the square is the only region where the shade effect of the treetops extends, and where more tolerable PET values (41 °C) are found. This is also because the tall residential buildings that surround the square provide some additional shade and prevent the accumulation of latent heat.
The greater the distance from the green area, the greater is the thermal distress.
When the 2050 map is examined (
Figure 5d), it becomes clear that the trees around the square and those in the middle of the permeable area will still be useful in reducing local temperature. The 2050 projection indicates that the difference in average PET values in the surroundings of the square’s trees will vary slightly in future scenarios in which ∆ PET
2020 1–3 is 3 °C and ∆ PET
2050 1–3 is 2 °C.
Table 4a,b compile the overall thermal performances for SC1 and SC2 with respect to geometrical urban features and green masses.
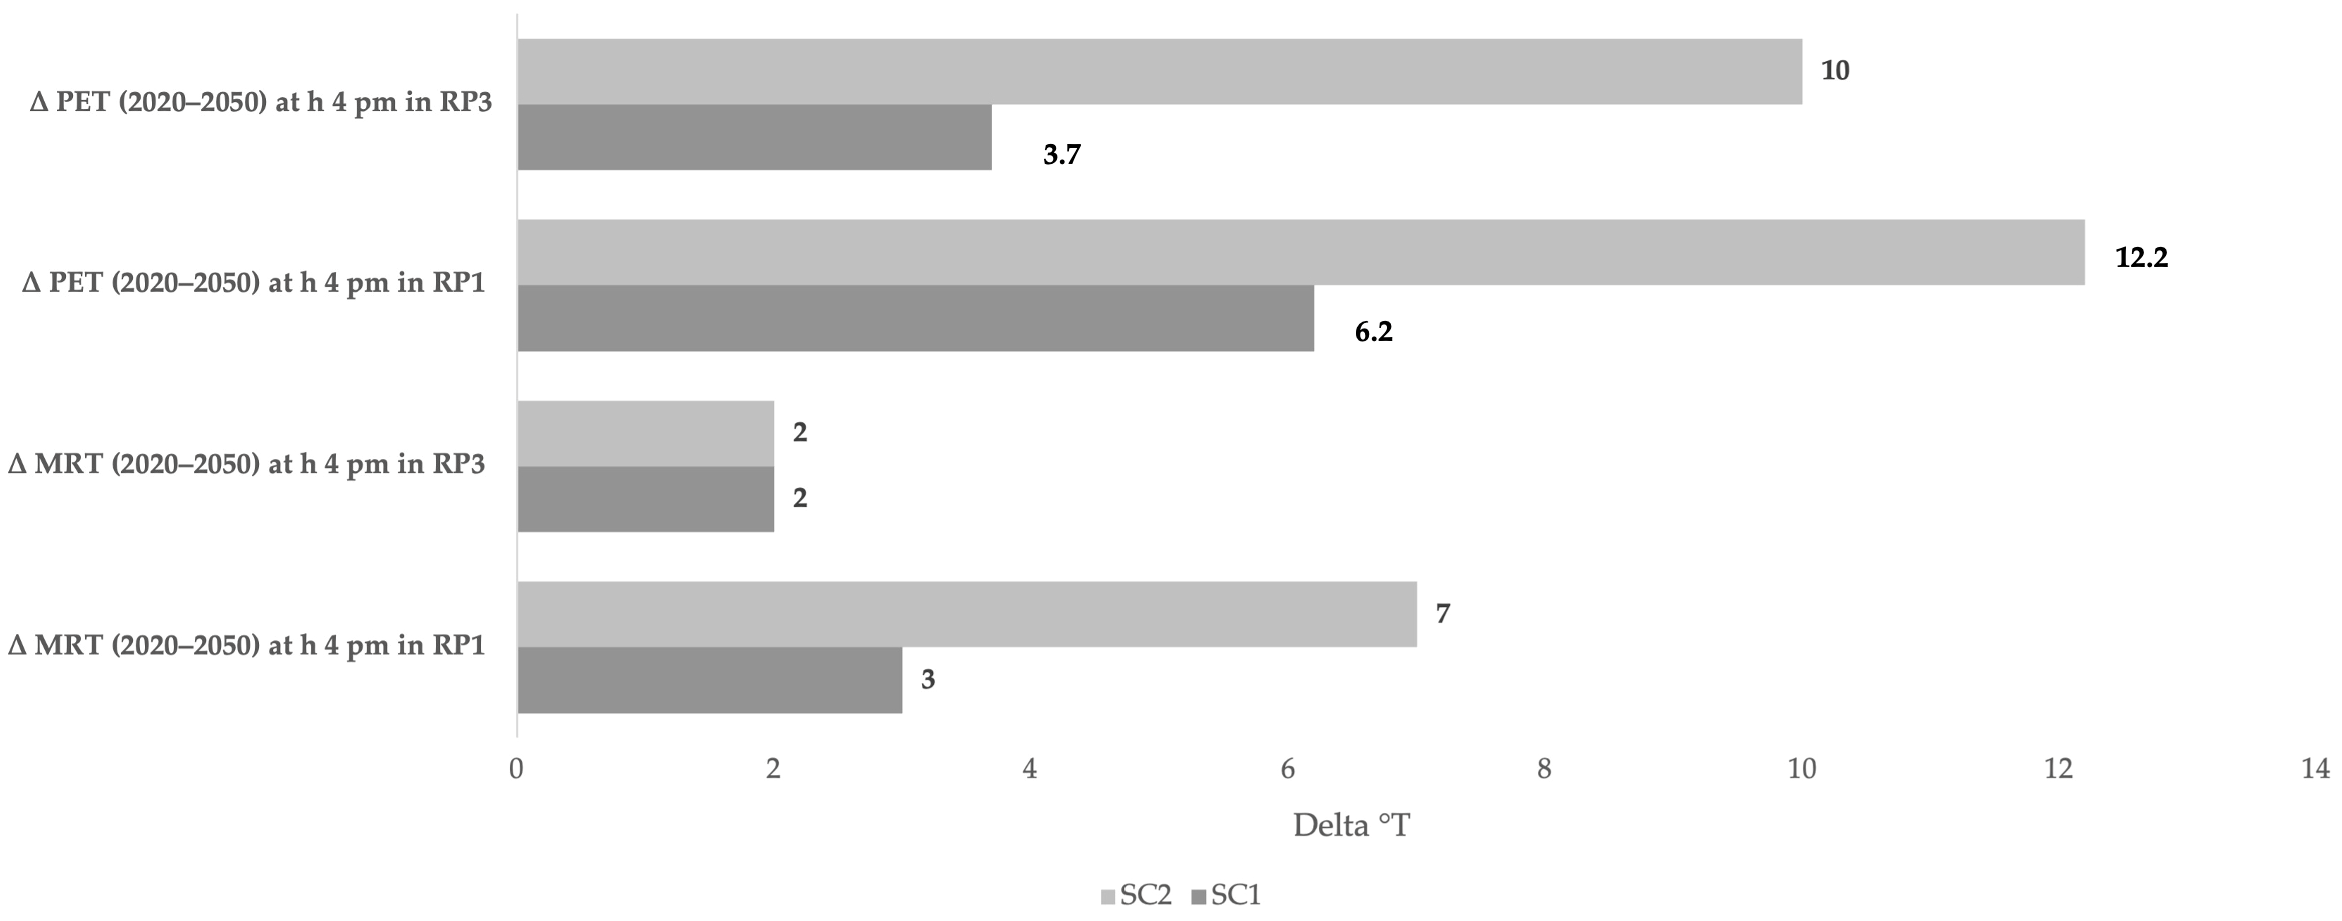
The comparison of thermal resilience (
Figure 6), specifically the absolute difference in values between 2050 and 2020, calculated for both the green areas (RP1) and the compact urban areas (RP3), shows that the absolute difference in both the MRT and PET values is lower in dense and compact urban fabrics.
Even though both SC1 and SC2′s green masses reduce their aptitude to counteract the effects of the raising temperatures, the most noticeable distinction between them can be found in non-green areas (
Figure 6). Rather, the noteworthy difference can be seen in the way the urban fabric around the green spaces reacts to heat.
The height of the building facades, the compactness of the building fronts, and the narrowness of the streets play a substantial role in ensuring shadows, and consequently, shielding against the accumulation of heat from direct solar radiation.
4. Discussion
For SC1 and SC2, an adequate level of thermal comfort may generally be found where cast shadows are denser, both in 2020 and in 2050. It is important to highlight that urban shape has an impact on the microclimate processes of shadow patterns and ventilation, which reduce heat stress. The only open areas that benefit from wind flows are those nearby a larger street or where the urban blocks present a hiatus from the dense urban fabric. This is evident in some open areas in the SC1 urban texture, and less evident in SC2, where the regular urban grid and the large urban canyon limit the wind speed, as well as the heat dissipation. This pattern of thermal comfort distribution suggests that high shadow density will be beneficial even in future warmer climates.
The absolute difference in PET and MRT values (
Table 4b) shows that SC1, namely the historical urban area, is more resilient to climate change: the SC1 ∆ MRT (2020–2050) at h 4 p.m. in green area (RP1) is 3 °C, and reveals that in future scenarios, the MRT is going to increase less compared to what is projected to happen in SC2, where ∆ MRT (2020–2050) at h 4 p.m. in RP1 (under the trees canopy) is 7 °C. The same evaluation related to RP3 (the paved street nearby the green masses) discloses a similar behaviour.
With reference to RH values, as temperatures rise, the relative humidity value under the treetops rises because it becomes harder to dissipate the heat that was absorbed. The assessed ∆ PET (2020–2050) at h 4 p.m. in the green area (RP1) is 12.20 °C at h 4 p.m. in the green area of Piazzale Lubiana, and 10 °C in the impervious street urban (RP3).
It is possible to partially extend similar observations on the potentialities of dense green areas and urban fabric to other dense or more modern urban textures in similar climates. Previous and noteworthy research on urban texture demonstrated that the urban layout has a considerable impact on MRT, and consequently on PET values [
37,
38,
39,
40].
As supported by the analysis here offered, an increased density of shaded areas can mitigate outdoor temperature values and reduce direct radiation on facades, thereby reducing PET values.
Limitations of the Study
Some limitations must be considered for this research. First, given the vast variety of tree species that significantly influence ENVI-met calculation times, to draw up this research, the various species of trees that can have a significant impact on ENVI-met calculation times were not taken into consideration. To evaluate the trees, their height, trunk diameter, and crown diameter were considered in the growth regime.
Only deciduous trees were considered, which represent over 90% of the trees in the green areas under study. Additionally, the climate analysis considers the presence of stable vegetation in the ENVI-met Albero routine.
This restraint is primarily due to the abundance of a wide variety of tree species, including both mature and younger specimens. This means that allometric parameterization is not considered in projecting future growth in the next 30 years.
Second, the simulations were conducted using a simple forcing method and a short time series of only 24 h. As a result, the data obtained only reflect the local-scale effects of vegetation and urban morphology and do not take account for mesoscale urban feedback.
Last, the wind velocity maps are deliberately disregarded because the effects of local wind speed on vegetation are poorly predicted. This is due to a simplified wind profile, and the projected weather scenario does not include wind speed values for the projected future scenario. This last constraint is also linked to the fact that wind speeds in many places slowed by about 10–15 percent below the annual average. This supports the projection that surface winds over Europe should undergo the so-called global terrestrial stilling due to climate change effects. However, there is no conclusive evidence of global stilling caused by climate change.
For all the previous considerations, when assessing the PET values, which account for four variables, including MRT, pot air T, RH, and wind speed, this final restriction needs to be carefully considered.
5. Conclusions
The benefits associated with the presence of green and dense vegetation within the city in the case of Cfa (humid subtropical) climates are now evident, not only in terms of reducing and controlling heat, but also in relation to the proven systemic effects that green vegetation can provide today. Apart from the well-known range of positive outcomes for biodiversity, production, aesthetic, and recreational values, what remains overlooked is the potential beneficial contribution that the masses will be able to make in relation to rising temperatures.
One of the most suggested NBS for counteracting excessive urban heat is to increase the canopy of urban trees. Tree morphological features can undoubtedly grant some positive effects on urban climates through shading and tree transpiration. Despite a vast number of studies that demonstrated the negative link between the extent of the tree canopy and the urban air or land surface, the thermal resilience of green urban spaces in comparison to urban open areas shows that compact urban fabric decreases PET values due to the extensive project of shadows in a more effective way rather than the green urban areas.
Assessing today’s thermal stress suggests that the denser and more compact the green mass, the greater the influence on limiting overheating in the current scenario.
These preliminary results imply that vegetation in mid and temperate regions will be vulnerable to the effects of climate change, which will lead to a partial loss of its ability to control the local climate. This is because, in contrast to what occurs today, trees might not be able to tolerate the overheating.
When assessing the projected future scenario, the green mass capability of counteracting the rising temperature appears to be decreasing, and on the other hand, the most valuable contribution is due to the extensive shadows projected by building facades. In particular, the dense and compact urban fabric of the historical settlements tends to be more effective in limiting the rising temperature than the sparser shadows in the case of modern and more dilated urban fabric.
Considering the thermal stress conditions in the projected 2050 climatic scenario, it is evident that high density, both in urban texture and in green spaces, is the factor that ensures greater thermal resilience.
This is particularly true in the local climate being considered, and applies to both dense compact mid-rise buildings and open arrangements of tall buildings (over 4 stories) with ample pervious land cover.
The study also highlights how the historical urban fabric, although more impervious and with a minor distribution of permeable areas, is likely to be more thermally resilient in view of climate change.
Based on these findings, future NBS strategies may aim to maximize the presence of densely shaded urban green areas, particularly in mid-temperate climates such as the city of Parma. This will help maximize airflow and mitigate the hot and dry climate predicted in the near future.
As the thermal effect varies between the simulation software’s data and on-site temperature and relative humidity data collection, future studies will address a wider range of urban textures with more comprehensive microclimatic assessments. Additionally, they will compare the effects derived from different spatial configurations of trees, also including tree species consideration. Furthermore, real-time on-site monitoring is anticipated, with special attention to wind velocity profiles.


