
Dynamic Monitoring of Winter Wheat Health in Mining Subsidence Areas by Combined Active and Passive Remote Sensing Technology


Abstract
:1. Introduction
2. Study Area and Data
2.1. Study Area
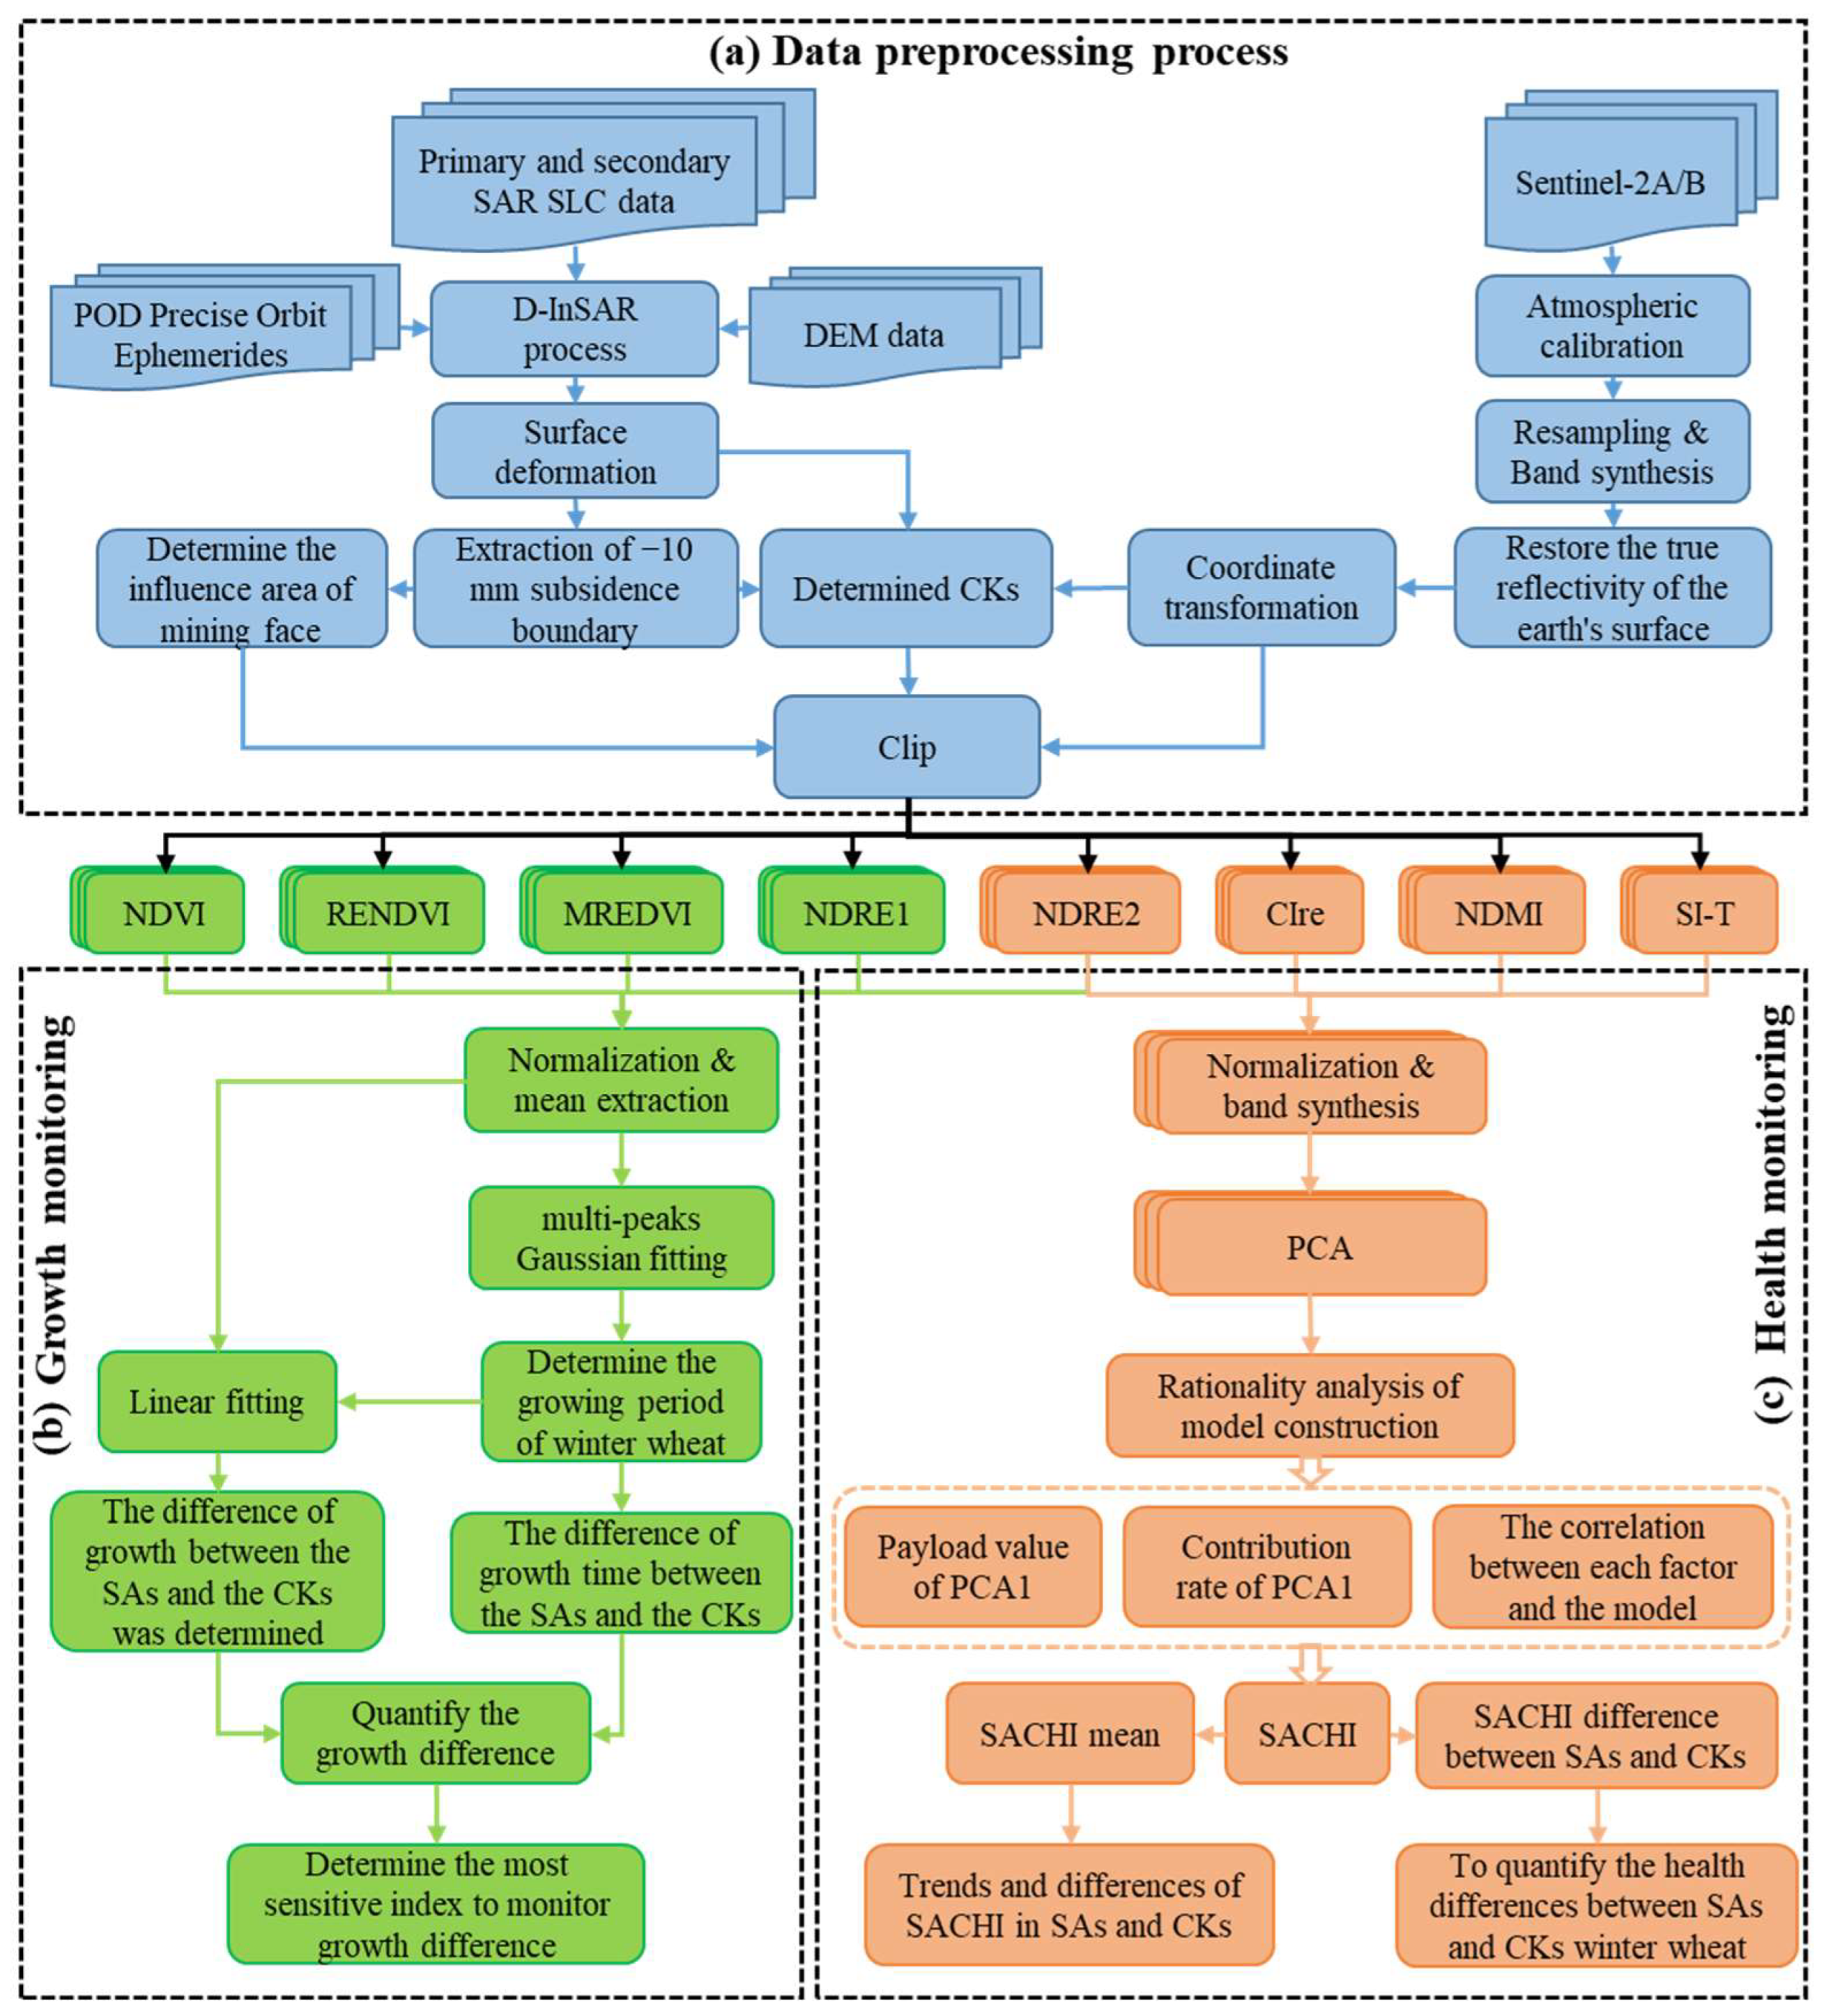
2.2. Data Source and Pre-Processing
3. Methods
3.1. Calculation Methods of Vegetation Index
3.2. Crop Growth Trend Analysis
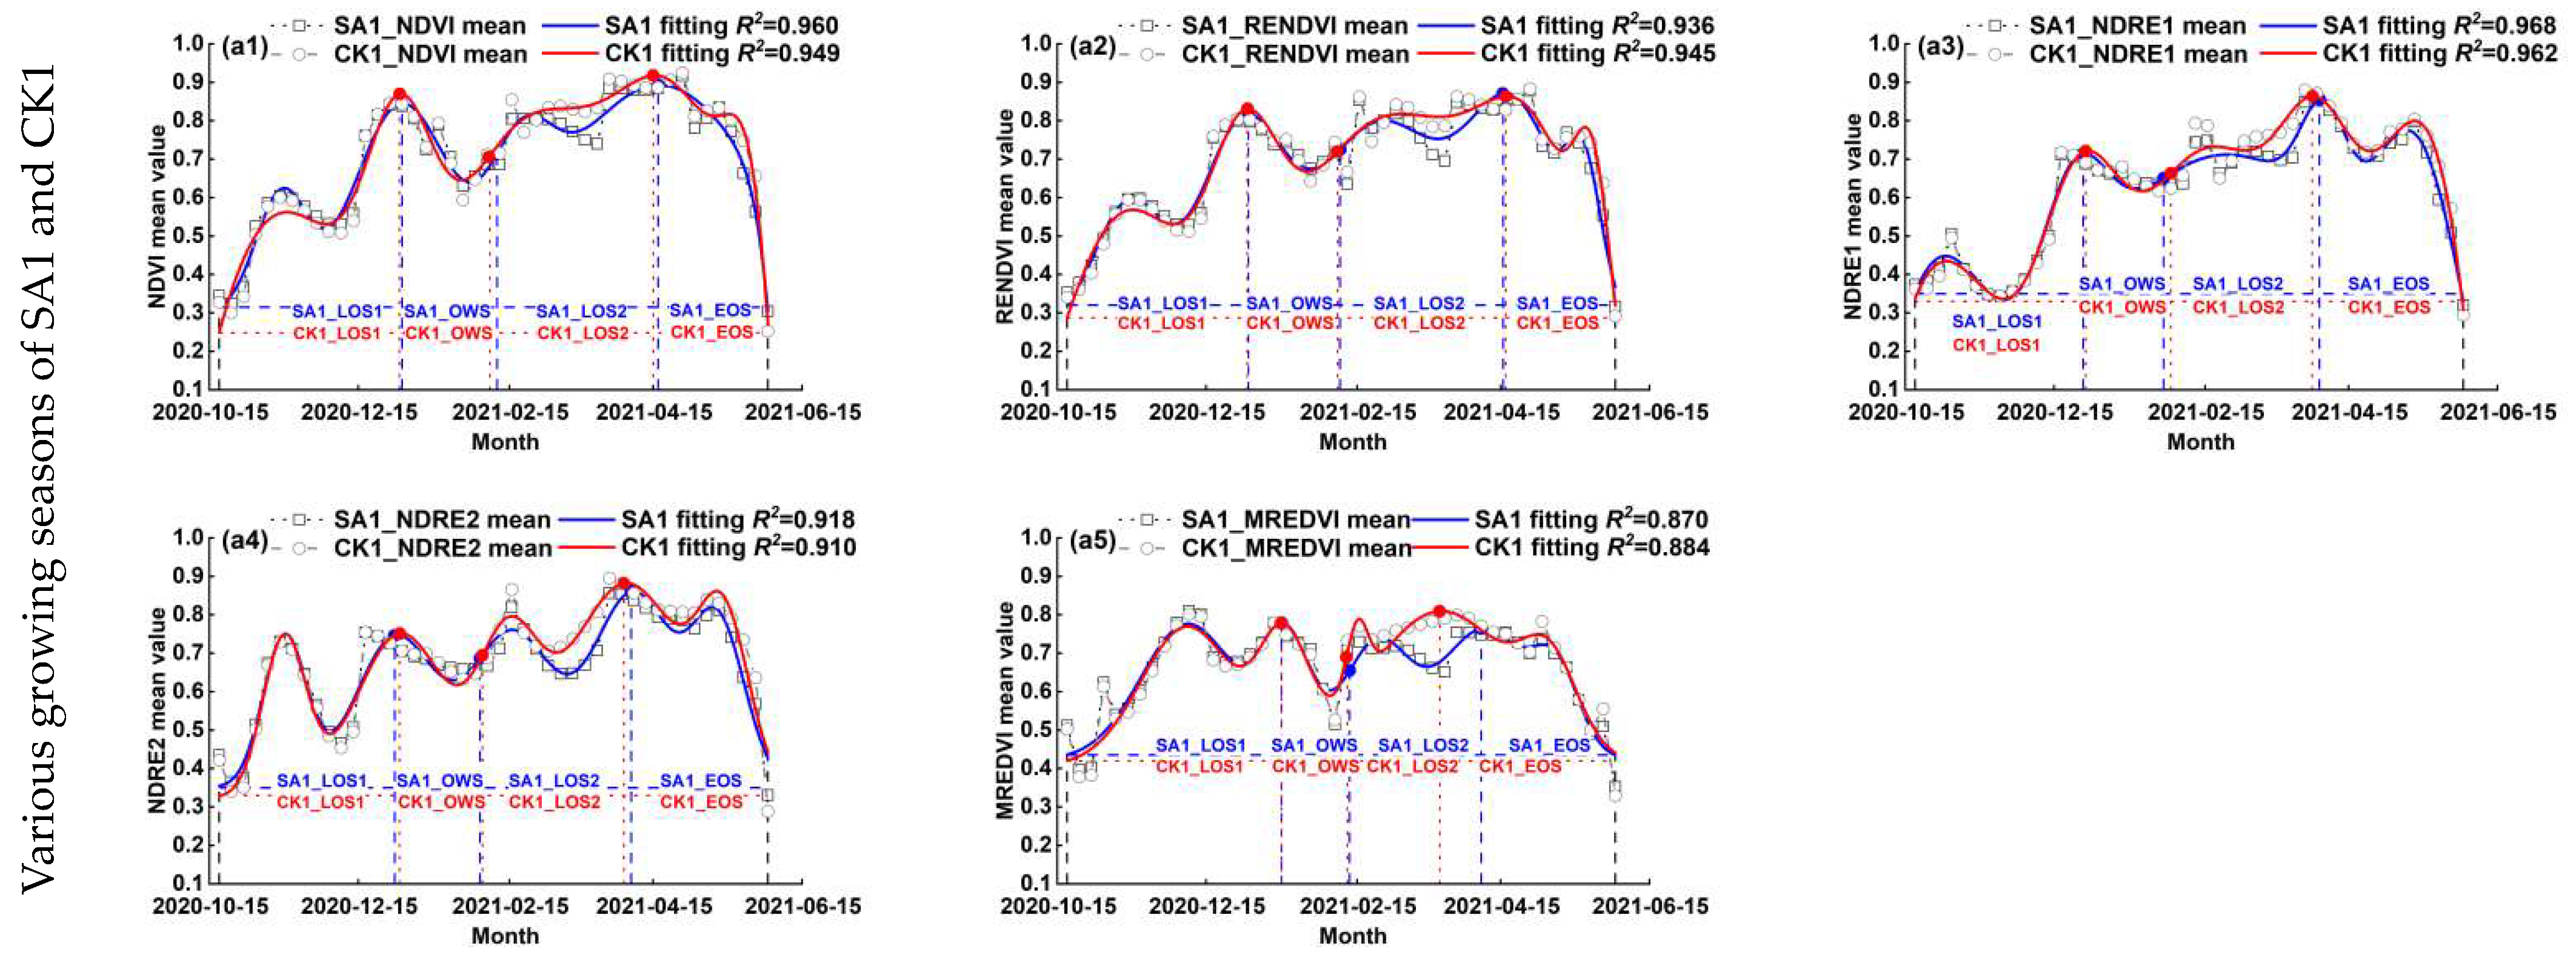
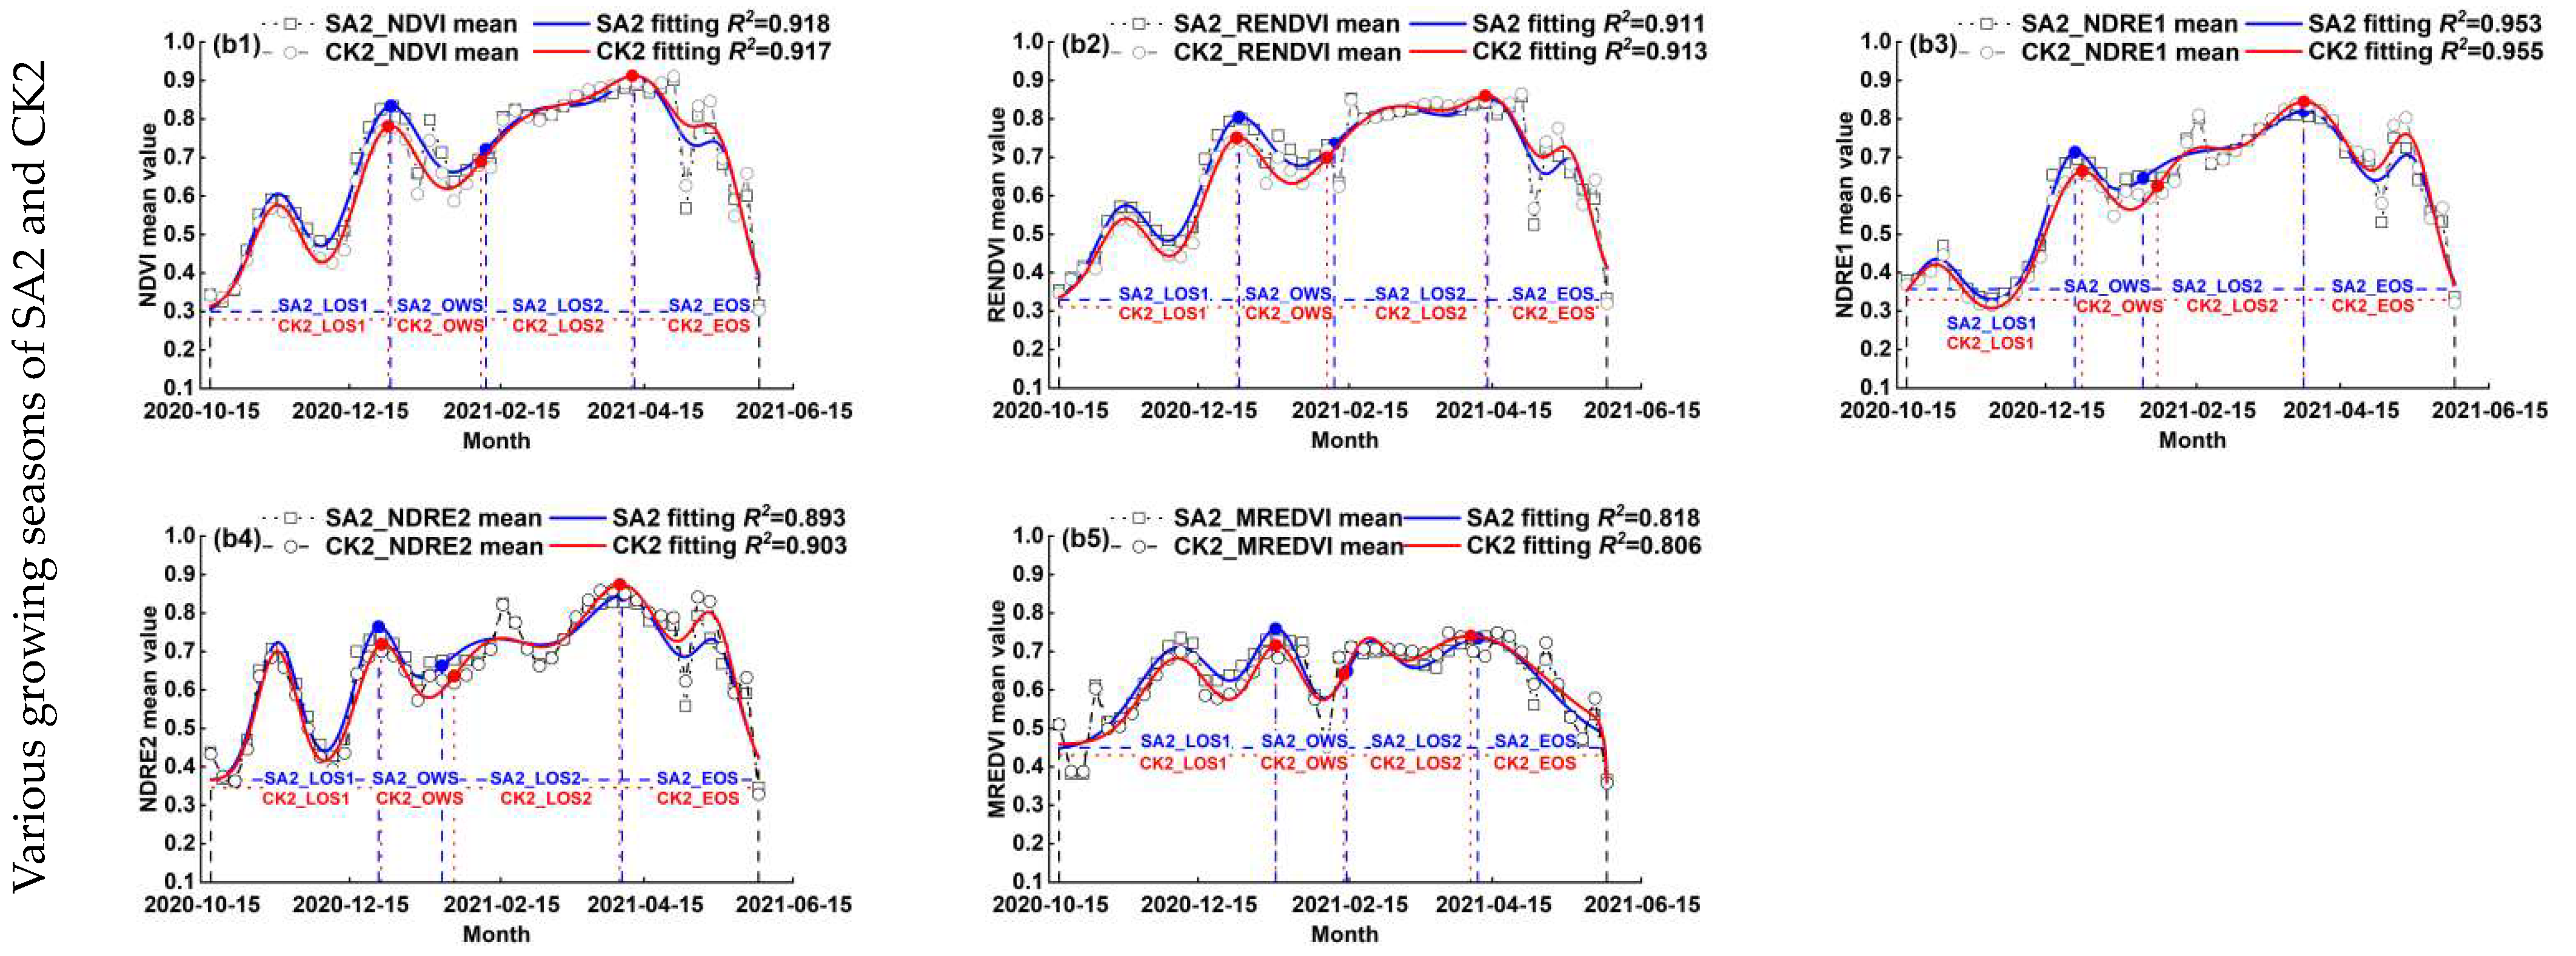
3.2.1. Gaussian Multi-Peak Fitting
3.2.2. Definition of Different Growing Seasons
3.2.3. Determination of Growth Rate and Change Amplitude for Each Growing Season
3.3. Construction of Crop Health Assessment Model
3.4. Binary Logistic Regression
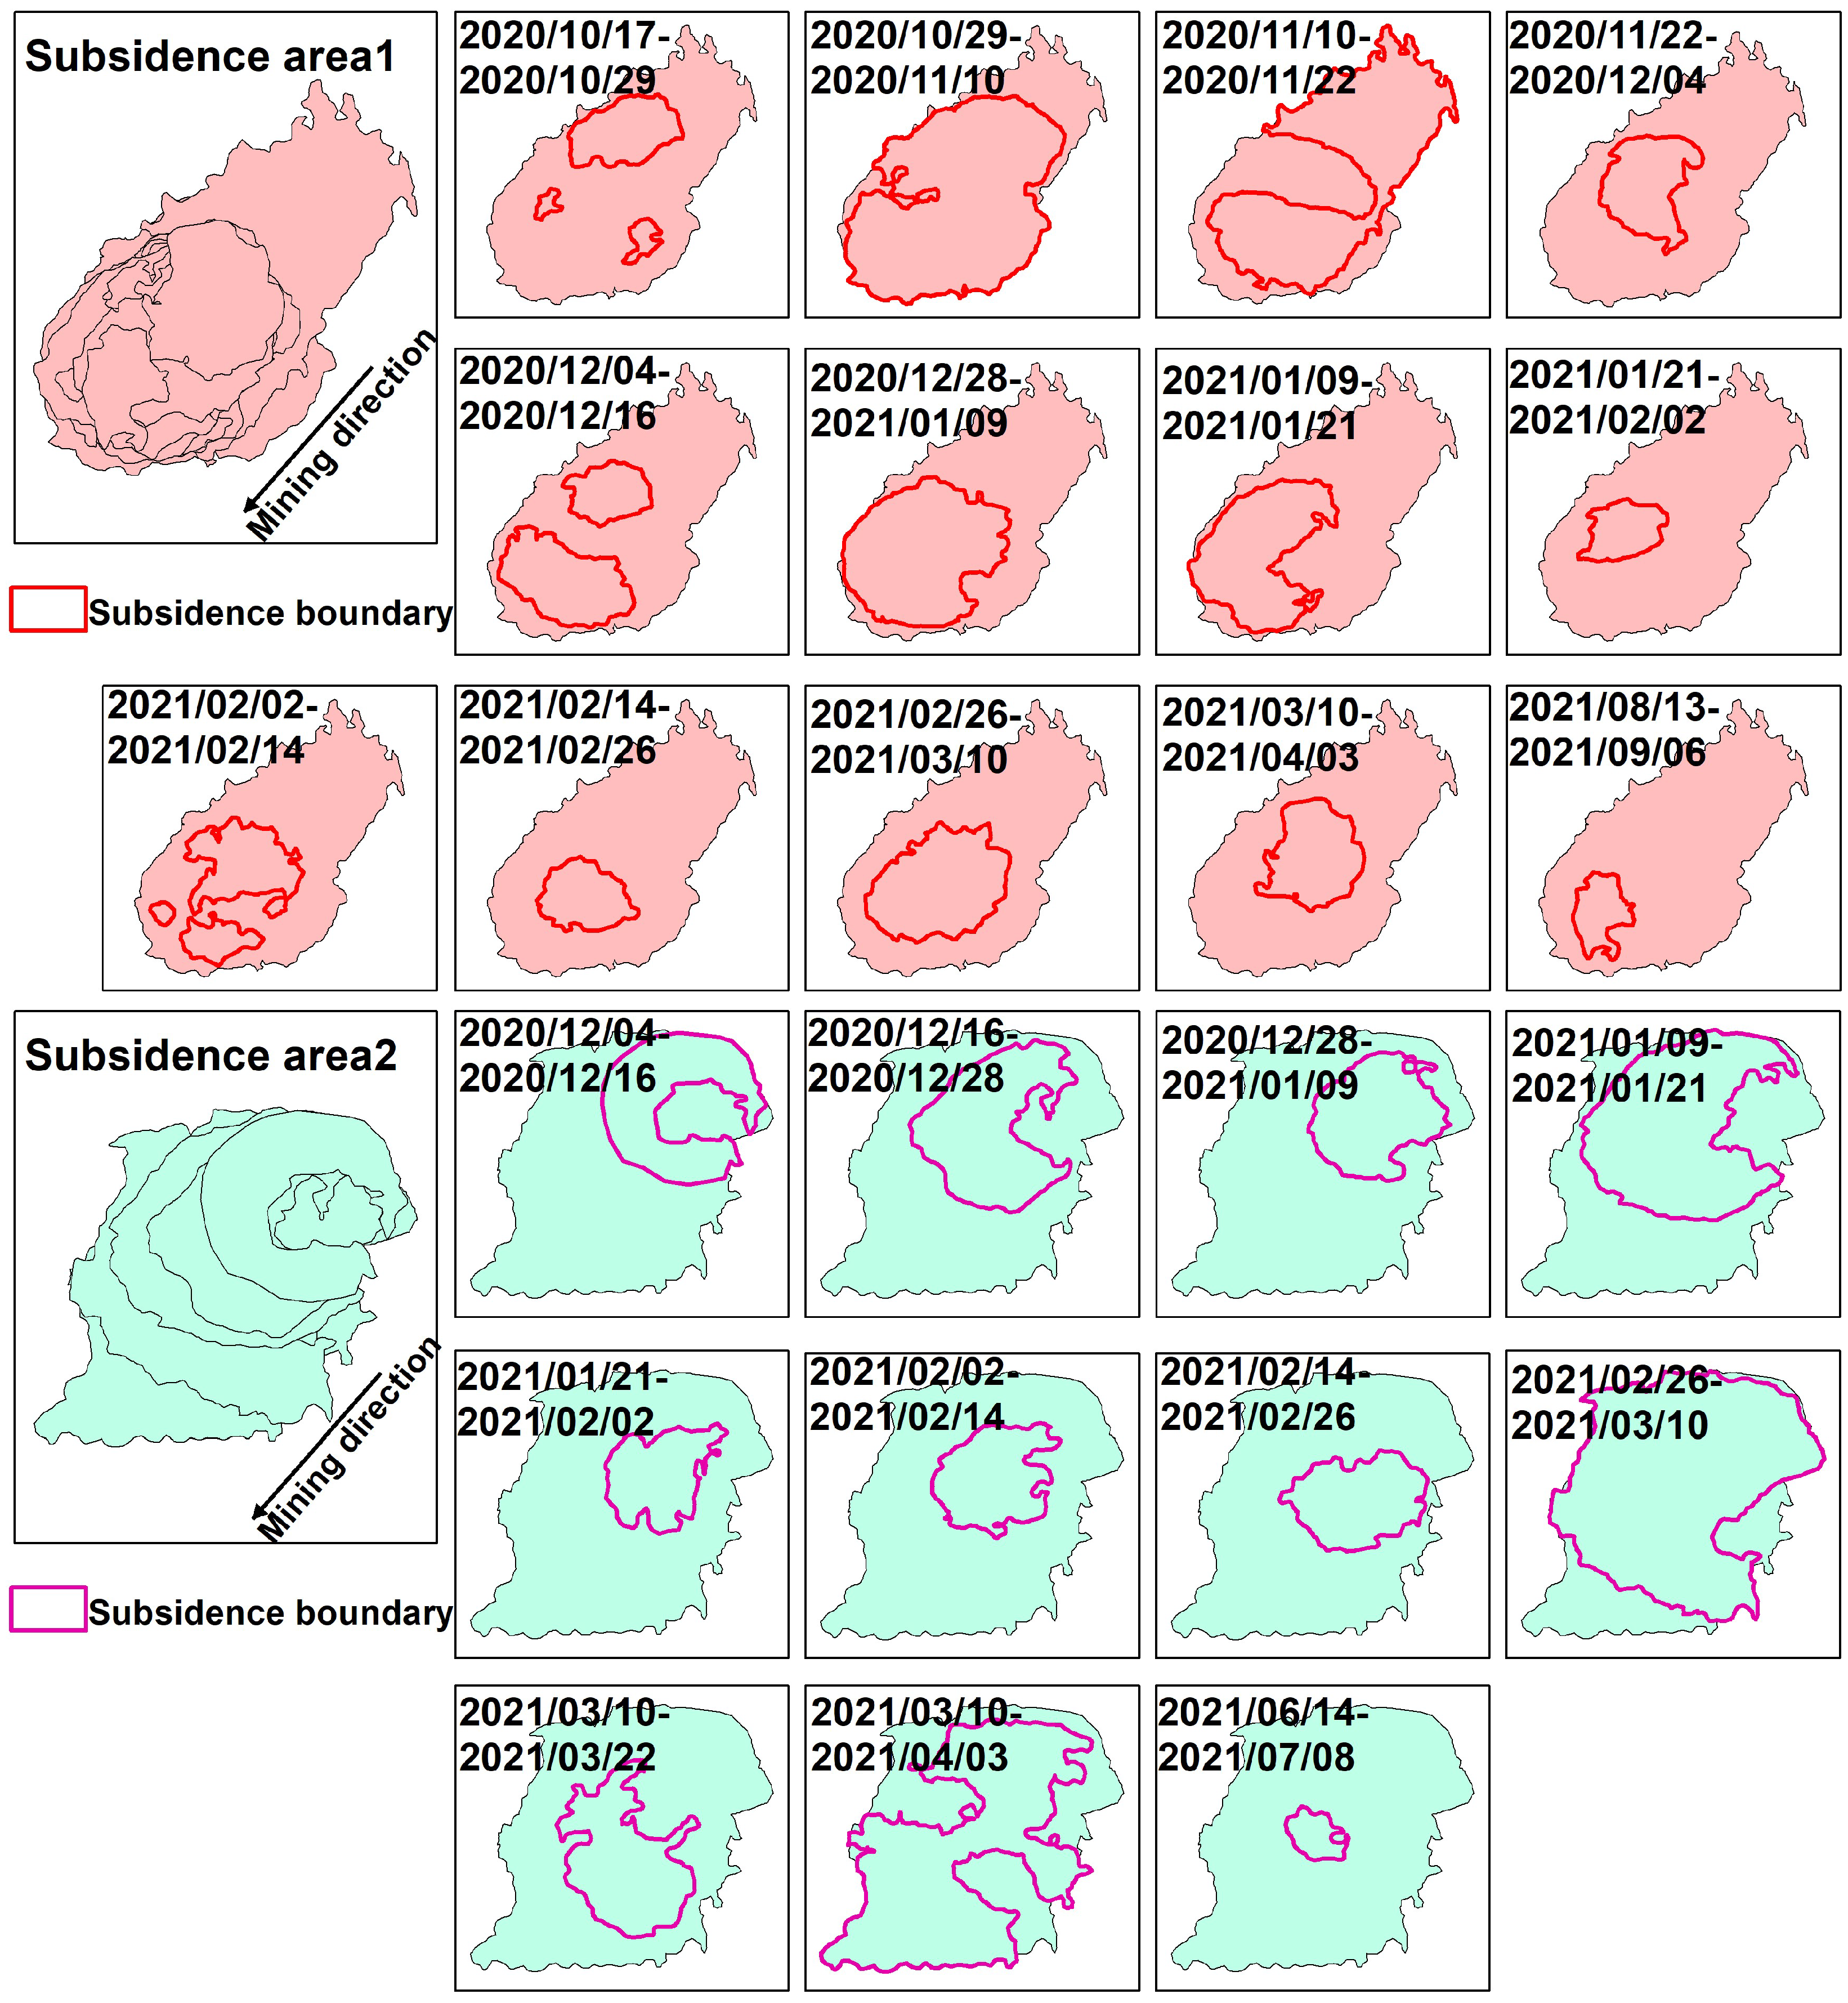
4. Results and Analysis
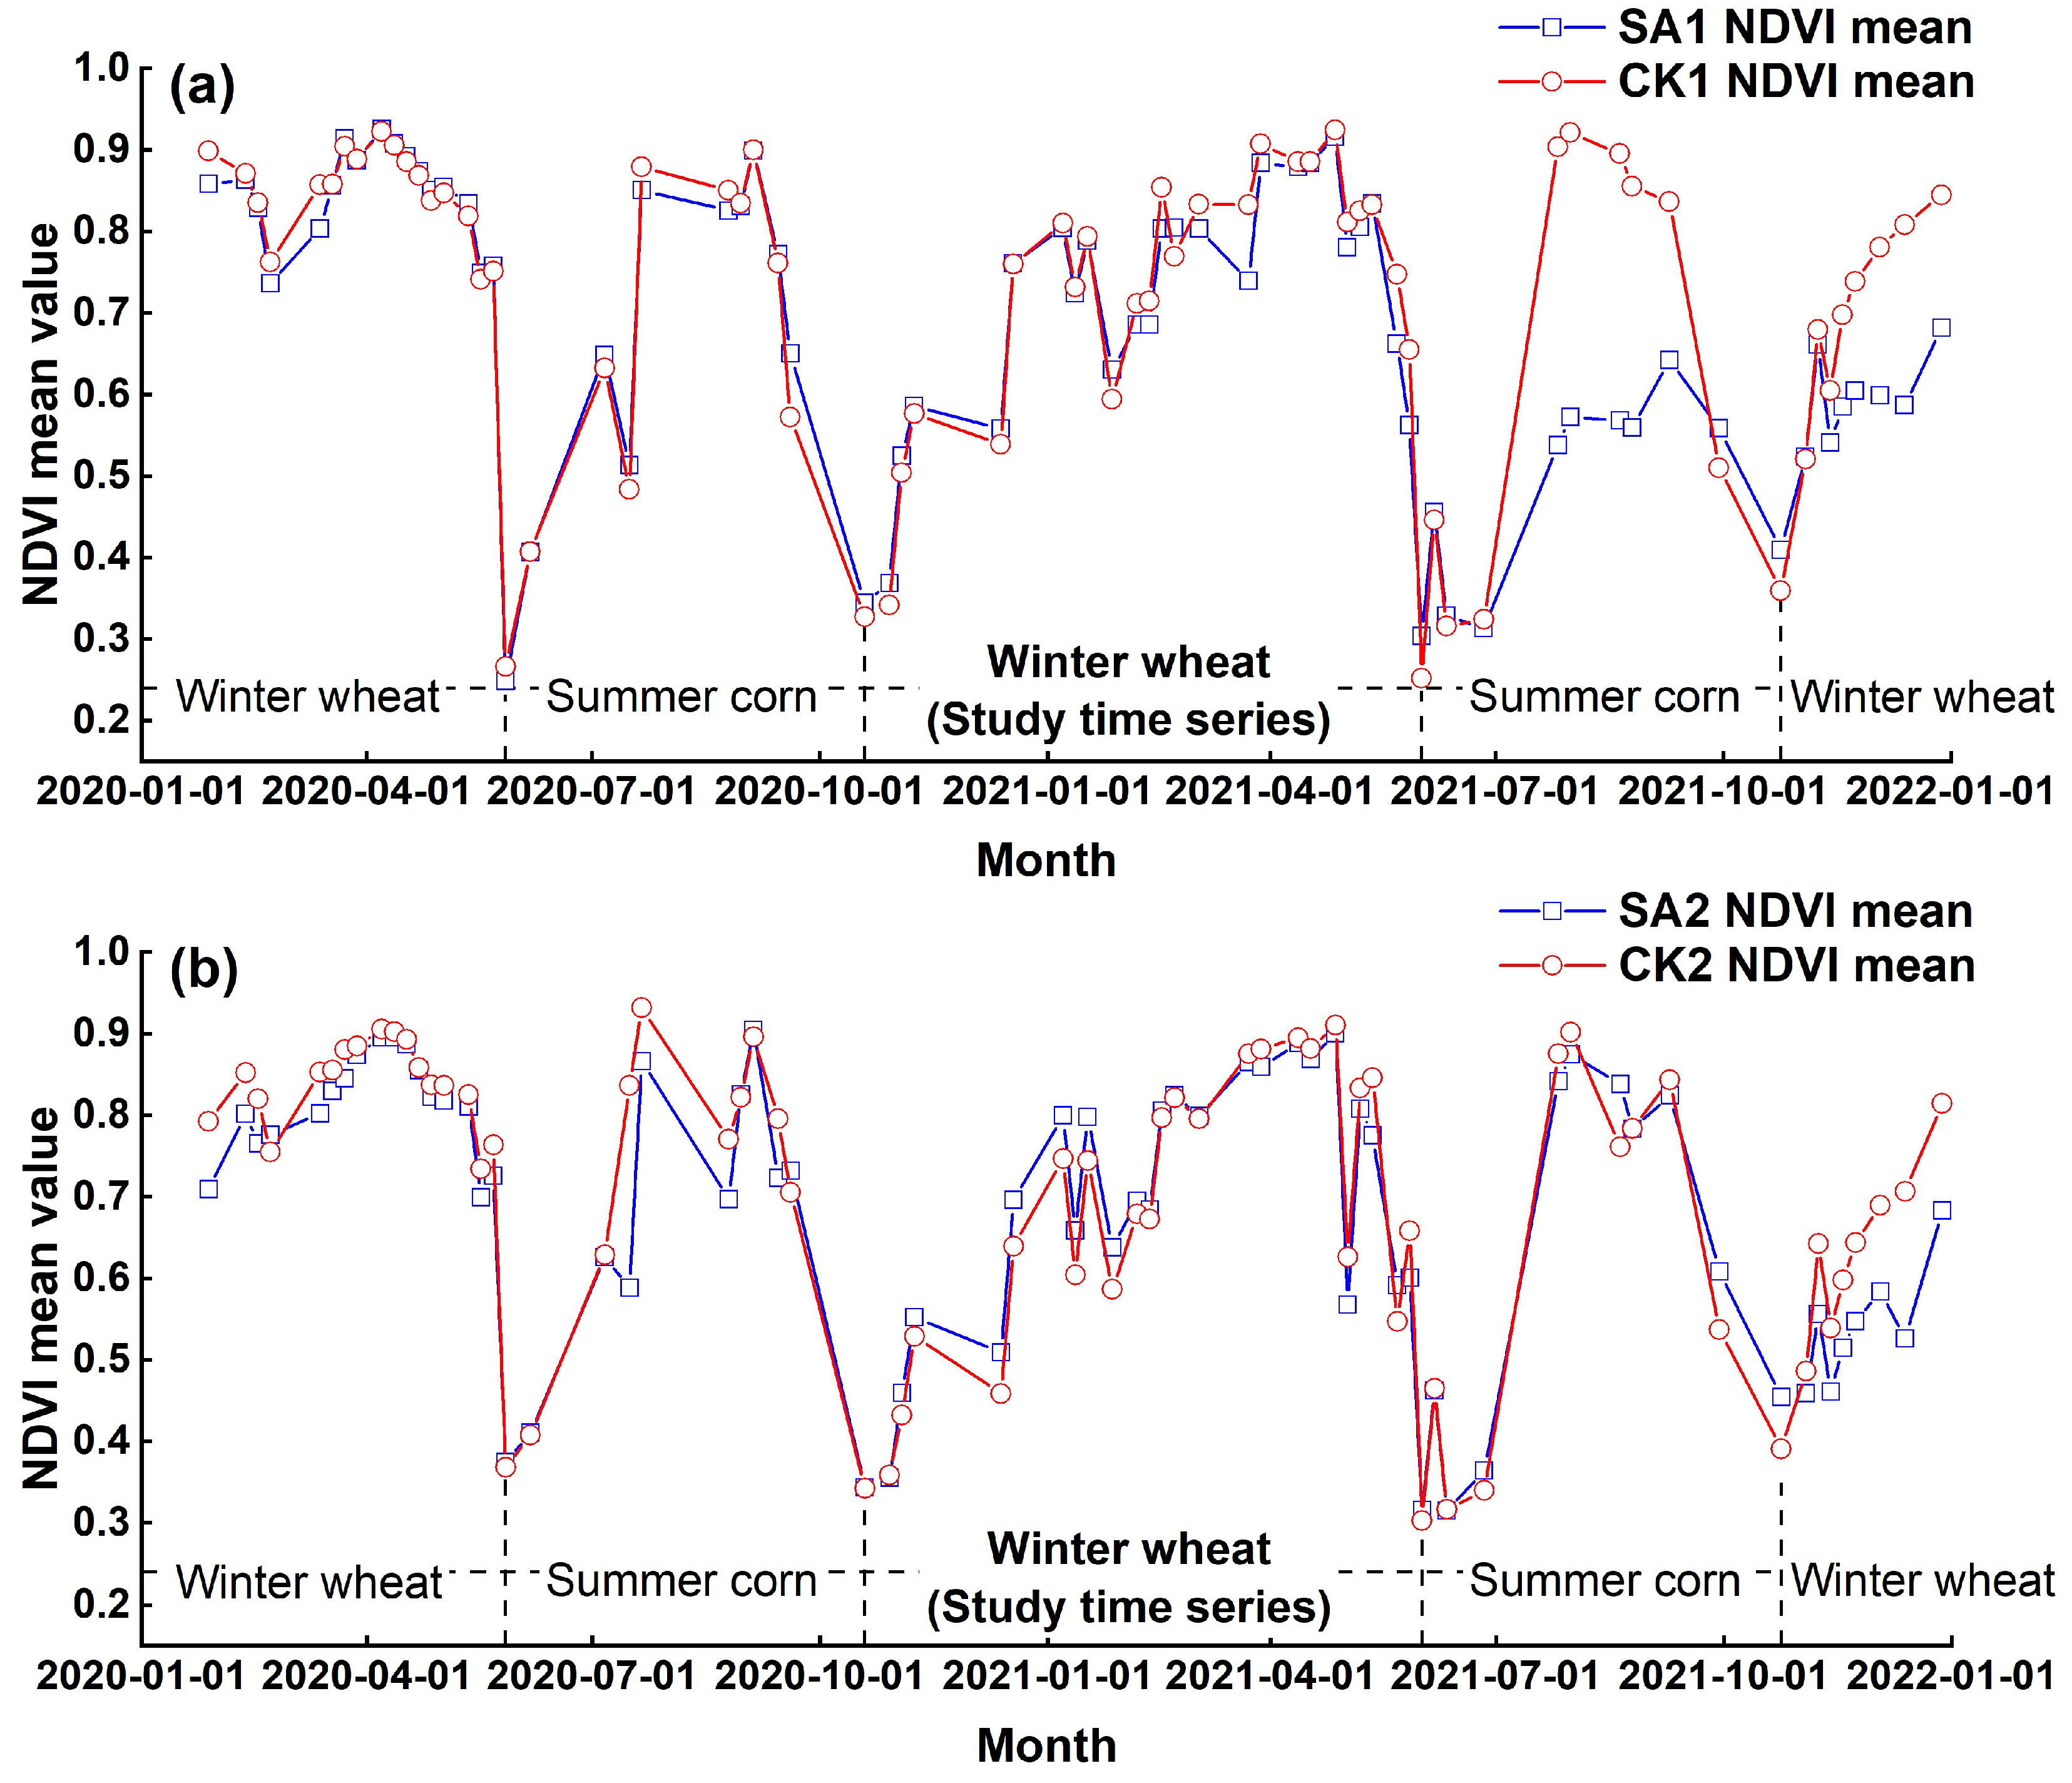
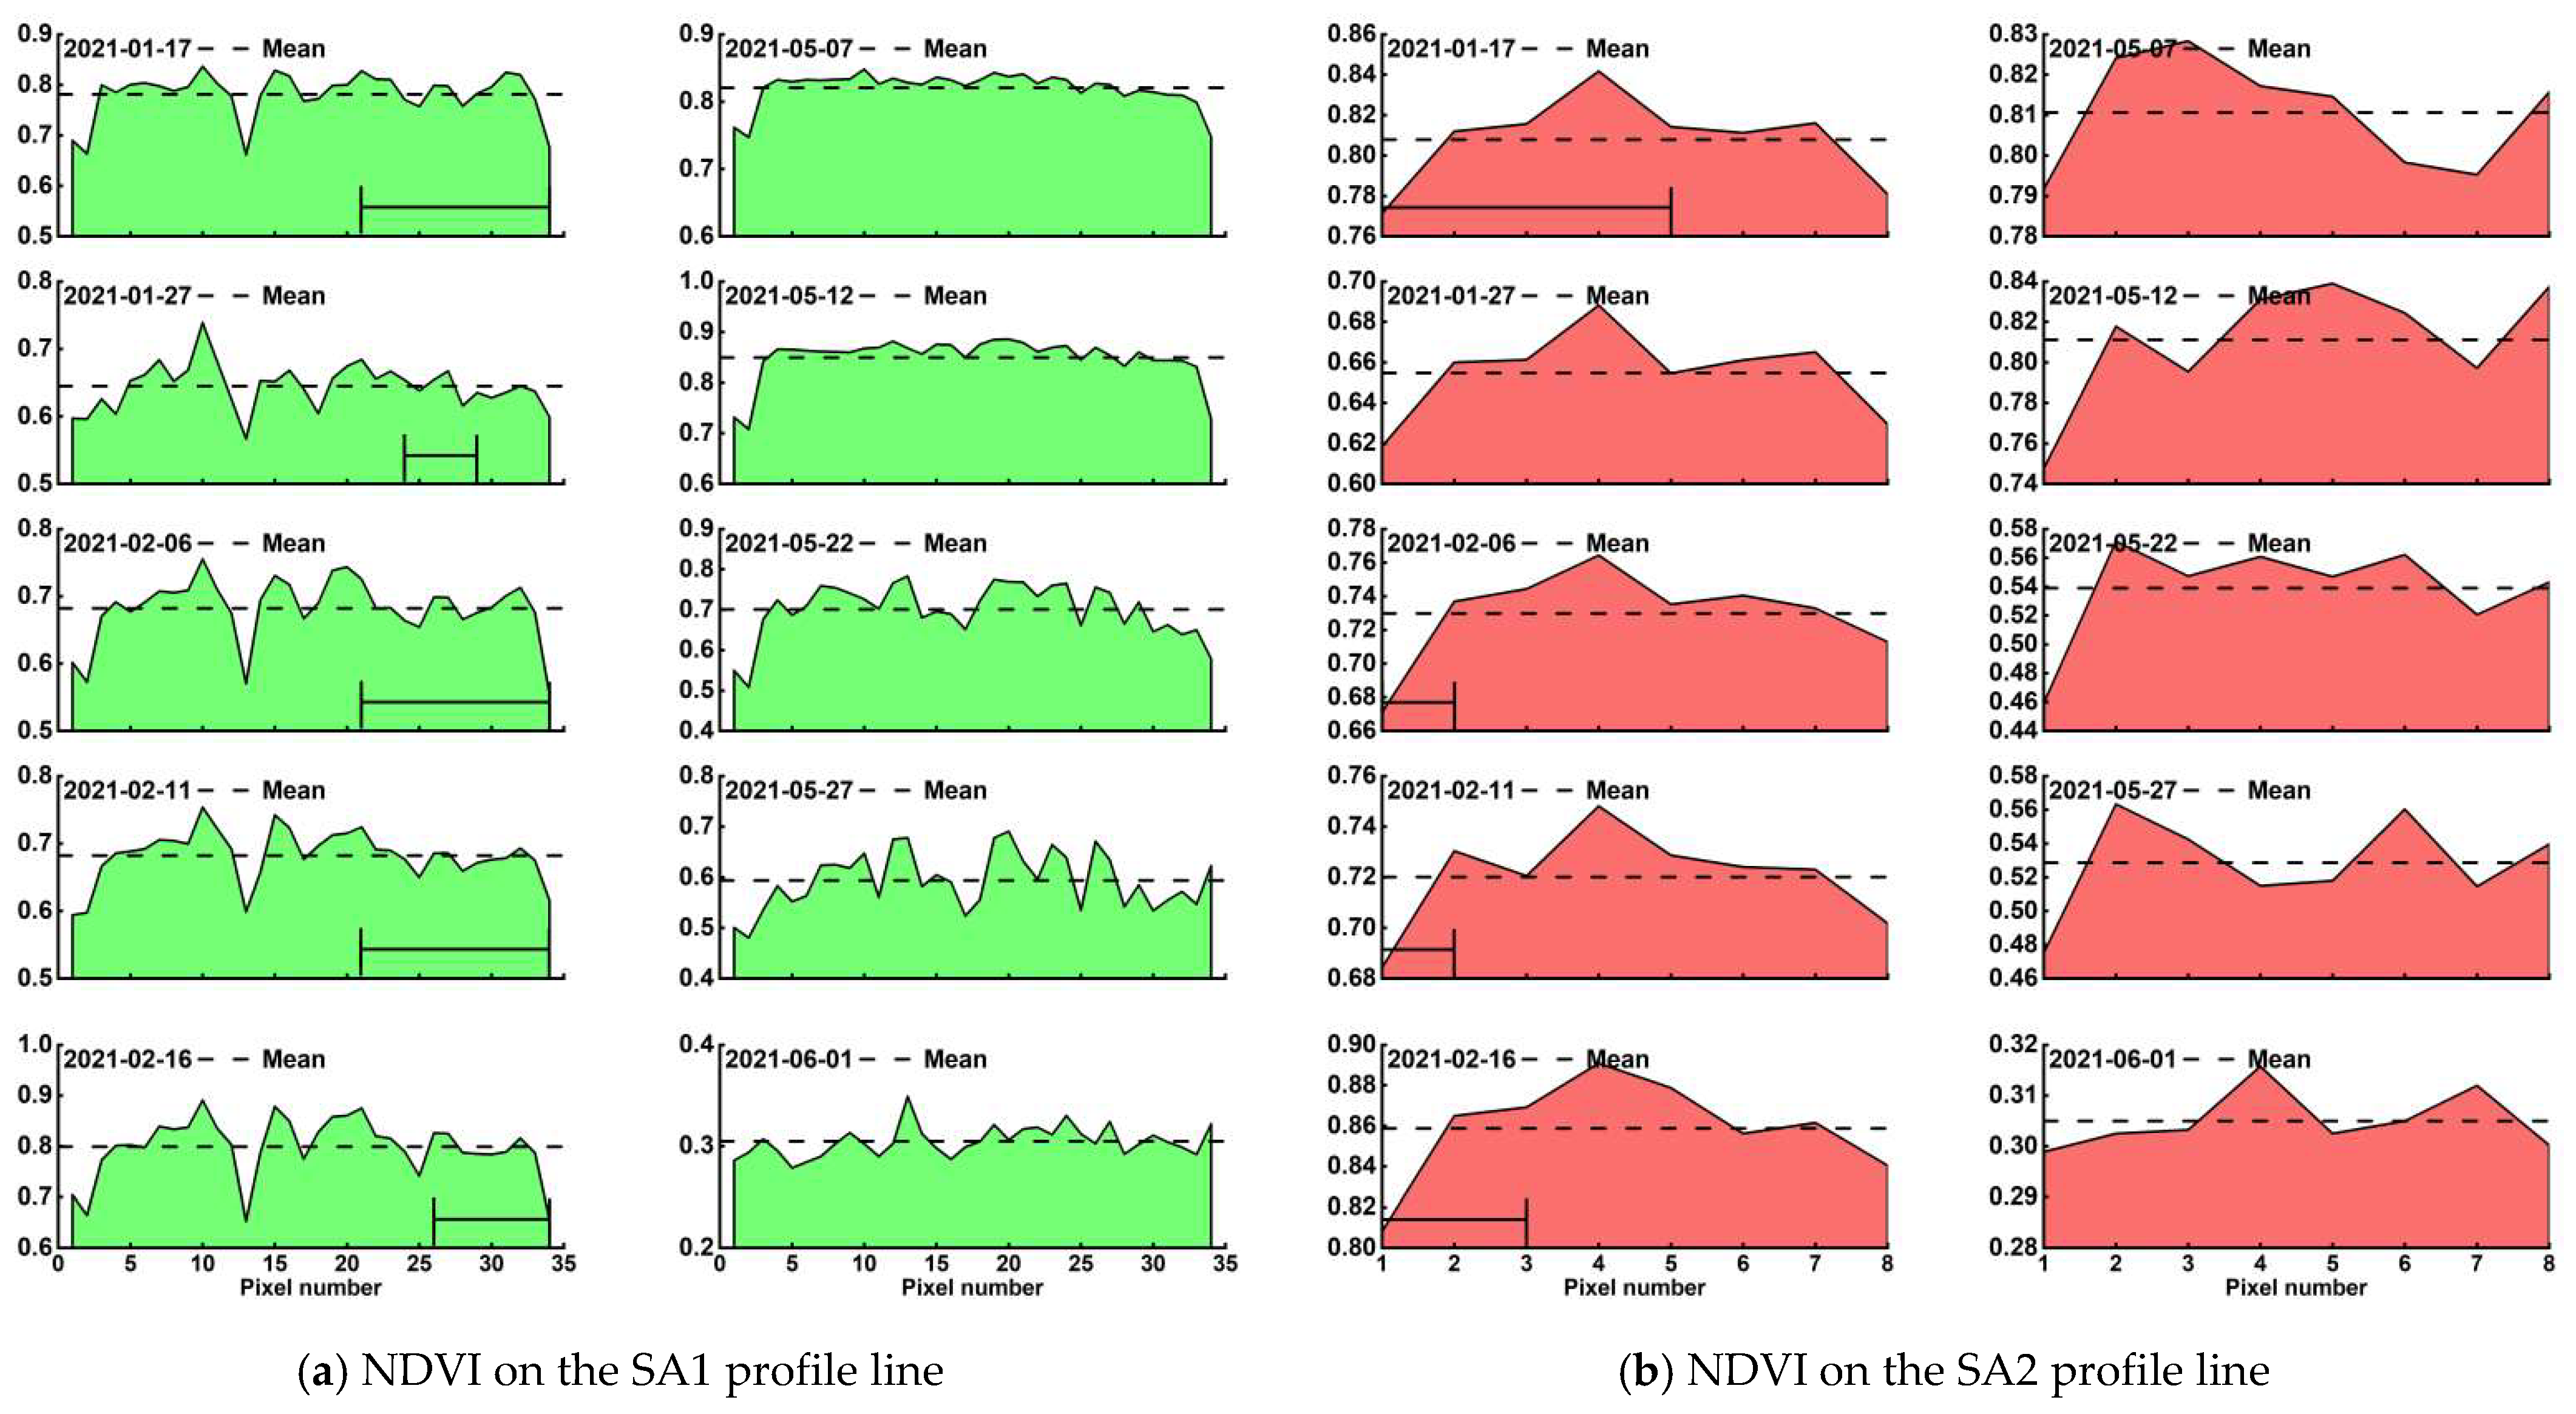
4.1. Time-Series NDVI Profile Lines
- (1)
- There were a total of 26 time-series NDVI profile lines in the SA1, of which part of the 16 profile lines were located in the impact area during the advancement of the mining workings. It could be seen that there was a fluctuating phenomenon in the NDVI of the area affected by mining subsidence, and the remaining 14 phases were dominated by fluctuating decreases, except for the fluctuating upward trends in the two phases of 3 November 2020 and 8 November 2020.
- (2)
- The SA2 area was first impacted by mining subsidence on 18 December 2020, and a total of 26 time-series NDVI profile lines were obtained, with part of the 10 profile lines located within the impact area during the advancement of the mining workings. It could also be seen that there was a fluctuation phenomenon in the NDVI of the area affected by mining subsidence, but the change characteristics were not clear because the fewer pixels on the profile lines.
4.2. Areal Differences in Length of Growing Season between SAs and CKs
4.3. Growth Differences in Length of Growing Season
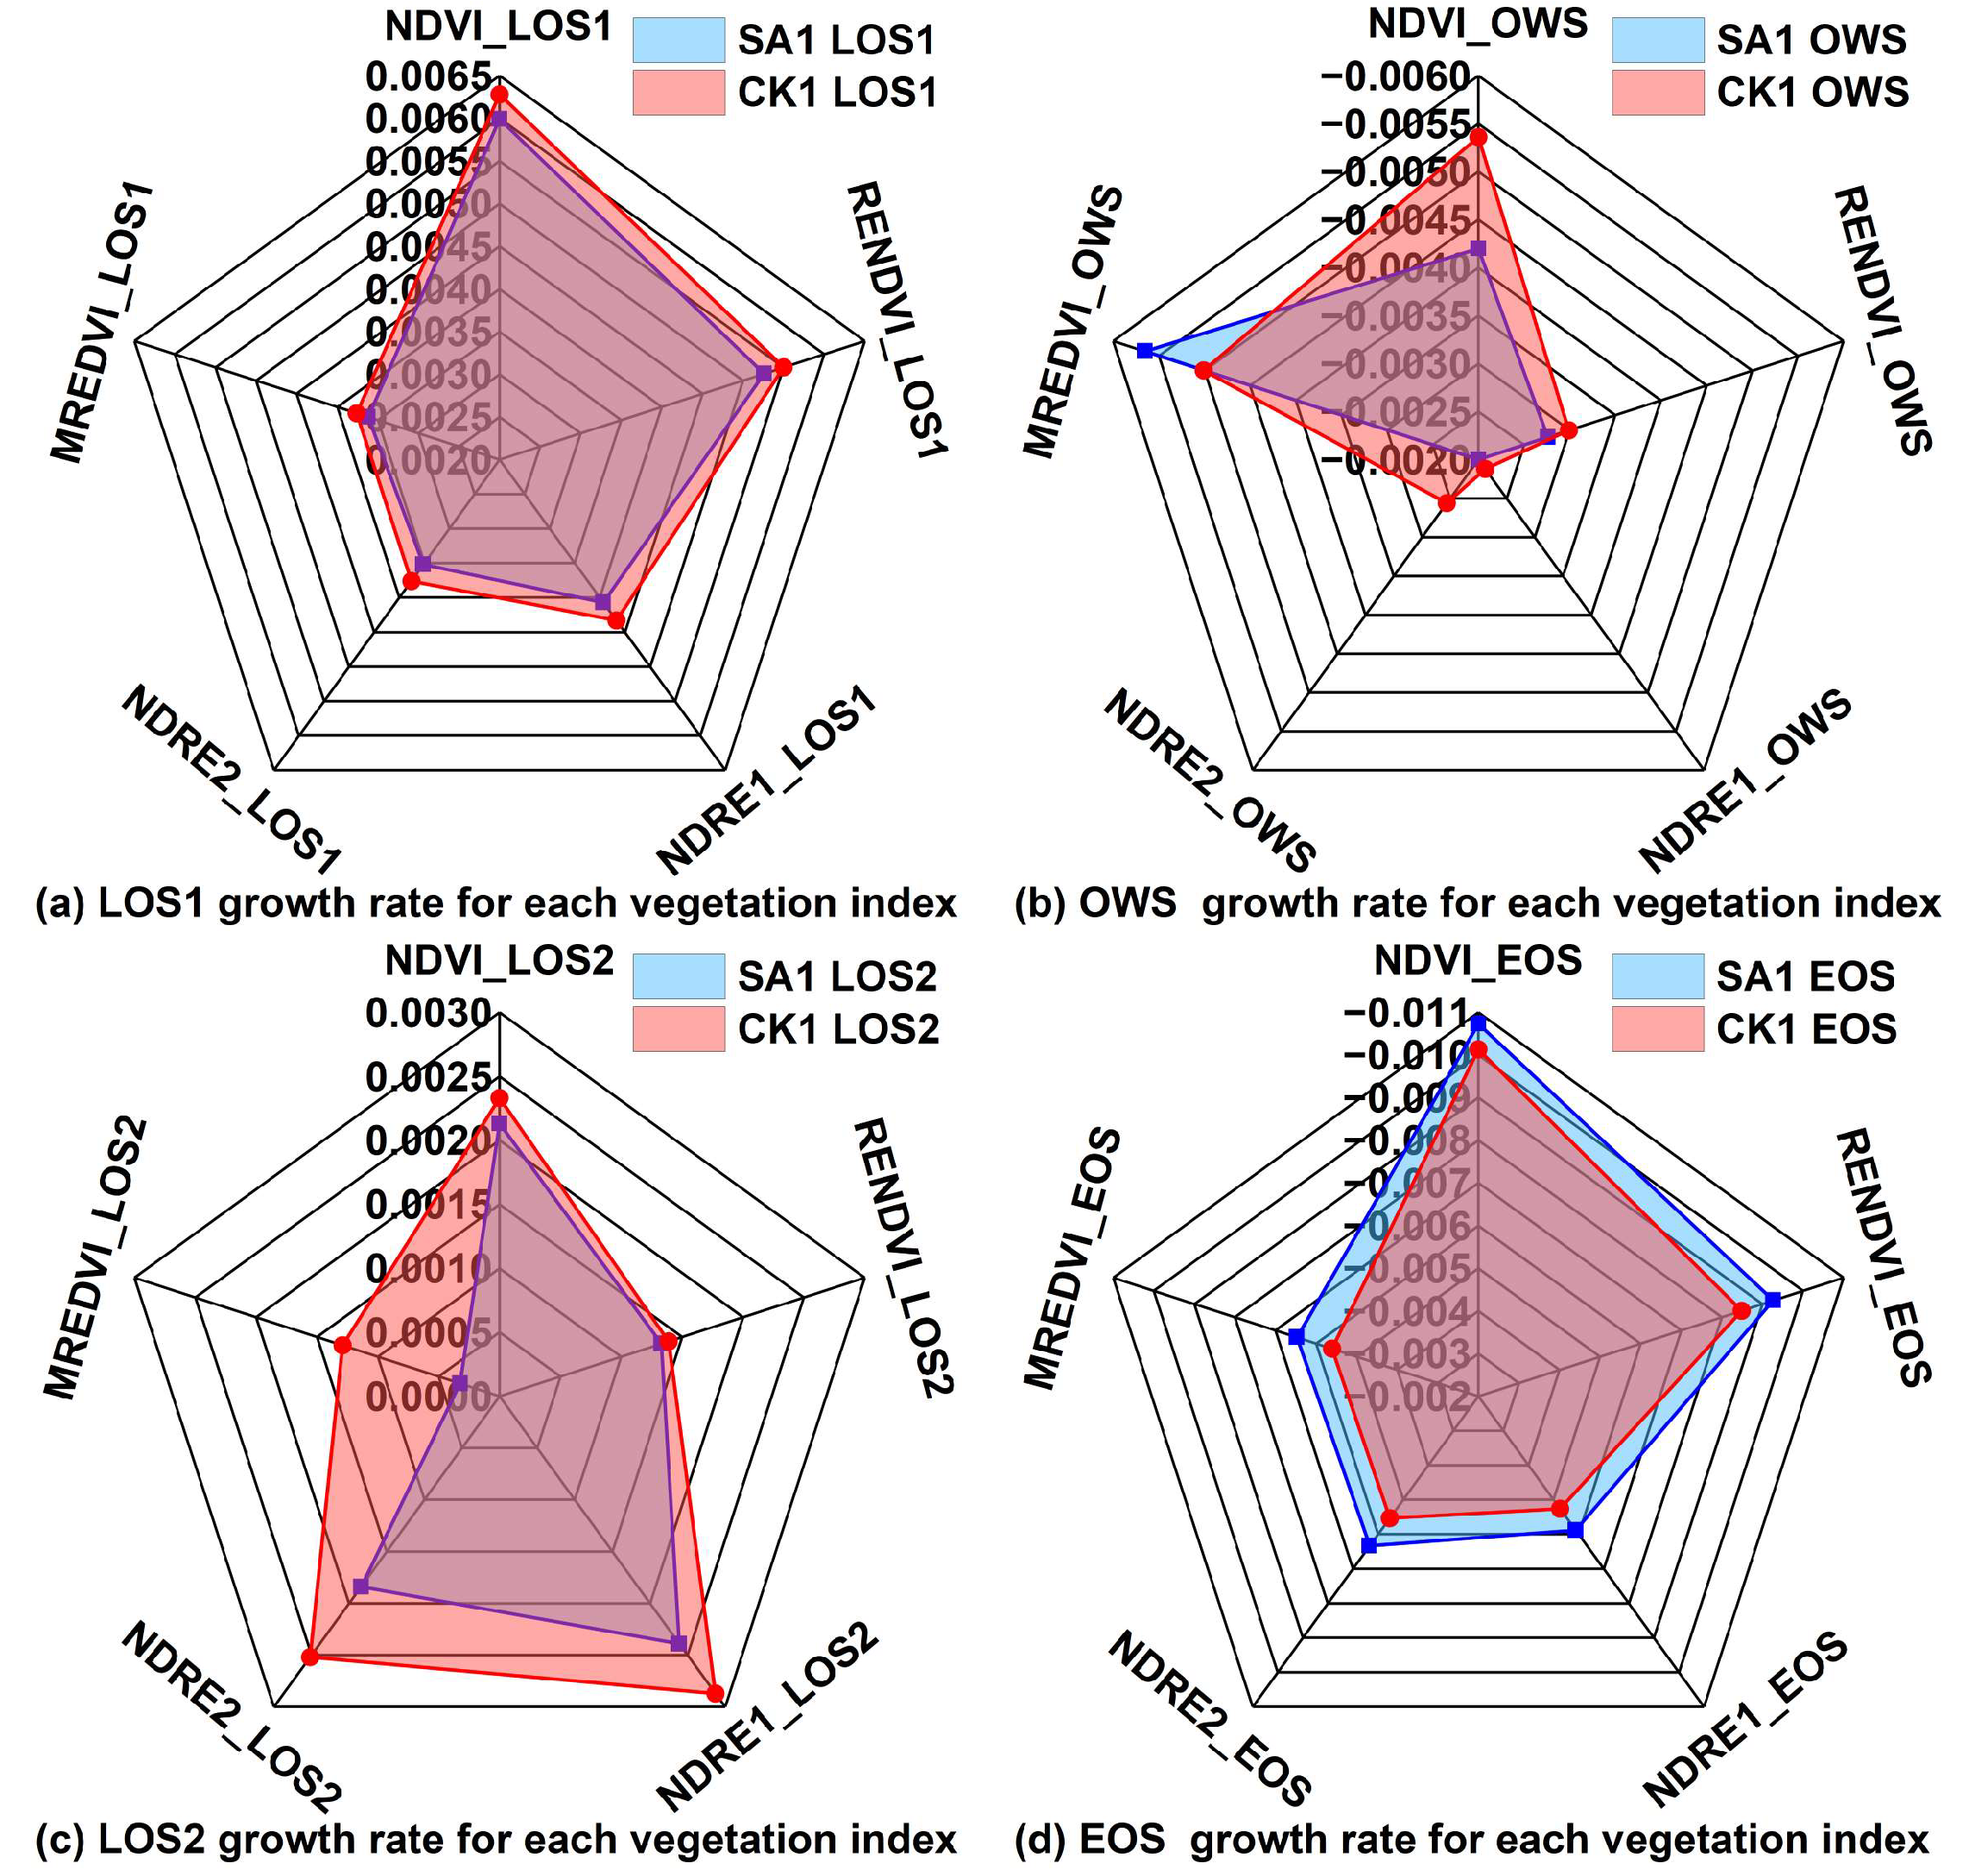
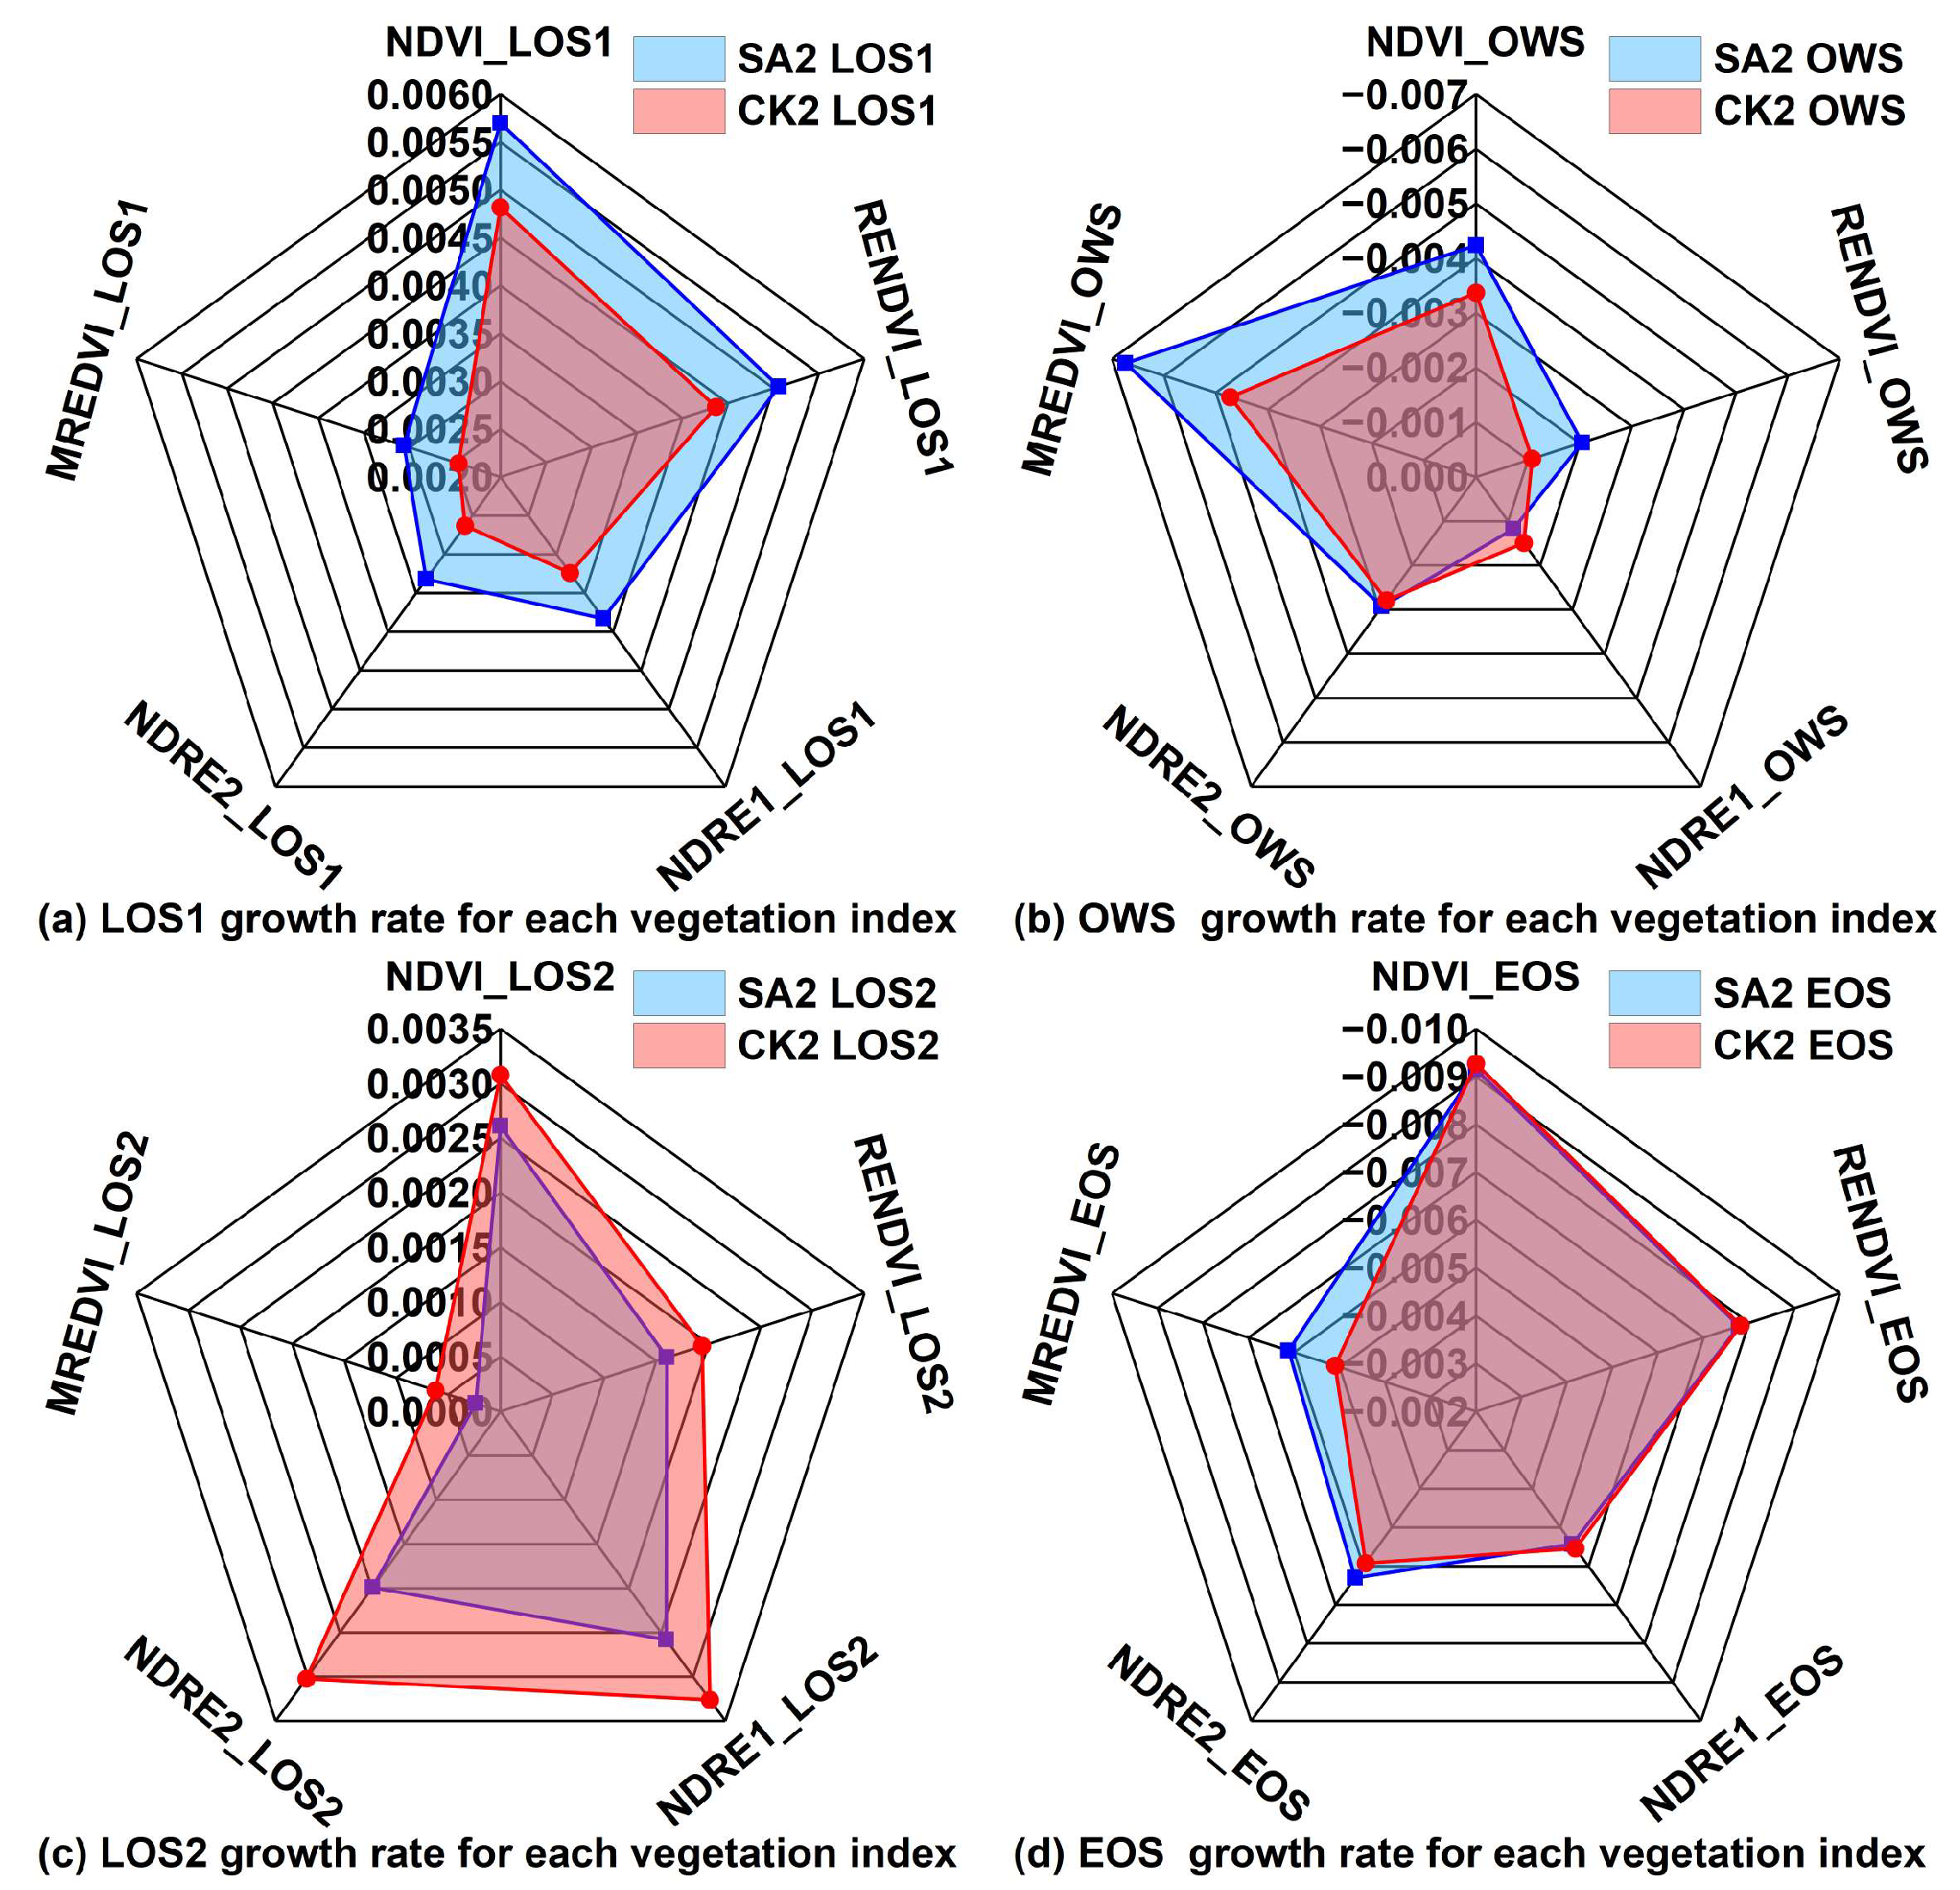
4.3.1. Difference in Growth Rates during Different Growth Stages
4.3.2. Change Amplitude in Growth Rates
- (1)
- Compared with the CK1, the change amplitude of each vegetation index corresponding to the growth rate in SA1 was mainly negative in the LOS1, OWS, and LOS2, except for the positive value in the EOS. Mining subsidence resulted in the delayed growth and development of winter wheat in the SA1 compared with the CK1, and the accelerated rate of decline and maturity compared with the CK1.
- (2)
- Compared with CK2, the change magnitude of each vegetation index corresponding to the growth rate in the SA2 was mainly positive in the LOS1 and OWS, and negative in the LOS2, and although it was also negative in the EOS, the decrease in this stage was much smaller than the increase. Combined with the time of SA2 subsidence (from 4 December 2020 to 8 July 2021), the effects of mining subsidence on the growth of winter wheat in the SA2 could be summarized as follows: the OWS was not obvious, the development was delayed after SOS, and the rate of maturation and senescence had been accelerated to some extent.
- (3)
- There were some differences in the change magnitude of winter wheat growth monitored using different vegetation indices, among which the vegetation indices with the larger differences were NDRE2 and MREDVI. From the calculation results in Section 4.2, it could be found that the Gaussian multi-peak R2 (goodness of fit) of MREDVI was poor compared to NDRE2, which indicated that NDRE2 could be used as an optimal indicator to monitor the differences in winter wheat growth.
4.4. Health Evaluation of Winter Wheat
4.4.1. Rationalization of the SACHI Model
- (1)
- In the SA1, PC1 contribution rate of the SACHI model ranged from 77.85% to 97.36%; In the SA2, PC1 contribution rate of the SACHI model ranged from 57.41% to 97.20%, which indicated that the constructed SACHI model gathered the vast majority of information from the four components in both areas. In addition, PC1 contribution rate of the SACHI model constructed in the CK1 and CK2 ranged from 68.91%~96.70% and 67.67%~97.66%, respectively, which also indicated that the SACHI model was able to synthesize most of the information from the four components in the CKs.
- (2)
- The PC1 payload exhibited the same symbols as NDRE2, CIre, and NDMI, and was opposite to the SI-T, which indicated that NDRE2, CIre, and NDMI were all indicators that had a positive impact on the health status of winter wheat, while SI-T had a negative impact on the health status of winter wheat. Similar to the RSEI model, the payload symbols of PC2, PC3, and PC4 did not have clear regularities [64] and did not have clear ecological implications.
- (3)
- PC1 payload of the SACHI model for some periods showed that negative values for payloads that acted positively with the health status of winter wheat and positive values for payloads that acted negatively with the health status, which could be used to obtain SACHI0 by 1–PC1 [64].
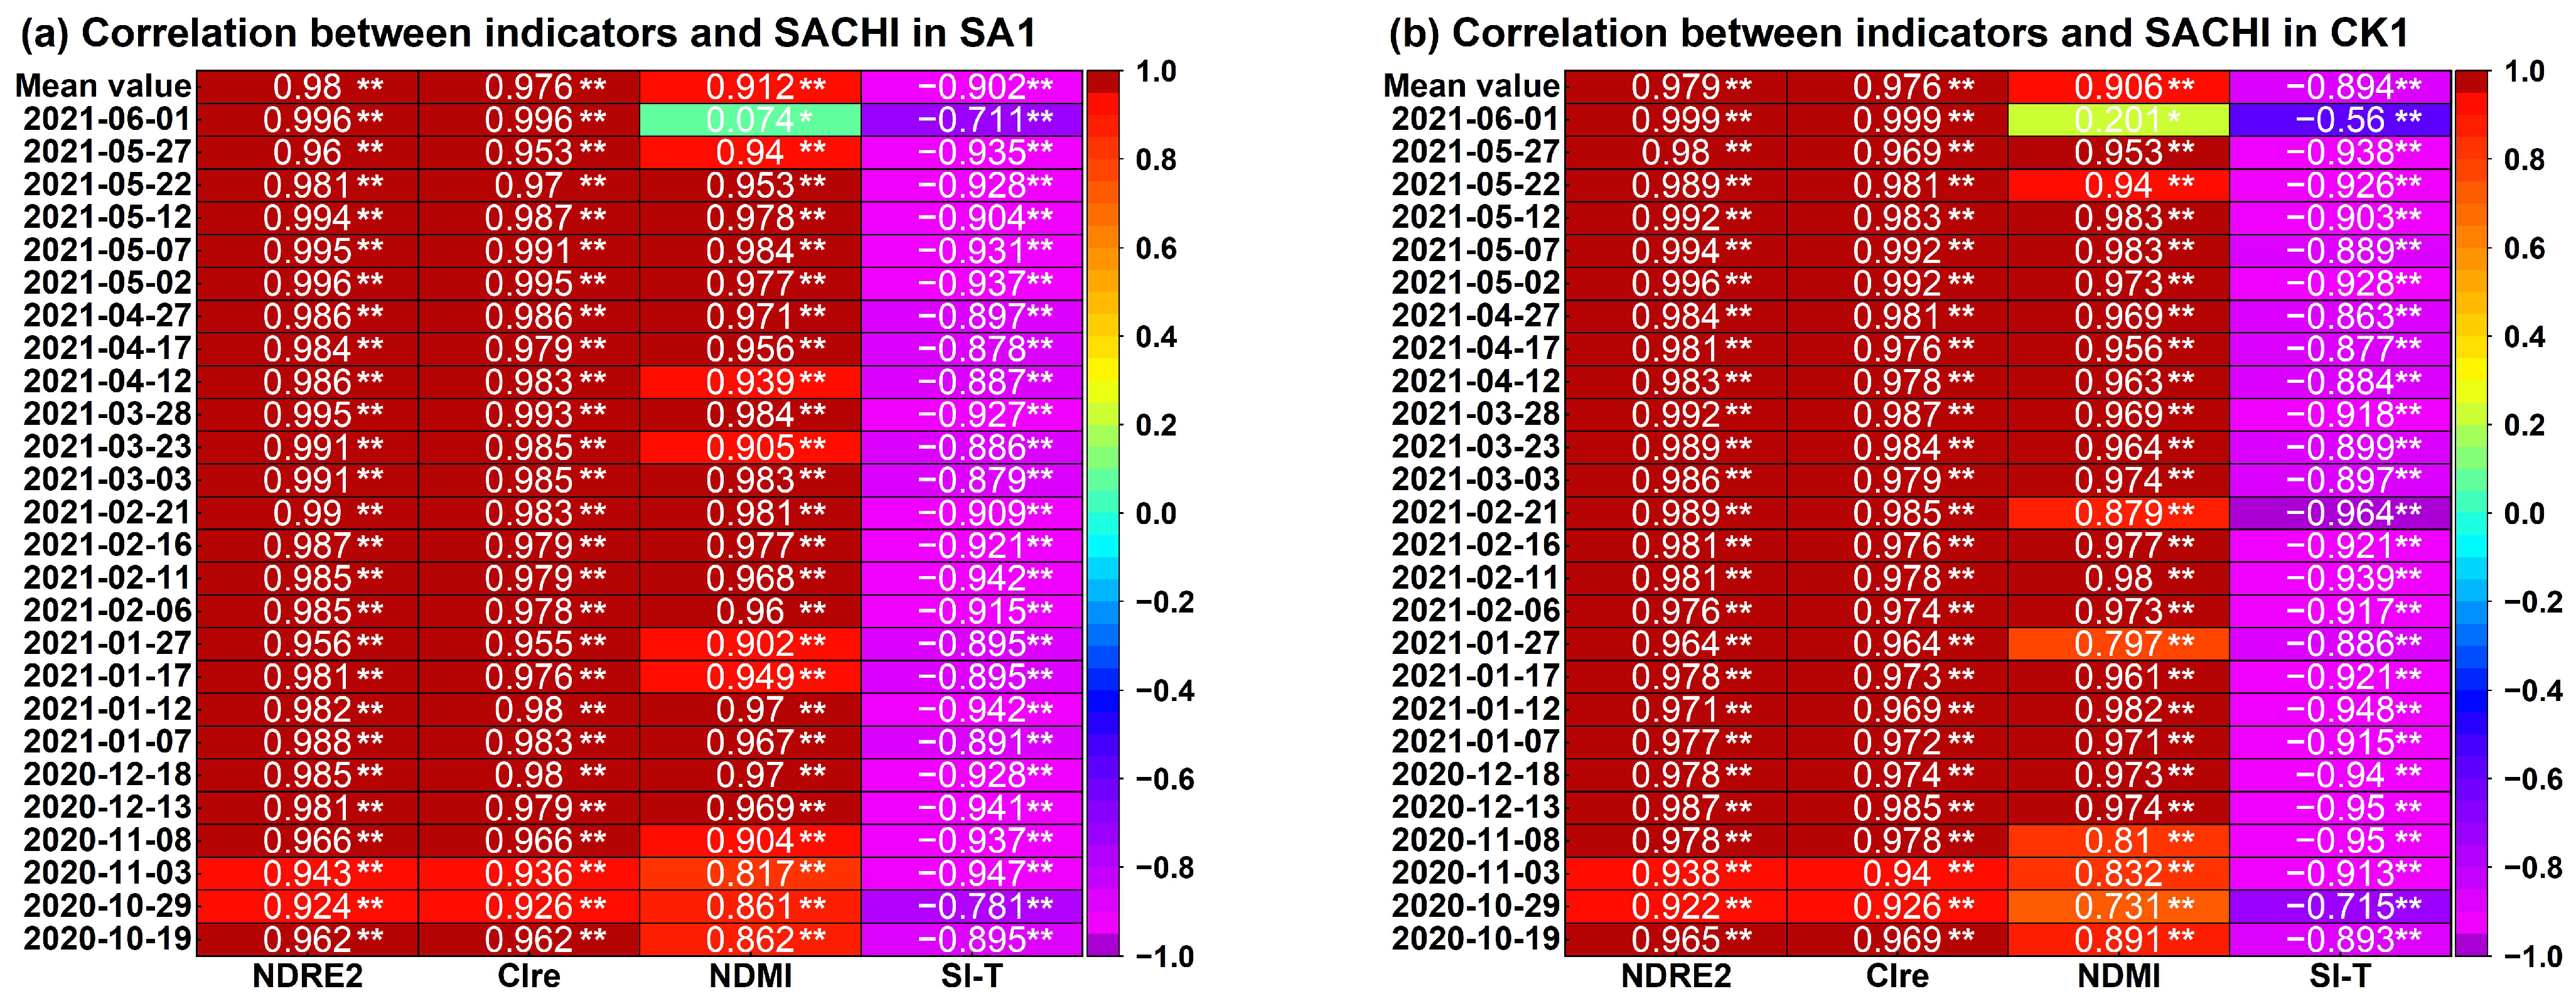
4.4.2. Correlation Analysis of Indicators with SACHI
- (1)
- NDRE2, CIre and NDMI were all positively correlated with SACHI, with mean correlation coefficients ranging from 0.979~0.981 (p < 0.01), 0.974~0.980 (p < 0.01), and 0.884~0.912 (p < 0.01), respectively. It indicated that the above three indicators were highly correlated with and positively affected the health status of winter wheat.
- (2)
- SI-T was negatively correlated with the SACHI, with mean correlation coefficients ranging from −0.925 to −0.894 (p < 0.01). It indicated that SI-T played a negative role in health status of winter wheat.
- (3)
- The correlation between NDMI and SACHI in both the SAs and CKs decreased significantly on 1 June 2021, when winter wheat was matured or harvested during that period and canopy moisture content was significantly reduced. This phenomenon also reflected the high sensitivity of NDMI to invert vegetation canopy moisture.
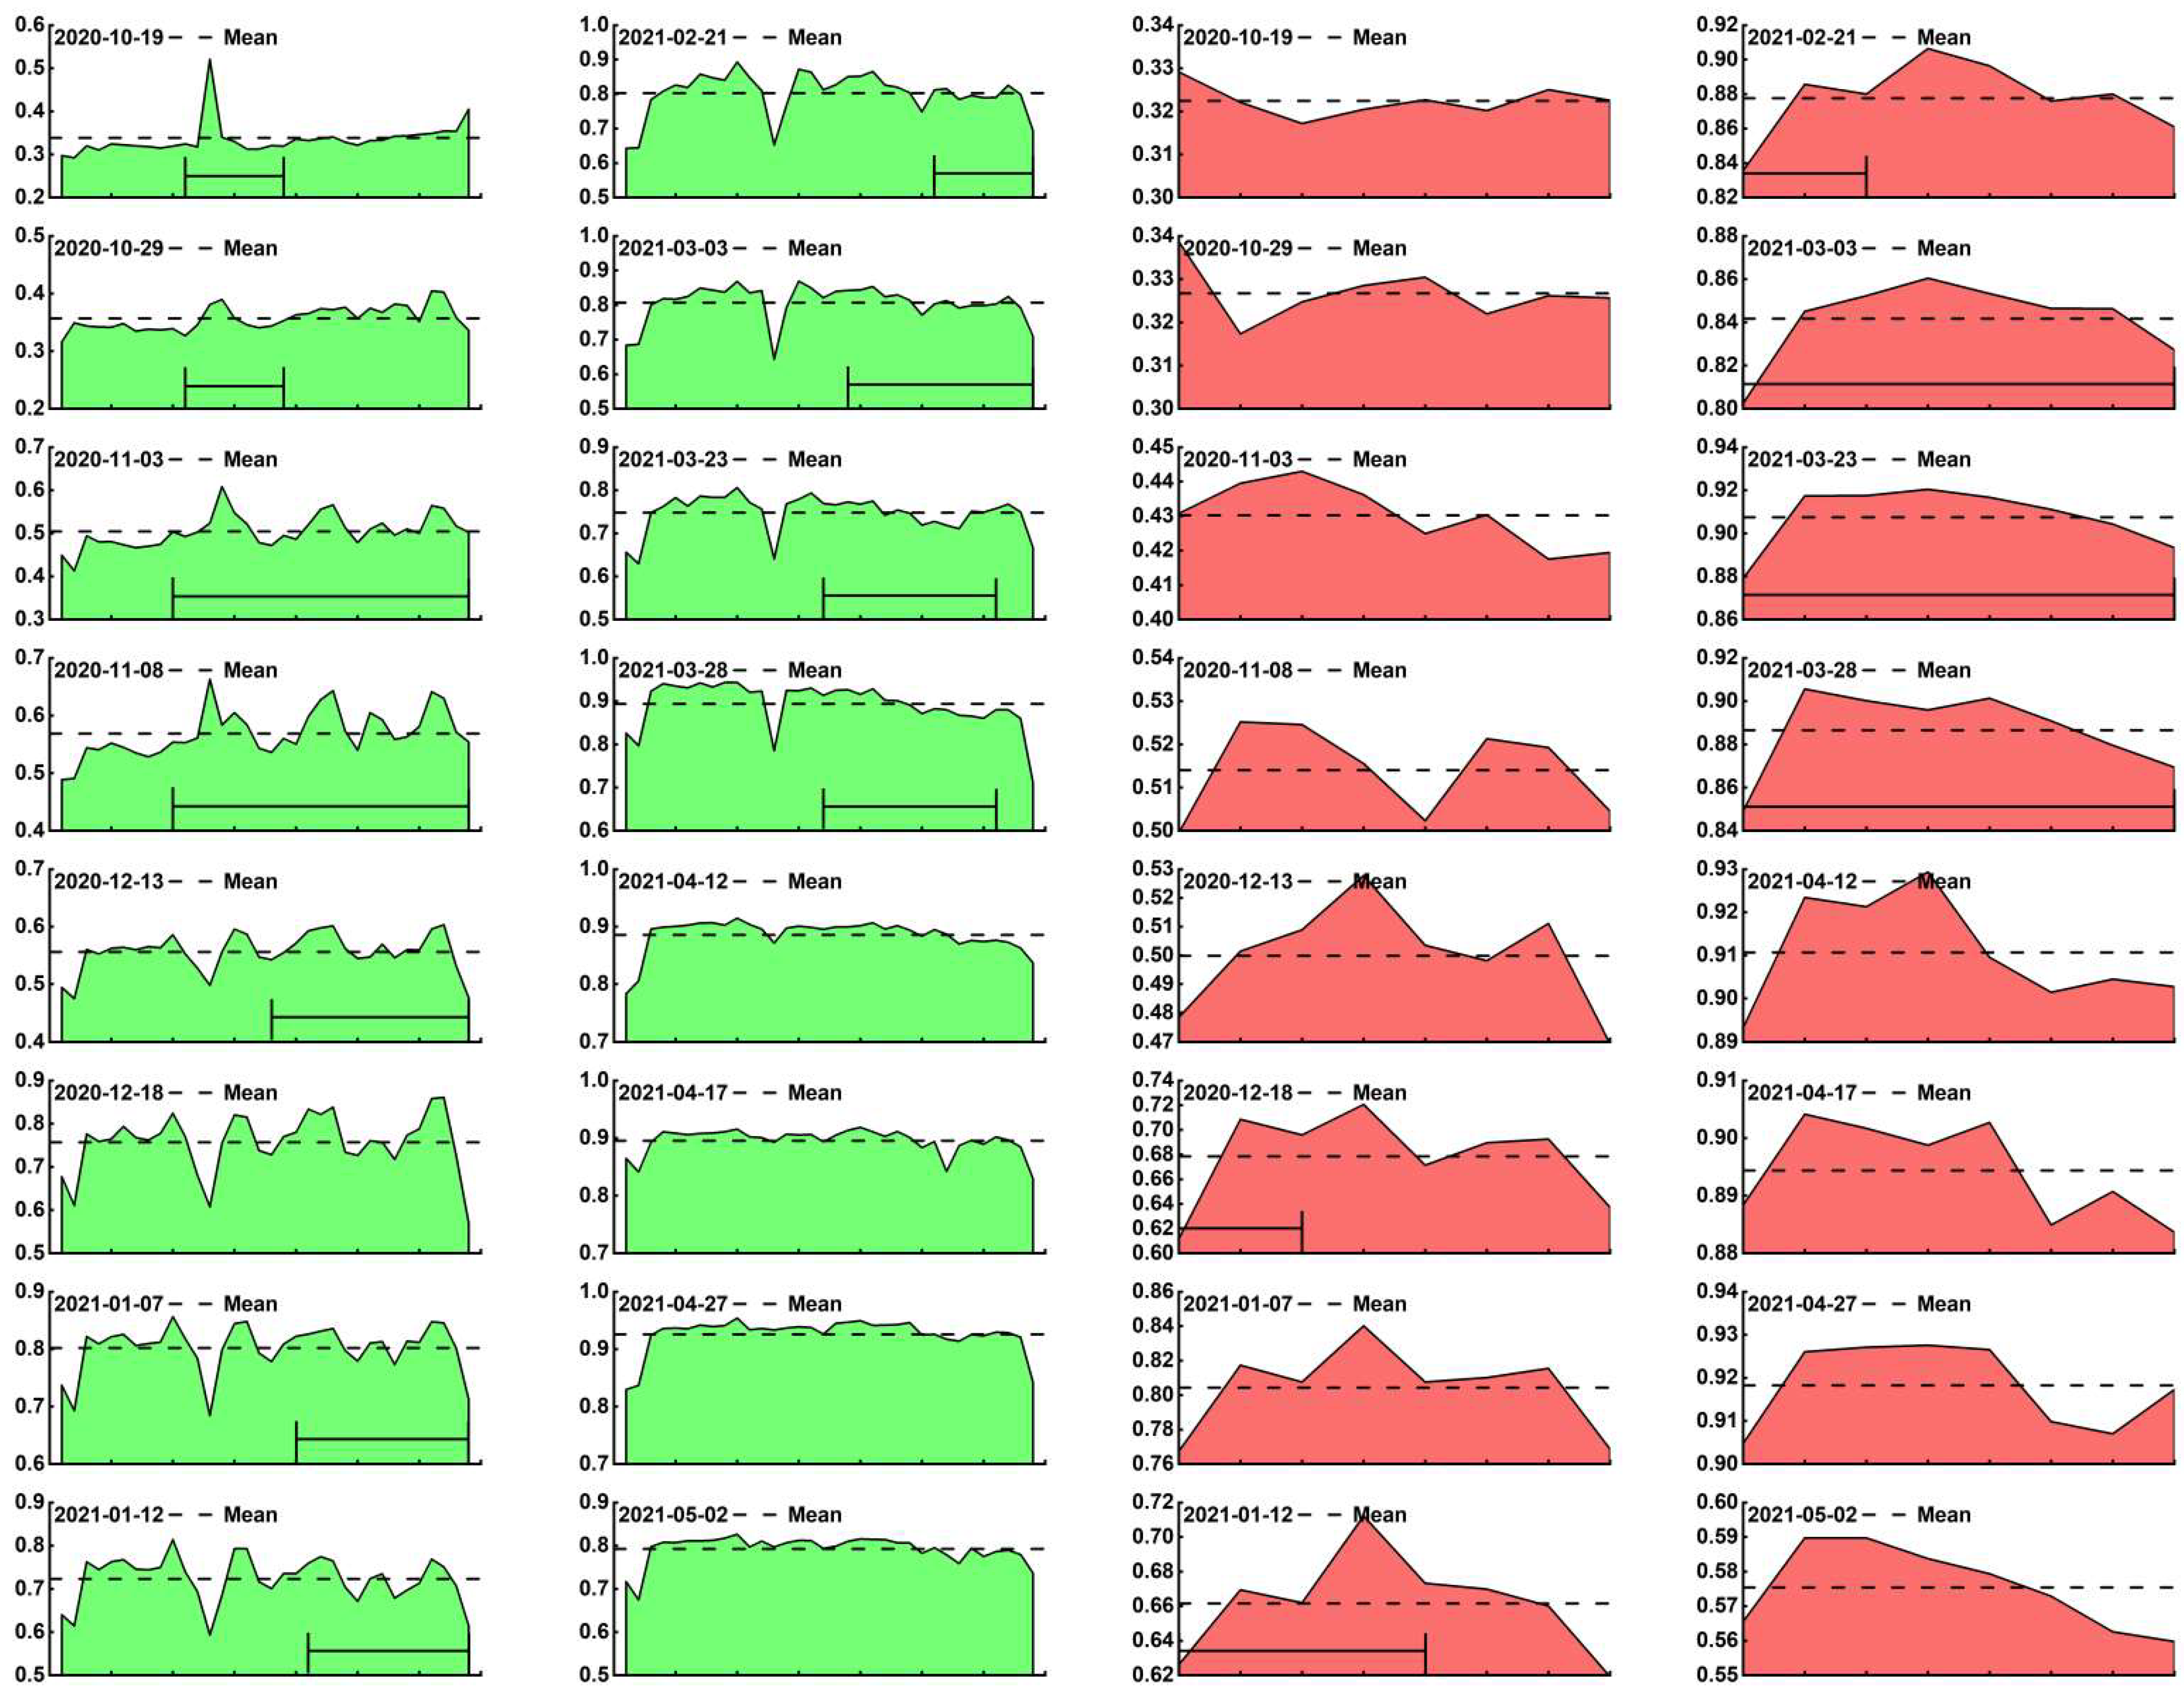
4.4.3. Profile Lines Analysis of SACHI
- (1)
- In the SA1, there were 16 periods of profile lines with some pixels in the impact area of mining subsidence. Except for four periods of 19 October 12020, 29 October 2020, 3 November 2020, and 8 November 2020 where the DN in the subsidence area were mainly greater than the SACHI mean, the remaining 12 periods were predominantly lower than the SACHI mean and showed a fluctuating downward trend.
- (2)
- There are 10 periods in the SA2 where some pixels were within the impact area of mining subsidence. It could be seen that there were fluctuations in the SACHI DN located in the subsidence area, but the change regularities were not significant due to the small number of sample points.
4.4.4. SACHI Spatial Distribution and Logistic Regression Analysis
- (1)
- The impacts of the mining process on the health status of winter wheat in the SA1 were relatively significant, which were mainly manifested in the following: At the LOS1, entering the OWS, the impact caused by mining subsidence changes from “highly significant” to “significant” and “insignificant”, and the influence gradually diminishes. At the LOS2, the impact of mining subsidence was again “highly significant” with the onset of the SOS, but progressively “insignificant” as the winter wheat grew and developed.
- (2)
- The impacts of the mining process on the health status of winter wheat in the SA2 were mainly at the LOS2 and were “significant”. As winter wheat grew and developed, this impacts gradually decreases. However, the impacts during the LOS1 and OWS were “not significant”.
4.4.5. Differences in the Health Status of Winter Wheat between SAs and CKs
- (1)
- Mean difference of SACHI
- (2)
- Difference analysis of SACHI between SAs and CKs
5. Discussion and Conclusions
5.1. Discussion
- (1)
- Four growth stages of winter wheat under different vegetation indices were determination by using Gaussian multi-peak fitting. The filtering method [44] was not used mainly because the Sentinel-2 data were affected by cloud cover, resulting in differences in the temporal interval of the vegetation indexes obtained, especially in the peak season of winter wheat growth, where was a large increase in the vegetation indexes within a short period of time [58]. In addition, the filtering method recognized the differences in this time interval as noise [44], which affected the accuracy of the division in the growth stage of the vegetation, and Gaussian multi-peak fitting could effectively avoid this problem.
- (2)
- In contrast to agronomic studies, the growth stages divided in this study were not absolute phenological periods, but relative phenological periods between the SAs and the CKs based on trends in the time-series vegetation index, with the aim of discussing the impact of mining subsidence on the growth stages of winter wheat. Based on the results of growth stages divided by different vegetation indices, it can be seen that the starting and ending times of each LOS varied due to the different sensitivities of different vegetation indices to the spectral characteristics of winter wheat at different the LOS [66]. Despite the poor regularity of the LOS differences exhibited by multiple vegetation indices, the differences in growth rate and its change magnitude of winter wheat at different the LOS based on different vegetation indices separately showed strong regularity. Five vegetation indices were introduced to explore the growth differences, and the impacts of mining subsidence on the growth of winter wheat were comprehensively evaluated through comparative analysis, which avoided the chance errors that may arise from a single vegetation index and make the evaluation results more credible.
- (3)
- A subsidence area crop health index (SACHI) was constructed to comprehensively reflect the health status of winter wheat in each LOS. This index was coupled with the vegetation index NDRE2 [50], which was the most sensitive for monitoring the growth differences of winter wheat, the chlorophyll index CIre [60], which was significantly responsive to chlorophyll content in nitrogen-nourished leaves, the water content index NDMI [61], which was sensitive to the water content of vegetation canopies, and the salinity index SI-T [63], which was able to characterize the phenomenon of soil salinization.
- (4)
- The SACHI construction method was consistent with the RSEI (Remote sensing ecological index), and both used principal component analysis [65], so it had the advantage of objectively determining the weights [64], and could effectively avoid the interference from subjective factors. This was superior to the GI (Growth index) [67] for crop growth, which was constructed using NDVI and EVI weighting by previous researchers. In addition, the four indices used to construct the SACHI were all obtained through remote sensing, which had the characteristics of easy data acquisition, low cost, and high efficiency [68].
- (5)
- When we chose to construct the SACHI index, it was necessary to consider whether the information reflected in the SACHI index could reflect the health status of winter wheat and whether it was consistent with the characteristics of the damage to vegetation caused by mining subsidence. The SACHI composite index was an attempt in the application of remote sensing in agriculture, and in the subsequent research, we will try to combine the soil survey in the field and change the index according to the needs, in order to provide new ideas for crop growth monitoring, weather information extraction, and yield estimation. It should be noted that the selection of remote sensing data needs to ensure that the amount of clouds is low and the data quality is intact, otherwise it will lead to low inversion accuracy of a certain index for constructing SACHI, which in turn affects the accuracy of the SACHI results. At the same time, it is necessary to ensure the continuity of the time series as much as possible. The irregular interval of time series will, to a certain extent, affect the accuracy of the crop health status and phenology division. The discontinuity of the time series is not conducive to the obtaining the changes in the SACHI throughout the entire life cycle of the crops.
- (6)
- It should be noted that although the Sentinel-2 data selected in this study were characterized by short revisit cycles, and the effect of cloud shading resulted in irregular time series intervals, which is not conducive to understanding the hidden patterns in the time dimension of remote sensing data and to some extent affects the accuracy of the crop health status and phenology division. In the subsequent research, attempts can be made to introduce deep learning algorithms to predict the missing data in the time series by utilizing the existing time series data; attempts can also be made to introduce SAR data to assess the growth and health of winter wheat in order to overcome the influence of meteorological factors on the time series. In addition, although the selected CKs were closer to SAs, which could exclude the phenological differences caused by meteorological factors, it was undeniable that the differences in the amount of fertilizer applied to different croplands and winter wheat varieties would interfere with the experimental results. The uncertainties of mining subsidence in time and impact area were a difficult problem to solve. The solution to this problem requires deep cooperation with mining units to obtain information on mining routes and mining times. The subsidence areas (SAs) and check areas (CAs) are selected on the surface of the mining workings, and variables such as the amount of fertilizer applied and the variety of winter wheat in the SAs and CAs are strictly controlled using the control variable method. In addition, a good data collection program needs to be designed so that the effects of mining subsidence on crop growth and health can be more accurately obtained.
5.2. Conclusions
- (1)
- LOS differences: the results of winter wheat LOS divided by NDVI indicated that the SAs lagged behind the onset of the OWS, SOS, and EOS compared to CKs.
- (2)
- Growth differences in winter wheat: Mining subsidence could lead to a decrease in winter wheat growth rate and an increase in decline rate. The mining subsidence made the growth and development of winter wheat in the SA1 area slower than that of the CK1, and the rates of decline and maturity were faster than those of the CK1. The impacts of mining subsidence on winter wheat growth in SA2 were not obvious in the OWS, demonstrating slow growth after the SOS and some acceleration of decline.
- (3)
- Construction rationalization of the SACHI model: The mean contribution rates of the PCA in the four study areas of the model were all between 90.99% and 92.01%, indicating that SACHI can integrate most of the information of the four components; NDRE2, CIre, and NDMI all positively affected the health status of winter wheat, and were highly positively correlated with SACHI, with the means of correlation coefficients ranging from 0.979 to 0.981 (p < 0.01), from 0.974 to 0.980 (p < 0.01), and from 0.884 to 0.912 (p < 0.01), respectively. The correlation coefficients of the SI-T and SACHI were highly negatively correlated, with means of correlation coefficients ranging from −0.925 to −0.894 (p < 0.01).
- (4)
- Impacts of the underground mining faces advancement process on the health status of winter wheat: binary logistic regression analysis revealed that mining subsidence had a significant effect on the health status of winter wheat at the LOS (p < 0.001) and a weaker effect on the health status of winter wheat at the OWS (p > 0.05).
- (5)
- Differences in health status of winter wheat between the SAs and CKs: SA1 winter wheat had poorer health throughout its life cycle relative to CK1 (about 84.6% of the full stage). According to the subsidence time of the SA2, it was found that the impact of mining subsidence on the health status of winter wheat in the SA2 was mainly manifested in the LOS 2 and EOS. In these two stages, the proportion of poor winter wheat health in the SA2 compared to the CK2 was about 53.3%.
Author Contributions
Funding
Data Availability Statement
Acknowledgments
Conflicts of Interest
Appendix A

| Data Source | Imaging Date | Data Type | Sensor | Data Source | Imaging Date | Data Type | Sensor |
|---|---|---|---|---|---|---|---|
| Sentinel-1A | 8 January 2019 | SLC | SAR | Sentinel-1A | 19 June 2020 | SLC | SAR |
| Sentinel-1A | 20 January 2019 | SLC | SAR | Sentinel-1A | 1 July 2020 | SLC | SAR |
| Sentinel-1A | 1 February 2019 | SLC | SAR | Sentinel-1A | 25 July 2020 | SLC | SAR |
| Sentinel-1A | 13 February 2019 | SLC | SAR | Sentinel-1A | 6 August 2020 | SLC | SAR |
| Sentinel-1A | 25 February 2019 | SLC | SAR | Sentinel-1A | 18 August 2020 | SLC | SAR |
| Sentinel-1A | 9 March 2019 | SLC | SAR | Sentinel-1A | 30 August 2020 | SLC | SAR |
| Sentinel-1A | 21 March 2019 | SLC | SAR | Sentinel-1A | 11 September 2020 | SLC | SAR |
| Sentinel-1A | 2 April 2019 | SLC | SAR | Sentinel-1A | 23 September 2020 | SLC | SAR |
| Sentinel-1A | 14 April 2019 | SLC | SAR | Sentinel-1A | 5 October 2020 | SLC | SAR |
| Sentinel-1A | 26 April 2019 | SLC | SAR | Sentinel-1A | 17 October 2020 | SLC | SAR |
| Sentinel-1A | 8 May 2019 | SLC | SAR | Sentinel-1A | 29 October 2020 | SLC | SAR |
| Sentinel-1A | 20 May 2019 | SLC | SAR | Sentinel-1A | 10 November 2020 | SLC | SAR |
| Sentinel-1A | 1 June 2019 | SLC | SAR | Sentinel-1A | 22 November 2020 | SLC | SAR |
| Sentinel-1A | 13 June 2019 | SLC | SAR | Sentinel-1A | 4 December 2020 | SLC | SAR |
| Sentinel-1A | 25 June 2019 | SLC | SAR | Sentinel-1A | 16 December 2020 | SLC | SAR |
| Sentinel-1A | 7 July 2019 | SLC | SAR | Sentinel-1A | 28 December 2020 | SLC | SAR |
| Sentinel-1A | 19 July 2019 | SLC | SAR | Sentinel-1A | 9 January 2021 | SLC | SAR |
| Sentinel-1A | 31 July 2019 | SLC | SAR | Sentinel-1A | 21 January 2021 | SLC | SAR |
| Sentinel-1A | 12 August 2019 | SLC | SAR | Sentinel-1A | 2 February 2021 | SLC | SAR |
| Sentinel-1A | 24 August 2019 | SLC | SAR | Sentinel-1A | 14 February 2021 | SLC | SAR |
| Sentinel-1A | 5 September 2019 | SLC | SAR | Sentinel-1A | 26 February 2021 | SLC | SAR |
| Sentinel-1A | 17 September 2019 | SLC | SAR | Sentinel-1A | 10 March 2021 | SLC | SAR |
| Sentinel-1A | 29 September 2019 | SLC | SAR | Sentinel-1A | 22 March 2021 | SLC | SAR |
| Sentinel-1A | 11 October 2019 | SLC | SAR | Sentinel-1A | 3 April 2021 | SLC | SAR |
| Sentinel-1A | 23 October 2019 | SLC | SAR | Sentinel-1A | 15 April 2021 | SLC | SAR |
| Sentinel-1A | 4 November 2019 | SLC | SAR | Sentinel-1A | 27 April 2021 | SLC | SAR |
| Sentinel-1A | 16 November 2019 | SLC | SAR | Sentinel-1A | 21 May 2021 | SLC | SAR |
| Sentinel-1A | 28 November 2019 | SLC | SAR | Sentinel-1A | 14 June 2021 | SLC | SAR |
| Sentinel-1A | 10 December 2019 | SLC | SAR | Sentinel-1A | 8 July 2021 | SLC | SAR |
| Sentinel-1A | 22 December 2019 | SLC | SAR | Sentinel-1A | 1 August 2021 | SLC | SAR |
| Sentinel-1A | 3 January 2020 | SLC | SAR | Sentinel-1A | 13 August 2021 | SLC | SAR |
| Sentinel-1A | 15 January 2020 | SLC | SAR | Sentinel-1A | 25 August 2021 | SLC | SAR |
| Sentinel-1A | 27 January 2020 | SLC | SAR | Sentinel-1A | 6 September 2021 | SLC | SAR |
| Sentinel-1A | 8 February 2020 | SLC | SAR | Sentinel-1A | 18 September 2021 | SLC | SAR |
| Sentinel-1A | 3 March 2020 | SLC | SAR | Sentinel-1A | 30 September 2021 | SLC | SAR |
| Sentinel-1A | 15 March 2020 | SLC | SAR | Sentinel-1A | 12 October 2021 | SLC | SAR |
| Sentinel-1A | 27 March 2020 | SLC | SAR | Sentinel-1A | 24 October 2021 | SLC | SAR |
| Sentinel-1A | 8 April 2020 | SLC | SAR | Sentinel-1A | 5 November 2021 | SLC | SAR |
| Sentinel-1A | 20 April 2020 | SLC | SAR | Sentinel-1A | 17 November 2021 | SLC | SAR |
| Sentinel-1A | 2 May 2020 | SLC | SAR | Sentinel-1A | 29 November 2021 | SLC | SAR |
| Sentinel-1A | 14 May 2020 | SLC | SAR | Sentinel-1A | 11 December 2021 | SLC | SAR |
| Sentinel-1A | 7 June 2020 | SLC | SAR | Sentinel-1A | 23 December 2021 | SLC | SAR |
References
- Guo, W.B.; Zhao, G.; Bai, E.; Ma, C.; Nie, X.; Chen, J.; Zhang, H. Research Status and Prospect on Cultivated Land Damage at Surface Subsidence Basin Due to Longwall Mining in the Central Coal Grain Compound Area. J. China Coal Soc. 2023, 48, 388–401. [Google Scholar] [CrossRef]
- Li, Y.; Chiu, Y.-h.; Lin, T.Y. Coal Production Efficiency and Land Destruction in China’s Coal Mining Industry. Resour. Policy 2019, 63, 101449. [Google Scholar] [CrossRef]
- Chen, Y.; Hu, Z.; Li, P.; Li, G.; Yuan, D.; Guo, J. Assessment and Effect of Mining Subsidence on Farmland in Coal–Crop Overlapped Areas: A Case of Shandong Province, China. Agriculture 2022, 12, 1235. [Google Scholar] [CrossRef]
- Hu, Z.; Liu, S.; Gong, Y. Evaluation of Soil Quality and Maize Growth in Different Profiles of Reclaimed Land with Coal Gangue Filling. Land 2021, 10, 1307. [Google Scholar] [CrossRef]
- Feng, Z.; Hu, Z.; Li, G.; Zhang, Y.; Zhang, X.; Zhang, H. Improving Mine Reclamation Efficiency for Farmland Sustainable Use: Insights from Optimizing Mining Scheme. J. Clean. Prod. 2022, 379, 134615. [Google Scholar] [CrossRef]
- Zhang, P.; Liu, G.; Yu, Y. Ecological Stoichiometry of Soil Carbon, Nitrogen and Phosphorus in Reclaimed Farmland in Coal Mining Subsidence Area. J. Soil Sci. Plant Nutr. 2023, 23, 2498–2511. [Google Scholar] [CrossRef]
- Ren, H.; Xiao, W.; Zhao, Y.; Hu, Z. Land Damage Assessment Using Maize Aboveground Biomass Estimated from Unmanned Aerial Vehicle in High Groundwater Level Regions Affected by Underground Coal Mining. Environ. Sci. Pollut. Res. 2020, 27, 21666–21679. [Google Scholar] [CrossRef]
- Xiao, D.; Niu, H.; Guo, J.; Zhao, S.; Fan, L. Carbon Storage Change Analysis and Emission Reduction Suggestions under Land Use Transition: A Case Study of Henan Province, China. Int. J. Environ. Res. Public Health 2021, 18, 1844. [Google Scholar] [CrossRef]
- Chen, L.; Wang, E.; Ou, J.; Fu, J. Coal and Gas Outburst Hazards and Factors of the No. B-1 Coalbed, Henan, China. Geosci. J. 2018, 22, 171–182. [Google Scholar] [CrossRef]
- Guo, G.; Li, H.; Zha, J.; Liu, W.; Hu, Q.; Wang, F.; Chen, C.; Zhang, P.; Zhang, H.; Zhang, Q. Research Status and Countermeasures of Coordinated Development of Coal Mining and Cultivated Land Protection in the Plain Coal-Cropland Overlapped Areas. Coal Sci. Technol. 2023, 51, 416–426. [Google Scholar] [CrossRef]
- Yang, Q.; Tang, F.; Wang, F.; Tang, J.; Fan, Z.; Ma, T.; Su, Y.; Xue, J. A New Technical Pathway for Extracting High Accuracy Surface Deformation Information in Coal Mining Areas Using UAV LiDAR Data: An Example from the Yushen Mining Area in Western China. Measurement 2023, 218, 113220. [Google Scholar] [CrossRef]
- Wang, L.; Teng, C.; Jiang, K.; Jiang, C.; Zhu, S. D-InSAR Monitoring Method of Mining Subsidence Based on Boltzmann and Its Application in Building Mining Damage Assessment. KSCE J. Civ. Eng. 2022, 26, 353–370. [Google Scholar] [CrossRef]
- Wang, Y. Research Progress and Prospect on Ecological Disturbance Monitoring in Mining Area. Acta Geod. Cartogr. Sin. 2017, 46, 1705–1716. [Google Scholar] [CrossRef]
- Gabriel, A.K.; Goldstein, R.M.; Zebker, H.A. Mapping Small Elevation Changes over Large Areas: Differential Radar Interferometry. J. Geophys. Res. Solid Earth 1989, 94, 9183–9191. [Google Scholar] [CrossRef]
- Ferretti, A.; Prati, C.; Rocca, F. Nonlinear Subsidence Rate Estimation Using Permanent Scatterers in Differential SAR Interferometry. IEEE Trans. Geosci. Remote Sens. 2000, 38, 2202–2212. [Google Scholar] [CrossRef]
- Berardino, P.; Fornaro, G.; Lanari, R.; Sansosti, E. A New Algorithm for Surface Deformation Monitoring Based on Small Baseline Differential SAR Interferograms. IEEE Trans. Geosci. Remote Sens. 2002, 40, 2375–2383. [Google Scholar] [CrossRef]
- Fu, W.; Guo, H.; Tian, Q.; Guo, X. Landslide Monitoring by Corner Reflectors Differential Interferometry SAR. Int. J. Remote Sens. 2010, 31, 6387–6400. [Google Scholar] [CrossRef]
- Wang, G.; Wu, Q.; Li, P.; Cui, X.; Gong, Y.; Zhang, J.; Tang, W. Mining Subsidence Prediction Parameter Inversion by Combining GNSS and DInSAR Deformation Measurements. IEEE Access 2021, 9, 89043–89054. [Google Scholar] [CrossRef]
- Hu, Z.; Long, J.; Wang, X. Self-Healing, Natural Restoration and Artificial Restoration of Ecological Environment for Coal Mining. J. China Coal Soc. 2014, 39, 1751–1757. [Google Scholar] [CrossRef]
- Bian, Z.; Lei, S.; Jin, D.; Wang, L. Several Basic Scientific Issues Related to Mined Land Remediation. J. China Coal Soc. 2018, 43, 190–197. [Google Scholar] [CrossRef]
- Gao, Y.; Dang, X.; Wang, J.; Gao, Q.; Zhai, B.; Liu, B. Damage Characteristics of Populus Simonii Root Systems at Different Cracks in Mining Subsidence Area. Bull. Soil Water Conserv. 2022, 42, 34–41. [Google Scholar] [CrossRef]
- Yang, X.; Lei, S.; Shi, Y.; Wang, W. Effects of Ground Subsidence on Vegetation Chlorophyll Content in Semi-Arid Mining Area: From Leaf Scale to Canopy Scale. Int. J. Environ. Res. Public Health 2023, 20, 493. [Google Scholar] [CrossRef] [PubMed]
- Diop, M.; Chirinda, N.; Beniaich, A.; El Gharous, M.; El Mejahed, K. Soil and Water Conservation in Africa: State of Play and Potential Role in Tackling Soil Degradation and Building Soil Health in Agricultural Lands. Sustainability 2022, 14, 13425. [Google Scholar] [CrossRef]
- Lykhochvor, V.; Gnativ, P.; Andrushko, O.; Ivanyuk, V.; Olifir, Y. The Role of Nutrients in the Formation of Yield and Grain Quality of Winter Wheat. Bulg. J. Agric. Sci. 2022, 28, 103–109. [Google Scholar]
- Lin, M.; Hou, L.; Qi, Z.; Wan, L. Impacts of Climate Change and Human Activities on Vegetation NDVI in China’s Mu Us Sandy Land during 2000–2019. Ecol. Indic. 2022, 142, 109164. [Google Scholar] [CrossRef]
- Zhong, X.; Li, J.; Wang, J.; Zhang, J.; Liu, L.; Ma, J. Linear and Nonlinear Characteristics of Long-Term NDVI Using Trend Analysis: A Case Study of Lancang-Mekong River Basin. Remote Sens. 2022, 14, 6271. [Google Scholar] [CrossRef]
- Pabon-Moreno, D.E.; Migliavacca, M.; Reichstein, M.; Mahecha, M.D. On the Potential of Sentinel-2 for Estimating Gross Primary Production. IEEE Trans. Geosci. Remote Sens. 2022, 60, 4409412. [Google Scholar] [CrossRef]
- Ali, A.; Imran, M.; Ali, A.; Khan, M.A. Evaluating Sentinel-2 Red Edge through Hyperspectral Profiles for Monitoring LAI & Chlorophyll Content of Kinnow Mandarin Orchards. Remote Sens. Appl. Soc. Environ. 2022, 26, 100719. [Google Scholar] [CrossRef]
- Jiang, F.; Sun, H.; Li, C.; Ma, K.; Chen, S.; Long, J.; Ren, L. Retrieving the Forest Aboveground Biomass by Combining the Red Edge Bands of Sentinel-2 and GF-6. Acta Ecol. Sin. 2021, 41, 8222–8236. [Google Scholar] [CrossRef]
- Liew, O.; Chong, P.; Li, B.; Asundi, A. Signature Optical Cues: Emerging Technologies for Monitoring Plant Health. Sensors 2008, 8, 3205–3239. [Google Scholar] [CrossRef]
- Fang, C.; Wang, L.; Xu, H. A Comparative Study of Different Red Edge Indices for Remote Sensing Detection of Urban Grassland Health Status. J. Geo-information Sci. 2017, 19, 1382–1392. [Google Scholar] [CrossRef]
- Vincini, M.; Amaducci, S.; Frazzi, E. Empirical Estimation of Leaf Chlorophyll Density in Winter Wheat Canopies Using Sentinel-2 Spectral Resolution. IEEE Trans. Geosci. Remote Sens. 2014, 52, 3220–3235. [Google Scholar] [CrossRef]
- Clevers, J.G.P.W.; Kooistra, L.; van den Brande, M.M.M. Using Sentinel-2 Data for Retrieving LAI and Leaf and Canopy Chlorophyll Content of a Potato Crop. Remote Sens. 2017, 9, 405. [Google Scholar] [CrossRef]
- Xie, Q.; Dash, J.; Huete, A.; Jiang, A.; Yin, G.; Ding, Y.; Peng, D.; Hall, C.C.; Brown, L.; Shi, Y.; et al. Retrieval of Crop Biophysical Parameters from Sentinel-2 Remote Sensing Imagery. Int. J. Appl. Earth Obs. Geoinf. 2019, 80, 187–195. [Google Scholar] [CrossRef]
- Hu, X.; Niu, B.; Li, X.; Min, X. Unmanned Aerial Vehicle (UAV) Remote Sensing Estimation of Wheat Chlorophyll in Subsidence Area of Coal Mine with High Phreatic Level. Earth Sci. Inform. 2021, 14, 2171–2181. [Google Scholar] [CrossRef]
- Guo, Y.; Zhao, Y.; Yan, H. Disturbed Boundaries Extraction in Coal–Grain Overlap Areas with High Groundwater Levels Using UAV-Based Visible and Multispectral Imagery. Environ. Sci. Pollut. Res. 2022, 29, 58892–58905. [Google Scholar] [CrossRef]
- Dai, L.; Zhang, Y.; Ding, R.; Yan, Y. Spatiotemporal Distribution and Influencing Factors of the Net Primary Productivity in the Datai Mine in Western Beijing. Sustainability 2022, 14, 15567. [Google Scholar] [CrossRef]
- Ranjan, A.K.; Parida, B.R.; Dash, J.; Gorai, A.K. Quantifying the Impacts of Opencast Mining on Vegetation Dynamics over Eastern India Using the Long-Term Landsat-Series Satellite Dataset. Ecol. Inform. 2022, 71, 101812. [Google Scholar] [CrossRef]
- Hu, B.; Zhang, H.; Shen, B. Buildings, Water Bodies, Railways and Main Specifications for Coal Column Retention and Pressurized Coal Mining in Shafts and Lanes; China Coal Industry Publishing House: Beijing, China, 2017. [Google Scholar]
- Tian, Y.; Chen, Z.; Hui, F.; Cheng, X.; Ouyang, L. ESA Sentinel-2A/B Satellite:Characteristics and Applications. J. Beijing Norm. Univ. Sci. 2019, 55, 57–65. [Google Scholar] [CrossRef]
- Li, X.; Yang, L.; Zou, Y.; Ma, C. Dynamic Change of Red Edge Vegetation Index within a Growth Cycle in Arid Area under Coal Mining Stress. J. China Coal Soc. 2021, 46, 1508–1520. [Google Scholar] [CrossRef]
- Su, W.; Zhang, M.; Jiang, K.; Zhu, D.; Huang, J.; Wang, P. Atmospheric Correction Method for Sentinel-2 Satellite Imagery. Acta Opt. Sin. 2018, 38, 322–331. [Google Scholar] [CrossRef]
- Xu, T.; Yang, J.; Bai, J.; Jin, Z.; Guo, Z.; Yu, F. An Inversion Model of Nitrogen Content in Rice Canopy Based on UAV Polarimetric Remote Sensing. Trans. Chin. Soc. Agric. Mach. 2023, 54, 171–178. [Google Scholar] [CrossRef]
- Wang, M.; Luo, Y.; Zhang, Z.; Xie, Q.; Wu, X.; Ma, X. Recent Advances in Remote Sensing of Vegetation Phenology: Retrieval Algorithm and Validation Strategy. Natl. Remote Sens. Bull. 2022, 26, 431–455. [Google Scholar] [CrossRef]
- Xu, Z.; Sun, B.; Zhang, W.; Li, Y.; Yan, Z.; Yue, W.; Teng, S. An Evaluation of a Remote Sensing Method Based on Optimized Triangular Vegetation Index (TVI) for Aboveground Shrub Biomass Estimation in Shrub-Encroached Grassland. Acta Prataculturae Sin. 2023, 32, 1–14. [Google Scholar] [CrossRef]
- Liu, J.; Zhou, Z.; He, X.; Wang, P.; Huang, J. Estimating Winter Wheat Yield under Frequency Histogram and Vegetation Index Using Remote Sensing. Trans. Chinese Soc. Agric. Eng. 2021, 37, 145–152. [Google Scholar] [CrossRef]
- Rouse, J.W.; Haas, R.H.; Schell, J.A.; Deering, D.W. Monitoring Vegetation Systems in the Great Plains with ERTS. NASA Spec. Publ. 1974, 351, 309. [Google Scholar]
- Elsayed, S.; Rischbeck, P.; Schmidhalter, U. Comparing the Performance of Active and Passive Reflectance Sensors to Assess the Normalized Relative Canopy Temperature and Grain Yield of Drought-Stressed Barley Cultivars. F. Crop. Res. 2015, 177, 148–160. [Google Scholar] [CrossRef]
- Gitelson, A.; Merzlyak, M.N. Spectral Reflectance Changes Associated with Autumn Senescence of Aesculus hippocastanum L. and Acer platanoides L. Leaves. Spectral Features and Relation to Chlorophyll Estimation. J. Plant Physiol. 1994, 143, 286–292. [Google Scholar] [CrossRef]
- Barnes, E.M.; Clarke, T.; Richards, S.E.; Colaizzi, P.D.; Haberland, J.; Kostrzewski, M.; Waller, P.M.; Choi, C.Y.; Riley, E.; Thompson, T.L.; et al. Coincident Detection of Crop Water Stress, Nitrogen Status and Canopy Density Using Ground-Based Multispectral Data. In Proceedings of the Fifth International Conference on Precision Agriculture, Bloomington, MN, USA, 16–19 July 2000; pp. 16–19. [Google Scholar]
- Tucker, C.J. Red and Photographic Infrared Linear Combinations for Monitoring Vegetation. Remote Sens. Environ. 1979, 8, 127–150. [Google Scholar] [CrossRef]
- Jönsson, P.; Eklundh, L. Seasonality Extraction by Function Fitting to Time-Series of Satellite Sensor Data. IEEE Trans. Geosci. Remote Sens. 2002, 40, 1824–1832. [Google Scholar] [CrossRef]
- Ma, C.; Cui, Z.; Li, T.; Peng, Y. Spatio-Temporal Variation and Its Response to Climate Change of NDVI in the Terrain Transition Zone, China. Acta Ecol. Sin. 2023, 43, 2141–2157. [Google Scholar] [CrossRef]
- Akima, H. A New Method of Interpolation and Smooth Curve Fitting Based on Local Procedures. J. ACM 1970, 17, 589–602. [Google Scholar] [CrossRef]
- Akima, H. A Method of Bivariate Interpolation and Smooth Surface Fitting Based on Local Procedures. Commun. ACM 1974, 17, 18–20. [Google Scholar] [CrossRef]
- Lu, L.; Guo, H. Extraction Method of Winter Wheat Phenology from Time Series of SPOT/VEGETATION Data. Trans. Chinese Soc. Agric. Eng. 2009, 25, 174–179+317. [Google Scholar] [CrossRef]
- Tan, K.; Zhang, X.; Geng, J.; Cui, Z. Study on the Growth and Decline of Aboveground Biomass of Winter Wheat in North China Prior and Post Overwintering. Chin. J. Agrometeorol. 2022, 43, 276–284. [Google Scholar] [CrossRef]
- Zhao, Y.; Wang, X.; Hou, X.; Zhang, A. Spatio-Temporal Characteristics of Key Phenology of Winter Wheat in Shandong Province from 2003 to 2019. Acta Ecol. Sin. 2021, 41, 7785–7795. [Google Scholar] [CrossRef]
- Yan, F.; Shi, P.; Wu, J.; Wang, Y.; Li, C. The Phenology Character of Winter Wheat by MODI S-EVI Data in Hebei China. Acta Ecol. Sin. 2008, 28, 4381–4387. [Google Scholar]
- Gitelson, A.A.; Gritz, Y.; Merzlyak, M.N. Relationships between Leaf Chlorophyll Content and Spectral Reflectance and Algorithms for Non-Destructive Chlorophyll Assessment in Higher Plant Leaves. J. Plant Physiol. 2003, 160, 271–282. [Google Scholar] [CrossRef]
- Gao, B. NDWI—A normalized difference water index for remote sensing of vegetation liquid water from space. Remote Sens. Environ. 1996, 58, 257–266. [Google Scholar] [CrossRef]
- Wang, F.; Ding, J.; Wei, Y.; Zhou, Q.; Yang, X.; Wang, Q. Sensitivity Analysis of Soil Salinity and Vegetation Indices to Detect Soil Salinity Variation by Using Landsat Series Images: Applications in Different Oases in Xinjiang, China. Acta Ecol. Sin. 2017, 37, 5007–5022. [Google Scholar] [CrossRef]
- Tripathi, N.K.; Rai, B.K.; Dwivedi, P. Spatial Modeling of Soil Alkalinity in GIS Environment Using IRS Data. In Proceedings of the 18th Asian Conference on Remote Sensing, Kuala Lumpur, Malaysia, 20–24 October 1997; pp. 20–24. [Google Scholar]
- Xu, H.; Deng, W. Rationality Analysis of MRSEI and Its Difference with RSEI. Remote Sens. Technol. Appl. 2022, 37, 1–7. [Google Scholar] [CrossRef]
- Xu, H.; Duan, W.; Deng, W.; Lin, M. RSEI or MRSEI? Comment on Jia et al. Evaluation of Eco-Environmental Quality in Qaidam Basin Based on the Ecological Index (MRSEI) and GEE. Remote Sens. 2021, 13, 4543. Remote Sens. 2022, 14, 5307. [Google Scholar] [CrossRef]
- Fan, K.; Li, F.; Chen, X.; Li, Z.; Mulla, D.J. Nitrogen Balance Index Prediction of Winter Wheat by Canopy Hyperspectral Transformation and Machine Learning. Remote Sens. 2022, 14, 3504. [Google Scholar] [CrossRef]
- Zhao, X.; Na, X. Study on Remote Sensing Monitoring of Crop Growth Based on Comprehensive Index:A Case Study of the Songnen Plain. Geogr. Geo-Inf. Sci. 2022, 38, 34–39. [Google Scholar] [CrossRef]
- Xu, H.; Wang, Y.; Guan, H.; Shi, T.; Hu, X. Detecting Ecological Changes with a Remote Sensing Based Ecological Index (RSEI) Produced Time Series and Change Vector Analysis. Remote Sens. 2019, 11, 2345. [Google Scholar] [CrossRef]


| Imaging Date | Data Type | Frame Number | Relative Orbital Number | Imaging Date | Data Type | Frame Number | Relative Orbital Number |
|---|---|---|---|---|---|---|---|
| 19 October 2020 | Level-1C | N0209 | R075 | 21 February 2021 | Level-1C | N0209 | R075 |
| 29 October 2020 | Level-1C | N0209 | R075 | 3 March 2021 | Level-1C | N0209 | R075 |
| 3 November 2020 | Level-1C | N0209 | R075 | 23 March 2021 | Level-1C | N0209 | R075 |
| 8 November 2020 | Level-1C | N0209 | R075 | 28 March 2021 | Level-1C | N0209 | R075 |
| 13 December 2020 | Level-1C | N0209 | R075 | 12 April 2021 | Level-1C | N0300 | R075 |
| 18 December 2020 | Level-1C | N0209 | R075 | 17 April 2021 | Level-1C | N0300 | R075 |
| 7 January 2021 | Level-1C | N0209 | R075 | 27 April 2021 | Level-1C | N0300 | R075 |
| 12 January 2021 | Level-1C | N0209 | R075 | 2 May 2021 | Level-1C | N0300 | R075 |
| 17 January 2021 | Level-1C | N0209 | R075 | 7 May 2021 | Level-1C | N0300 | R075 |
| 27 January 2021 | Level-1C | N0209 | R075 | 12 May 2021 | Level-1C | N0300 | R075 |
| 6 February 2021 | Level-1C | N0209 | R075 | 22 May 2021 | Level-1C | N0300 | R075 |
| 11 February 2021 | Level-1C | N0209 | R075 | 27 May 2021 | Level-1C | N0300 | R075 |
| 16 February 2021 | Level-1C | N0209 | R075 | 1 June 2021 | Level-1C | N0300 | R075 |
| Vegetation Index | Formula | Corresponds to the Band | Reference |
|---|---|---|---|
| NDVI | B8, B4 | [47] | |
| RENDVI | B6, B4 | [48] | |
| NDRE1 | B6, B5 | [49] | |
| NDRE2 | B7, B5 | [50] | |
| MREDVI | B7, B4 | [51] |
| Growth Stages | Vegetation Indices | SA1 Slope | CK1 Slope | Change Amplitude/% | SA2 Slope | CK2 Slope | Change Amplitude/% |
|---|---|---|---|---|---|---|---|
| LOS1 | NDVI | 0.00599 | 0.00628 | −4.62 | 0.0057 | 0.00482 | 18.26 |
| RENDVI | 0.00526 | 0.0055 | −4.36 | 0.00506 | 0.00437 | 15.79 | |
| NDRE1 | 0.00407 | 0.00433 | −6.01 | 0.00383 | 0.00324 | 18.21 | |
| NDRE2 | 0.00352 | 0.00376 | −6.38 | 0.00332 | 0.00263 | 26.24 | |
| MREDVI | 0.00362 | 0.00376 | −3.72 | 0.00306 | 0.00246 | 24.39 | |
| OWS | NDVI | −0.0042 | −0.00536 | −21.64 | −0.00424 | −0.00337 | 25.82 |
| RENDVI | −0.00276 | −0.00299 | −7.69 | −0.00204 | −0.00108 | 88.89 | |
| NDRE1 | −0.00175 | −0.00212 | −17.45 | −0.00117 | −0.00149 | −21.48 | |
| NDRE2 | −0.0019 | −0.00256 | −25.78 | −0.00293 | −0.00279 | 5.02 | |
| MREDVI | −0.00565 | −0.00501 | 12.77 | −0.00674 | −0.00473 | 42.49 | |
| LOS2 | NDVI | 0.00213 | 0.00233 | −8.58 | 0.00261 | 0.00308 | −15.26 |
| RENDVI | 0.00133 | 0.00139 | −4.32 | 0.0016 | 0.00194 | −17.53 | |
| NDRE1 | 0.00239 | 0.00287 | −16.73 | 0.00258 | 0.00326 | −20.86 | |
| NDRE2 | 0.00184 | 0.00252 | −26.98 | 0.00199 | 0.00302 | −34.11 | |
| MREDVI | 0.000324 | 0.00129 | −74.88 | 0.0002374 | 0.00062303 | −61.9 | |
| EOS | NDVI | −0.01073 | −0.01013 | 5.92 | −0.00915 | −0.00927 | −1.29 |
| RENDVI | −0.00927 | −0.00849 | 9.19 | −0.00778 | −0.00782 | −0.51 | |
| NDRE1 | −0.00588 | −0.00526 | 11.79 | −0.00543 | −0.00554 | −1.99 | |
| NDRE2 | −0.00633 | −0.00553 | 14.47 | −0.0063 | −0.00592 | 6.42 | |
| MREDVI | −0.00647 | −0.00561 | 15.33 | −0.00612 | −0.0051 | 20 |
| Date | Payload and Contribution Rate of SA1_SACHI PC1 | Payload and Contribution Rate of SA2_SACHI PC1 | ||||||||
|---|---|---|---|---|---|---|---|---|---|---|
| NDRE2 | CIre | NDMI | SI-T | Contribution Rate/% | NDRE2 | CIre | NDMI | SI-T | Contribution Rate/% | |
| 19 October 2020 | 0.552 | 0.528 | 0.471 | −0.440 | 85.33 | 0.547 | 0.495 | 0.506 | −0.446 | 91.33 |
| 29 October 2020 | 0.502 | 0.506 | 0.632 | −0.305 | 77.85 | −0.622 | −0.605 | −0.091 | 0.488 | 57.41 |
| 3 November 2020 | −0.530 | −0.506 | −0.498 | 0.465 | 82.03 | 0.564 | 0.561 | 0.448 | −0.409 | 86.50 |
| 8 November 2020 | 0.507 | 0.537 | 0.561 | −0.374 | 88.63 | 0.591 | 0.605 | 0.352 | −0.401 | 92.77 |
| 13 December 2020 | 0.460 | 0.559 | 0.612 | −0.320 | 94.37 | −0.478 | −0.550 | −0.596 | 0.338 | 91.71 |
| 18 December 2020 | 0.480 | 0.569 | 0.578 | −0.334 | 94.39 | −0.490 | −0.556 | −0.574 | 0.348 | 91.49 |
| 7 January 2021 | 0.483 | 0.588 | 0.557 | −0.332 | 93.62 | −0.475 | −0.569 | −0.584 | 0.330 | 90.16 |
| 12 January 2021 | 0.470 | 0.551 | 0.602 | −0.336 | 94.61 | −0.468 | −0.532 | −0.611 | 0.353 | 91.81 |
| 17 January 2021 | 0.491 | 0.549 | 0.556 | −0.385 | 91.30 | −0.484 | −0.577 | −0.561 | 0.344 | 89.33 |
| 27 January 2021 | −0.495 | −0.560 | −0.562 | 0.354 | 86.46 | −0.492 | −0.546 | −0.557 | 0.386 | 91.45 |
| 6 February 2021 | 0.497 | 0.560 | 0.562 | −0.352 | 93.22 | −0.480 | −0.558 | −0.595 | 0.322 | 92.27 |
| 11 February 2021 | 0.479 | 0.571 | 0.573 | −0.341 | 94.53 | 0.448 | 0.536 | 0.638 | −0.325 | 93.92 |
| 16 February 2021 | 0.468 | 0.569 | 0.590 | −0.328 | 94.67 | 0.479 | 0.601 | 0.556 | −0.317 | 93.65 |
| 21 February 2021 | −0.476 | −0.595 | −0.561 | 0.324 | 95.07 | 0.469 | 0.585 | 0.575 | −0.328 | 93.02 |
| 3 March 2021 | −0.427 | −0.638 | −0.583 | 0.266 | 95.37 | 0.438 | 0.595 | 0.609 | −0.288 | 94.37 |
| 23 March 2021 | 0.4413 | 0.707 | 0.477 | −0.280 | 91.66 | 0.439 | 0.641 | 0.569 | −0.271 | 93.80 |
| 28 March 2021 | 0.431 | 0.687 | 0.527 | −0.254 | 97.23 | 0.434 | 0.638 | 0.582 | −0.256 | 96.65 |
| 12 April 2021 | 0.391 | 0.748 | 0.496 | −0.203 | 93.59 | 0.419 | 0.658 | 0.575 | −0.248 | 93.85 |
| 17 April 2021 | 0.415 | 0.721 | 0.509 | −0.220 | 93.76 | 0.430 | 0.660 | 0.562 | −0.253 | 94.16 |
| 27 April 2021 | 0.416 | 0.717 | 0.513 | −0.223 | 95.49 | 0.422 | 0.683 | 0.552 | −0.226 | 95.89 |
| 2 May 2021 | 0.452 | 0.709 | 0.477 | −0.256 | 97.36 | 0.504 | 0.687 | 0.426 | −0.305 | 97.20 |
| 7 May 2021 | 0.430 | 0.683 | 0.542 | −0.234 | 97.19 | 0.430 | 0.663 | 0.564 | −0.239 | 96.49 |
| 12 May 2021 | 0.432 | 0.679 | 0.542 | −0.240 | 96.11 | 0.444 | 0.644 | 0.558 | −0.277 | 93.38 |
| 22 May 2021 | 0.501 | 0.557 | 0.575 | −0.330 | 92.60 | −0.549 | −0.646 | −0.418 | 0.325 | 90.96 |
| 27 May 2021 | −0.498 | −0.504 | −0.608 | 0.358 | 89.80 | −0.503 | −0.510 | −0.582 | 0.385 | 89.78 |
| 1 June 2021 | 0.665 | 0.690 | 0.023 | −0.284 | 84.48 | 0.638 | 0.667 | 0.190 | −0.335 | 82.30 |
| Data Date | Total Number of Samples | Number of Samples Unaffected by Mining | Number of Samples Affected by Mining | Significance Level (p) | |
|---|---|---|---|---|---|
| SA1_SACHI | 19 October 2020 | 991 | 776 | 215 | <0.001 ** |
| 29 October 2020 | 991 | 776 | 215 | <0.001 ** | |
| 3 November 2020 | 991 | 249 | 742 | <0.001 ** | |
| 8 November 2020 | 991 | 249 | 742 | <0.001 ** | |
| 13 December 2020 | 991 | 745 | 246 | 0.972 | |
| 7 January 2021 | 991 | 644 | 347 | 0.013 * | |
| 12 January 2021 | 991 | 761 | 230 | <0.001 ** | |
| 17 January 2021 | 991 | 761 | 230 | <0.001 ** | |
| 27 January 2021 | 991 | 885 | 106 | 0.032 * | |
| 6 February 2021 | 991 | 762 | 229 | 0.978 | |
| 11 February 2021 | 991 | 762 | 229 | 0.426 | |
| 16 February 2021 | 991 | 855 | 136 | <0.001 ** | |
| 21 February 2021 | 991 | 855 | 136 | <0.001 ** | |
| 3 March 2021 | 991 | 690 | 301 | <0.001 ** | |
| 23 March 2021 | 991 | 754 | 237 | 0.655 | |
| 28 March 2021 | 991 | 754 | 237 | 0.112 | |
| SA2_SACHI | 18 December 2020 | 367 | 271 | 96 | 0.059 |
| 12 January 2021 | 367 | 188 | 179 | 0.954 | |
| 17 January 2021 | 367 | 188 | 179 | 0.875 | |
| 6 February 2021 | 367 | 329 | 38 | 0.590 | |
| 11 February 2021 | 367 | 329 | 38 | 0.681 | |
| 16 February 2021 | 367 | 286 | 81 | 0.007 ** | |
| 21 February 2021 | 367 | 286 | 81 | 0.004 ** | |
| 3 March 2021 | 367 | 70 | 297 | 0.010 * | |
| 23 March 2021 | 367 | 141 | 226 | 0.103 | |
| 28 March 2021 | 367 | 141 | 226 | 0.932 |
Disclaimer/Publisher’s Note: The statements, opinions and data contained in all publications are solely those of the individual author(s) and contributor(s) and not of MDPI and/or the editor(s). MDPI and/or the editor(s) disclaim responsibility for any injury to people or property resulting from any ideas, methods, instructions or products referred to in the content. |
© 2023 by the authors. Licensee MDPI, Basel, Switzerland. This article is an open access article distributed under the terms and conditions of the Creative Commons Attribution (CC BY) license (https://creativecommons.org/licenses/by/4.0/).
Share and Cite
Zhang, H.; Ma, C.; Guo, W.; Li, T. Dynamic Monitoring of Winter Wheat Health in Mining Subsidence Areas by Combined Active and Passive Remote Sensing Technology. Land 2023, 12, 2079. https://doi.org/10.3390/land12112079
Zhang H, Ma C, Guo W, Li T. Dynamic Monitoring of Winter Wheat Health in Mining Subsidence Areas by Combined Active and Passive Remote Sensing Technology. Land. 2023; 12(11):2079. https://doi.org/10.3390/land12112079
Chicago/Turabian StyleZhang, Haobin, Chao Ma, Wenbing Guo, and Tingting Li. 2023. "Dynamic Monitoring of Winter Wheat Health in Mining Subsidence Areas by Combined Active and Passive Remote Sensing Technology" Land 12, no. 11: 2079. https://doi.org/10.3390/land12112079
APA StyleZhang, H., Ma, C., Guo, W., & Li, T. (2023). Dynamic Monitoring of Winter Wheat Health in Mining Subsidence Areas by Combined Active and Passive Remote Sensing Technology. Land, 12(11), 2079. https://doi.org/10.3390/land12112079