Integrated Terrestrial and Marine Ecosystem Services Valuation and Result Variation Trends: A Case Study of Jiangsu Province, China
Abstract
1. Introduction
2. Study Area and Data Collection
2.1. Overview of the Study Area
2.2. Data Sources
- (1)
- Land-use-type data
- (2)
- Remote sensing images and products
- (3)
- Socioeconomic Data
- (4)
- Other data
3. Research Methods
3.1. Terrestrial ESV Method
3.1.1. Matching of Ecosystem and Land-Use Types
3.1.2. Determination of ESV Equivalence Factors
3.2. Marine ESV Method
3.2.1. Determination of Evaluation Indicators
3.2.2. Calculating Marine Primary Productivity Based on the VGPM Model
3.2.3. Calculating ESVs for Indicators Based on Marine Primary Productivity
3.2.4. Calculating ESVs for Indicators Based on Statistical Data
3.2.5. Calculating ESVs for Indicators Based on the Result-Checking Method
4. Valuation Results and Analysis
4.1. Terrestrial ESVs in Jiangsu Province and Their Spatiotemporal Characteristics
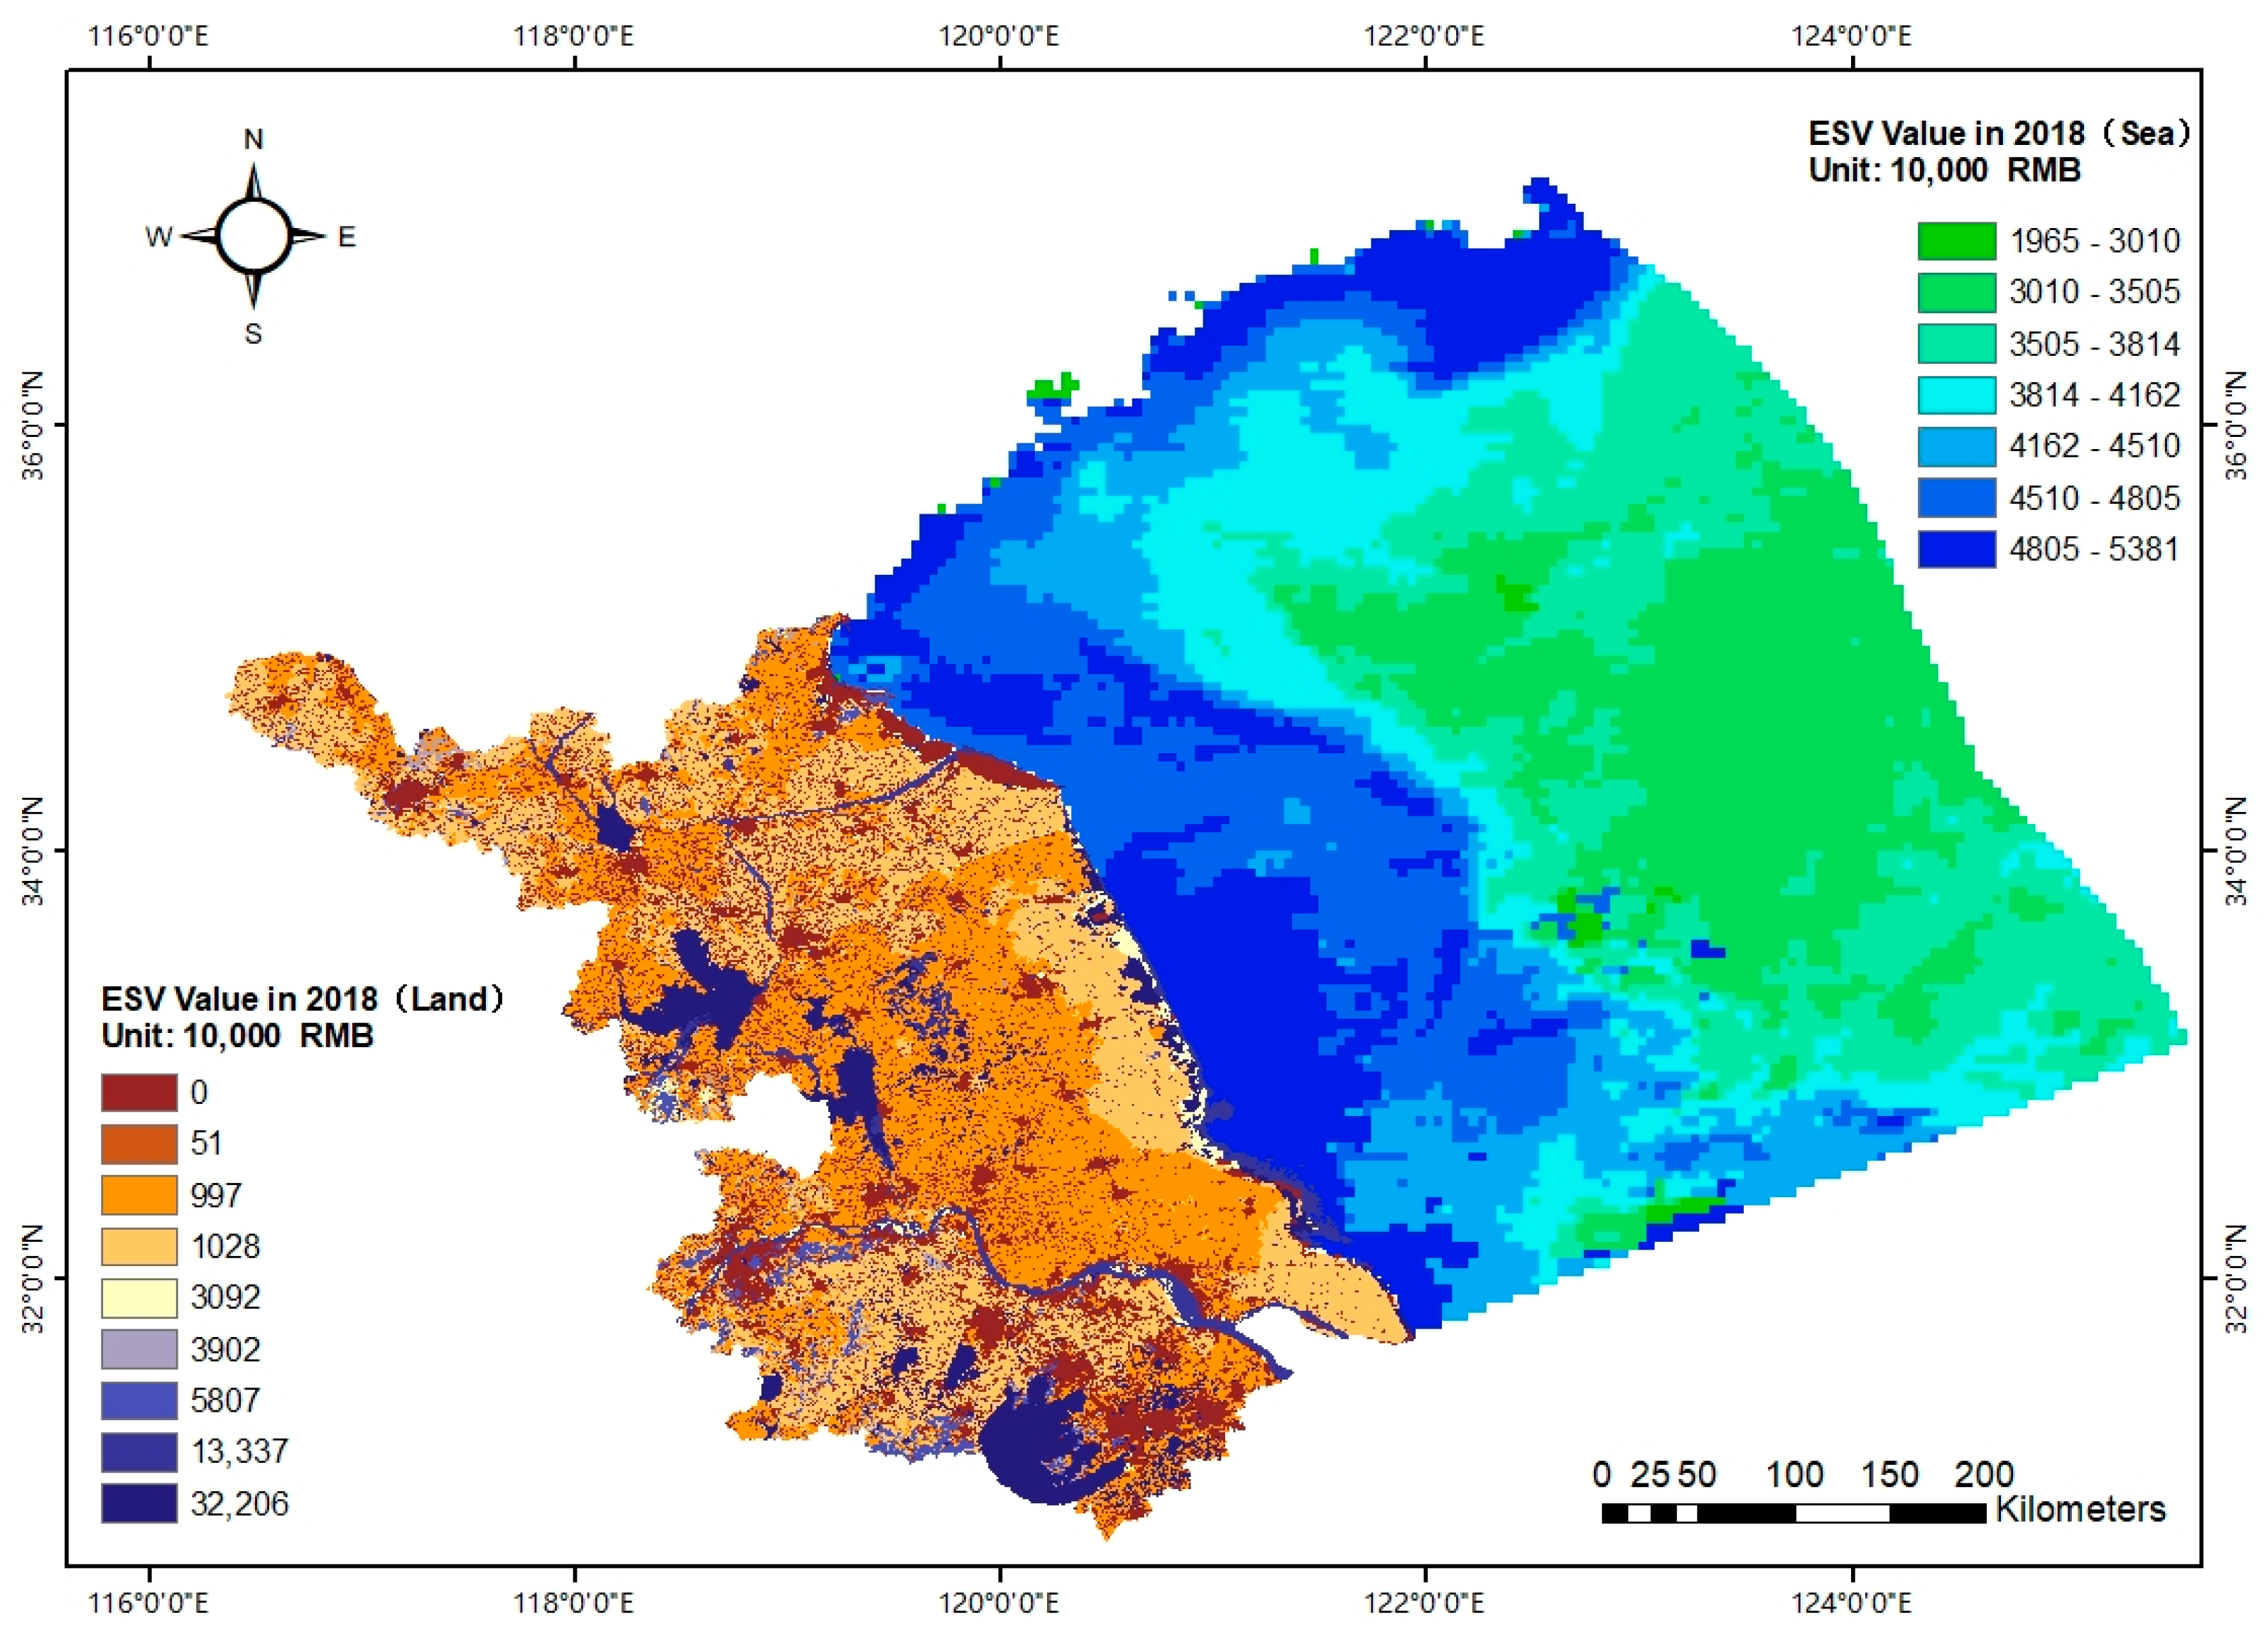
4.1.1. 2018. ESV of Jiangsu Province
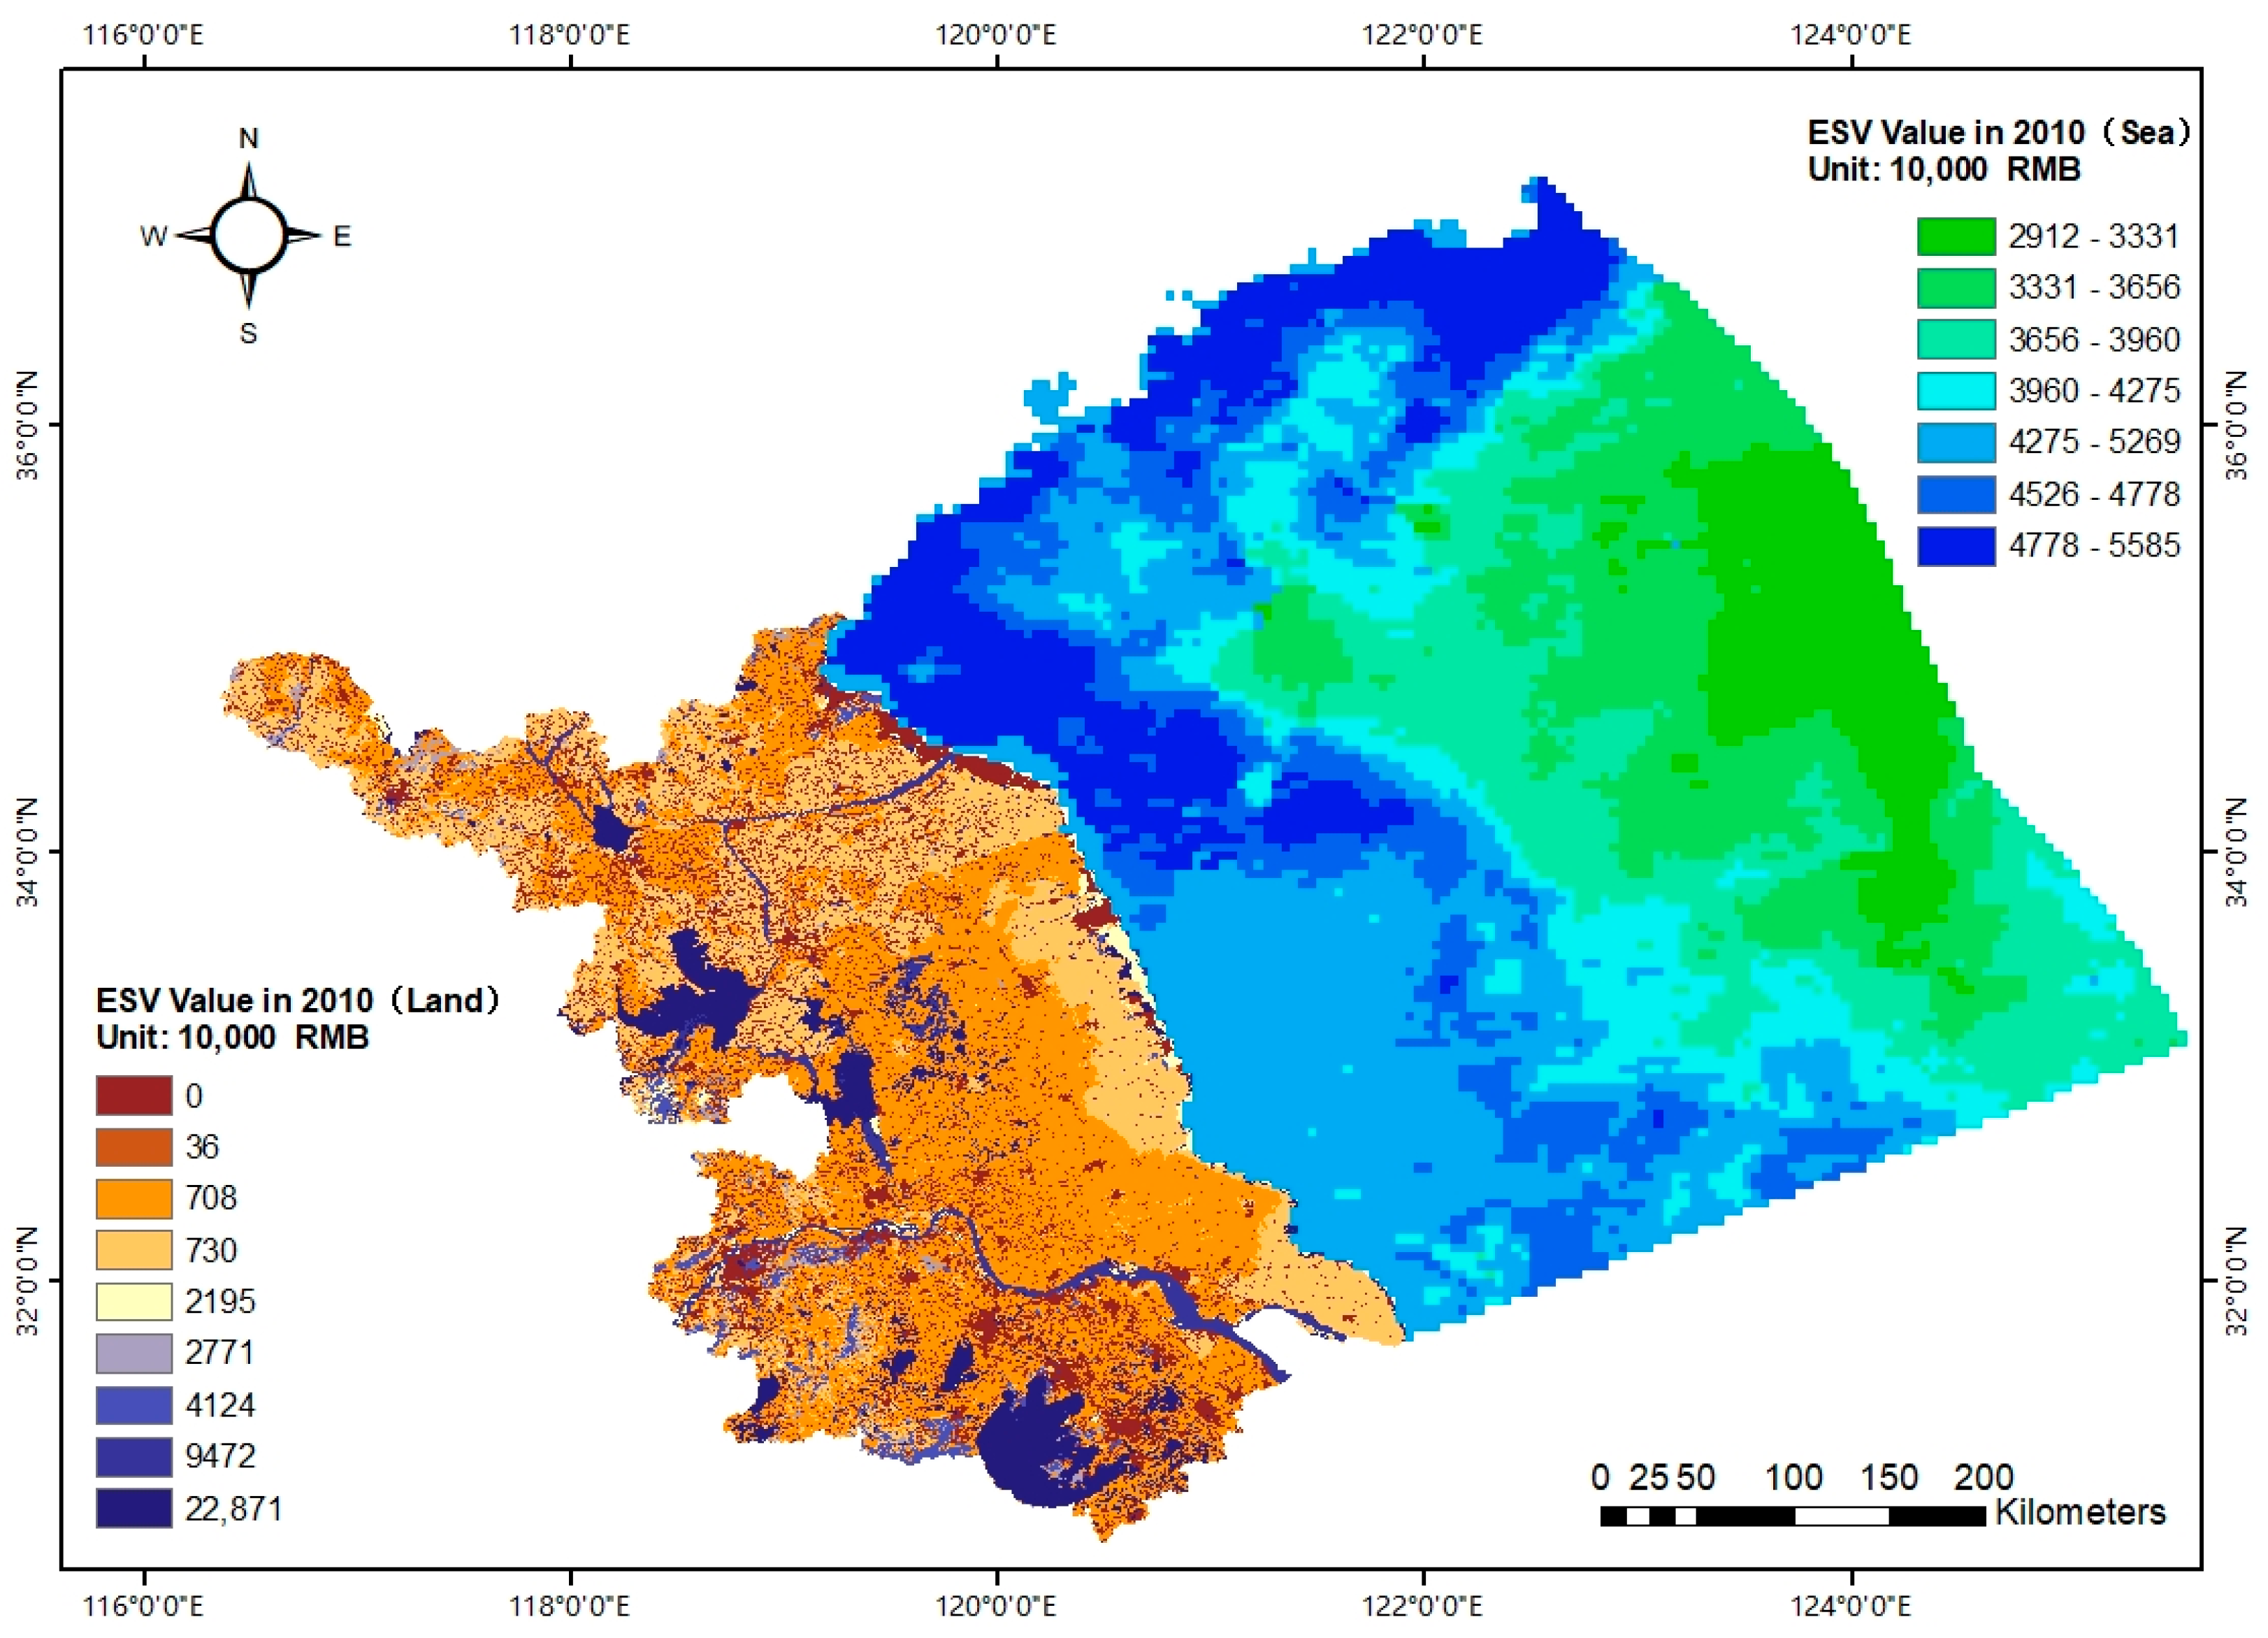
4.1.2. ESV of Jiangsu Province in 2010
4.1.3. Assessment of Changes in Terrestrial ESVs in Jiangsu Province from 2010–2018
4.1.4. Assessment of ESV Changes in Prefecture-Level Cities in Jiangsu Province from 2010–2018
4.2. Marine ESVs in Jiangsu Province and Their Spatiotemporal Characteristics
4.2.1. ESV of Sea Area Adjacent to Jiangsu Province in 2018
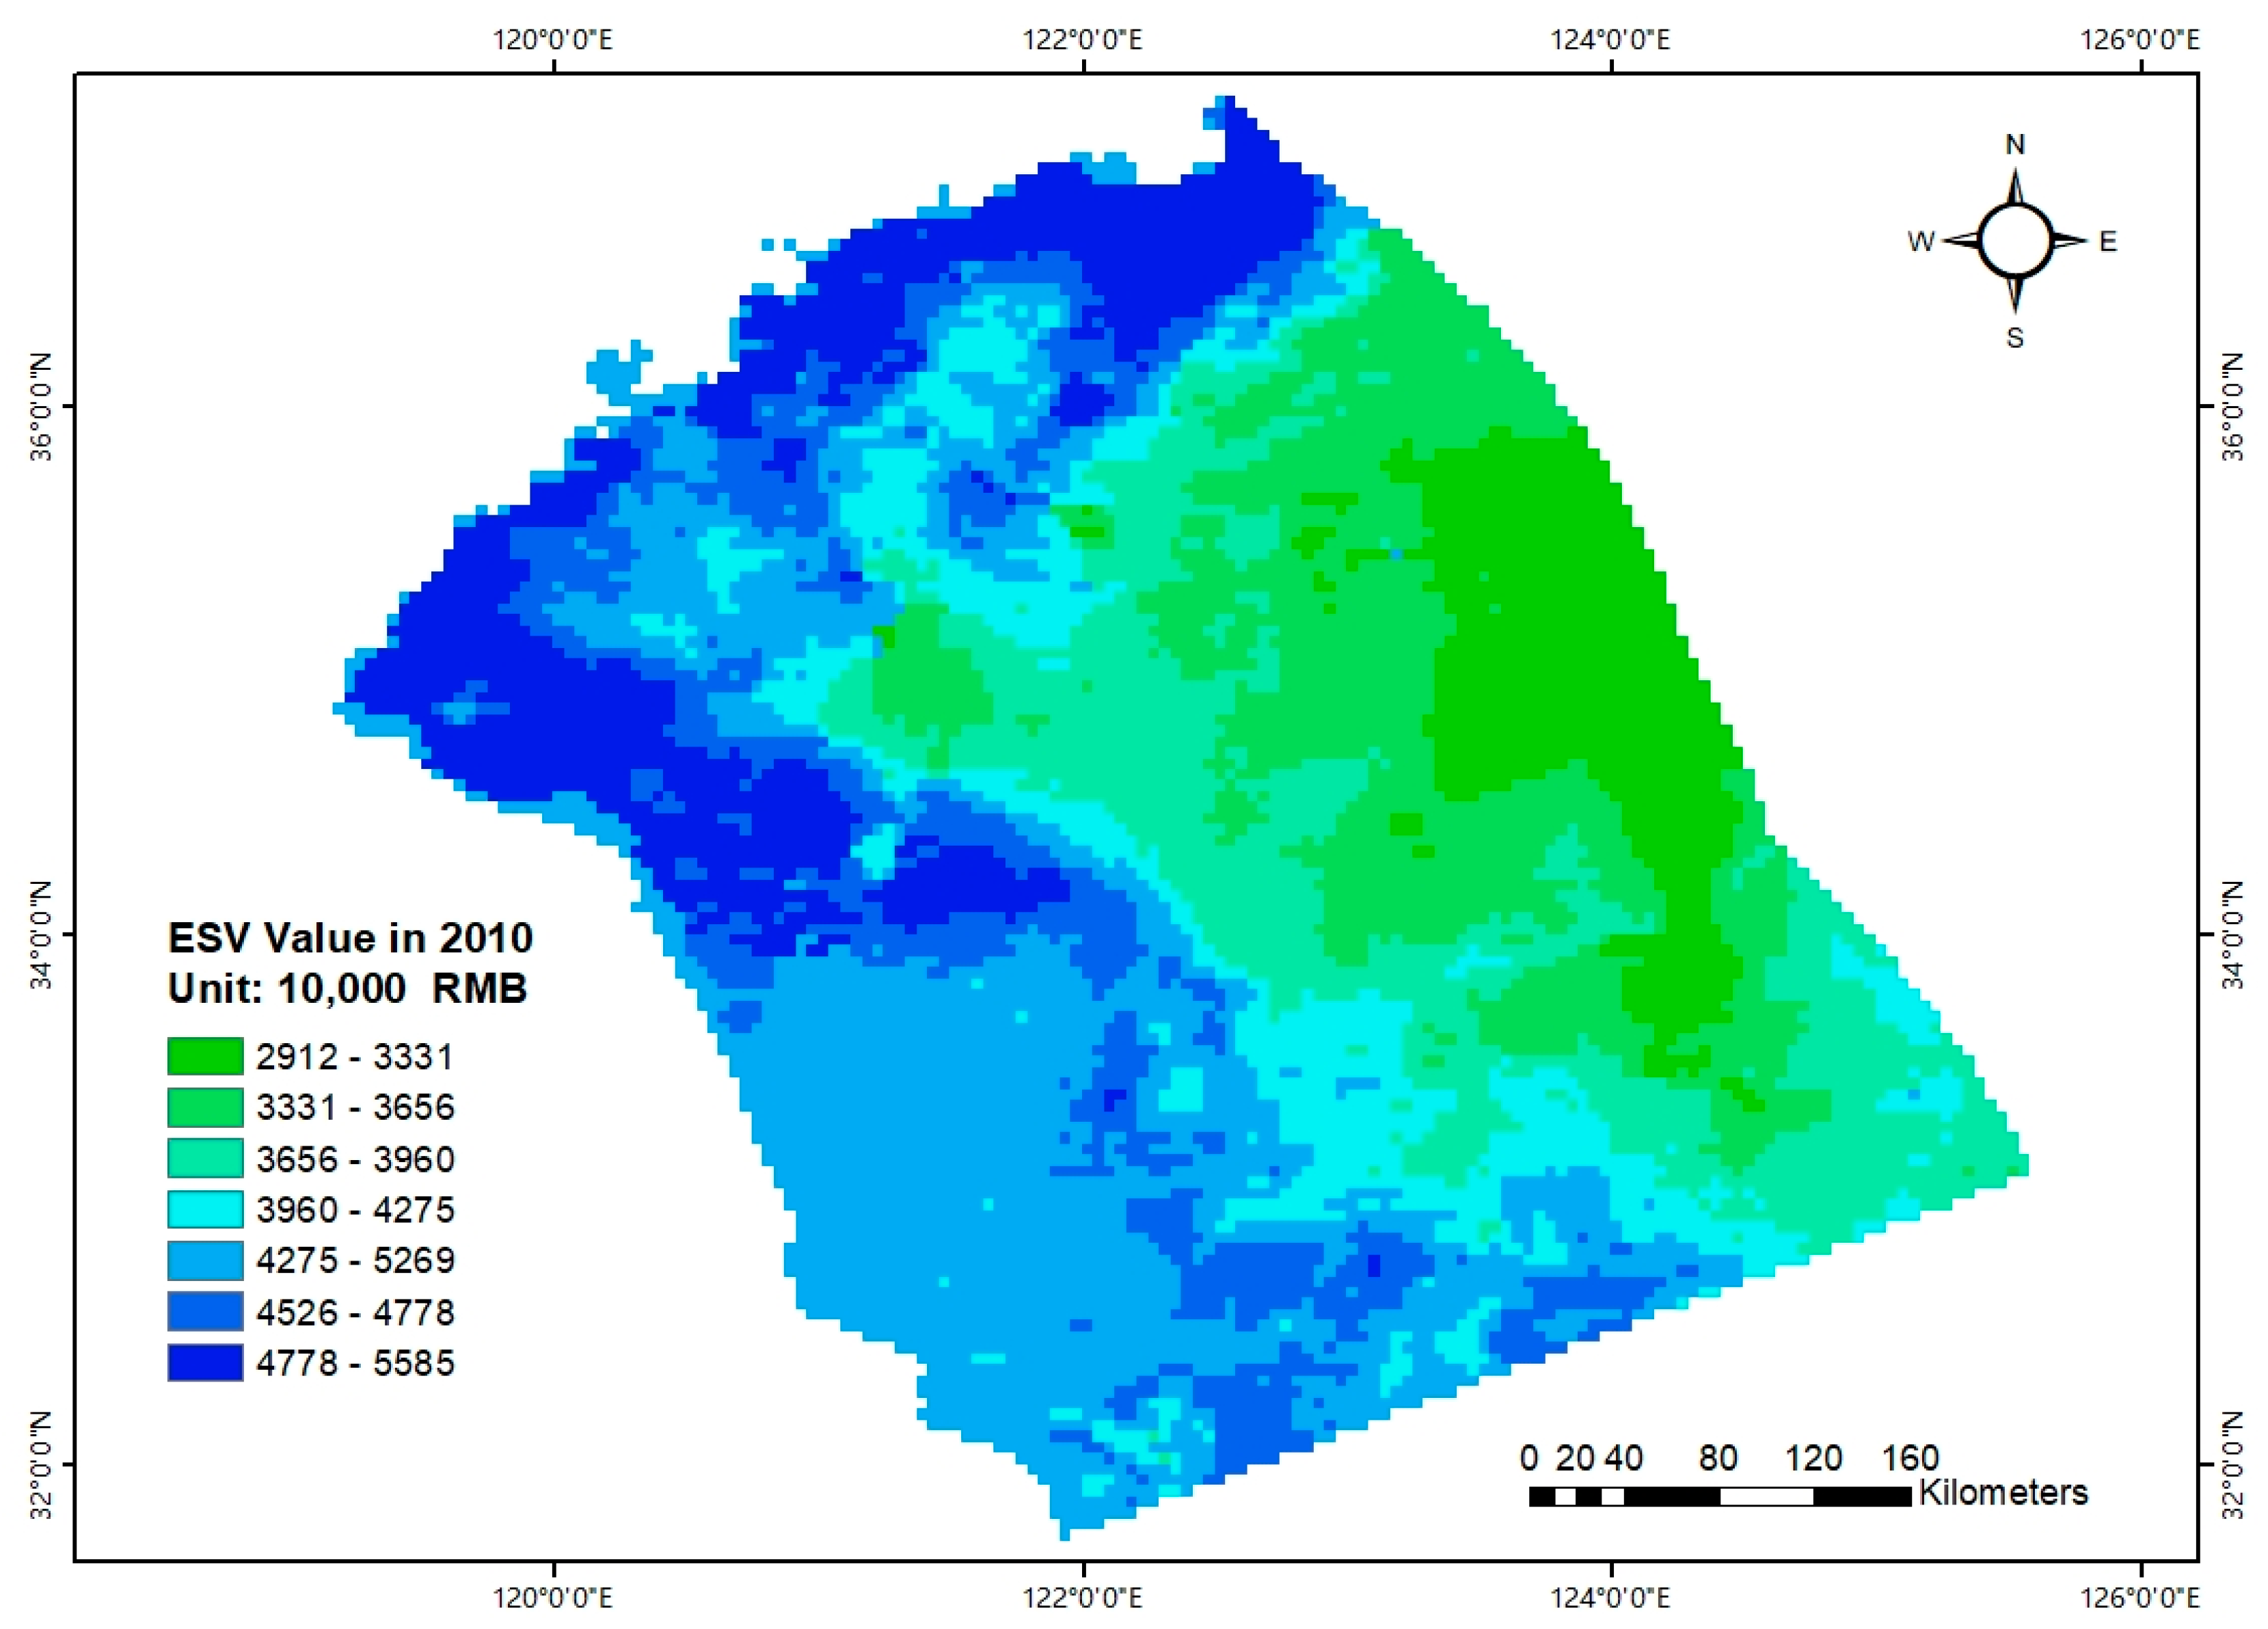
4.2.2. ESV of the Sea Area Adjacent to Jiangsu Province in 2010
4.2.3. Changes in ESVs in the Sea Area Adjacent to Jiangsu Province from 2010–2018
4.2.4. Analysis of ESV Distribution Based on Functions of Carbon Sequestration and Oxygen Production
4.3. Integrated Terrestrial and Marine ESVs in Jiangsu Province and Their Spatiotemporal Characteristics
4.3.1. Integrated Terrestrial and Marine Analysis Method
4.3.2. Distribution of Integrated Terrestrial and Marine ESVs
4.3.3. Distribution of Terrestrial and Marine ESVs
- (1)
- Overall, the ESV in the marine transects steadily decreased with increasing distance from the coast. Marine ESV per unit area was significantly affected by marine net primary productivity. As the distance from the coast increased, the marine net primary productivity decreased and the ESV showed a downward trend. In contrast, the ESV in the terrestrial transects in Jiangsu Province fluctuated significantly; the terrestrial ESV depended entirely on land-use type and did not show apparent variations with distance from the coast;
- (2)
- In terms of absolute differences, the ESV in the terrestrial transects of Jiangsu Province presented the most significant variations in 2018. The value peaked approximately 19 km from the coast and was relatively low between 20 and 150 km from the coast. The value then reached two local maxima between 150 and 300 km from the coast. The main reason for this pattern is that the ESV of water areas was significantly higher than that of other land-use types. The ESV in the transect increased significantly when it passed through the water area. The variation trend of the ESV in the terrestrial transects of Jiangsu Province in 2010 was similar to that in the terrestrial transects in 2018, whereas the ESV in the marine transects in 2010 and 2018 decreased slowly without major fluctuations.
- (3)
- In terms of relative differences, there were large differences between the ESVs in the transects of Jiangsu Province in 2010 and 2018, particularly in the coastal area, where the ESV in 2018 increased significantly from 2010, mainly because of the regulatory effect of the coastal water area. The differences between the ESVs in the marine transects in 2010 and 2018 were relatively small, both showing a gradually decreasing trend as the distance from the coast increased; however, the decreasing rate of the marine ESV in 2018 was higher than that in 2010;
- (4)
- Regarding the interactions between terrestrial and marine ecosystem services, the terrestrial and marine ESVs in Jiangsu Province in 2018 were higher than those in 2010, especially within 20 km of the coast, where terrestrial and marine ESVs in 2018 increased significantly. Owing to human activities, the connection between land and sea areas has become closer, fully reflecting the ESV of water areas.
5. Discussion and Prospects
6. Conclusions
Author Contributions
Funding
Data Availability Statement
Acknowledgments
Conflicts of Interest
References
- Paetzold, A.; Warren, P.H.; Maltby, L.L. A framework for assessing ecological quality based on ecosystem services. Ecol. Complex. 2010, 7, 273–281. [Google Scholar] [CrossRef]
- Mina, M.; Bugmann, H.; Cordonnier, T.; Irauschek, F.; Klopcic, M.; Pardos, M.; Cailleret, M. Future ecosystem services from European mountain forests under climate change. J. Appl. Ecol. 2017, 54, 389–401. [Google Scholar] [CrossRef]
- Ehrlich, P.R.; Ehrlich, A.H. Extinction: The Causes and Consequences of the Disappearance of Species; Random House: New York, NY, USA, 1982. [Google Scholar] [CrossRef]
- Mouchet, M.A.; Lamarque, P.; Martín-López, B.; Crouzat, E.; Gos, P.; Byczek, C.; Lavorel, S. An interdisciplinary methodological guide for quantifying associations between ecosystem services. Glob. Environ. Change: Hum. Policy Dimens. 2014, 28, 298–308. [Google Scholar] [CrossRef]
- Steemann, N.E. Productivity, definition and measurement. J. Cons. Int. Explor. Mer. 1952, 18, 117–140. [Google Scholar]
- Eppley, R.W.; Stewart, E.; Abbott, M.R.; Heyman, U. Estimating ocean primary production from satellite chlorophyll. Introduction to regional differences and statistics for the Southern California Bight. J. Plankton Res. 1985, 7, 57–70. [Google Scholar] [CrossRef]
- Costanza, R.; Arge, R.D.; Groot, R.D.; Farber, S.; Grasso, M.; Hannon, B.; Limburg, K.; Naeem, S.; Neil, R.V.O.; Paruelo, J.; et al. The Value of the World’s Ecosystem Services and Natural Capital. Ecol. Econ. 1998, 25, 3–15. [Google Scholar] [CrossRef]
- Daily, G.C. Nature’s Services: Societal Dependence on Natural Ecosystems; Island Press: Washington, DC, USA, 1997. [Google Scholar] [CrossRef]
- Sannigrahi, S.; Bhatt, S.; Rahmat, S.; Paul, S.K.; Sen, S. Estimating global ecosystem service values and its response to land surface dynamics during 1995–2015. Environ. Manag. 2018, 223, 115–131. [Google Scholar] [CrossRef]
- Wu, Z.; Lin, C.; Shao, H.; Feng, X.J.; Chen, X.; Wang, S.M. Ecological risk assessment and difference analysis of pit ponds under different ecological service functions-A case study of Jianghuai ecological Economic Zone. Ecol. Indic. 2021, 129, 107860. [Google Scholar] [CrossRef]
- Behrenfel, M.J.; Falkowski, P.G. Photosynthetic Rates Derived from Satellite-Based Chlorophyll Concentration. Limnol. Oceanogr. 1997, 42, 1–20. [Google Scholar] [CrossRef]
- Millennium Ecosystem Assessment (MA). Ecosystems and Human Well-Being: Synthesis; Island Press: Washington, DC, USA, 2005; ISBN 9781597260404. [Google Scholar]
- Alleway, H.K.; Gillies, C.L.; Bishop, M.J.; Gentry, R.R.; Theuerkauf, S.J.; Jones, R. The Ecosystem Services of Marine Aquaculture. Valuing Benefits to People and Nature. BioScience 2019, 69, 59–68. [Google Scholar] [CrossRef]
- Xia, T.; Chen, S.; Zhang, T.; Wang, M. Evaluation of the Value of Coastal Ecosystem Services in Jiangsu Province. J. Ecol. 2014, 34, 5069–5076. [Google Scholar] [CrossRef][Green Version]
- Dugdale, R.C.; Wilkerson, F.P.; Barber, R.T.; Chavez, F.P. Estimating new production in the equatorial Pacific Ocean at 150°W. J. Geophys. Res. Ocean. 1992, 97, 681–686. [Google Scholar] [CrossRef]
- Xie, G.D.; Zhen, L.; Lu, C.X.; Xiao, Y.; Chen, C. An ESV approach based on expert knowledge. J. Nat. Resour. 2008, 5, 911–919. [Google Scholar] [CrossRef]
- He, H.; Yang, M.C.; Pan, Y.Z.; Zhu, W.Q. Measurement of terrestrial ecosystem service value in China based on remote sensing. In Proceedings of the 2005 IEEE International Geoscience and Remote Sensing Symposium, Seoul, Republic of Korea, 29 July 2005. [Google Scholar] [CrossRef]
- Xie, G.D.; Zhang, C.X.; Zhang, L.M.; Chen, W.H.; Li, S.M. Improvement of ecosystem service valuation method based on unit area value equivalence factor. J. Nat. Resour. 2015, 8, 1243–1254. [Google Scholar] [CrossRef]
- Shi, Y.; Wang, R.S.; Huang, J.L.; Yang, W.R. An analysis of the spatial and temporal changes in Chinese terrestrial ecosystem service functions. Chin. Sci. Bull. 2012, 57, 2120–2131. [Google Scholar] [CrossRef]
- Wang, W.; Guo, H.C.; Chuai, X.W.; Dai, C.; Lai, L.; Zhang, M. The impact of land use change on the temporospatial variations of ecosystems services value in China and an optimized land use solution. Environ. Sci. Policy 2014, 44, 62–72. [Google Scholar] [CrossRef]
- Su, M.N.; Peng, B.R. Integrating values of ecosystem services into decision making in coastal management in Xiamen. Ocean Coast. Manag. 2018, 207, 104590. [Google Scholar] [CrossRef]
- Wang, Y.H.; Hu, Y.J. Evaluation of the Conditional Value of the Restoration of Ecosystem Services in Xincun Bay. J. Yangtze Univ. 2005, 2, 83–88+109. Available online: http://dx.chinadoi.cn/10.3969/j.issn.1673-1409-C.2005.02.020 (accessed on 14 July 2006).
- Clark, C.M.; Bell, M.D.; Boyd, J.W.; Compton, J.E.; Davidson, E.A.; Davis, C.; Fenn, M.E.; Geiser, L.; Jones, L.; Blett, T.F. Nitrogen-induced terrestrial eutrophication: Cascading effects and impacts on ecosystem services. Ecosphere 2017, 8, e01877. [Google Scholar] [CrossRef]
- Aziz, T. Terrestrial protected areas: Understanding the spatial variation of potential and realized ecosystem services. J. Environ. Manag. 2023, 326, 116803. [Google Scholar] [CrossRef]
- Jiang, H.; Wu, W.; Wang, J.; Yang, W.; Gao, Y.; Duan, Y.; Ma, G.; Wu, C.; Shao, J. Mapping global value of terrestrial ecosystem services by countries. Ecosyst. Serv. 2021, 52, 101361. [Google Scholar] [CrossRef]
- Chen, Y.; Li, X.; Min, M. Mapping for terrestrial ecosystem services: A review. In Proceedings of the 2019 8th International Conference on Agro-Geoinformatics (Agro-Geoinformatics), Istanbul, Turkey, 16–19 July 2019. [Google Scholar] [CrossRef]
- Yuan, M.-H.; Lo, S.-L.; Yang, C.-K. Integrating ecosystem services in terrestrial conservation planning. Environ. Sci. Pollut. Res. 2017, 24, 12144–12154. [Google Scholar] [CrossRef]
- Jiangsu Provincial Bureau of Statistics; National Bureau of Statistics of China; Jiangsu Survey Team. 2018 Jiangsu Provincial Statistical Bulletin on National Economic and Social Development; Xinhua Daily: Beijing, China, 2019. [CrossRef]
- Liu, G.L.; Zhang, L.C.; Zhang, Q. The impact of spatiotemporal changes in land use on the value of ecosystem services in the Yangtze River Delta region. J. Ecol. 2014, 12, 3311–3319. [Google Scholar] [CrossRef]
- Li, W.; Tiwari, S.P.; El-Askary, H.M.; Qurban, M.A.; Amiridis, V.; ManiKandan, K.P.; Garay, M.J.; Kalashnikova, O.V.; Piechota, T.C.; Struppa, D.C. Synergistic use of remote sensing and modeling for estimating net primary produc-tivity in the red Sea with VGPM, eppley-VGPM, and CbPM models intercomparison. IEEE Trans. Geosci. Remote Sens. 2020, 58, 8717–8734. [Google Scholar] [CrossRef]
- Shi, H.; Gao, W.; Zheng, Y.; Yang, L.; Han, B.; Zhang, Y.; Zheng, L. Distribution and abundance of oil-degrading bacteria in seawater of the Yellow Sea and Bohai Sea, China. Sci. Total Environ. 2023, 902, 166038. [Google Scholar] [CrossRef]
- Wang, B.D.; Chen, A.P.; Liu, F. Research on the Redfield Ratio in the Ocean. Prog. Mar. Sci. 2003, 2, 232–235. [Google Scholar] [CrossRef]
- Shi, J.X.; Xu, C.Y.; Han, Y.X.; Han, H.J. Case study on wastewater treatment technology of coal chemical industry in China. Crit. Rev. Environ. Sci. Technol. 2021, 51, 1003–1044. [Google Scholar] [CrossRef]
- GB 3097-1997; Sea Water Quality Standard. MEP (Ministry of Environmental Protection of the People’s Republic of China): Beijing, China, 1997. Available online: http://english.mep.gov.cn/standards_reports/standards/water_environment/quality_standard/200710/t20071024_111791.htm (accessed on 1 January 2023).
- Groot, R.S.D.; Wilson, M.A.; Boumans, R.M.J. A typology for the classification description and valuation of ecosystem functions, goods and services. Ecol. Econ. 2002, 41, 393–408. [Google Scholar] [CrossRef]
- Welegedara, N.P.Y.; Grant, R.F.; Quideau, S.A.; Landhäusser, S.M.; Merlin, M.; Llret, E. Modelling plant water relations and net primary productivity as affected by reclamation cover depth in reclaimed forestlands of northern Alberta. Plant Soil 2020, 446, 627–654. [Google Scholar] [CrossRef]
- Patrizio, C.R.; Thompson, D.W.J. Observed Linkages between the Atmospheric Circulation and Oceanic-Forced Sea-Surface Temperature Variability in the Western North Pacific. Geophys. Res. Lett. 2022, 49, e2021GL095172. [Google Scholar] [CrossRef]
- Breton, E.L.; Brune, S.; Ustaszewski, K.; Zahirovic, S.; Seton, M.; Müller, R.D. Kinematics and extent of the Piemont-Liguria Basin-implications for subduction processes in the Alps. Solid Earth 2021, 12, 885–913. [Google Scholar] [CrossRef]
- Fu, B.; Li, Y.; Wang, Y.; Zhang, B.; Yin, S.; Zhu, H.; Xing, Z. Evaluation of ecosystem service value of riparian zone using land use data from 1986 to 2012. Ecol. Indic. 2016, 69, 873–881. [Google Scholar] [CrossRef]
- Li, L.; Li, Y.; Yang, L.; Liang, Y.; Zhao, W.; Chen, G. How Does Topography Affect the Value of Ecosystem Services? An Empirical Study from the Qihe Watershed. Int. J. Environ. Res. Public Health 2022, 19, 11958. [Google Scholar] [CrossRef]
- Liu, J.; Chen, X.; Chen, W.; Zhang, Y.; Wang, A.; Zheng, Y. Ecosystem Service Value Evaluation of Saline—Alkali Land Development in the Yellow River Delta—The Example of the Huanghe Island. Water 2023, 15, 477. [Google Scholar] [CrossRef]
- Huang, Y.; Deng, J.; Xiao, M.; Huang, Y.; Li, H.; Xiao, Y.; Huang, Y. Study of the Ecosystem Service Value Gradient at the Land–Water Interface Zone of the Xijiang River Mainstem. Appl. Sci. 2023, 13, 10485. [Google Scholar] [CrossRef]
- Yang, J.; Xie, B.; Wang, S.; Zhang, D.; Liu, C.; Mak-Mensah, E. Temporal and spatial characteristics of grassland ecosystem service value and its topographic gradient effect in the Yellow River Basin. PLoS ONE 2022, 17, e0278211. [Google Scholar] [CrossRef]
- Felipe-Lucia, M.R.; Comin, F.A. Ecosystem services-biodiversity relationships depend on land use type in floodplain agroecosystems. Land Use Policy 2015, 46, 201–210. [Google Scholar] [CrossRef]
- Zheng, H.; Peng, J.; Qiu, S.; Xu, Z.; Zhou, F.; Xia, P.; Adalibieke, W. Distinguishing the impacts of land use change in intensity and type on ecosystem services trade-offs. J. Environ. Manag. 2022, 316, 115206. [Google Scholar] [CrossRef]



| Data Type | Data Name | Data Format | Data Source | Data Usage |
|---|---|---|---|---|
| Land-use data | Raster map of land use/land cover in Jiangsu Province, 2010 and 2018 (1 × 1 km) | Raster | Resources and Environmental Science Data Center, Chinese Academy of Sciences. Available online: http://www.resdc.cn (accessed on 2 July 2018) | Calculating the ESV in a specific year based on the changes in land-use types and analyzing the temporal variations in service values. |
| Remote sensing images and products | MODIS monthly average data of SST, sea surface photosynthetically active radiation, diffuse attenuation coefficient of seawater, and oceanic chlorophyll concentration (4 × 4 km) in March, June, September, and December 2018. | Raster | Available online: https://oceandata.sci.gsfc.nasa.gov (accessed on 31 December 2018) | Calculating the marine net primary productivity of the sea area adjacent to Jiangsu Province, then calculating the quantities of carbon sequestration and oxygen production in the sea area, and, finally, calculating its ESV. |
| Socio-economic data | Jiangsu Statistical Yearbook of 2018 | Text | Jiangsu Provincial Statistical Bureau. Available online: http://tj.jiangsu.gov.cn (accessed on 2 December 2019) | Calculating the ESV in the study area. |
| Other data | Raster-based digital elevation model of Jiangsu Province (90 × 90 m), vector shapefiles of the boundaries of Jiangsu Province | Raster and vector | Resources and Environmental Science Data Center, Chinese Academy of Sciences. Available online: http://www.resdc.cn (accessed on 1 January 2023) | Delineating the range of the study area. |
| Level 1 Land-Use Code | Level 1 Land-Use Category | Level 2 Land-Use Code | Level 2 Land-Use Category |
|---|---|---|---|
| 1 | Arable land | 11 | Paddy fields |
| 12 | Dry land | ||
| 2 | Woodland | 21 | Woodland |
| 22 | Shrubs | ||
| 23 | Sparse woodland | ||
| 24 | Other woodlands | ||
| 3 | Grassland | 31 | High-coverage grassland |
| 32 | Medium-coverage grassland | ||
| 33 | Low-coverage grassland | ||
| 4 | Water area | 41 | River channels |
| 42 | Lakes | ||
| 43 | Reservoirs and ponds | ||
| 45 | Mudflats | ||
| 46 | Beach land | ||
| 5 | Urban, rural, industrial, mining, and residential land | 51 | Urban land |
| 52 | Rural settlements | ||
| 53 | Other construction land | ||
| 6 | Unutilized land | 63 | Saline-alkali land |
| 64 | Swampy land | ||
| 65 | Bare land | ||
| 66 | Bare rocky ground |
| Ecosystem Type | Corresponding Land-Use Type | Major Ecosystem Services [6] |
|---|---|---|
| Farmland | Dry land and paddy fields | Soil conservation, biodiversity maintenance, and hydrological regulation |
| Forests | Woodland, sparse woodland, shrubs, and other woodlands | Biodiversity maintenance, climate regulation, and hydrological regulation |
| Grassland | Low-, medium-, and high-coverage grasslands | Biodiversity maintenance and climate regulation |
| Wetland | Mudflats, beach land, swampy land, and river channels | Water supply, hydrological regulation, biodiversity maintenance, and environmental purification |
| Water area | Lakes, reservoirs, and ponds | Water supply, environmental purification, hydrological regulation, and biodiversity maintenance |
| Deserts | Saline-alkali land, bare land, and bare rocky ground | Biodiversity maintenance and environmental purification |
| Ecosystem Type | Provisioning Services | Regulating Services | Supporting Services | Cultural Services | ||||||||
|---|---|---|---|---|---|---|---|---|---|---|---|---|
| Level 1 | Level 2 | Food Production | Raw Material Production | Water Supply | Gas Regulation | Climate Regulation | Environmental Purification | Hydrological Regulation | Soil Conservation | Nutrient Circulation Maintenance | Biodiversity Maintenance | Landscape Aesthetics |
| Farmland | Dry land | 0.85 | 0.40 | 0.02 | 0.67 | 0.36 | 0.10 | 0.27 | 1.03 | 0.12 | 0.13 | 0.06 |
| Paddy fields | 1.36 | 0.09 | −2.63 | 1.11 | 0.57 | 0.17 | 2.72 | 0.01 | 0.19 | 0.21 | 0.09 | |
| Forests | Coniferous | 0.22 | 0.52 | 0.27 | 1.70 | 5.07 | 1.49 | 3.34 | 2.06 | 0.96 | 1.88 | 0.82 |
| Mixed coniferous and broad-leaved | 0.31 | 0.71 | 0.37 | 2.35 | 7.03 | 1.99 | 3.51 | 2.86 | 0.22 | 2.60 | 1.14 | |
| Broad-leaved | 0.29 | 0.66 | 0.34 | 2.17 | 6.50 | 1.93 | 4.74 | 2.65 | 0.20 | 2.41 | 1.06 | |
| Shrubs | 0.19 | 0.43 | 0.33 | 1.41 | 4.23 | 1.28 | 3.35 | 1.72 | 0.13 | 1.57 | 0.69 | |
| Grassland | Grassland | 0.10 | 0.14 | 0.08 | 0.51 | 1.34 | 0.44 | 0.98 | 0.62 | 0.05 | 0.56 | 0.25 |
| Shrub–grassland | 0.38 | 0.56 | 0.31 | 1.97 | 5.21 | 1.72 | 3.82 | 2.40 | 0.18 | 2.18 | 0.96 | |
| Marshy grassland | 0.22 | 0.33 | 0.18 | 1.14 | 3.02 | 1.00 | 2.21 | 1.39 | 0.11 | 1.27 | 0.54 | |
| Wetland | Wetland | 0.51 | 0.50 | 2.59 | 1.90 | 3.60 | 3.60 | 24.23 | 2.31 | 0.18 | 7.87 | 4.73 |
| Deserts | Deserts | 0.01 | 0.03 | 0.02 | 0.11 | 0.10 | 0.31 | 0.21 | 0.13 | 0.01 | 0.12 | 0.05 |
| Bare land | 0.00 | 0.00 | 0.00 | 0.02 | 0.00 | 0.10 | 0.03 | 0.02 | 0.00 | 0.02 | 0.01 | |
| Water area | Water system | 0.80 | 0.23 | 8.29 | 0.77 | 2.29 | 5.55 | 102.24 | 0.93 | 0.07 | 2.55 | 1.89 |
| Glacier and snow | 0.00 | 0.00 | 2.16 | 0.18 | 0.54 | 0.16 | 7.13 | 0.00 | 0.00 | 0.01 | 0.09 | |
| Ecosystem Type | Provisioning Services | Regulating Services | Supporting Services | Cultural Services | ||||||||
|---|---|---|---|---|---|---|---|---|---|---|---|---|
| Level 1 | Level 2 | Food Production | Raw Material Production | Water Supply | Gas Regulation | Climate Regulation | Environmental Purification | Hydrological Regulation | Soil Conservation | Nutrient Circulation Maintenance | Biodiversity Maintenance | Landscape Aesthetics |
| Farmland | Dry land | 0.85 | 0.40 | 0.02 | 0.67 | 0.36 | 0.10 | 0.27 | 1.03 | 0.12 | 0.13 | 0.06 |
| Paddy fields | 1.36 | 0.09 | −2.63 | 1.11 | 0.57 | 0.17 | 2.72 | 0.01 | 0.19 | 0.21 | 0.09 | |
| Forests | Woodland | 0.29 | 0.65 | 0.34 | 2.15 | 6.43 | 1.91 | 4.63 | 2.62 | 0.20 | 2.38 | 1.05 |
| Shrubs and other woodlands | 0.19 | 0.43 | 0.22 | 1.41 | 4.23 | 1.28 | 3.35 | 1.72 | 0.13 | 1.57 | 0.69 | |
| Grassland | Low-, medium-, and high-coverage grasslands | 0.23 | 0.34 | 0.19 | 1.21 | 3.19 | 1.05 | 2.34 | 1.47 | 0.11 | 1.34 | 0.59 |
| Wetland | River channels, beach land, mudflats, and swampy land | 0.51 | 0.50 | 2.59 | 1.90 | 3.60 | 3.60 | 24.23 | 2.31 | 0.18 | 7.87 | 4.73 |
| Unutilized land | Saline-alkali land, bare land, and bare rocky ground | 0.00 | 0.00 | 0.00 | 0.02 | 0.00 | 0.10 | 0.03 | 0.02 | 0.00 | 0.02 | 0.01 |
| Water area | Lakes, reservoirs, and ponds | 0.80 | 0.23 | 8.29 | 0.77 | 2.29 | 5.55 | 102.24 | 0.93 | 0.07 | 2.55 | 1.89 |
| Month | March | June | September | December |
|---|---|---|---|---|
| Average latitude of the subsolar point (°) | −1.3 * | 21.2 | 1.9 | −21.2 * |
| Photoperiod in the study area (h) | 11.89 | 13.95 | 12.25 | 10.06 |
| Month | March | June | September | December | Annual Average |
|---|---|---|---|---|---|
| Average primary productivity in 2018 (mg/(m2·d)) | 1263.22 | 2336.69 | 1718.33 | 1365.00 | 1670.81 |
| Average primary productivity in 2010 (mg/(m2·d)) | 1182.12 | 2417.68 | 1882.01 | 1519.86 | 1750.42 |
| Pollutant Type | Grade 1 (10,000 Tons) | Grade 2 (10,000 Tons) | Grade 3 (10,000 Tons) | Grade 4 (10,000 Tons) | Total Mass (10,000 Tons) | Unit Cost of Treatment (Yuan/t) | Total Value (100 Million Yuan) |
|---|---|---|---|---|---|---|---|
| Chemical oxygen demand | 597.81 | 1176.20 | 136.64 | 42.70 | 1953.35 | 4300 | 839.94 |
| Petroleum hydro- carbons | 149.45 | 196.03 | 10.25 | 4.27 | 360.00 | 7000 | 252.00 |
| Total value (100 million yuan) | 1091.94 | ||||||
| Year | Exchange Rate (Yuan) | Resource Supply (100 Million Yuan) | Disturbance Regulation (100 Million Yuan) | Biological Control (100 Million Yuan) | Material Circulation (100 Million Yuan) | Habitat Provision (100 Million Yuan) | Scientific Research Services (100 Million Yuan) |
|---|---|---|---|---|---|---|---|
| 2018 | 6.73 | 70.06 | 104.50 | 46.31 | 140.12 | 9.50 | 90.25 |
| 2010 | 6.82 | 71.00 | 105.90 | 46.93 | 142.01 | 9.63 | 91.46 |
| Major Category | Subcategory | Farmland | Forests | Grassland | Wetland | Water Area | Unutilized Land | Total Value | Proportion (%) | |
|---|---|---|---|---|---|---|---|---|---|---|
| Provisioning services | Food production | 182.74 | 2.03 | 0.67 | 6.23 | 21.09 | 0.00 | 212.77 | 4.45 | 5.96 |
| Raw material production | 36.49 | 4.63 | 0.99 | 6.11 | 6.06 | 0.00 | 54.28 | 1.14 | ||
| Water supply | −235.30 | 2.38 | 0.55 | 31.64 | 218.57 | 0.00 | 17.83 | 0.37 | ||
| Regulating services | Gas regulation | 147.46 | 15.22 | 3.47 | 23.21 | 20.30 | 0.00 | 209.66 | 4.39 | 83.11 |
| Climate regulation | 76.86 | 45.58 | 9.18 | 43.97 | 60.38 | 0.00 | 235.97 | 4.94 | ||
| Environmental purification | 22.40 | 13.58 | 3.03 | 43.97 | 146.33 | 0.02 | 229.33 | 4.80 | ||
| Hydrological regulation | 263.99 | 33.56 | 6.72 | 295.97 | 2695.62 | 0.01 | 3295.87 | 68.98 | ||
| Supporting services | Soil conservation | 74.00 | 18.57 | 4.23 | 28.22 | 24.52 | 0.00 | 149.54 | 3.13 | 8.23 |
| Nutrient circulation maintenance | 25.62 | 1.40 | 0.33 | 2.20 | 1.85 | 0.00 | 31.39 | 0.66 | ||
| Biodiversity maintenance | 28.13 | 16.90 | 3.85 | 96.13 | 67.23 | 0.00 | 212.25 | 4.44 | ||
| Cultural services | Landscape aesthetics | 12.36 | 7.43 | 1.70 | 57.78 | 49.83 | 0.00 | 129.10 | 2.70 | 2.70 |
| Total value | 634.73 | 161.32 | 34.69 | 635.42 | 3311.78 | 0.04 | 4777.98 | 100.00 | ||
| Proportion (%) | 13.28 | 3.38 | 0.73 | 13.30 | 69.31 | 0.00 | 100.00 | / | ||
| Major Category | Subcategory | Farmland | Forests | Grassland | Wetland | Water Area | Unutilized Land | Total Value | Proportion (%) | |
|---|---|---|---|---|---|---|---|---|---|---|
| Provisioning services | Food production | 142.99 | 1.55 | 0.58 | 4.62 | 13.50 | 0.00 | 163.26 | 5.06 | 5.19 |
| Raw material production | 25.34 | 3.52 | 0.86 | 4.53 | 3.88 | 0.00 | 38.14 | 1.18 | ||
| Water supply | −199.68 | 1.82 | 0.48 | 23.49 | 139.96 | 0.00 | −33.94 | −1.05 | ||
| Regulating services | Gas regulation | 115.61 | 11.58 | 3.01 | 17.23 | 13.00 | 0.00 | 160.44 | 4.97 | 83.31 |
| Climate regulation | 60.11 | 34.71 | 7.96 | 32.65 | 38.66 | 0.00 | 174.09 | 5.39 | ||
| Environmental purification | 17.59 | 10.35 | 2.63 | 32.65 | 93.70 | 0.00 | 156.91 | 4.86 | ||
| Hydrological regulation | 219.94 | 25.67 | 5.84 | 219.77 | 1726.06 | 0.00 | 2197.27 | 68.08 | ||
| Supporting services | Soil conservation | 48.33 | 14.13 | 3.67 | 20.95 | 15.70 | 0.00 | 102.79 | 3.18 | 8.54 |
| Nutrient circulation maintenance | 20.04 | 1.07 | 0.28 | 1.63 | 1.18 | 0.00 | 20.04 | 0.62 | ||
| Biodiversity maintenance | 22.02 | 12.87 | 3.34 | 71.38 | 43.05 | 0.00 | 152.67 | 4.73 | ||
| Cultural services | Landscape aesthetics | 9.64 | 5.66 | 1.48 | 42.90 | 31.91 | 0.00 | 91.57 | 2.84 | 2.84 |
| Total value | 481.91 | 122.94 | 30.11 | 471.84 | 2120.60 | 0.01 | 3227.40 | 100.00 | ||
| Proportion (%) | 14.93 | 3.81 | 0.93 | 14.62 | 65.71 | 0.00 | 100.00 | / | ||
| Category | Provisioning Services | Regulating Services | Supporting Services | Cultural Services | Total Value | Proportion (%) |
|---|---|---|---|---|---|---|
| Farmland | 15.28 | 97.47 | 37.36 | 2.72 | 152.83 | 9.86 |
| Forests | 2.17 | 25.65 | 8.80 | 1.77 | 38.38 | 2.48 |
| Grassland | 0.30 | 2.96 | 1.11 | 0.22 | 4.58 | 0.30 |
| Wetland | 11.32 | 104.80 | 32.58 | 14.88 | 163.58 | 10.55 |
| Water area | 88.39 | 1051.22 | 33.67 | 17.92 | 1191.18 | 76.82 |
| Deserts | 0.00 | 0.02 | 0.01 | 0.00 | 0.03 | 0.00 |
| Total value | 117.43 | 1282.11 | 113.52 | 37.53 | 1550.58 | 100.00 |
| Increase from 2010 (%) | 70.12 | 47.68 | 41.21 | 40.99 | 48.04 | / |
| Proportion of total increase (%) | 7.57 | 82.69 | 7.32 | 2.42 | 100.00 |
| Farmland | Forests | Grassland | Wetland | Water Area | Unutilized Land | Total Value | |
|---|---|---|---|---|---|---|---|
| Area in 2010 | 67,343 | 3387 | 1373 | 4988 | 9284 | 17 | 86,392 |
| Area in 2018 | 62,785 | 3091 | 1122 | 4764 | 10,283 | 74 | 82,119 |
| Area change | −4558 | −296 | −251 | −224 | 999 | 57 | −4273 |
| Prefecture-Level City | Area (km2) | 2018 | 2010 | Change from 2010 to 2018 | ||||||
|---|---|---|---|---|---|---|---|---|---|---|
| Total Value (100 Million Yuan) | Proportion (%) | Value per Unit Area (100 Million Yuan/km2) | Total Value (100 Million Yuan) | Proportion (%) | Value per Unit Area (100 Million Yuan/km2) | Total Value (100 Million Yuan) | Proportion (%) | Value per Unit Area (100 Million Yuan/km2) | ||
| Suzhou | 8629 | 943.47 | 19.75 | 1093.37 | 665.81 | 20.63 | 771.60 | 277.66 | 17.91 | 321.77 |
| Nantong | 9907 | 309.73 | 6.48 | 312.64 | 205.86 | 6.38 | 207.79 | 103.87 | 6.70 | 104.85 |
| Wuxi | 4630 | 350.65 | 7.34 | 757.34 | 245.60 | 7.61 | 530.46 | 105.05 | 6.77 | 226.88 |
| Changzhou | 4356 | 233.77 | 4.89 | 536.67 | 172.02 | 5.33 | 394.91 | 61.75 | 3.98 | 141.76 |
| Zhenjiang | 3847 | 114.07 | 2.39 | 296.53 | 74.60 | 2.31 | 193.91 | 39.47 | 2.55 | 102.62 |
| Nanjing | 6521 | 222.29 | 4.65 | 340.89 | 179.33 | 5.56 | 274.99 | 42.96 | 2.77 | 65.90 |
| Yangzhou | 6592 | 375.01 | 7.85 | 568.89 | 249.99 | 7.75 | 379.23 | 125.02 | 8.06 | 189.66 |
| Taizhou | 5795 | 187.21 | 3.92 | 323.05 | 123.11 | 3.81 | 212.44 | 64.10 | 4.13 | 110.61 |
| Yancheng | 15,971 | 554.48 | 11.60 | 347.18 | 262.99 | 8.15 | 164.67 | 291.49 | 18.80 | 182.51 |
| Huai’an | 9995 | 607.28 | 12.71 | 607.58 | 424.99 | 13.17 | 425.21 | 182.29 | 11.76 | 182.37 |
| Lianyungang | 7335 | 164.79 | 3.45 | 224.66 | 112.73 | 3.49 | 153.70 | 52.06 | 3.36 | 70.96 |
| Suqian | 8524 | 468.49 | 9.81 | 549.61 | 325.29 | 10.08 | 381.62 | 143.20 | 9.24 | 167.99 |
| Xuzhou | 11,064 | 209.99 | 4.39 | 189.8 | 154.09 | 4.77 | 139.28 | 55.90 | 3.61 | 50.52 |
| Total value | 103,166 | 4777.98 | 100.00 | 463.14 | 3227.40 | 100.00 | 312.84 | 1550.58 | 100.00 | 150.30 |
| Major Category of Ecosystem Services | Subcategory | Value of a Subcategory of Services (100 Million Yuan) | Proportion of Total Service Value (%) | Value of a Major Category of Services (100 Million Yuan) | Proportion of the Value of a Major Category of Services (%) |
|---|---|---|---|---|---|
| Provisioning services | Fishing and aquaculture production | 478.39 | 10.39 | 548.45 | 11.91 |
| Genetic resources supply | 70.06 | 1.52 | |||
| Regulating services | Climate regulation | 1006.62 | 21.86 | 3679.33 | 79.91 |
| Air quality regulation | 1080.22 | 23.46 | |||
| Water purification | 1441.68 | 31.31 | |||
| Disturbance regulation | 104.5 | 2.27 | |||
| Biological control | 46.31 | 1.01 | |||
| Supporting services | Material circulation | 140.12 | 3.04 | 149.62 | 3.25 |
| Habitat provision | 9.5 | 0.21 | |||
| Cultural services | Scientific research services | 90.25 | 1.96 | 226.98 | 4.93 |
| Tourism and recreation | 136.73 | 2.97 | |||
| Total value | 4604.38 | 100 | 4604.38 | 100 | |
| Major Category of Ecosystem Services | Subcategory | Value of a Subcategory of Services (100 Million Yuan) | Proportion in Total Service Value (%) | Value of a Major Category of Services (100 Million Yuan) | Proportion of the Value of a Major Category of Services (%) |
|---|---|---|---|---|---|
| Provisioning services | Fishing and aquaculture production | 207.77 | 4.88 | 278.77 | 6.54 |
| Genetic resources supply | 71.00 | 1.67 | |||
| Regulating services | Climate regulation | 947.58 | 22.24 | 3692.75 | 86.68 |
| Air quality regulation | 1133.11 | 26.60 | |||
| Water purification | 1459.23 | 34.25 | |||
| Disturbance regulation | 105.90 | 2.49 | |||
| Biological control | 46.93 | 1.10 | |||
| Supporting services | Material circulation | 142.01 | 3.33 | 151.64 | 3.56 |
| Habitat provision | 9.63 | 0.23 | |||
| Cultural services | Scientific research services | 91.46 | 2.15 | 136.95 | 3.21 |
| Tourism and recreation | 45.49 | 1.07 | |||
| Total value | 4260.11 | 100.00 | 4260.11 | 100.00 | |
| Major Category of Ecosystem Services | Subcategory of Ecosystem Services | Value Change of a Subcategory of Services (100 Million Yuan) | Value Change of a Major Category of Services (100 Million Yuan) |
|---|---|---|---|
| Provisioning services | Fishing and aquaculture production | 270.62 | 269.68 |
| Genetic resources supply | −0.94 | ||
| Regulating services | Climate regulation | 59.04 | −13.42 |
| Air quality regulation | −52.89 | ||
| Water purification | −17.55 | ||
| Disturbance regulation | −1.4 | ||
| Biological control | −0.62 | ||
| Supporting services | Material circulation | −1.89 | −2.02 |
| Habitat provision | −0.13 | ||
| Cultural services | Scientific research services | −1.21 | 90.03 |
| Tourism and recreation | 91.24 | ||
| Total value | 344.27 | 344.27 | |
| Type of Services | Total Value in 2018 (100 Million Yuan) | Proportion (%) | Total Value in 2010 (100 Million Yuan) | Proportion (%) | Value Change from 2010 to 1018 (100 Million Yuan) | Proportion (%) |
|---|---|---|---|---|---|---|
| Provisioning services | 870.33 | 9.28 | 446.23 | 5.96 | 424.1 | 22.33 |
| Regulating services | 7650.15 | 81.54 | 6381.46 | 85.28 | 1268.69 | 66.81 |
| Supporting services | 542.80 | 5.79 | 427.14 | 5.71 | 115.66 | 6.09 |
| Cultural services | 356.08 | 3.80 | 228.52 | 3.05 | 127.56 | 6.72 |
| Total value | 9382.36 | 100.00 | 7483.35 | 100.00 | 1899.01 | 100.00 |
Disclaimer/Publisher’s Note: The statements, opinions and data contained in all publications are solely those of the individual author(s) and contributor(s) and not of MDPI and/or the editor(s). MDPI and/or the editor(s) disclaim responsibility for any injury to people or property resulting from any ideas, methods, instructions or products referred to in the content. |
© 2023 by the authors. Licensee MDPI, Basel, Switzerland. This article is an open access article distributed under the terms and conditions of the Creative Commons Attribution (CC BY) license (https://creativecommons.org/licenses/by/4.0/).
Share and Cite
Li, Y.; Ren, B.; Li, F.; Shi, X.; Jiang, P.; Li, M. Integrated Terrestrial and Marine Ecosystem Services Valuation and Result Variation Trends: A Case Study of Jiangsu Province, China. Land 2023, 12, 1981. https://doi.org/10.3390/land12111981
Li Y, Ren B, Li F, Shi X, Jiang P, Li M. Integrated Terrestrial and Marine Ecosystem Services Valuation and Result Variation Trends: A Case Study of Jiangsu Province, China. Land. 2023; 12(11):1981. https://doi.org/10.3390/land12111981
Chicago/Turabian StyleLi, Yan, Bin Ren, Feixue Li, Xinjie Shi, Penghui Jiang, and Manchun Li. 2023. "Integrated Terrestrial and Marine Ecosystem Services Valuation and Result Variation Trends: A Case Study of Jiangsu Province, China" Land 12, no. 11: 1981. https://doi.org/10.3390/land12111981
APA StyleLi, Y., Ren, B., Li, F., Shi, X., Jiang, P., & Li, M. (2023). Integrated Terrestrial and Marine Ecosystem Services Valuation and Result Variation Trends: A Case Study of Jiangsu Province, China. Land, 12(11), 1981. https://doi.org/10.3390/land12111981


