
Comparisons of Built Environment Correlates of Walking in Urban and Suburban Campuses: A Case Study of Tianjin, China

Abstract
:1. Introduction
2. Literature Review
3. Method
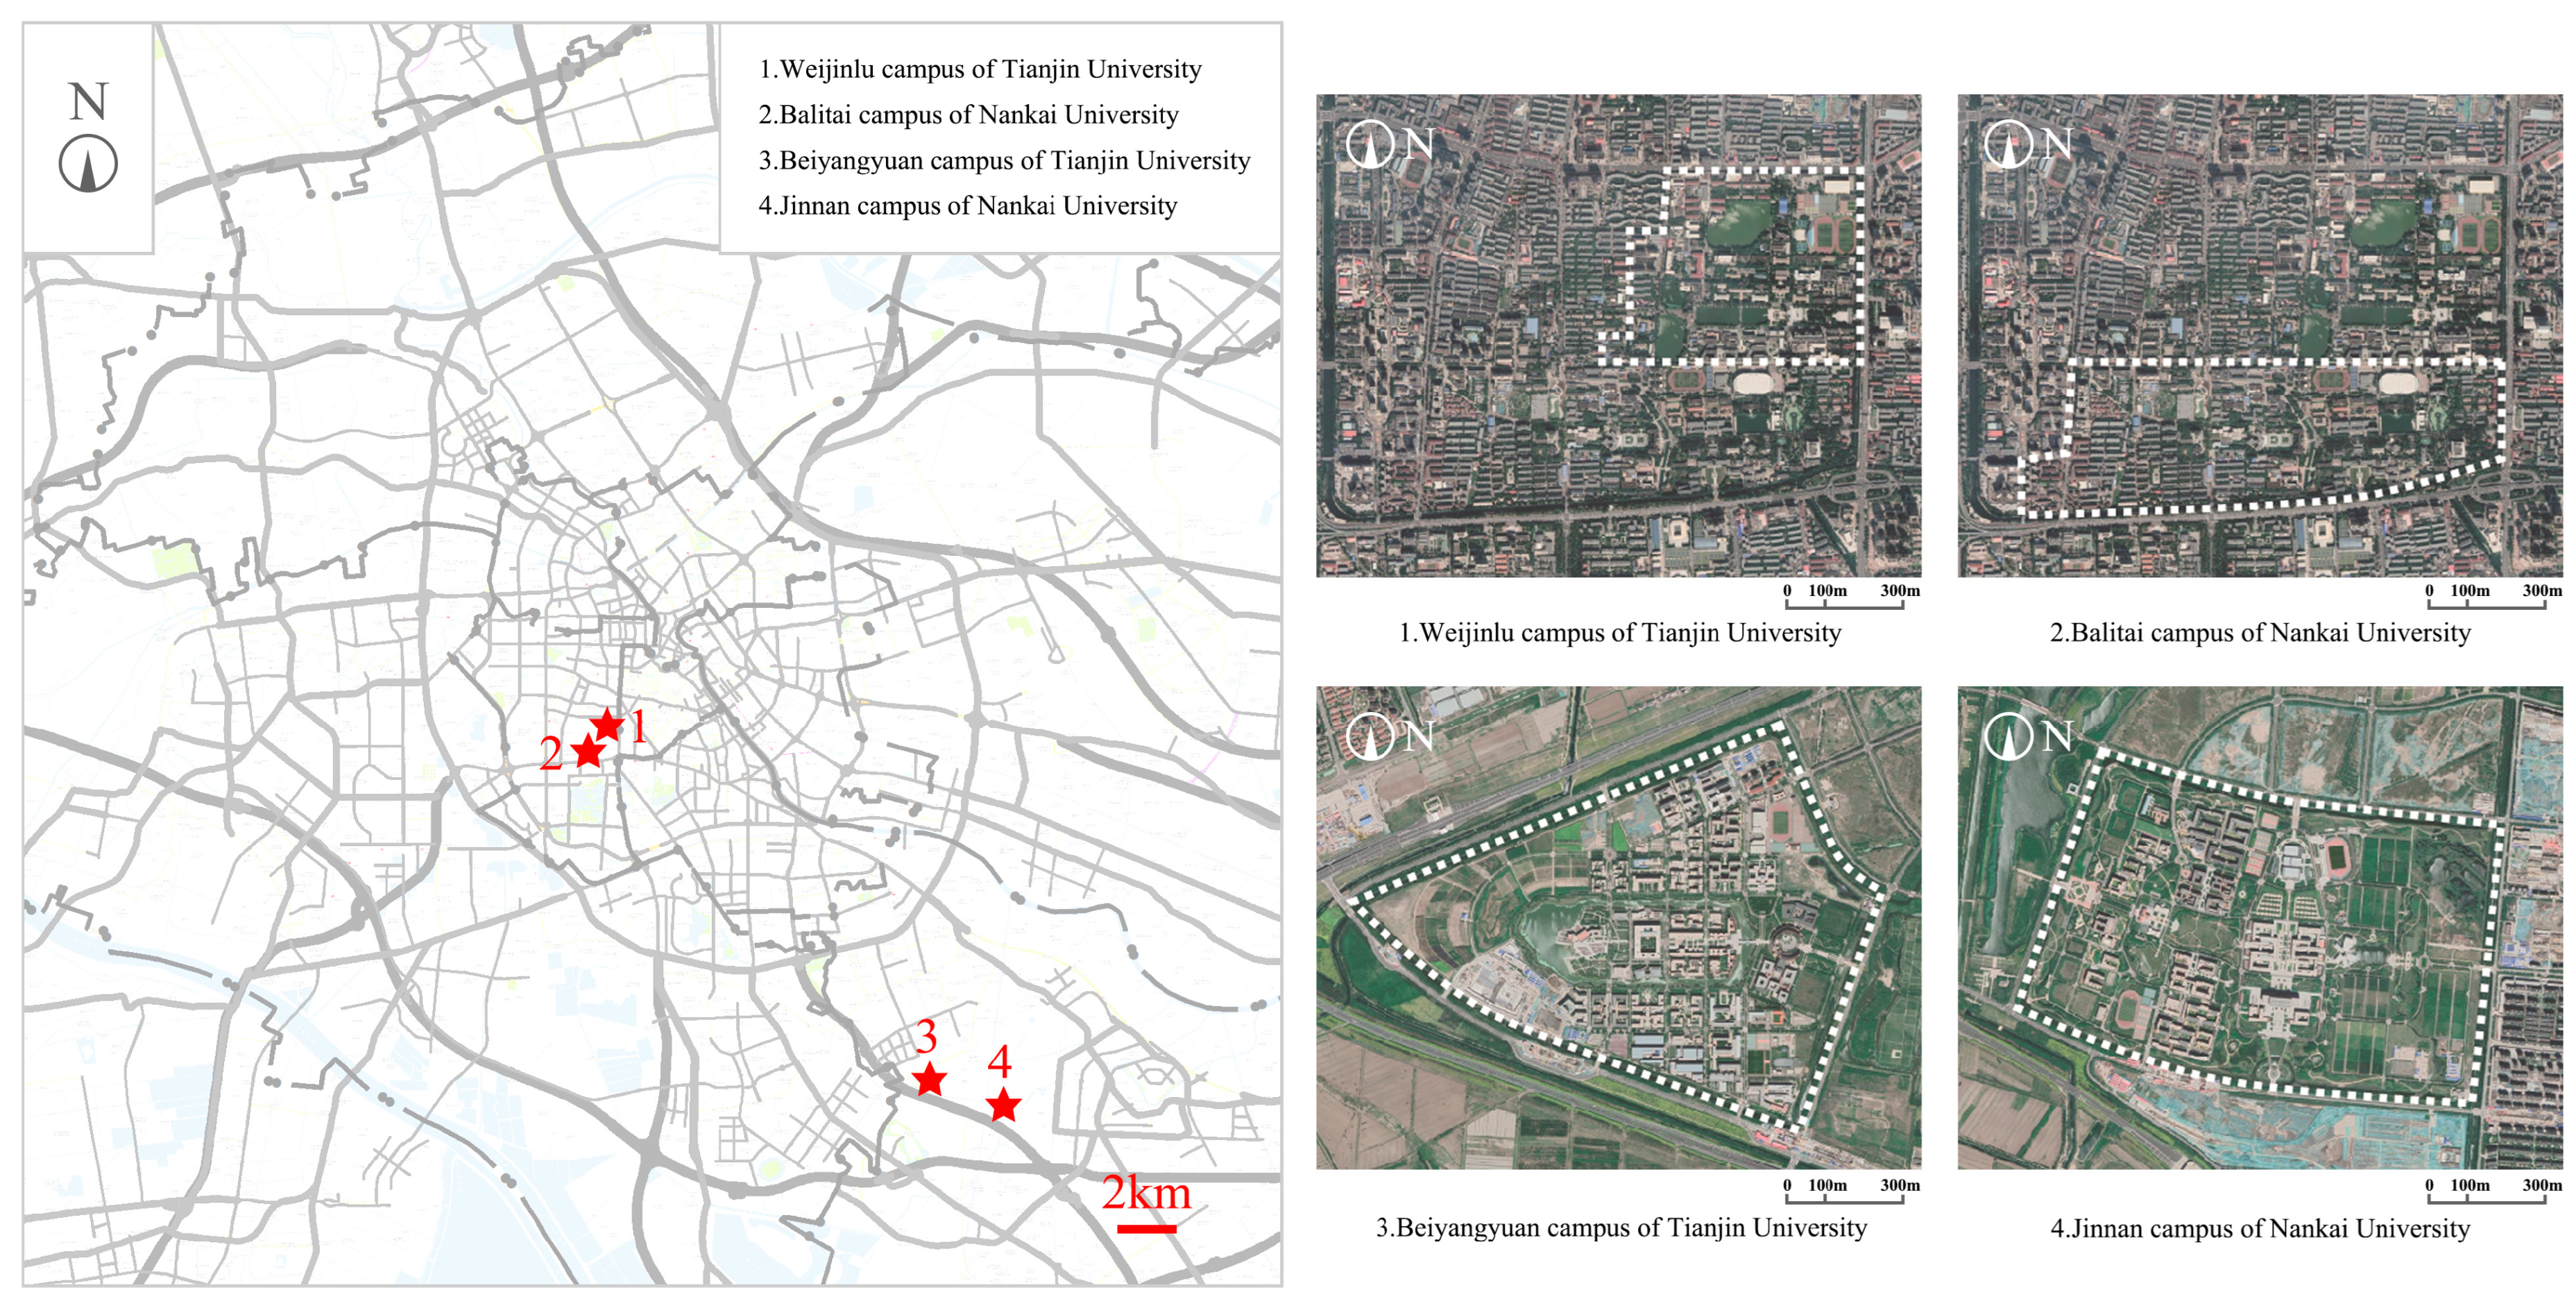
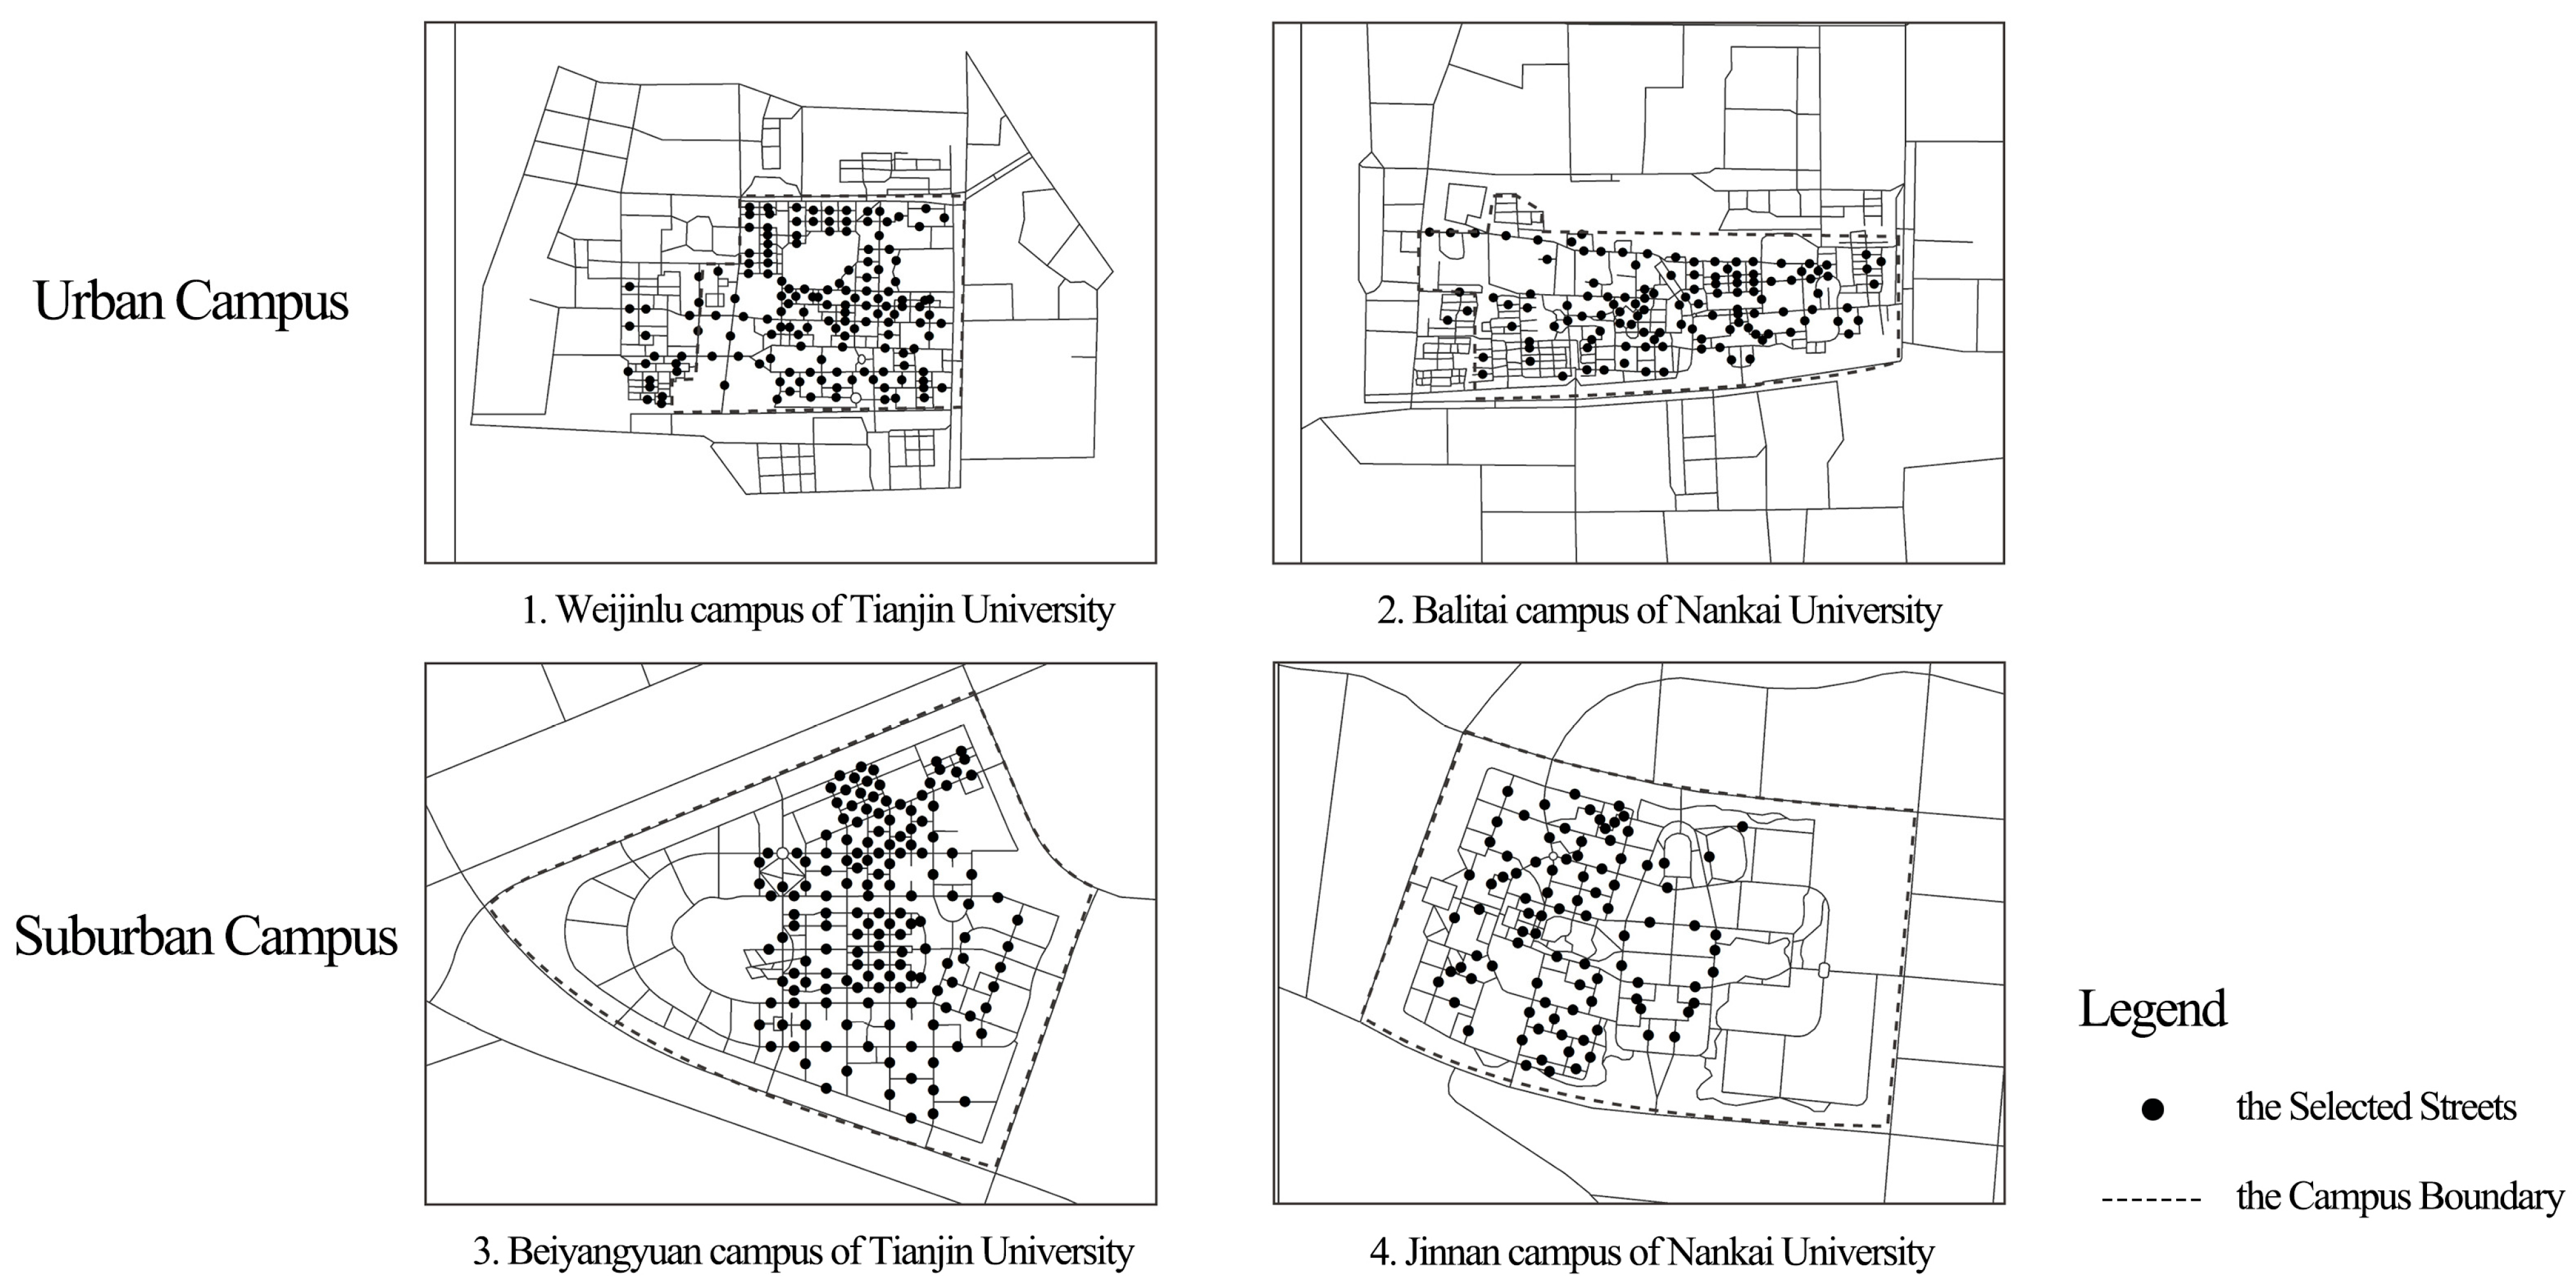
3.1. Study Area
3.2. Independent Variable
3.2.1. Destination Accessibility
3.2.2. Land Use
3.2.3. Street Connectivity
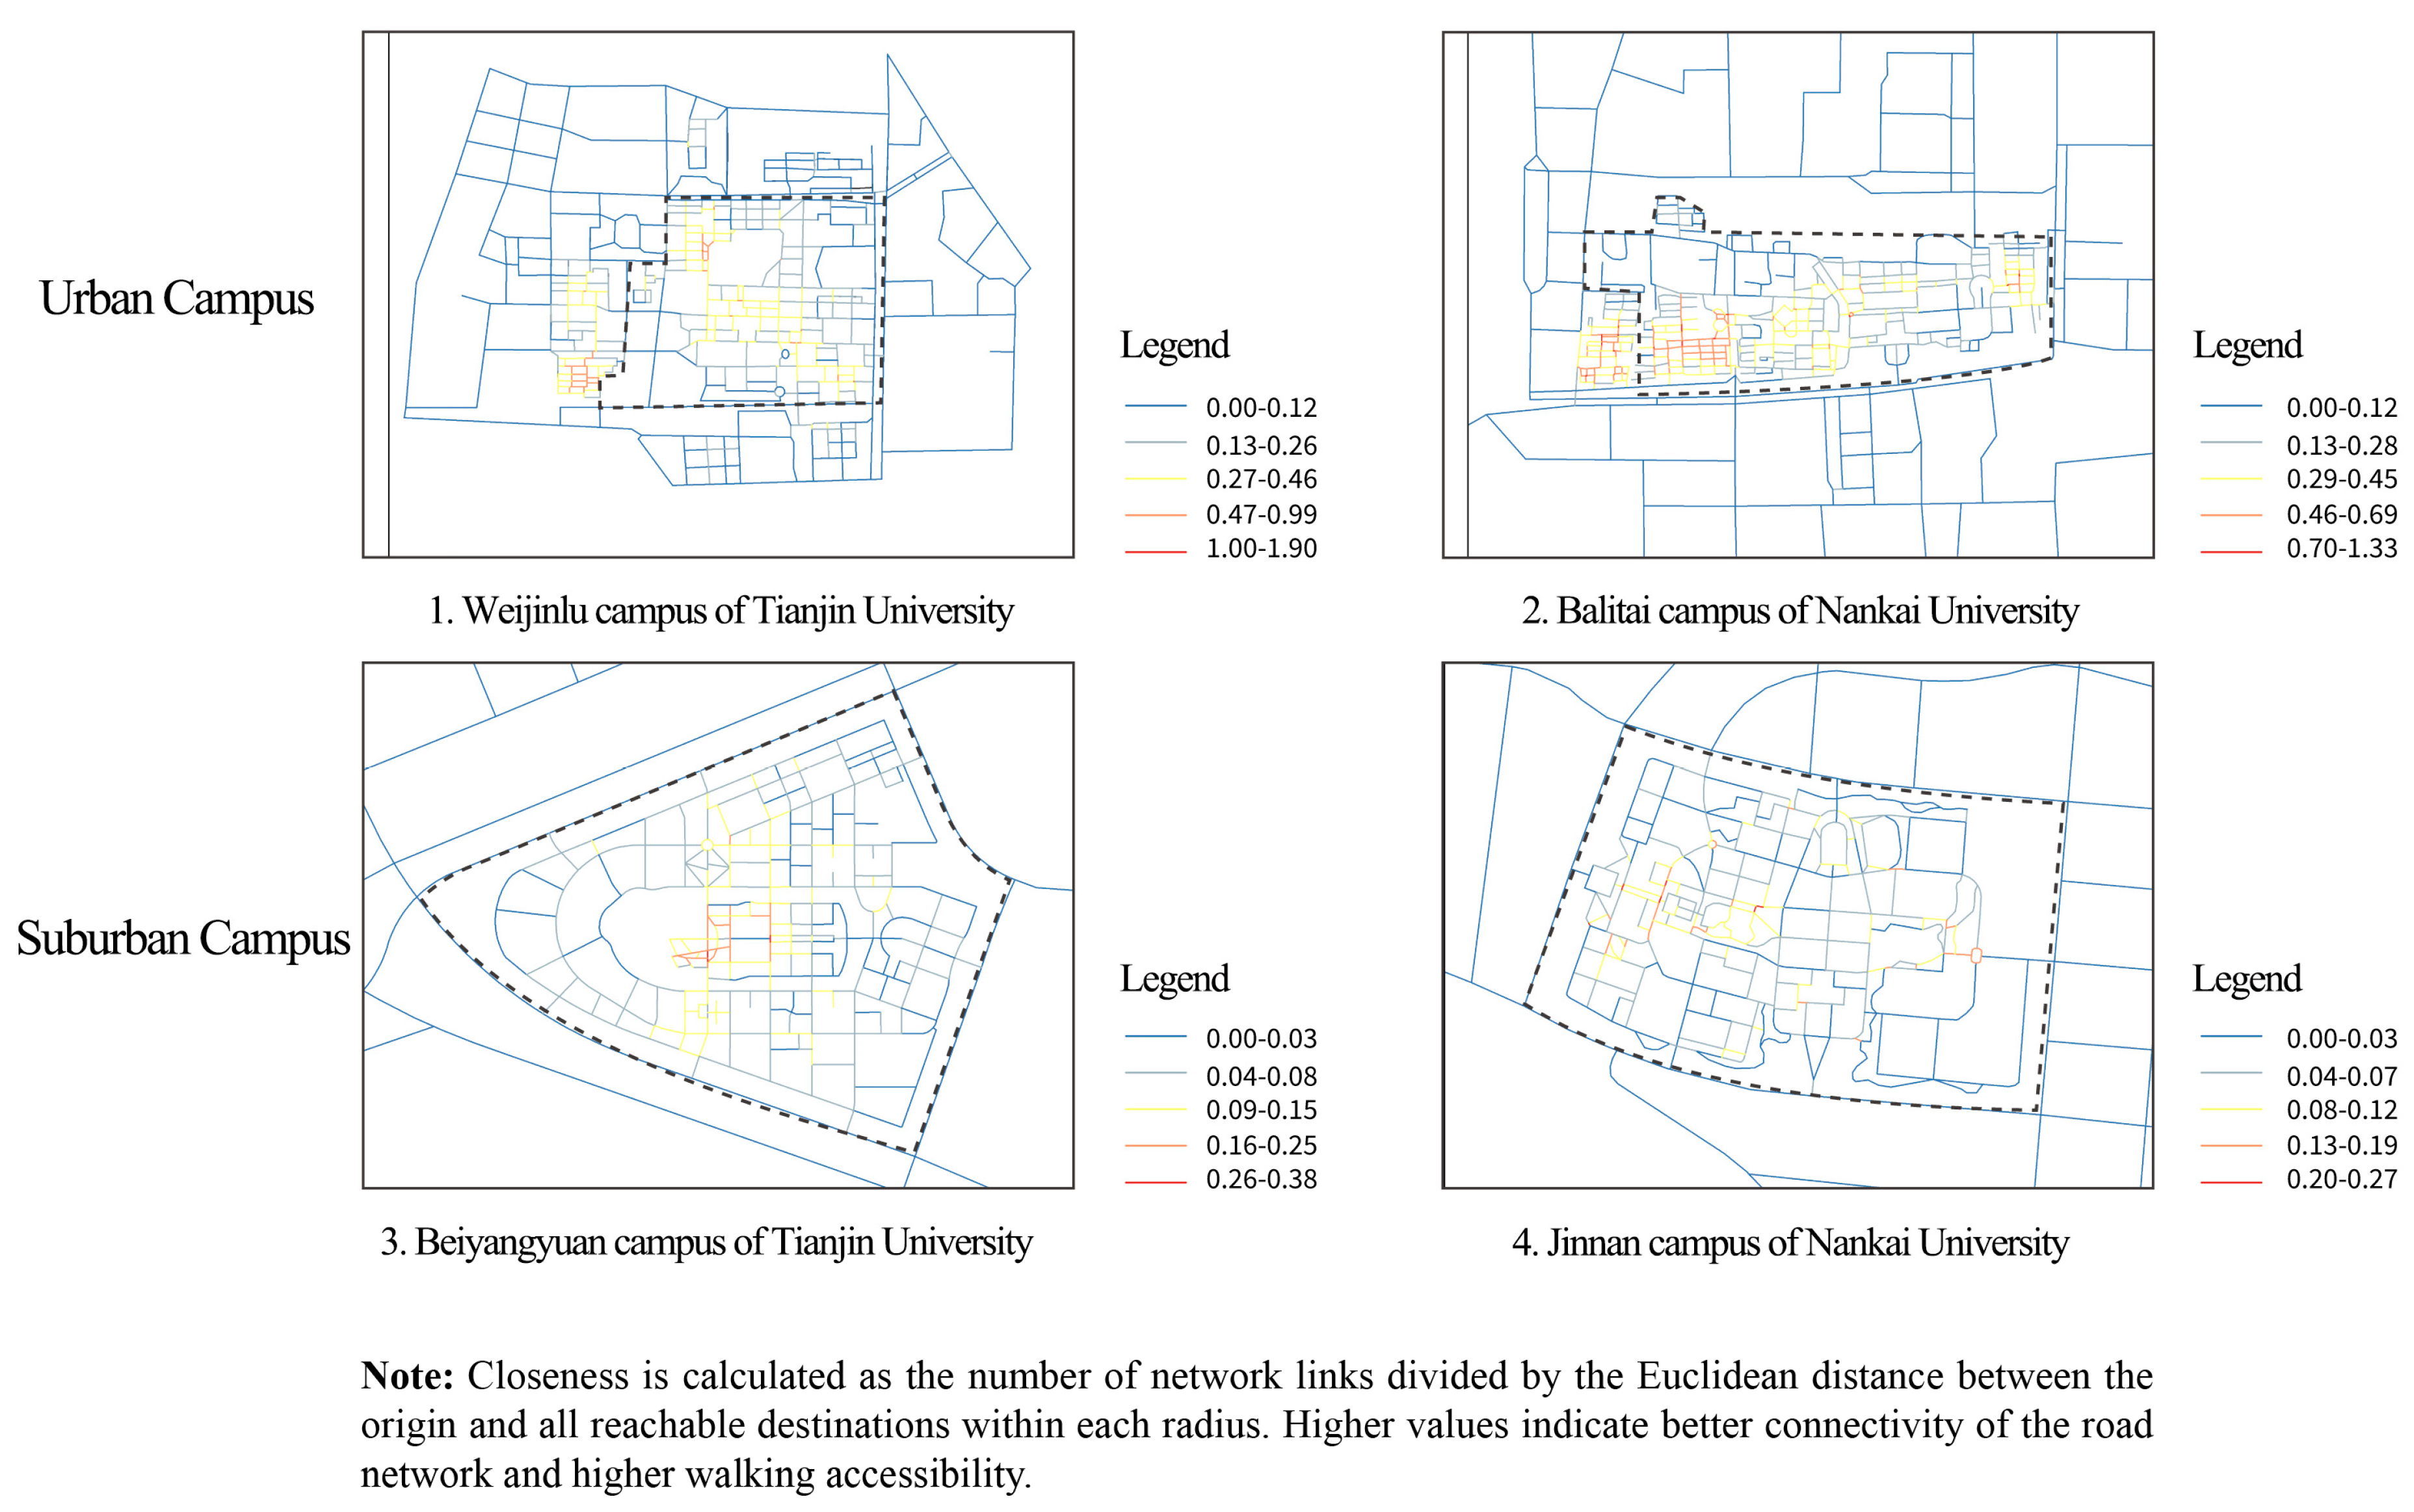
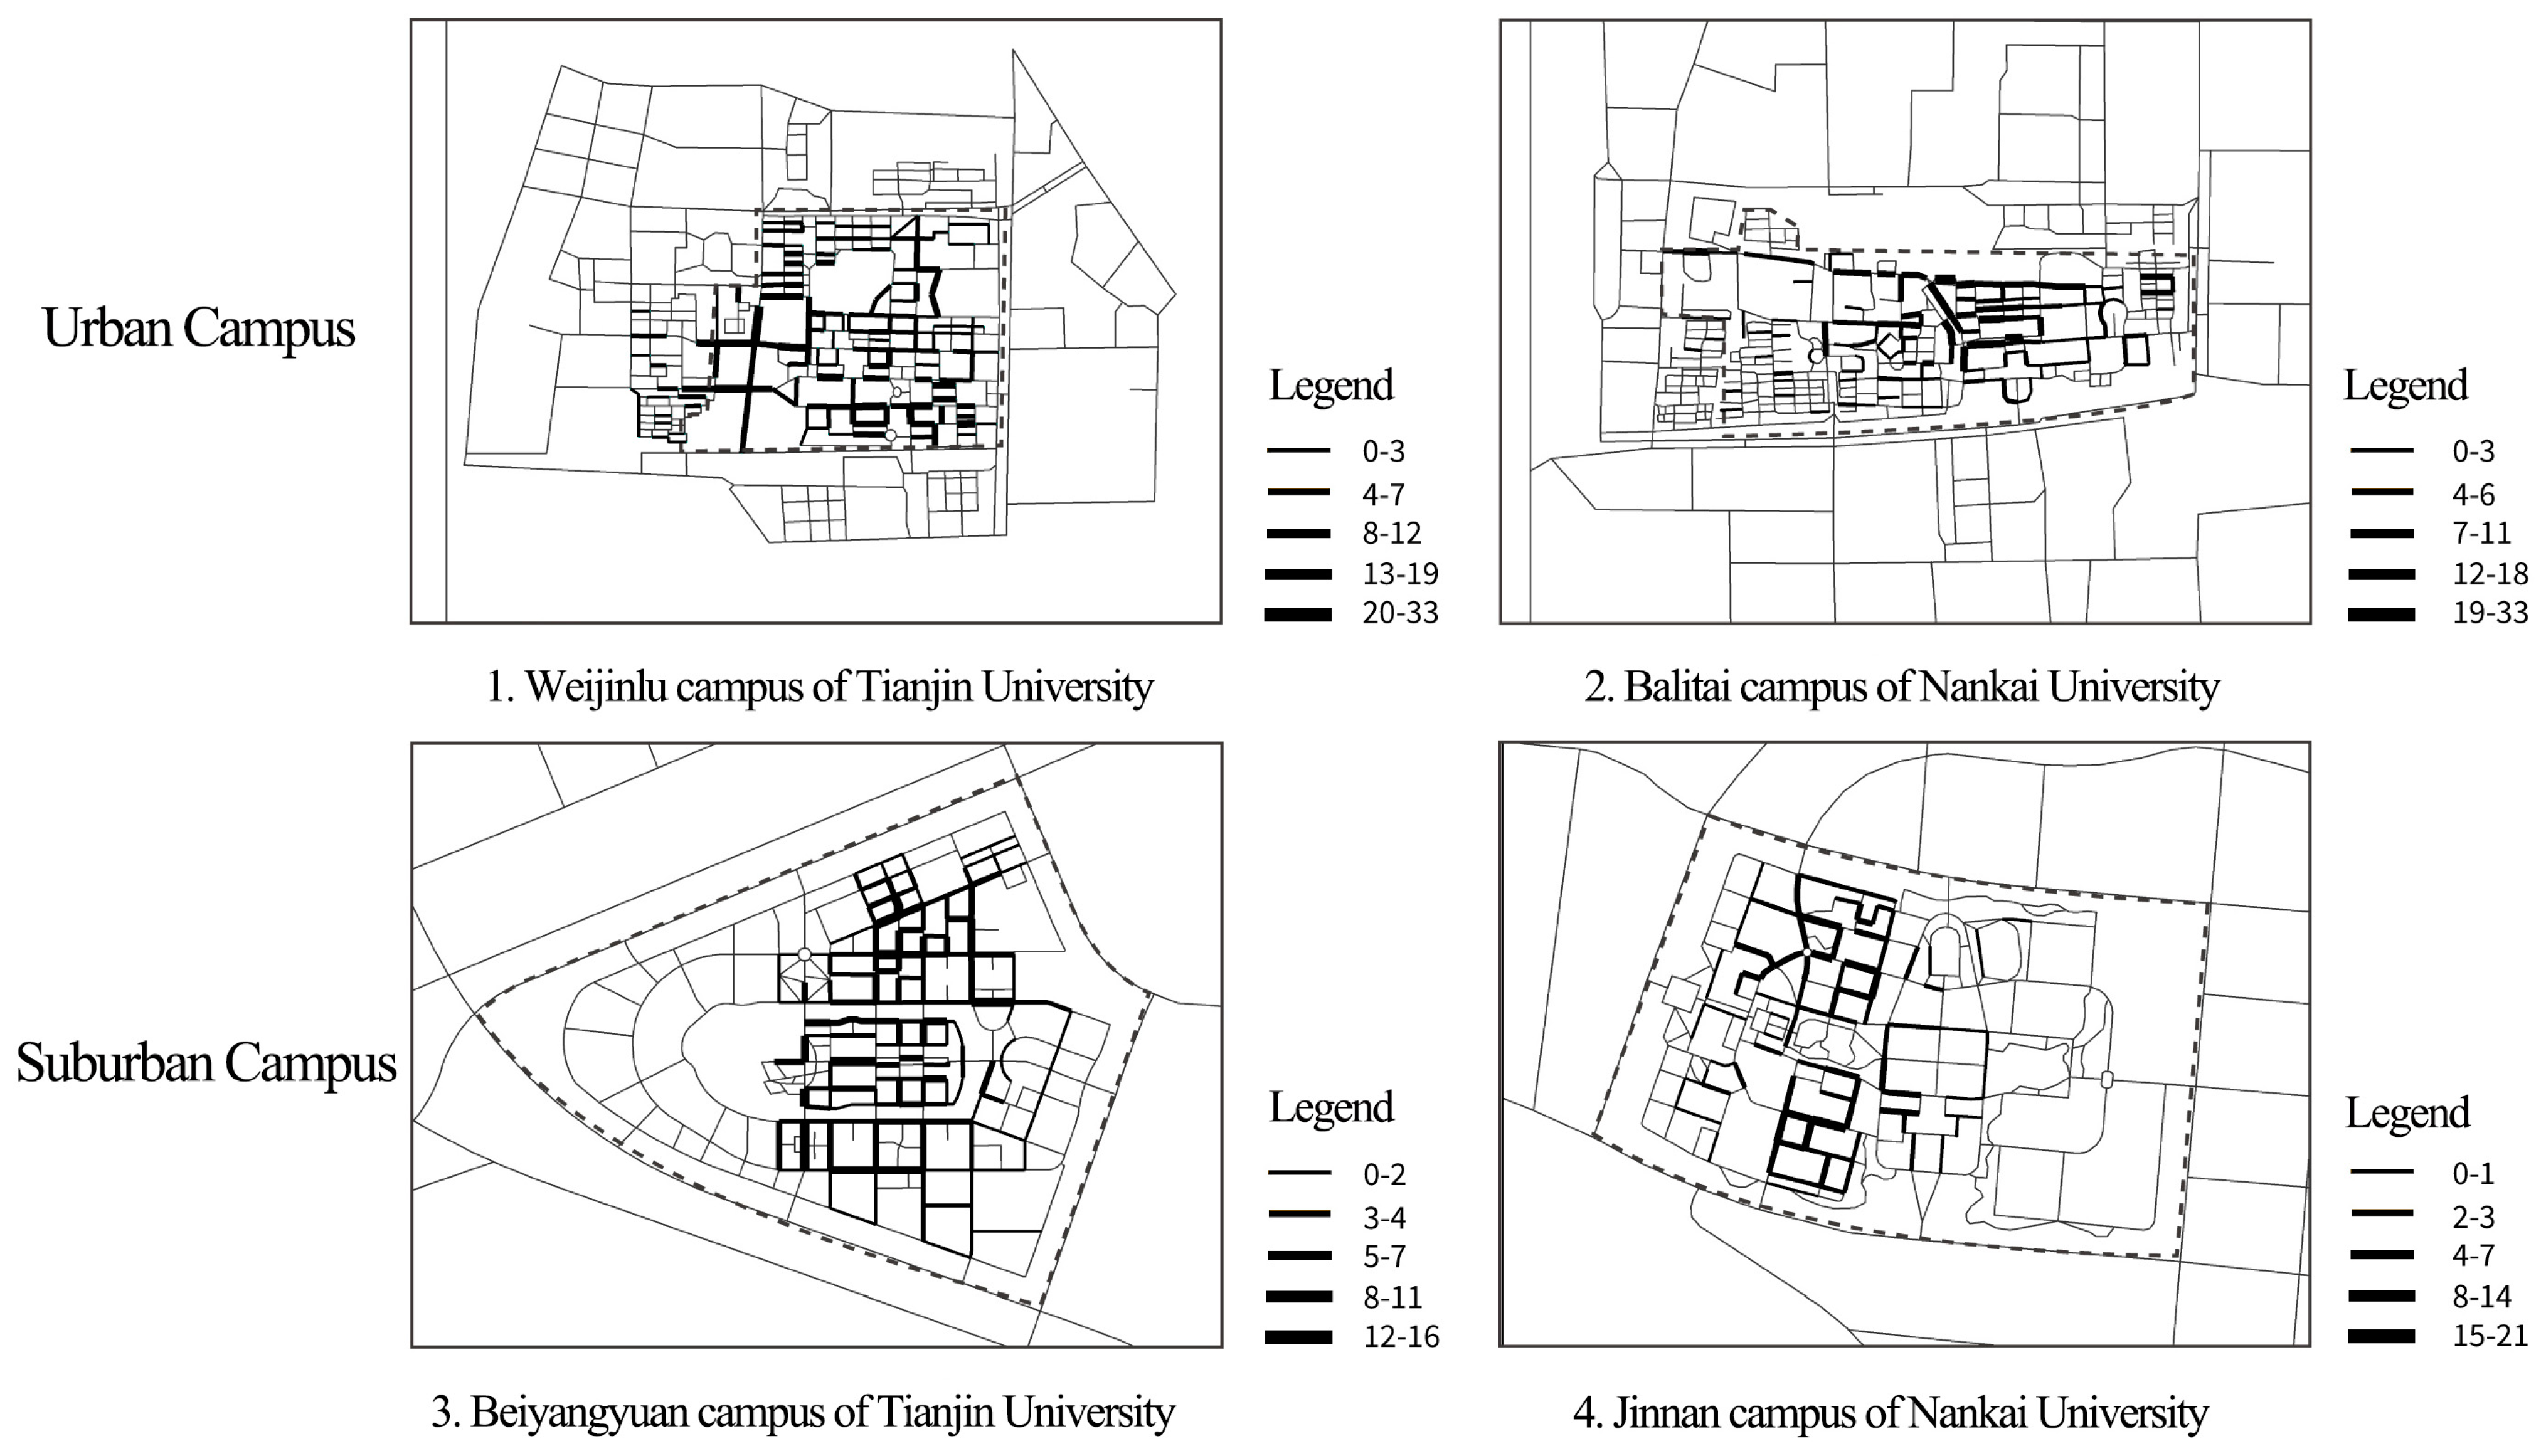
3.2.4. Spatial Configuration
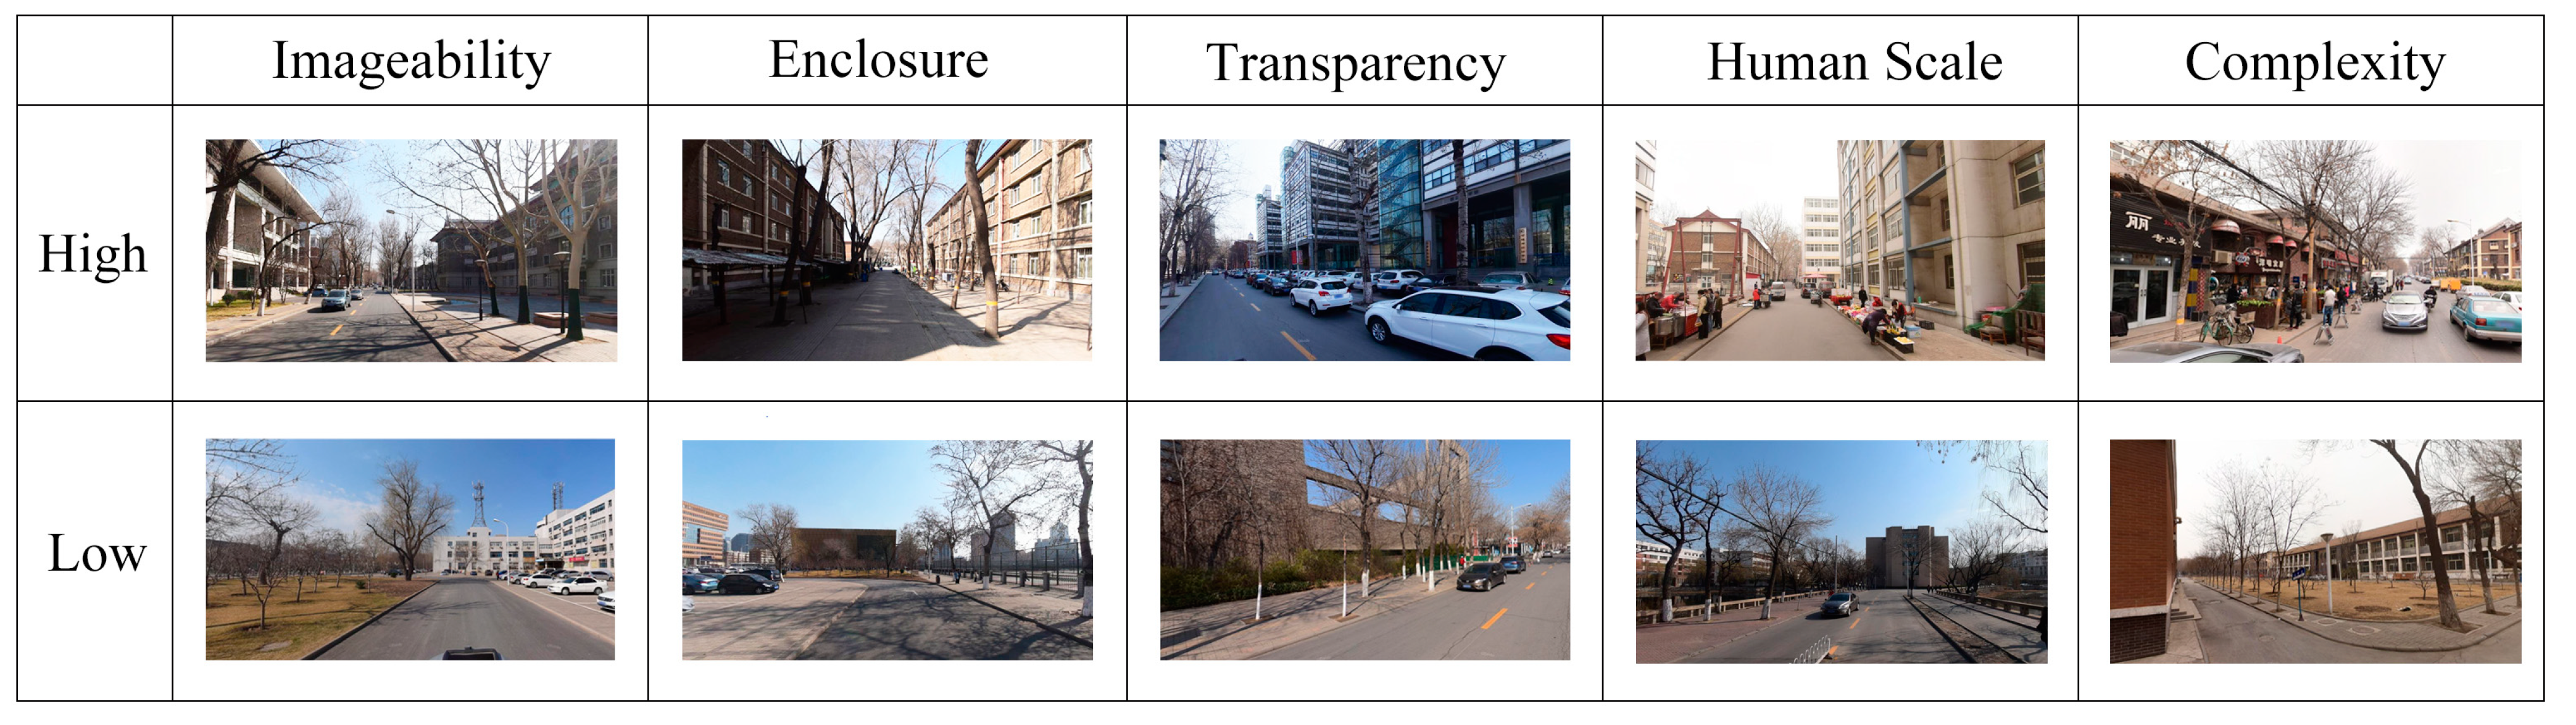
3.2.5. Environmental Quality
3.2.6. Pedestrian Facility
3.3. Dependent Variable
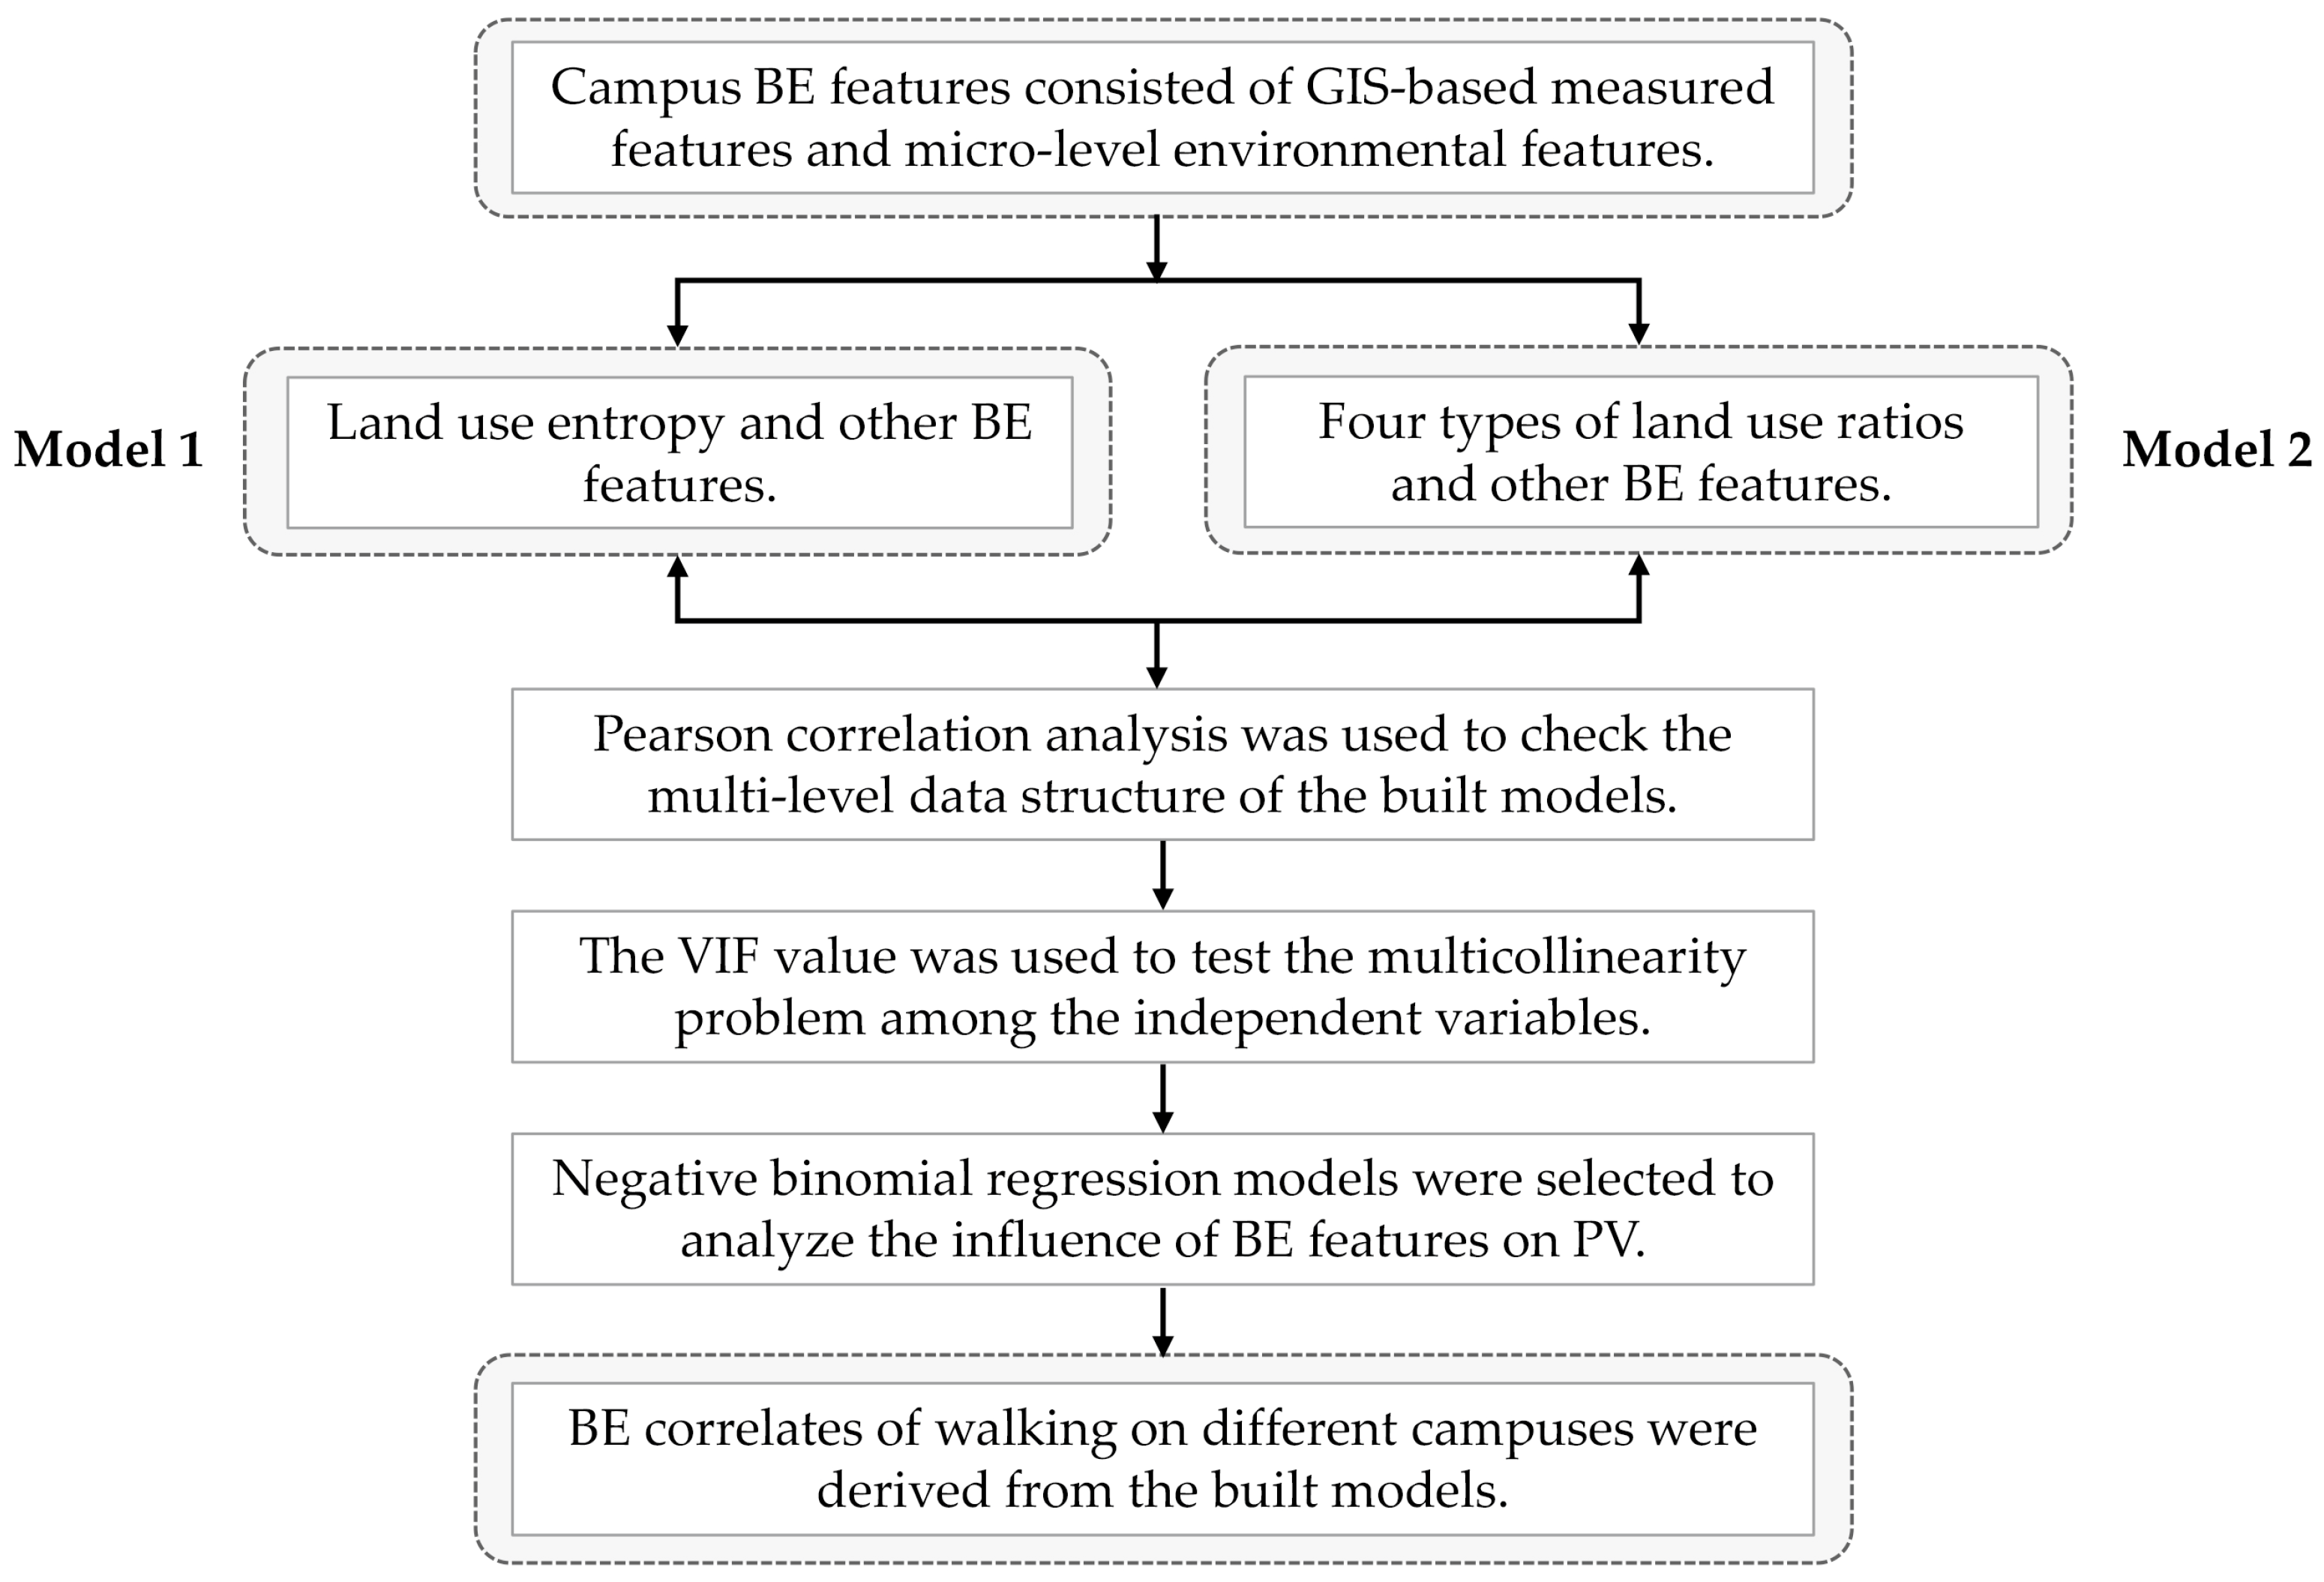
3.4. Data Analysis
4. Results
5. Discussion
6. Conclusions
Author Contributions
Funding
Data Availability Statement
Conflicts of Interest
Appendix A

References
- Wang, X.; Vallance, P. The engagement of higher education in regional development in China. Environ. Plan. C 2015, 33, 1657–1678. [Google Scholar] [CrossRef]
- Zhong, R.; Zhao, W.; Zou, Y.; Mason, R.J. University campuses and housing markets: Evidence from Nanjing. Prof. Geogr. 2018, 70, 175–185. [Google Scholar] [CrossRef]
- Bopp, M.; Wilson, O.W.; Elliott, L.D.; Holland, K.E.; Duffey, M. The Role of The Physical and Social Environment for Physical Activity for College Students During the COVID-19 Pandemic. Build. Health Acad. Communities J. 2021, 5, 13–30. [Google Scholar] [CrossRef]
- Hajrasouliha, A. Connecting the Dots: Campus Form, Student Perceptions, and Academic Performance. Focus 2019, 15, 12. [Google Scholar]
- Hipp, J.A.; Gulwadi, G.B.; Alves, S.; Sequeira, S. The Relationship between perceived greenness and perceived restorativeness of university campuses and student-reported quality of life. Environ. Behav. 2016, 48, 1292–1308. [Google Scholar] [CrossRef]
- Stevenson, M.; Thompson, J.; de Sá, T.H.; Ewing, R.; Mohan, D.; McClure, R.; Roberts, I.; Tiwari, G.; Giles-Corti, B.; Sun, X.; et al. Land use, transport, and population health: Estimating the health benefits of compact cities. Lancet 2016, 388, 2925–2935. [Google Scholar] [CrossRef] [PubMed]
- Giles-Corti, B.; Vernez-Moudon, A.; Reis, R.; Turrell, G.; Dannenberg, A.L.; Badland, H.; Foster, S.; Lowe, M.; Sallis, J.F.; Stevenson, M.; et al. City planning and population health: A global challenge. Lancet 2016, 388, 2912–2924. [Google Scholar] [CrossRef]
- Ewing, R.; Cervero, R. Travel and the built environment: A meta-analysis. J. Am. Plann. Assoc. 2010, 76, 265–294. [Google Scholar] [CrossRef]
- Moudon, A.V.; Lee, C.; Cheadle, A.D.; Garvin, C.; Johnson, D.B.; Schmid, T.L.; Weathers, R.D. Attributes of environments supporting walking. Am. J. Health Promot. 2007, 21, 448–459. [Google Scholar] [CrossRef]
- Sallis, J.F.; Cervero, R.B.; Ascher, W.; Henderson, K.A.; Kraft, M.K.; Kerr, J. An ecological approach to creating active living communities. Annu. Rev. Public Health 2006, 27, 297–322. [Google Scholar] [CrossRef]
- Kang, C.D. The S+ 5Ds: Spatial access to pedestrian environments and walking in Seoul, Korea. Cities 2018, 77, 130–141. [Google Scholar] [CrossRef]
- Lee, S.; Yoo, C.; Seo, K.W. Determinant factors of pedestrian volume in different land-use zones: Combining space syntax metrics with GIS-based built-environment measures. Sustainability 2020, 12, 8647. [Google Scholar] [CrossRef]
- Fonseca, F.; Ribeiro, P.J.G.; Conticelli, E.; Jabbari, M.; Papageorgiou, G.; Tondelli, S.; Ramos, R.A.R. Built environment attributes and their influence on walkability. Int. J. Sustain. Transp. 2022, 16, 660–679. [Google Scholar] [CrossRef]
- Wang, H.; Yang, Y. Neighbourhood walkability: A review and bibliometric analysis. Cities 2019, 93, 43–61. [Google Scholar] [CrossRef]
- Frank, L.D.; Sallis, J.F.; Saelens, B.E.; Leary, L.; Cain, K.; Conway, T.L.; Hess, P.M. The development of a walkability index: Application to the Neighborhood Quality of Life Study. Br. J. Sports Med. 2010, 44, 924–933. [Google Scholar] [CrossRef] [PubMed]
- Walk Score 2011. Walk Score Methodology. Available online: https://www.walkscore.com/methodology.shtml (accessed on 7 June 2011).
- Duncan, D.T.; Méline, J.; Kestens, Y.; Day, K.; Elbel, B.; Trasande, L.; Chaix, B. Walk score, transportation mode choice, and walking among French adults: A GPS, accelerometer, and mobility survey study. Int. J. Environ. Res. Public Health 2016, 13, 611. [Google Scholar] [CrossRef]
- Twardzik, E.; Judd, S.; Bennett, A.; Hooker, S.; Howard, V.; Hutto, B.; Clarke, P.; Colabianchi, N. Walk Score and objectively measured physical activity within a national cohort. J. Epidemiol. Community Health 2019, 73, 549–556. [Google Scholar] [CrossRef] [PubMed]
- Zhang, Z.; Fisher, T.; Wang, H. Walk Score, Environmental Quality and Walking in a Campus Setting. Land 2023, 12, 732. [Google Scholar] [CrossRef]
- Vale, D.S.; Pereira, M.; Viana, C.M. Different destination, different commuting pattern? Analyzing the influence of the campus location on commuting. J. Transp. Land Use 2018, 11, 1048. [Google Scholar] [CrossRef]
- Sisson, S.B.; McClain, J.J.; Tudor-Locke, C. Campus walkability, pedometer-determined steps, and moderate-to-vigorous physical activity: A comparison of 2 university campuses. J. Am. Coll. Health 2008, 56, 585–592. [Google Scholar] [CrossRef]
- Roemmich, J.N.; Balantekin, K.N.; Beeler, J.E. Park-like campus settings and physical activity. J. Am. Coll. Health 2015, 63, 68–72. [Google Scholar] [CrossRef] [PubMed]
- Hajrasouliha, A.H. Master-planning the American campus: Goals, actions, and design strategies. Urban Des. Int. 2017, 22, 363–381. [Google Scholar] [CrossRef]
- Lau, S.S.Y.; Gou, Z.; Liu, Y. Healthy campus by open space design: Approaches and guidelines. Front. Archit. Res. 2014, 3, 452–467. [Google Scholar] [CrossRef]
- Thomashow, M. The nine elements of a sustainable campus. Sustainability 2014, 7, 174–175. [Google Scholar] [CrossRef]
- Saelens, B.E.; Handy, S.L. Built environment correlates of walking: A review. Med. Sci. Sport Exer. 2008, 40 (Suppl. S7), S550. [Google Scholar] [CrossRef]
- Singleton, P.A.; Park, K.; Lee, D.H. Varying influences of the built environment on daily and hourly pedestrian crossing volumes at signalized intersections estimated from traffic signal controller event data. J. Transp. Geogr. 2021, 93, 103067. [Google Scholar] [CrossRef]
- Hankey, S.; Lindsey, G.; Wang, X.; Borah, J.; Hoff, K.; Utecht, B.; Xu, Z. Estimating use of non-motorized infrastructure: Models of bicycle and pedestrian traffic in Minneapolis, MN. Landsc. Urban Plan. 2012, 107, 307–316. [Google Scholar] [CrossRef]
- Miranda-Moreno, L.F.; Fernandes, D. Modeling of pedestrian activity at signalized intersections: Land use, urban form, weather, and spatiotemporal patterns. Transp. Res. Rec. 2011, 2264, 74–82. [Google Scholar] [CrossRef]
- Chen, L.; Lu, Y.; Ye, Y.; Xiao, Y.; Yang, L. Examining the association between the built environment and pedestrian volume using street view images. Cities 2022, 127, 103734. [Google Scholar] [CrossRef]
- Ewing, R.; Clemente, O. Measuring Urban Design: Metrics for Livable Places; Island Press: Washington, DC, USA, 2013. [Google Scholar]
- Ameli, S.H.; Hamidi, S.; Garfinkel-Castro, A.; Ewing, R. Do better urban design qualities lead to more walking in Salt Lake City, Utah? J. Urban Des. 2015, 20, 393–410. [Google Scholar] [CrossRef]
- Hamidi, S.; Moazzeni, S. Examining the relationship between urban design qualities and walking behavior: Empirical evidence from Dallas, TX. Sustainability 2019, 11, 2720. [Google Scholar] [CrossRef]
- Kang, C.D. Measuring the effects of street network configurations on walking in Seoul, Korea. Cities 2017, 71, 30–40. [Google Scholar] [CrossRef]
- Sung, H.G.; Go, D.H.; Choi, C.G. Evidence of Jacobs’s street life in the great Seoul city: Identifying the association of physical environment with walking activity on streets. Cities 2013, 35, 164–173. [Google Scholar] [CrossRef]
- Lee, S.; Sung, H.; Woo, A. The spatial variations of relationship between built environment and pedestrian volume: Focused on the 2009 Seoul pedestrian flow survey in Korea. J. Asian Arch. Build. 2017, 16, 147–154. [Google Scholar] [CrossRef]
- Park, K.; Ewing, R.; Sabouri, S.; Larsen, J. Street life and the built environment in an auto-oriented US region. Cities 2019, 88, 243–251. [Google Scholar] [CrossRef]
- Jung, H.; Lee, S.-Y.; Kim, H.S.; Lee, J.S. Does improving the physical street environment create satisfactory and active streets? Evidence from Seoul’s Design Street Project. Transp. Res. Part D Transp. Environ. 2017, 50, 269–279. [Google Scholar] [CrossRef]
- Rodríguez, D.A.; Brisson, E.M.; Estupiñán, N. The relationship between segment-level built environment attributes and pedestrian activity around Bogota’s BRT stations. Transp. Res. Part D Transp. Environ. 2009, 14, 470–478. [Google Scholar] [CrossRef]
- Hajrasouliha, A.; Yin, L. The impact of street network connectivity on pedestrian volume. Urban Stud. 2015, 52, 2483–2497. [Google Scholar] [CrossRef]
- Chung, J.; Kim, S.-N.; Kim, H. The Impact of PM10 Levels on Pedestrian Volume: Findings from Streets in Seoul, South Korea. Int. J. Environ. Res. Public Health 2019, 16, 4833. [Google Scholar] [CrossRef]
- Kim, H.; Hong, S. Differences in the Influence of Microclimate on Pedestrian Volume According to Land-Use. Land 2021, 10, 37. [Google Scholar] [CrossRef]
- Zhang, Z.; Fisher, T.; Feng, G. Assessing the rationality and walkability of campus layouts. Sustainability 2020, 12, 10116. [Google Scholar] [CrossRef]
- Mu, T.; Lao, Y. A Study on the Walkability of Zijingang East Campus of Zhejiang University: Based on Network Distance Walk Score. Sustainability 2022, 14, 11108. [Google Scholar] [CrossRef]
- Asadi-Shekari, Z.; Moeinaddini, M.; Shah, M.Z. A pedestrian level of service method for evaluating and promoting walking facilities on campus streets. Land Use Policy 2014, 38, 175–193. [Google Scholar] [CrossRef]
- Horacek, T.M.; White, A.A.; Byrd-Bredbenner, C.; Reznar, M.M.; Olfert, M.D.; Morrell, J.S.; Koenings, M.M.; Brown, O.N.; Shelnutt, K.P.; Kattelmann, K.K.; et al. PACES: A physical activity campus environmental supports audit on university campuses. Am. J. Health Promot. 2014, 28, e104–e117. [Google Scholar] [CrossRef] [PubMed]
- Zhang, X.; Mu, L. The perceived importance and objective measurement of walkability in the built environment rating. Environ. Plan. B Urban Anal. City Sci. 2020, 47, 1655–1671. [Google Scholar] [CrossRef]
- Alhajaj, N.; Daghistani, F. Hybrid method for measuring the accessibility and safety of students’ walking routes in car-dominated campuses. Urban Des. Int. 2021, 26, 53–66. [Google Scholar] [CrossRef]
- Ramakreshnan, L.; Fong, C.S.; Sulaiman, N.M.; Aghamohammadi, N. Motivations and built environment factors associated with campus walkability in the tropical settings. Sci. Total. Environ. 2020, 749, 141457. [Google Scholar] [CrossRef]
- Zhou, J. Carsharing on university campus: Subsidies, commuter benefits, and their impacts on carsharing. Transp. Res. Part D Transp. Environ. 2014, 32, 316–319. [Google Scholar] [CrossRef]
- Zhou, J. Proactive sustainable university transportation: Marginal effects, intrinsic values, and university students’ mode choice. Int. J. Sustain. Transp. 2016, 10, 815–824. [Google Scholar] [CrossRef]
- Bopp, M.; Behrens, T.K.; Velecina, R. Associations of weight status, social factors, and active travel among college students. Am. J. Health Educ. 2014, 45, 358–367. [Google Scholar] [CrossRef]
- Peachey, A.A.; Baller, S.L. Perceived built environment characteristics of on-campus and off-campus neighborhoods associated with physical activity of college students. J. Am. Coll. Health 2015, 63, 337–342. [Google Scholar] [CrossRef]
- Yang, H.; He, D.; Lu, Y.; Ren, C.; Huang, X. Disentangling residential self-selection from the influence of built environment characteristics on adiposity outcomes among undergraduate students in China. Cities 2021, 113, 103165. [Google Scholar] [CrossRef]
- Reed, J.; Ainsworth, B. Perceptions of environmental supports on the physical activity behaviors of university men and women: A preliminary investigation. J. Am. Coll. Health 2007, 56, 199–204. [Google Scholar] [CrossRef] [PubMed]
- Reed, J. Perceptions of the availability of recreational physical activity facilities on a university campus. J. Am. Coll. Health 2007, 55, 189–194. [Google Scholar] [CrossRef] [PubMed]
- Kapinos, K.A.; Yakusheva, O.; Eisenberg, D. Obesogenic environmental influences on young adults: Evidence from college dormitory assignments. Econ. Hum. Biol. 2014, 12, 98–109. [Google Scholar] [CrossRef] [PubMed]
- Kapinos, K.A.; Yakusheva, O. Environmental influences on young adult weight gain: Evidence from a natural experiment. J. Adolesc. Health 2011, 48, 52–58. [Google Scholar] [CrossRef] [PubMed]
- Cooper, C.H.V.; Fone, D.L.; Chiaradia, A.J.F. Measuring the impact of spatial network layout on community social cohesion: A cross-sectional study. Int. J. Health Geogr. 2014, 13, 11. [Google Scholar] [CrossRef]
- McCormack, G.R.; Shiell, A.; Giles-Corti, B.; Begg, S.; Veerman, J.L.; Geelhoed, E.; Amarasinghe, A.; Emery, J.H. The association between sidewalk length and walking for different purposes in established neighborhoods. Int. J. Behav. Nutr. Phys. Act. 2012, 9, 92. [Google Scholar] [CrossRef]
- Ozbil, A.; Gurleyen, T.; Yesiltepe, D.; Zunbuloglu, E. Comparative associations of street network design, streetscape attributes and land-use characteristics on pedestrian flows in peripheral neighborhoods. Int. J. Environ. Res. Public Health 2019, 16, 1846. [Google Scholar] [CrossRef]
- Arnold, H.F. Trees in Urban Design; Wiley: Hoboken, NJ, USA, 1980. [Google Scholar]
- Maxwell, J.A. Designing for ‘Life between Buildings’: Modeling the Relationship between Streetscape Qualities and Pedestrian Activity in Glasgow, Scotland. Ph.D. Thesis, University of Strathclyde, Glasgow, UK, 2016. [Google Scholar]
- Baran, P.K.; Rodríguez, D.A.; Khattak, A.J. Space syntax and walking in a new urbanist and suburban neighbourhoods. J. Urban Des. 2008, 13, 5–28. [Google Scholar] [CrossRef]
- Lee, S.; Lee, C.; Nam, J.W.; Abbey-Lambertz, M.; Mendoza, J.A. School walkability index: Application of environmental audit tool and GIS. J. Transp. Health 2020, 18, 100880. [Google Scholar] [CrossRef] [PubMed]


| University Campus | Location | Land Area/10,000 m2 | Population/10,000 | Construction Period | Number of Selected Streets | Average Length of the Selected Streets/m |
|---|---|---|---|---|---|---|
| WCTU | Downtown | 136 | 1.89 | 1952 | 151 | 83.75 |
| BCNU | Downtown | 121 | 1.90 | 1946 | 121 | 81.17 |
| BCTU | Suburb | 244 | 1.98 | 2015 | 152 | 117.21 |
| JCNU | Suburb | 246 | 1.41 | 2015 | 93 | 112.85 |
| The Type of Facilities | Using Frequency | Weight of Facilities | Comfortable Time (min) | Tolerance Time (min) | Resistance Time (min) |
|---|---|---|---|---|---|
| Canteen and Restaurant | 21 | 47.54 | 6 | 17 | 24 |
| Public Teaching Building | 5.06 | 47.54 | 6 | 17 | 24 |
| Retail Store | 4.31 | 11.46 | 6 | 17 | 24 |
| Gym | 2.08 | 9.76 | 8 | 17 | 24 |
| Library | 2.03 | 4.71 | 7 | 18 | 24 |
| Square and Green Space | 2 | 4.6 | 7 | 18 | 24 |
| Bus Stop | 1.81 | 4.53 | 6 | 17 | 24 |
| Outdoor Stadium | 1.4 | 4.1 | 8 | 17 | 24 |
| Coffee Shop | 1.32 | 3.17 | 7 | 18 | 24 |
| Student Activity Center | 1.07 | 2.98 | 6 | 17 | 24 |
| Bank and Post Office | 0.98 | 2.42 | 7 | 18 | 24 |
| Administrative Building | 0.86 | 2.22 | 6 | 17 | 24 |
| Barber Shop | 0.25 | 1.95 | 7 | 18 | 24 |
| Sum | 44.17 | 100 |
| UDQ | Significant Physical Features | Coefficient | p-Value |
|---|---|---|---|
| Imageability | People (#) | 0.0239 | <0.001 |
| Proportion of historic buildings | 0.97 | <0.001 | |
| Courtyards/plazas/parks (#) | 0.414 | <0.001 | |
| Outdoor dining (yes/no) | 0.644 | <0.001 | |
| Buildings with non-rectangular shapes (#) | 0.0795 | 0.036 | |
| Noise level (rating) | −0.183 | 0.045 | |
| Major landscape features (#) | 0.722 | 0.049 | |
| Buildings with identifiers (#) | 0.111 | 0.083 | |
| Enclosure | Proportion street wall—same side | 0.716 | <0.001 |
| Proportion street wall—opposite side | 0.94 | 0.002 | |
| Proportion sky across | −2.193 | 0.021 | |
| Long sight lines (#) | −0.308 | 0.035 | |
| Proportion sky ahead | −1.418 | 0.055 | |
| Human Scale | Long sight lines (#) | −0.744 | <0.001 |
| All street furniture and other street items (#) | 0.0364 | <0.001 | |
| Proportion first floor with windows | 1.099 | <0.001 | |
| Building height—same side | −0.00304 | 0.033 | |
| Small planters (#) | 0.0496 | 0.047 | |
| Transparency | Proportion of first floor with windows | 1.219 | 0.002 |
| Proportion of active uses | 0.533 | 0.004 | |
| Proportion of street wall—same side | 0.666 | 0.011 | |
| Complexity | People (#) | 0.0268 | <0.001 |
| Buildings (#) | 0.051 | 0.008 | |
| Dominant building colors (#) | 0.177 | 0.031 | |
| Accent colors (#) | 0.108 | 0.043 | |
| Outdoor dining (yes/no) | 0.367 | 0.045 | |
| Public art (#) | 0.272 | 0.066 |
| The Evaluation of Sidewalk Quality | |||
|---|---|---|---|
| 0—No sidewalk | 1—Poor quality | 2—Moderate quality | 3—Good quality |
| There are no sidewalks on the street, and the street is entirely occupied by motorways or parking areas. | The sidewalk is of poor quality, with protrusions and litter on it. It is also in disrepair. Pedestrians always have a poor walking experience when walking on them. | Sidewalks are moderately wide and neat and have fewer breaks or protrusions. People will perceive a moderate walking experience when walking on them. | Sidewalks have appropriate width and good cleanliness, utilizing materials with smooth interfaces, such as concrete, and without street litter, bumps, and other barriers affecting pedestrian’s walking comfort. |
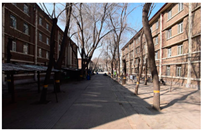 | 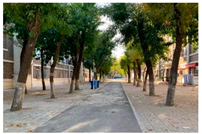 | 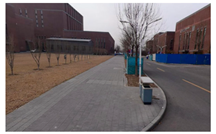 | 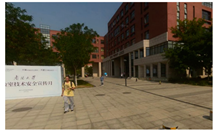 |
| The four pictures show examples of different levels of sidewalk quality. | |||
| Variables | Max | Min | Mean | SD |
|---|---|---|---|---|
| PV | 33.00 (21.00) | 0.00 (0.00) | 5.53 (3.78) | 4.59 (3.21) |
| Destination Accessibility | ||||
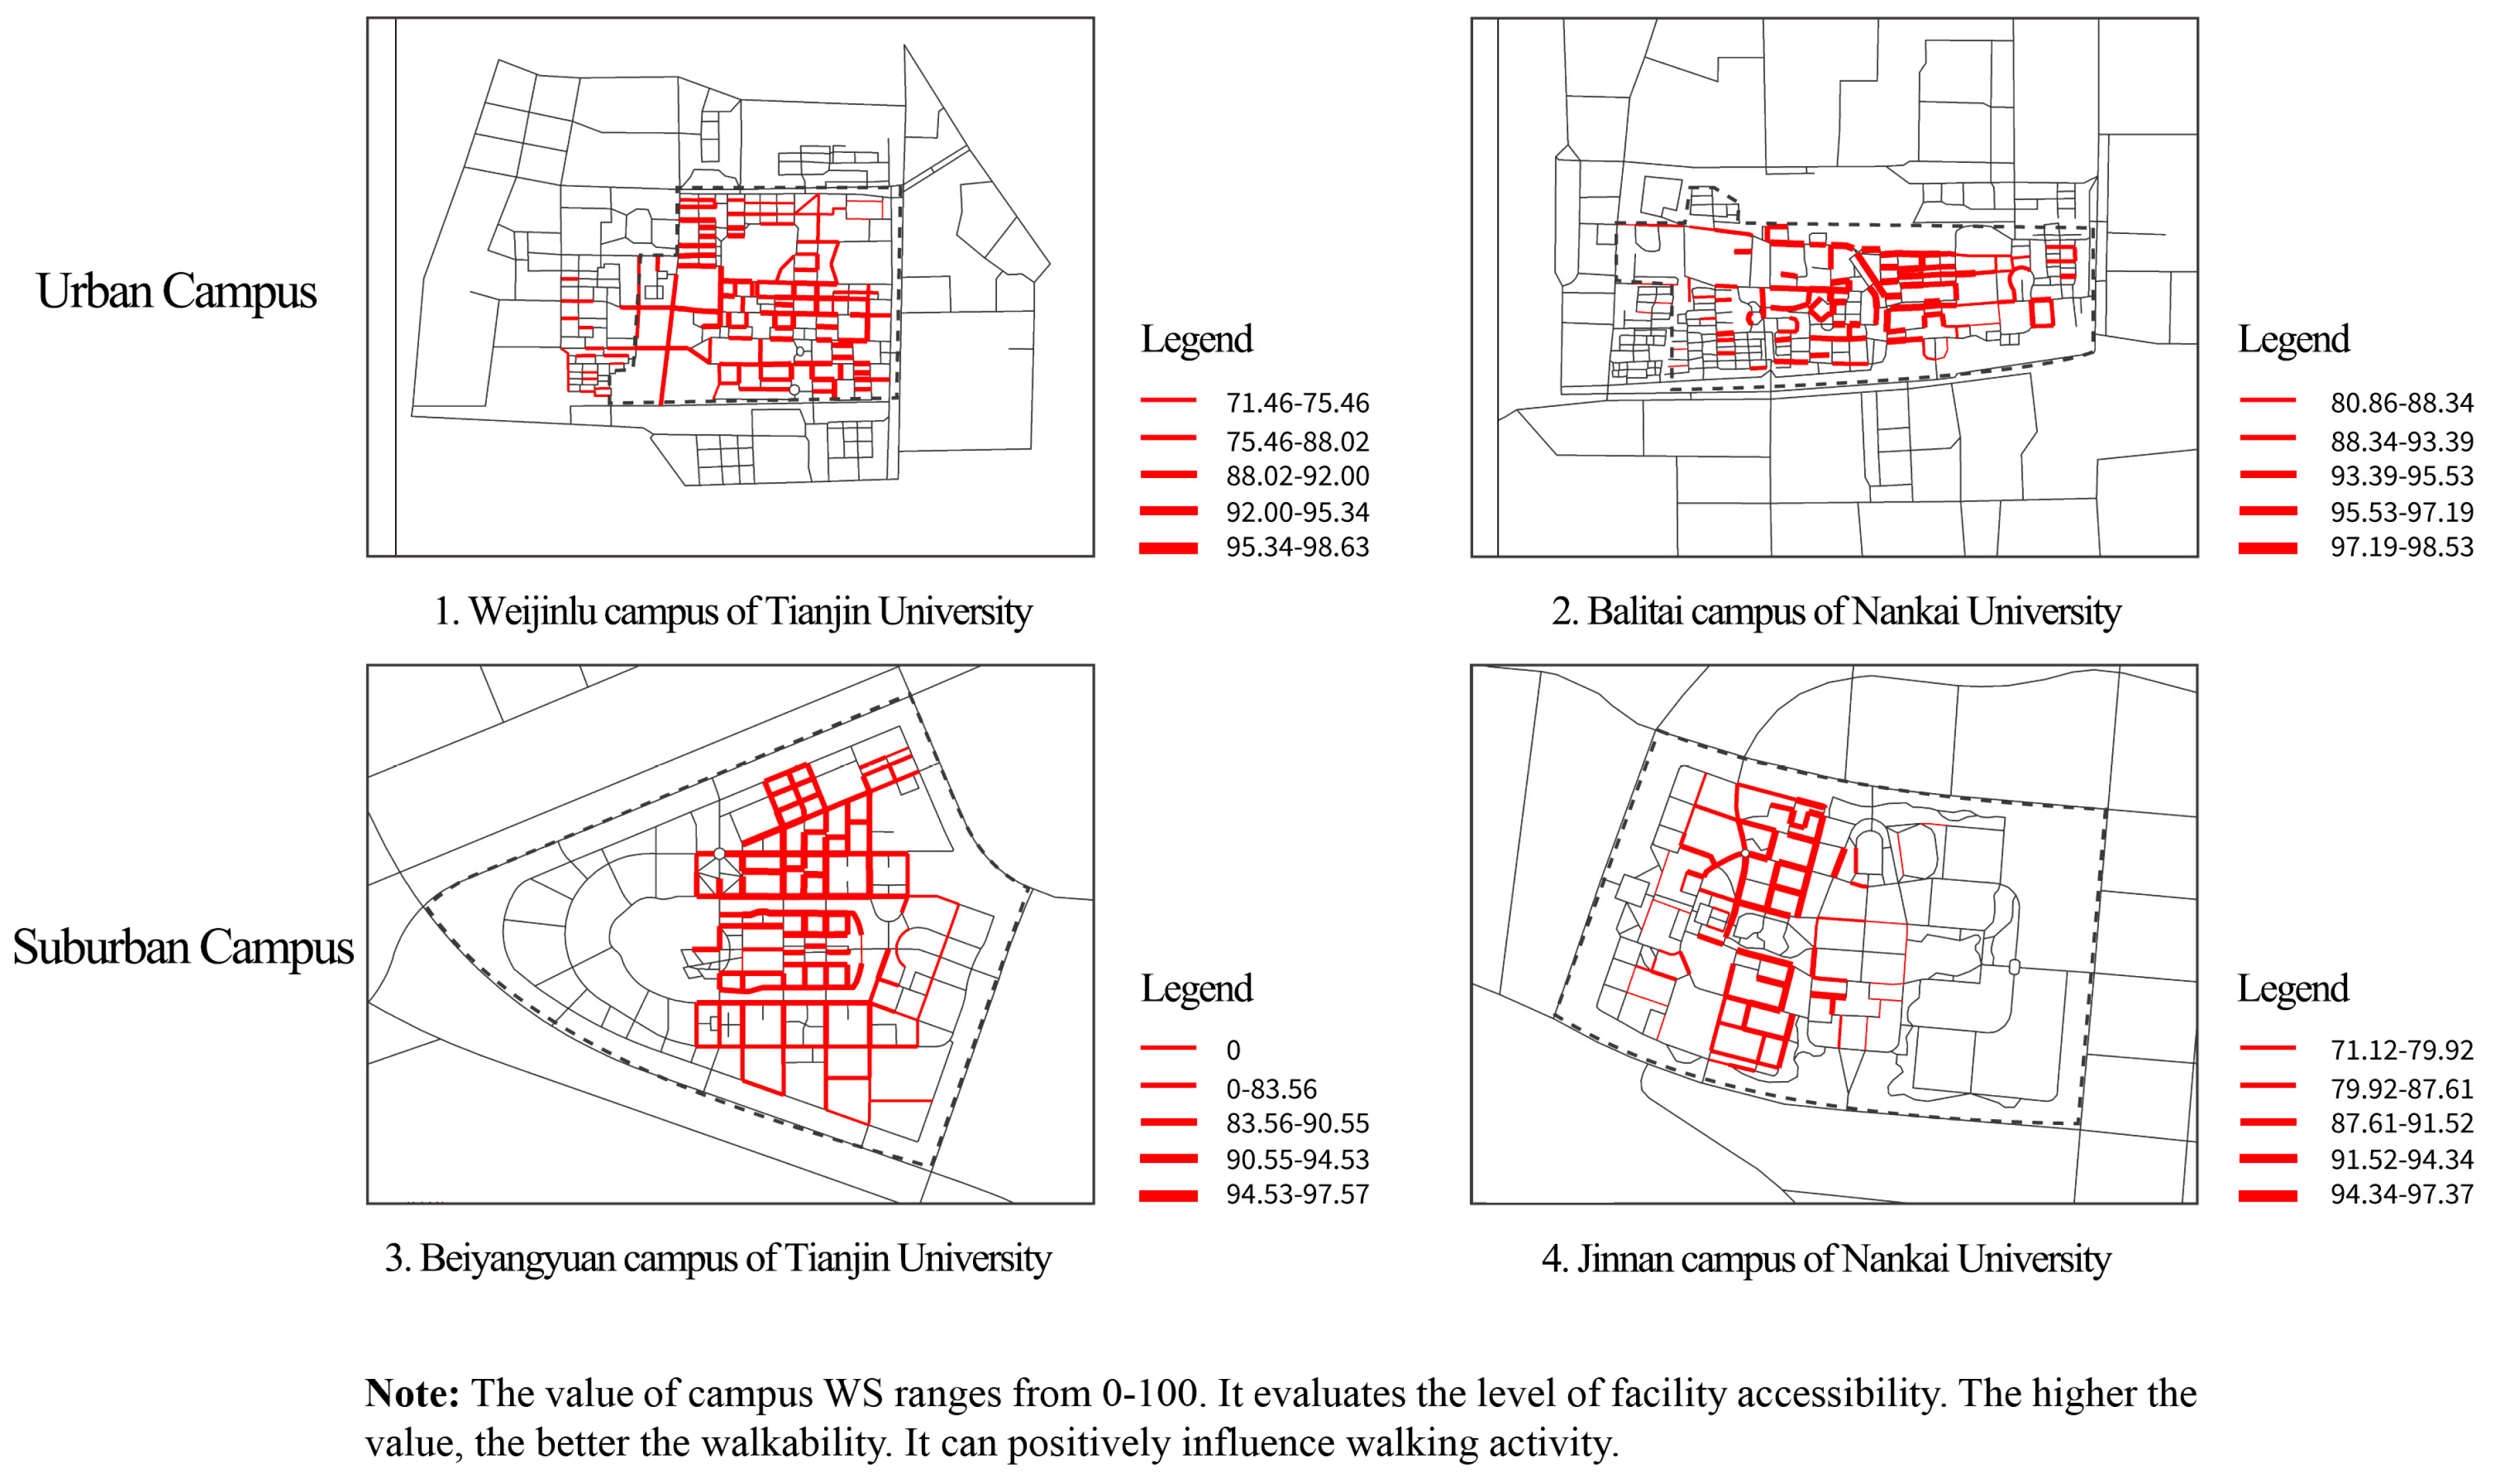
| Campus WS | 98.63 (97.57) | 71.46 (68.72) | 93.97 (90.76) | 4.33 (6.00) |
| Street connectivity | ||||
| Intersection density | 34.00 (29.00) | 8.00 (5.00) | 22.89 (13.87) | 5.56 (4.63) |
| Four-way intersection ratio | 0.65 (0.70) | 0.00 (0.00) | 0.38 (0.36) | 0.14 (0.16) |
| Block length | 248.40 (420.70) | 94.65 (102.20) | 133.11 (180.00) | 20.50 (46.52) |
| PRD | 2.48 (3.15) | 1.02 (1.13) | 1.33 (1.46) | 0.18 (0.23) |
| Land use | ||||
| Facility density | 18.00 (13.00) | 0.00 (0.00) | 4.22 (2.47) | 2.97 (2.35) |
| Entropy | 0.97 (1.00) | 0.13 (0.27) | 0.73 (0.71) | 0.17 (0.18) |
| Residential land % | 0.89 (0.54) | 0.00 (0.00) | 0.22 (0.18) | 0.22 (0.15) |
| Facility land % | 0.34 (0.52) | 0.00 (0.00) | 0.15 (0.15) | 0.08 (0.12) |
| Office land % | 0.52 (0.77) | 0.00 (0.00) | 0.19 (0.25) | 0.16 (0.18) |
| Park land % | 0.63 (0.60) | 0.00 (0.00) | 0.26 (0.23) | 0.14 (0.16) |
| Spatial Configuration | ||||
| Closeness | 197.10 (0.166) | 0.10 (0.00) | 38.80 (0.06) | 31.92 (0.03) |
| Betweenness | 2.22 (31.52) | 1.00 (0.03) | 1.39 (5.00) | 0.16 (5.34) |
| Environmental design quality | ||||
| Imageability | 4.80 (5.85) | 1.51 (1.90) | 2.48 (2.65) | 0.47 (0.54) |
| Enclosure | 4.09 (4.00) | 0.51 (0.29) | 2.80 (2.18) | 0.86 (0.99) |
| Human Scale | 3.89 (4.15) | 1.17 (1.27) | 2.91 (2.76) | 0.44 (0.65) |
| Transparency | 3.76 (3.77) | 1.71 (1.71) | 2.99 (2.90) | 0.47 (0.40) |
| Complexity | 4.94 (4.90) | 2.61 (2.88) | 3.56 (3.28) | 0.40 (0.28) |
| Pedestrian facility | ||||
| Sidewalk quality | 3.00 (3.00) | 0.00 (0.00) | 1.84 (2.29) | 0.94 (1.09) |
| Sidewalk length | 244.30 (265.10) | 45.06 (51.57) | 82.60 (111.93) | 24.98 (37.93) |
| Street tree | 1.00 (1.00) | 0.00 (0.00) | 0.73 (0.82) | 0.45 (0.39) |
| Model 1 | Model 2 | |||||
|---|---|---|---|---|---|---|
| Coefficient | Standard Error | p | Coefficient | Standard Error | p | |
| Intercept | −8.534 *** | 0.888 | <0.001 | −7.464 *** | 0.867 | <0.001 |
| Destination Accessibility | ||||||
| Campus WS | 0.078 *** | 0.009 | <0.001 | 0.071 *** | 0.008 | <0.001 |
| Street connectivity | ||||||
| Intersection density | −0.005 | 0.009 | 0.591 | −0.024 * | 0.009 | 0.012 |
| Four-way intersection% | −0.099 | 0.219 | 0.651 | 0.315 | 0.222 | 0.155 |
| Block length | −0.002 | 0.001 | 0.101 | −0.004 ** | 0.001 | 0.004 |
| PRD | −0.259 | 0.157 | 0.100 | −0.484 ** | 0.161 | 0.003 |
| Land use | ||||||
| Facility density | 0.041 *** | 0.009 | <0.001 | 0.043 *** | 0.010 | <0.001 |
| Entropy | 0.690 *** | 0.198 | <0.001 | |||
| Residential land % | 0.882 ** | 0.276 | 0.001 | |||
| Facility land % | 1.910 *** | 0.351 | <0.001 | |||
| Office land % | 1.008 *** | 0.249 | <0.001 | |||
| Park land % | 0.632 ** | 0.236 | 0.007 | |||
| Spatial Configuration | ||||||
| Closeness | −2.054 ** | 0.751 | 0.006 | −1.378 a | 0.741 | 0.063 |
| Betweenness | 0.004 a | 0.002 | 0.061 | 0.003 | 0.002 | 0.242 |
| Environmental design quality | ||||||
| Imageability | 0.065 | 0.052 | 0.210 | 0.050 | 0.051 | 0.336 |
| Enclosure | −0.095 * | 0.052 | 0.010 | −0.084 * | 0.038 | 0.028 |
| Human Scale | 0.173 * | 0.070 | 0.014 | 0.146 * | 0.069 | 0.035 |
| Transparency | 0.170 * | 0.070 | 0.015 | 0.147 * | 0.069 | 0.033 |
| Complexity | 0.328 *** | 0.069 | <0.001 | 0.342 *** | 0.068 | <0.001 |
| Pedestrian facility | ||||||
| Sidewalk quality | 0.164 *** | 0.029 | <0.001 | 0.150 *** | 0.029 | <0.001 |
| Sidewalk length | 0.005 *** | 0.001 | <0.001 | 0.005 *** | 0.001 | <0.001 |
| Street tree | 0.253 *** | 0.064 | <0.001 | 0.240 *** | 0.063 | <0.001 |
| Spatial filtering eigenvector | ||||||
| Fit (ME) | −2.517 *** | 0.605 | <0.001 | −2.326 *** | 0.628 | <0.001 |
| Fit (ME) | 1.477 ** | 0.543 | 0.007 | 1.323 * | 0.538 | 0.013 |
| Fit (ME) | −2.464 *** | 0.581 | <0.001 | −2.965 *** | 0.612 | <0.001 |
| Fit (ME) | 2.106 *** | 0.577 | <0.001 | −4.134 *** | 1.089 | <0.001 |
| Fit (ME) | −3.948 *** | 0.626 | <0.001 | 3.042 *** | 0.598 | <0.001 |
| Fit (ME) | −3.407 *** | 1.021 | <0.001 | |||
| N | 517 | 517 | ||||
| 2 × log-likelihood (df) | −2158.45 (488) | −2142.80 (487) | ||||
| AIC | 2219 | 2205 | ||||
| Model 1 | Model 2 | |||||
|---|---|---|---|---|---|---|
| Coefficient | Standard Error | p | Coefficient | Standard Error | p | |
| Intercept | −5.502 *** | 1.422 | <0.001 | −6.111 *** | 1.472 | <0.001 |
| Destination Accessibility | ||||||
| Campus WS | 0.056 *** | 0.014 | <0.001 | 0.063 *** | 0.014 | <0.001 |
| Street connectivity | ||||||
| Intersection density | 0.016 | 0.010 | 0.111 | 0.016 | 0.011 | 0.167 |
| Four-way intersection% | 0.026 | 0.329 | 0.936 | −0.315 | 0.346 | 0.362 |
| Block length | 0.001 | 0.002 | 0.660 | -0.0003 | 0.002 | 0.848 |
| PRD | −0.758 ** | 0.280 | 0.007 | −0.792 ** | 0.285 | 0.006 |
| Land use | ||||||
| Facility density | 0.044 *** | 0.012 | <0.001 | 0.070 *** | 0.014 | <0.001 |
| Entropy | 0.366 | 0.297 | 0.217 | |||
| Residential land % | 0.517 | 0.494 | 0.295 | |||
| Facility land % | 0.456 | 0.552 | 0.409 | |||
| Office land % | 0.428 | 0.547 | 0.435 | |||
| Park land % | 0.888 * | 0.425 | 0.037 | |||
| Spatial Configuration | ||||||
| Closeness | −1.841 * | 0.927 | 0.047 | −1.732 a | 0.945 | 0.067 |
| Betweenness | 0.004 | 0.003 | 0.165 | 0.003 | 0.003 | 0.247 |
| Environmental design quality | ||||||
| Imageability | −0.137 a | 0.082 | 0.095 | −0.163 a | 0.083 | 0.050 |
| Enclosure | −0.258 *** | 0.052 | <0.001 | −0.263 *** | 0.055 | <0.001 |
| Human Scale | −0.151 | 0.102 | 0.138 | -0.156 | 0.102 | 0.127 |
| Transparency | 0456 *** | 0.091 | <0.001 | 0.440 *** | 0.091 | <0.001 |
| Complexity | 0.395 *** | 0.086 | <0.001 | 0.404 *** | 0.091 | <0.001 |
| Pedestrian facility | ||||||
| Sidewalk quality | 0.063 | 0.039 | 0.109 | 0.063 | 0.041 | 0.122 |
| Sidewalk length | 0.007 *** | 0.001 | <0.001 | 0.007 *** | 0.002 | <0.001 |
| Street tree | 0.232 ** | 0.084 | 0.005 | 0.251 ** | 0.083 | 0.003 |
| Spatial filtering eigenvector | ||||||
| Fit (ME) | 3.606 *** | 0.651 | <0.001 | 3.568 *** | 0.736 | <0.001 |
| Fit (ME) | 1.920 *** | 0.571 | <0.001 | 1.895 *** | 0.575 | <0.001 |
| Fit (ME) | −1.719 ** | 0.628 | 0.006 | −1.324 * | 0.561 | 0.018 |
| Fit (ME) | 0.244 | 0.562 | 0.664 | 1.020 a | 0.564 | 0.070 |
| N | 272 | 272 | ||||
| 2 × log-likelihood (df) | −1237.05 (250) | −1233.37 (247) | ||||
| AIC | 1283 | 1285 | ||||
| Model 1 | Model 2 | |||||
|---|---|---|---|---|---|---|
| Coefficient | Standard Error | p | Coefficient | Standard Error | p | |
| Intercept | −8.132 *** | 1.363 | <0.001 | −4.645 *** | 1.532 | <0.001 |
| Destination accessibility | ||||||
| Campus WS | 0.077 *** | 0.012 | <0.001 | 0.059 *** | 0.014 | <0.001 |
| Street connectivity | ||||||
| Intersection density | −0.014 | 0.018 | 0.426 | −0.031 | 0.020 | 0.114 |
| Four-way intersection% | 0.193 | 0.325 | 0.553 | 0.525 | 0.366 | 0.152 |
| Block length | −0.003 a | 0.018 | 0.084 | −0.007 ** | 0.002 | 0.001 |
| PRD | −0.351 | 0.231 | 0.129 | −0.803 ** | 0.254 | 0.002 |
| Land use | ||||||
| Facility density | 0.045 ** | 0.017 | 0.007 | 1.748 *** | 0.464 | <0.001 |
| Entropy | 0.747 * | 0.301 | 0.013 | |||
| Residential land % | 0.846 | 0.515 | 0.101 | |||
| Facility land % | 1.748 *** | 0.464 | <0.001 | |||
| Office land % | 0.312 | 0.333 | 0.348 | |||
| Park land % | 0.777 * | 0.368 | 0.035 | |||
| Spatial configuration | ||||||
| Closeness | 0.793 | 2.562 | 0.757 | 0.013 | 2.498 | 0.996 |
| Betweenness | −0.004 | 0.015 | 0.806 | −0.002 | 0.015 | 0.876 |
| Environmental design quality | ||||||
| Imageability | 0.138 a | 0.071 | 0.052 | 0.132 a | 0.072 | 0.067 |
| Enclosure | 0.017 | 0.066 | 0.796 | 0.030 | 0.066 | 0.646 |
| Human Scale | 0.171 | 0.108 | 0.113 | 0.161 | 0.107 | 0.130 |
| Transparency | −0.053 | 0.134 | 0.691 | −0.091 | 0.132 | 0.488 |
| Complexity | 0.370 ** | 0.133 | 0.005 | 0.266 * | 0.132 | 0.045 |
| Pedestrian facility | ||||||
| Sidewalk quality | 0.124 ** | 0.043 | 0.004 | 0.130 ** | 0.044 | 0.003 |
| Sidewalk length | 0.003 ** | 0.001 | 0.002 | 0.003 ** | 0.001 | 0.006 |
| Street tree | 0.191 a | 0.107 | 0.074 | 0.190 * | 0.105 | 0.069 |
| Spatial filtering eigenvector | ||||||
| Fit (ME) | 1.830 * | 0.717 | 0.011 | −1.860 * | 0.740 | 0.012 |
| N | 245 | 245 | ||||
| 2 × log-likelihood (df) | −940.47 (226) | −928.13 (223) | ||||
| AIC | 980 | 974 | ||||
| Variables | Urban Campus | Suburban Campus | ||
|---|---|---|---|---|
| Model 1 | Model 2 | Model 1 | Model 2 | |
| Destination accessibility | ||||
| Campus WS | 0.056 *** | 0.063 *** | 0.077 *** | 0.059 *** |
| Street connectivity | ||||
| Intersection density | — | — | — | — |
| Four-way intersection% | — | — | — | — |
| Block length | — | — | −0.003 a | −0.007 ** |
| PRD | −0.758 ** | −0.792 ** | — | −0.803 ** |
| Land use | ||||
| Facility density | 0.044 *** | 0.070 *** | 0.045 ** | 1.748 *** |
| Entropy | — | — | 0.747 * | — |
| Residential land % | — | — | — | — |
| Facility land % | — | — | — | 1.748 *** |
| Office land % | — | — | — | — |
| Park land % | — | 0.888 * | — | 0.777 * |
| Spatial configuration | ||||
| Closeness | −1.841 * | −1.732 a | — | — |
| Betweenness | — | — | — | — |
| Environmental design quality | ||||
| Imageability | −0.137 a | −0.163 a | 0.138 a | 0.132 a |
| Enclosure | −0.258 *** | −0.263 *** | — | — |
| Human Scale | — | — | — | — |
| Transparency | 0456 *** | 0.440 *** | — | — |
| Complexity | 0.395 *** | 0.404 *** | 0.370 ** | 0.266 * |
| Pedestrian facility | ||||
| Sidewalk quality | — | — | 0.124 ** | 0.130 ** |
| Sidewalk length | 0.007 *** | 0.007 *** | 0.003 ** | 0.003 ** |
| Street tree | 0.232 ** | 0.251 ** | 0.191 a | 0.190 * |
Disclaimer/Publisher’s Note: The statements, opinions and data contained in all publications are solely those of the individual author(s) and contributor(s) and not of MDPI and/or the editor(s). MDPI and/or the editor(s) disclaim responsibility for any injury to people or property resulting from any ideas, methods, instructions or products referred to in the content. |
© 2023 by the authors. Licensee MDPI, Basel, Switzerland. This article is an open access article distributed under the terms and conditions of the Creative Commons Attribution (CC BY) license (https://creativecommons.org/licenses/by/4.0/).
Share and Cite
Zhang, Z.; Wang, H.; Pang, L.; Fisher, T.; Yang, S. Comparisons of Built Environment Correlates of Walking in Urban and Suburban Campuses: A Case Study of Tianjin, China. Land 2023, 12, 1972. https://doi.org/10.3390/land12111972
Zhang Z, Wang H, Pang L, Fisher T, Yang S. Comparisons of Built Environment Correlates of Walking in Urban and Suburban Campuses: A Case Study of Tianjin, China. Land. 2023; 12(11):1972. https://doi.org/10.3390/land12111972
Chicago/Turabian StyleZhang, Zhehao, Haiming Wang, Lei Pang, Thomas Fisher, and Shuo Yang. 2023. "Comparisons of Built Environment Correlates of Walking in Urban and Suburban Campuses: A Case Study of Tianjin, China" Land 12, no. 11: 1972. https://doi.org/10.3390/land12111972
APA StyleZhang, Z., Wang, H., Pang, L., Fisher, T., & Yang, S. (2023). Comparisons of Built Environment Correlates of Walking in Urban and Suburban Campuses: A Case Study of Tianjin, China. Land, 12(11), 1972. https://doi.org/10.3390/land12111972