Article

Characteristics and Sources of Heavy Metal Pollution in Cropland near a Typical Lead–Zinc Processing Plant in Xieping Village, Hui County, China

1
College of Geography and Environmental Science, Northwest Normal University, Lanzhou 730070, China
2
Key Laboratory of Resource Environment and Sustainable Development of Oasis, Lanzhou 730070, China
*
Author to whom correspondence should be addressed.
Land 2023, 12(10), 1945; https://doi.org/10.3390/land12101945
Submission received: 31 August 2023 / Revised: 13 October 2023 / Accepted: 18 October 2023 / Published: 20 October 2023
(This article belongs to the Section Land Use, Impact Assessment and Sustainability)

Abstract

:
Metal beneficiation activities may cause soil pollution in the surrounding cropland, making it crucial to conduct heavy metal pollution assessment and source analysis of the cultivated land in mining areas for the protection of the ecological environment and human health. In this study, a total of 205 surface soil samples (0–20 cm) were collected on site from the Tianheba cropland near the lead–zinc concentrator in Xieping Village, Huixian County, Gansu Province, China; their pH values and their SOM, Zn, As, Cd, Cr, Hg, and Pb contents were determined. Based on the data, we used the Kriging spatial interpolation, the Nemero index, the index of geoaccumulation, and the PMF model to analyze the characteristics of the spatial distribution of soil heavy metals in the region, the degree of contamination, the sources, and the contribution rate. The results indicated that the heavy metals with contamination levels in the Tianheba cropland were Cd, Zn, Pb, Hg, As, and Cr in descending order, with the average concentrations of Cd (0.39 mg/kg), Zn (122 mg/kg), Pb (30.4 mg/kg), and Hg (0.07 mg/kg) being significantly higher than the background values of the Gansu soils. The soil in the region as a whole was heavily polluted; it was heavily polluted with Cd, moderately polluted with Zn, and mildly polluted with Pb. Hg had a larger value in the index of geoaccumulation. By analyzing the spatial distribution and sources of the soil metals, it was found that the cropland contaminated with heavy metals in Tianheba was distributed around the mineral processing plant and the infiltration area of the canal. The PMF model revealed three pollution sources: the industrial source related to mining activities, the fertilizer application source, and the natural source. This study provides a scientific basis for the precise management of heavy metal pollution in the area.

1. Introduction

Heavy metals are natural components of the earth’s crust, and they are also highly toxic compounds [1,2]; they can be converted into different chemical forms through dissolution and adsorption for long-term existence in soil. When the heavy metal content exceeds the background value or accumulates excessively, it may cause heavy metal pollution [3], which will cause harm to the environment and ecosystem. Compared with other pollutants, heavy metals are retained in the soil for a long time and are characterized by their hidden nature, irreversibility, ease of accumulation, bioconcentration, and high toxicity that is not easily degraded [4,5]. Soil heavy metals migrate, transform, and deposit on the surface, which is the main site; thus, they can continuously contaminate the surrounding soil through wastewater discharges and atmospheric deposition [6,7] and then enter the food chain to cause harm to the human body [8]. Mining production provides energy and raw materials for national economic construction, but at the same time, it creates corresponding environmental problems. Such as the heavy metals generated from mining, ore dressing, resource transportation, tailings accumulation, etc., which spread to the periphery of the mining area through wastewater, mine dust, soot, and smoke and affect the production and lives of the residents around the mining area. Therefore, soil census and soil heavy metal pollution investigation have been widely emphasized; for example, China launched the third national soil census in 2022, aiming to use a four-year period to comprehensively determine the soil quality of agricultural land.
The early studies on soil heavy metals were mainly based on empirical methods, requiring soil experts to collect soil samples in the field, determine the spatial location of the samples, draw charts, or make hand-drawn maps to show their distribution; then, they carried out the subsequent studies. This method relies too much on the subjective judgment and past experience of soil experts; it takes a long time and has a high cost. In addition, the accuracy cannot be fully guaranteed. With the rapid development of geographic information system (GIS) technology, some scholars have combined GIS spatial analysis theory and geostatistics to study the spatial distribution pattern and sources of soil heavy metal content in mining areas [9,10]. Liu et al. [11] assessed seven heavy metals, As, Cd, Cr, Cu, Hg, Pb, and Zn, in the cultivated soil around a lead and zinc mining area in Hebei Province using the enrichment factor, the index of geoaccumulation, and Hankanson’s potential ecological risk index, which showed that the soil was moderately polluted with Cd, Hg, Pb, and Zn and slightly polluted with As and Cu. Yang et al. [12] assessed the ecological risk of soil heavy metals in agricultural sub-watersheds where typical mining-related pollution areas in the south were located and found that there was compound pollution of heavy metals in the watershed, with the highest degree of Cd contamination and the highest ecological risk level in the cropland on both sides of the mainstream of the river. Zhan et al. [13] investigated trace heavy metals in the soil of the lead and zinc smelting area in Hui County and found that the soil samples of the cropland contained high levels of Cd, Pb, and Zn and that the heavy metal contamination was significantly affected by the nature of the soil; the main reasons for the contamination were persistent irrigation of sewage and dusty wind transport. Zhang et al. [14] considered the contribution of atmospheric sources, natural sources, lithological sources, industrial sources with atmospheric deposition, and industrial activities as the main sources of heavy metals in the cropland around the mining areas in the karst region. In these areas, industrial sources with atmospheric deposition and industrial activities were the main anthropogenic factors leading to the accumulation of heavy metals in the cropland soils [9,10]. The above studies were mainly centered on the assessment of the cropland in the mining area of a certain region, and the distance between the sampling points was large. There are few studies on the investigation of heavy metal content and the assessment of the pollution status of cultivated land at the cropland scale.
Hui County is rich in mineral resources; the main types of minerals currently being mined are lead–zinc ore, iron ore, and gold, which play an important role in the local economic development. There are many unexploited minerals, such as antimony, copper, manganese, magnesium, and so on, that have a certain value of mining and are to be rationally developed and utilized. Even though the locals have benefited economically from the development of mineral resources, this development has also caused several environmental issues and threatened the health of the surrounding residents. The publicly available records of standards for edible agricultural products not being met include a lead contamination incident in Hui County, Gansu Province, in 2006. A large number of villagers in the county had blood lead levels exceeding 100 micrograms, with more than 90 percent of them being children under 14 years of age, and thousands of people were contaminated. The main cause of the incident was the failure of the non-ferrous metal smelting company in Hui County to comply with the relevant governmental orders, including its unauthorized expansion of the scale of production and its long-term failure to observe the standards regarding sewage discharge.
Relying on the National Soil Pollution Control Special Funds Project, this paper takes the Tianheba cropland near the lead–zinc ore dressing plant in Xieping Village, Hui County, Gansu Province, China, as the area for the investigation. The primary source of pollution in the Tianheba cropland is the uncontrolled discharge of wastewater from three metallurgical enterprises, namely Junhui Concentrator, Luoba Concentrator, and Xieping Concentrator. Additionally, pollution is exacerbated by diffuse irrigation of arable land with wastewater under extreme climatic conditions. [15]. In 2016, the first three enterprises were closed or shut down, and the source of pollution was basically cut off, but the pollution degree of the soil needed to be assessed. Therefore, through field sampling and indoor testing, we comprehensively applied GIS spatial analysis and mathematical and statistical methods to analyze the spatial distribution characteristics of the different heavy metals in the surface soil as well as the degree and source of soil heavy metal pollution. This study provides a scientific basis for the precise management of heavy metal pollution in the area.

2. Materials and Methods

2.1. Study Region

2.1.1. Description of the Study Area

Hui County is located in southeastern Gansu Province, at the western foot of the Qinling Mountains and the upper reaches of the Jialing River in the Hui Cheng Basin. Liulin Town is situated in the northeast of Hui County, on both sides of the Yongning River, with an average elevation of 850 m. It has a typical continental monsoon climate, with an average annual temperature of 12.8 °C and an average annual precipitation of 704 mm. The crops are mainly wheat, rice, corn, and oilseed rape. Due to the location of a lead and zinc ore belt, the town has a strong industrial base and is an important non-ferrous metal mining and processing base in Longnan City.
The study area of this investigation is the Tianheba cropland, which is bounded by 106°10′06″ E to 106°11′13″ E longitude and 33°51′46″ N to 33°52′28″ N latitude; it is situated in Liulin Township (Figure 1) and has an area of approximately 0.15 km2. It is connected to Xieping Village in the east, the left bank of the Yongning River in the west, the country road leading to Xieping Village in the north, and the Loess Plateau in the south. In Groups I and II of Xieping Village, roughly 600 people from 200 households own the loess-based land, which is primarily used for growing soybeans, vegetables, corn, wheat, and nurseries. The Xieping lead–zinc ore dressing plant is adjacent to the southern part of Xieping village; it had an industrial wastewater discharge of about 30 × 104 m3/a from 1994 to 2008 and was closed in 2012 in accordance with the law. Due to the terrain, industrial wastewater is discharged into the Yongning River from the east to the west along the main ditch between the Tianheba croplands, which divides the cropland into two major farming areas, north and south.

2.1.2. Field Sampling and Laboratory Analysis

According to the Technical Rules for Monitroing of Environmental Quality of Farmland Soil (NY/T395-2012) [16] and the Technical Specification for Soil Environmental Monitoring (HJ/T166-2004) [17], 205 sample squares were uniformly laid out on the Tianheba cropland in May 2019 using the grid method (20 m × 20 m) (Figure 1). Five 0–20 cm soil samples were collected using the double diagonal method to form a mixed sample, and a 1 kg soil sample was taken using the quadrat method. Then, a wooden shovel was used to remove the contact surface of the shovel and to put it into a plastic bag; then, it was put into a cloth bag and marked with the sample number on the cloth bag using a marker. Each sample was cleaned up immediately after collection to avoid cross-contamination. All the samples were submitted to a third-party laboratory with CMA/CNAS certification to analyze and detect the target pollutants in the samples sent for testing; the detection methods for each indicator and the instruments used are shown in Table 1.

2.2. Research Methods

2.2.1. Nemero Pollution Index

The Nemero composite pollution index was developed from the single-factor index, which has the advantage of being able to take into account the average value of the single-factor, thereby highlighting the contribution of the maximum value [22]. This method can comprehensively reflect the degree of pollution of the different pollutants in the soil. Its calculation formula is as follows:
P i = C i S i
P N = p 2 i a v e r + p 2 i max 2
where Pi is the single-factor pollution index of heavy metal element i; Ci is the measured soil heavy metal i content; Si is the environmental quality standard of heavy metal i in soil, in accordance with the “Soil Pollution Risk Control Standard for Soil Environmental Quality of Agricultural Land (GB 15618-2018)” [23]; PN is the comprehensive pollution index of heavy metals; and Piaver and Pimax are the heavy metal pollution indices, respectively, and the mean and maximum values, respectively. With reference to the existing studies [24], the grading standard for the evaluation of the single-factor pollution index was adopted: when Pi ≤ 1, there is no pollution; when 1 < Pi ≤ 2, there is light pollution; when 2 < Pi ≤ 3, there is medium pollution; when 3 < Pi ≤ 5, there is heavy pollution; and when Pi > 5, there is very strong pollution. The evaluation and grading standards of the Nemero index integrated the pollution index: PN ≤ 0.7, indicating clean soil; 0.7 < PN ≤ 1.0, indicating soil located at the alert limit; 1.0 < PN ≤ 2.0, indicating mild soil pollution; 2.0 < PN ≤ 3.0, indicating moderate soil pollution; and PN > 3.0, indicating heavy soil pollution.

2.2.2. Index of Geoaccumulation

The index of geoaccumulation (Igeo), often called Muller’s index, classifies the degree of contamination into different classes based on the multiplicity of the soil heavy metal content and the background value [25]. It can take into account the joint influence of the geological background and anthropogenic activities [26], and it is an important parameter for distinguishing the influence of anthropogenic activities. Its calculation formula is as follows:
I g e o = log 2 C n K × B n
where Igeo is the index of geoaccumulation; Cn is the measured content of heavy metal n; K is the correction factor considering the degree of variability of the geological background value, which is taken here to be 1.5; and Bn is the background reference value of heavy metal n. In this paper, we selected the background values of the soils in Gansu Province and the Tianheba cropland, respectively. The grading criteria for evaluating the degree of soil heavy metal accumulation were as follows: Igeo < 0 for no pollution; 0 ≤ Igeo < 1 for mild pollution; 1 ≤ Igeo < 2 for moderate pollution; 2 ≤ Igeo < 3 for medium-strength pollution; 3 ≤ Igeo < 4 for strong pollution; 4 ≤ Igeo < 5 for strong–extremely strong pollution; and Igeo ≥ 5 for extremely strong pollution [27].

2.2.3. Positive Matrix Factorization (PMF) Model

The PMF model is a source resolution method based on factor analysis techniques [28], which decompose the original content matrix Xij of the heavy metals into factor contributions gik, eigenvalues fkj, and the residual matrix eij [26]:
X i j = k = 1 p g i k f k j + e i j
where Xij is the content of the jth element in sample i; gik is the contribution of the kth source to sample i; fkj is the eigenvalue of source k to element j; and eij is the residual matrix, obtained from the objective function Q.
The minimum Q is obtained with the model through a limited iterative computation via weighted least squares, and the computation continuously decomposes Xij and selects the optimal gik and fkj [29], which are calculated as follows:
Q = j = 1 n i = 1 m ( e i j u i j ) 2
When the elemental concentration is below the MDL, uij is calculated as follows:
u i j = 5 6 M D L
When the elemental concentration is higher than the MDL, uij is calculated as follows:
u i j = ( R S D × X i j ) 2 + M D L 2
where uij is the size of the uncertainty of the content of the jth element in sample i; RSD is the relative standard deviation of the elemental content, which can be determined via the recovery in chemical analysis; and the empirical value of 0.1 was chosen here [30]. MDL is the detection limit of the method, and the size of the detection limit of each element is shown in Table 1.

2.2.4. Other Statistical Methods

Other statistical methods used in this paper include the coefficient of variation (Cv) and the Pearson correlation coefficient. The former is used to characterize the degree of dispersion of the data, which can intuitively reflect the magnitude of the spatial variability of the sample; the latter, also known as the cumulative coefficient of correlation, is a statistical indicator that expresses the degree and direction of linear correlation between two variables, and the method of calculating the two is described in the literature [31]. Generally, Cv < 10% indicates weak variability; 10% ≤ Cv < 100% indicates moderate variability; and Cv ≥ 100% indicates strong variability. The larger the Cv, the greater the influence of the other factors (e.g., human activities) [32]. The Pearson’s correlation coefficient can be used to analyze the correlation between the heavy metal contents; then, the information regarding the sources of the heavy metals can be obtained [9,33]. When there is a significant positive correlation between soil heavy metal contents, it indicates the existence of homology, common geochemical activities, or similar aggregation characteristics between these heavy metals [34,35] and, vice versa, that there are significant differences in their sources [35,36]. The spatial distribution utilizes the Kriging spatial interpolation method, which is theoretically capable of providing the best linearly unbiased estimation of regional variables in a finite area. It takes into account the spatial correlation problem and is widely used in the fields of ecology, environmental studies, and geology [37].

3. Results

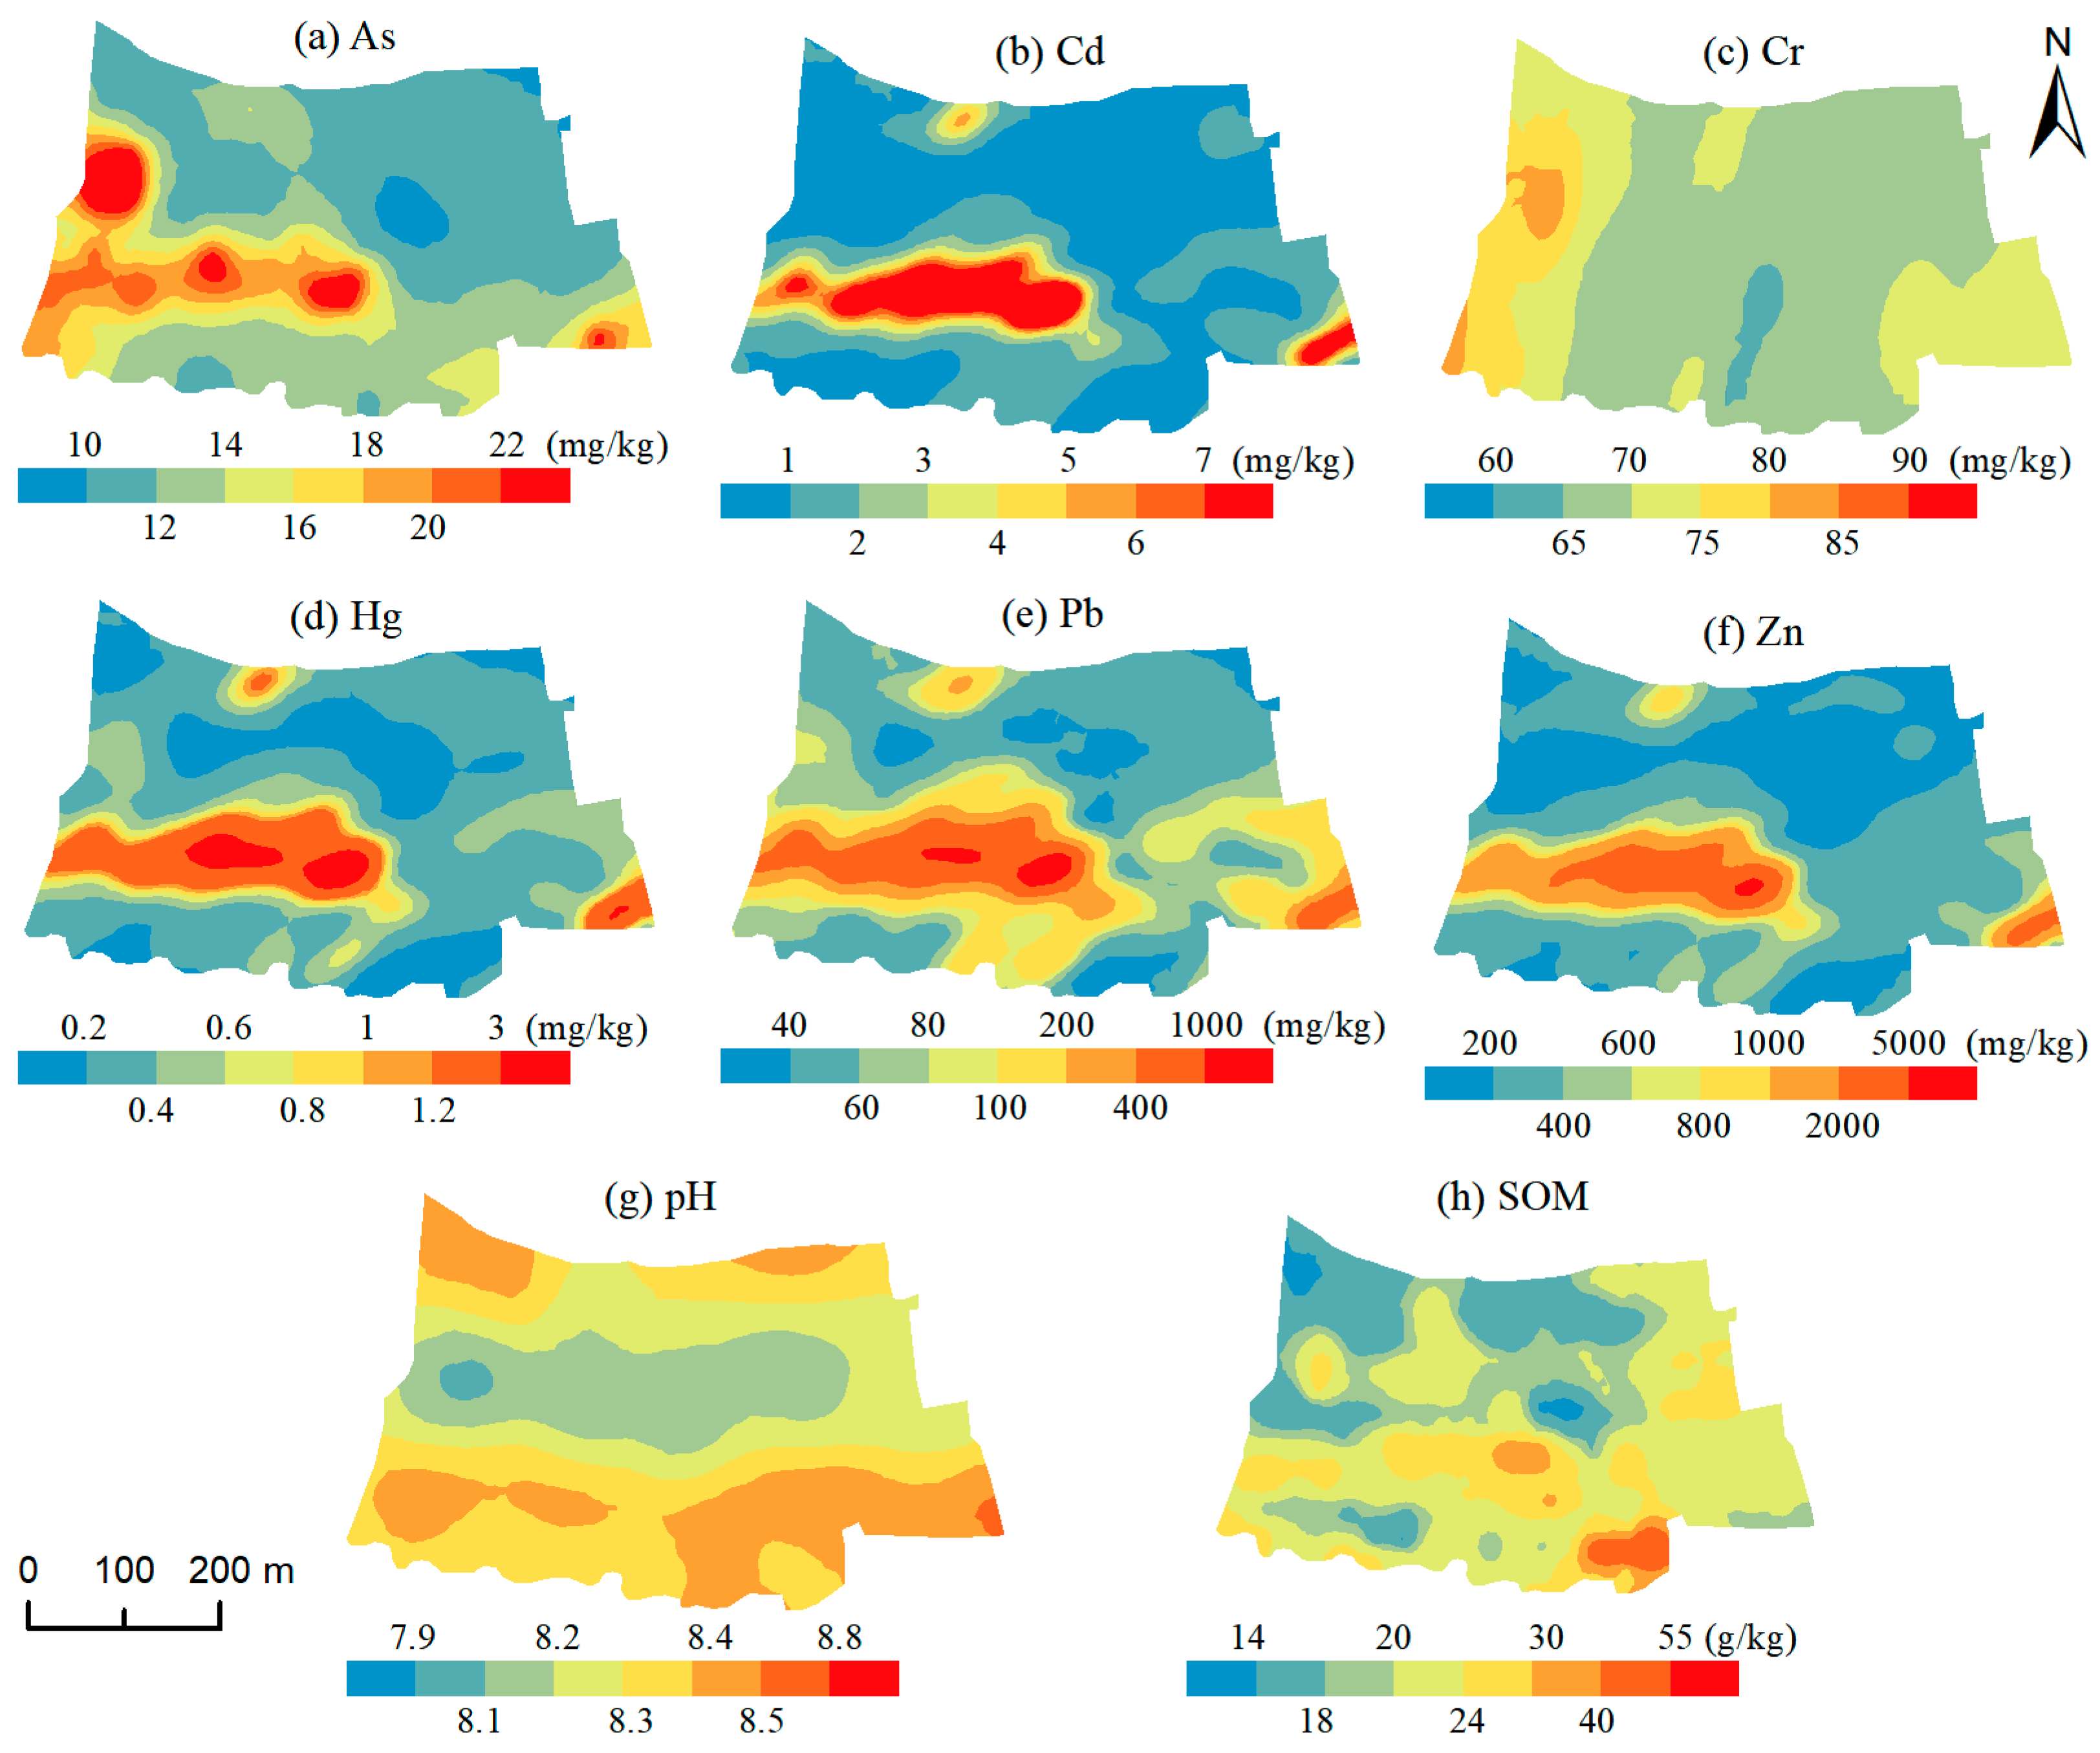
3.1. Soil Heavy Metal Content and Spatial Characteristics

The test results showed that the pH value of the cultivated soil of Tianheba ranged from 7.69 to 9.11, with an overall slightly alkaline color. The SOM ranged from 8.92 to 79.1 g/kg, with a mean value of 21.79 g/kg, and according to the Nutrient Grading Standards of the Second National Soil Census, the organic matter content of the surface soil in the study area was of a medium level in the third and fourth grades. The contents of the soil heavy metals As, Cd, Cr, Hg, Pb, and Zn ranged from 9.14 to 47.1 mg/kg, 0.39 to 31 mg/kg, 55.5 to 96.8 mg/kg, 0.07 to 10.1 mg/kg, 30.4 to 2238 mg/kg, and 122 to 9376 mg/kg, respectively (Table 2). When compared to the background values in Gansu Province, the contents of four heavy metals, Cd, Hg, Pb, and Zn, in all the surface soil samples in the study area exceeded the standard, whereas two heavy metals, As and Cr, had contents that were lower, and only 8.29% and 37.56% of the samples had background values that exceeded the standard, respectively. The average values of As, Cr, and Hg were lower than the national risk screening value, and none of the points exceeded the standard or the number of points that exceeded the standard was less than 5%. The average value of the rest of the metals was higher than the risk screening value; the element Cd is the most serious, exceeding the number of points accounted for by 80.98%. In general, it was indicated that the pollution in the area is comparatively serious. As can be seen in Table 2, the degree of variability of Zn, As, Cd, Cr, Hg, and Pb was in the order Zn > Hg > Pb > Cd > As > Cr, of which Cr had a weak variation; As had medium variation; and Zn, Cd, Pb, and Hg had strong variations. They were subjected to a significant degree of external interference and may have had a variety of sources of contamination [33].
The spatial distribution of the heavy metals and soil properties (pH and SOM) in the Tianheba cropland is shown in Figure 2. The pH levels were found to be high on both the north and south sides of the cropland, and the value decreased toward the middle of the cropland. On the other hand, the SOM content exhibited a decrease from the southeast to the northwest direction. The As, Cd, Hg, Pb, and Zn distribution characteristics were essentially the same, with the high-value areas clustered near the ore dressing plant and near the drainage ditch between the residential area of the Xieping Village and the Yongning River, and the heavy metal contents in the northeastern part of the country were less. This is mainly related to the topography of the cropland and the distribution of the drainage canals. Most of the western part of the Tianheba cropland is relatively flat; the direction of the surface runoff and drainage canal water flow direction are the same, from east to west, and the hydraulic gradient is only 10~20‰. Heavy metals enter with the wastewater through the drainage canals, and the drainage canals diffuse the heavy metals, resulting in heavy metal enrichment. The areas with high Cr content are mainly distributed near the ore dressing plant and the bank of the Yongning River; the soil heavy metal aggregation near the drainage channel is not obvious. The areas with a high As content are also mainly on both sides of the Yongning River, but there are fewer of them near the ore dressing plant; on the whole, the area is not highly contaminated with these two kinds of heavy metals. The contents of these heavy metals may be highly correlated with the topography; the heavy metals are aggregated with the rainfall, surface runoff, etc., in the low place. There is a small amount of heavy metal enrichment in the northern part of the cultivated area, which may be due to the fact that no effective soil pollution control measures were taken before this; so, the soil pollution is subject to large variations in the micro-topographic terrain, and localized heavy metal enrichment has been formed in the low-lying areas.

3.2. Evaluation of the Extent of Heavy Metal Contamination

According to the grading criteria of the single-factor pollution index, the mean values of the single-factor pollution index of the soil heavy metals in the study area were Cd > Zn > Pb > As > Cr > Hg in descending order (Table 3). Among them, the average value of the As, Cr, and Hg content of the single-factor pollution index was less than 1, and overall, there was no pollution. For Cr, all the sample points were uncontaminated; for As and Hg, more than 96% of the sample points were uncontaminated; and light to medium pollution only accounted for 2.93% and 3.91%, respectively. More than 60% of the sampling points of Zn and Pb were uncontaminated, but the average value of the Zn content showed moderate pollution; Pb showed light pollution. While the average value of the Cd reached the level of heavy pollution in less than 20% of the sample points, heavy and very strong pollution accounted for 26.34%, indicating the more serious pollution of Cd in the study area. The average value of Zn and Pb showed no contamination, but the average value of the Zn content showed moderate contamination, and the Pb value showed mild contamination. While the average value of the Cd reached the level of heavy contamination, the number of uncontaminated sampling points was less than 20%, and the heavy and very strong contamination accounted for 26.34%, which indicated that the soil in the study area was more seriously contaminated with Cd.
As the soil heavy metals in the study area are compounded, the Nemero composite pollution index was further used for the comprehensive evaluation of the degree of pollution. The variation range of the integrated heavy metal pollution degree in the study area is large; the highest value is 75 times that of the lowest value, and the whole area shows heavy pollution. Only 10% of points are non-polluted, while the points with heavy and above pollution account for 28.30%. The spatial distribution is shown in Figure 3, and the high-value areas are located in the vicinity of the processing plant, the diffusion area on the two sides of the drainage channel, and the aggregation area in the north. The spatial distribution is basically the same as those of Cd, Hg, Pb, and Zn.

3.3. Evaluation of the Index of Geoaccumulation

The index of geoaccumulation of As, Cd, Cr, Hg, Pb, and Zn in the soil of the Tianheba cropland were as follows: −1.81~0.55, 1.47~7.78, ~0.92~0.12, 1.22~8.4, 0.11~6.31, and 0.23~6.49, respectively. The mean index of geoaccumulation, from the lowest to the highest, were As < Cr < Pb < Zn < Cd < Hg (Table 4), of which As and Cr were non-polluting, Pb and Zn were moderately polluting, and Cd and Hg were strongly polluting.
According to the results of the index of geoaccumulation grading, it can be seen that As and Cr in the soil in the study area were non-polluting, overall; most of the remaining heavy metal elements showed pollution at a medium level and above pollution. In all points of strong pollution and above, of which Cd and Hg were the most seriously polluting, strong pollution and above strong pollution accounted for 36.59% and 59.51%, respectively. From the evaluation results, As and Cr were not polluting, and the rest of the heavy metals were generally more seriously polluting under the background value of Gansu. This is consistent with the evaluation of the single-factor index. However, there is a difference, Hg is less polluting in the evaluation of the single-factor index, but it is strongly polluting under the evaluation of the index of geoaccumulation, even more so than Cd, which was the most polluting heavy metal. This was probably due to the fact that Hg was more affected by anthropogenic activities.

3.4. Heavy Metal Source Analysis

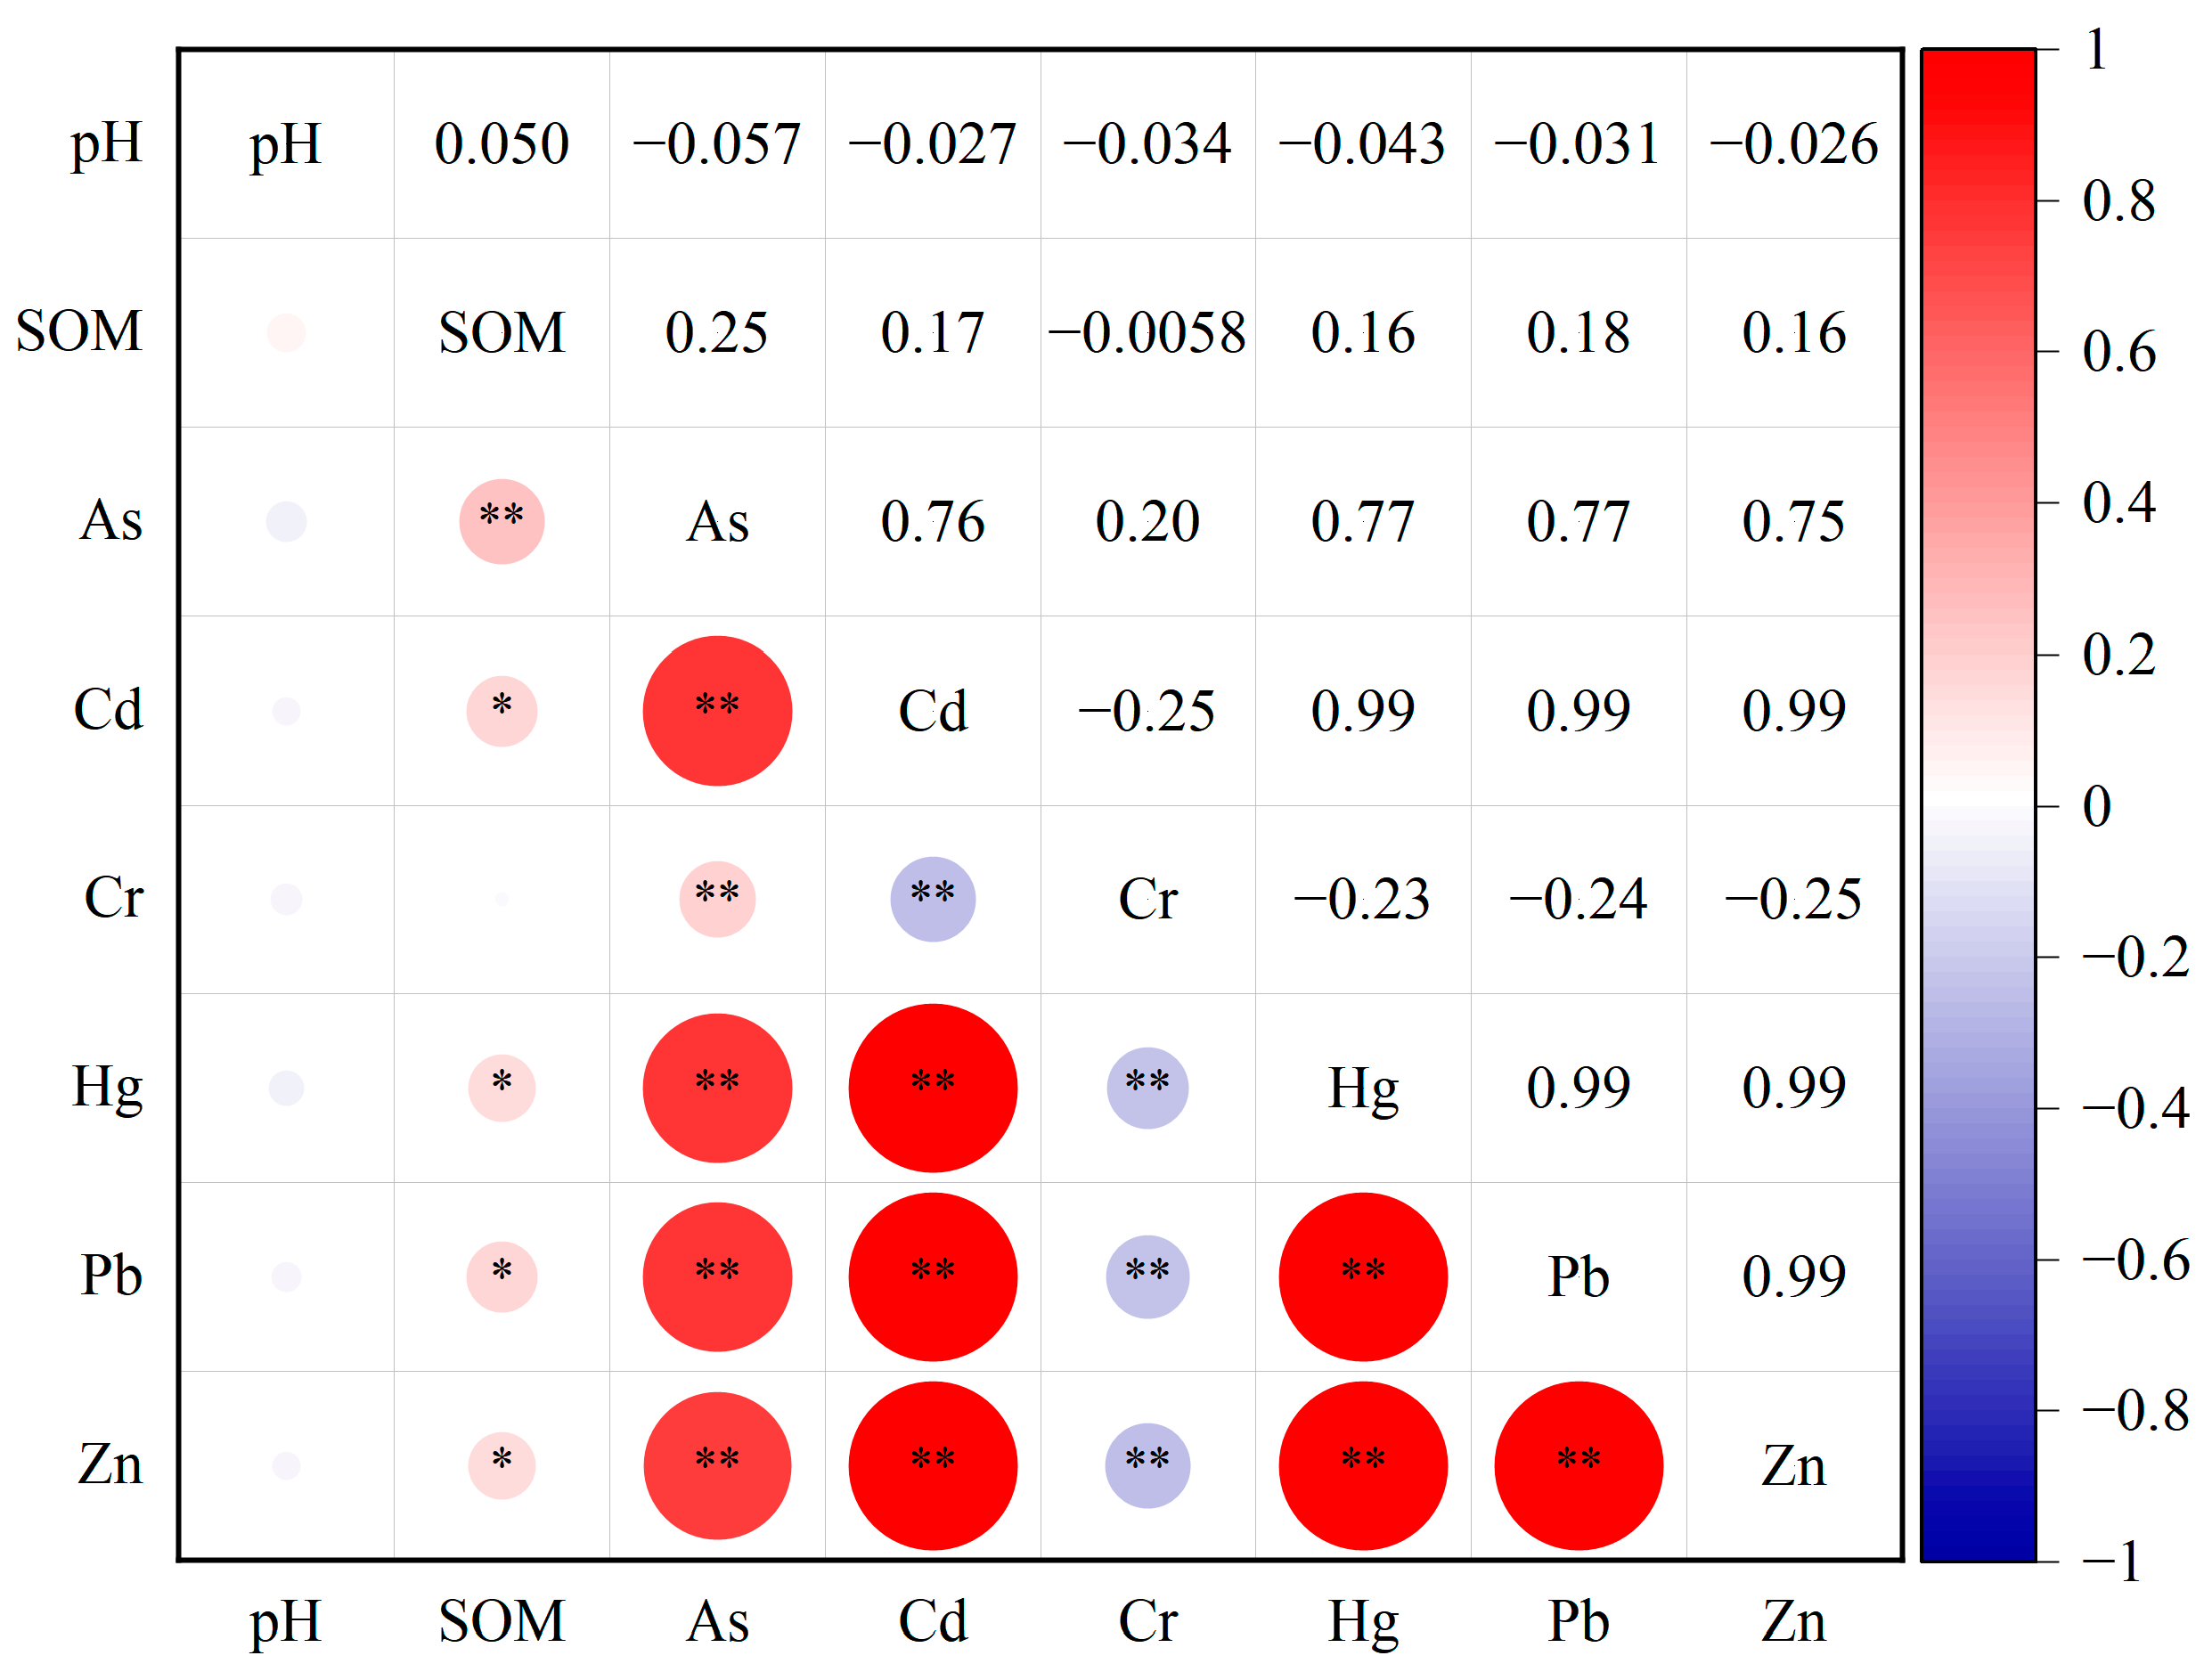
3.4.1. Pearson Correlation Analysis
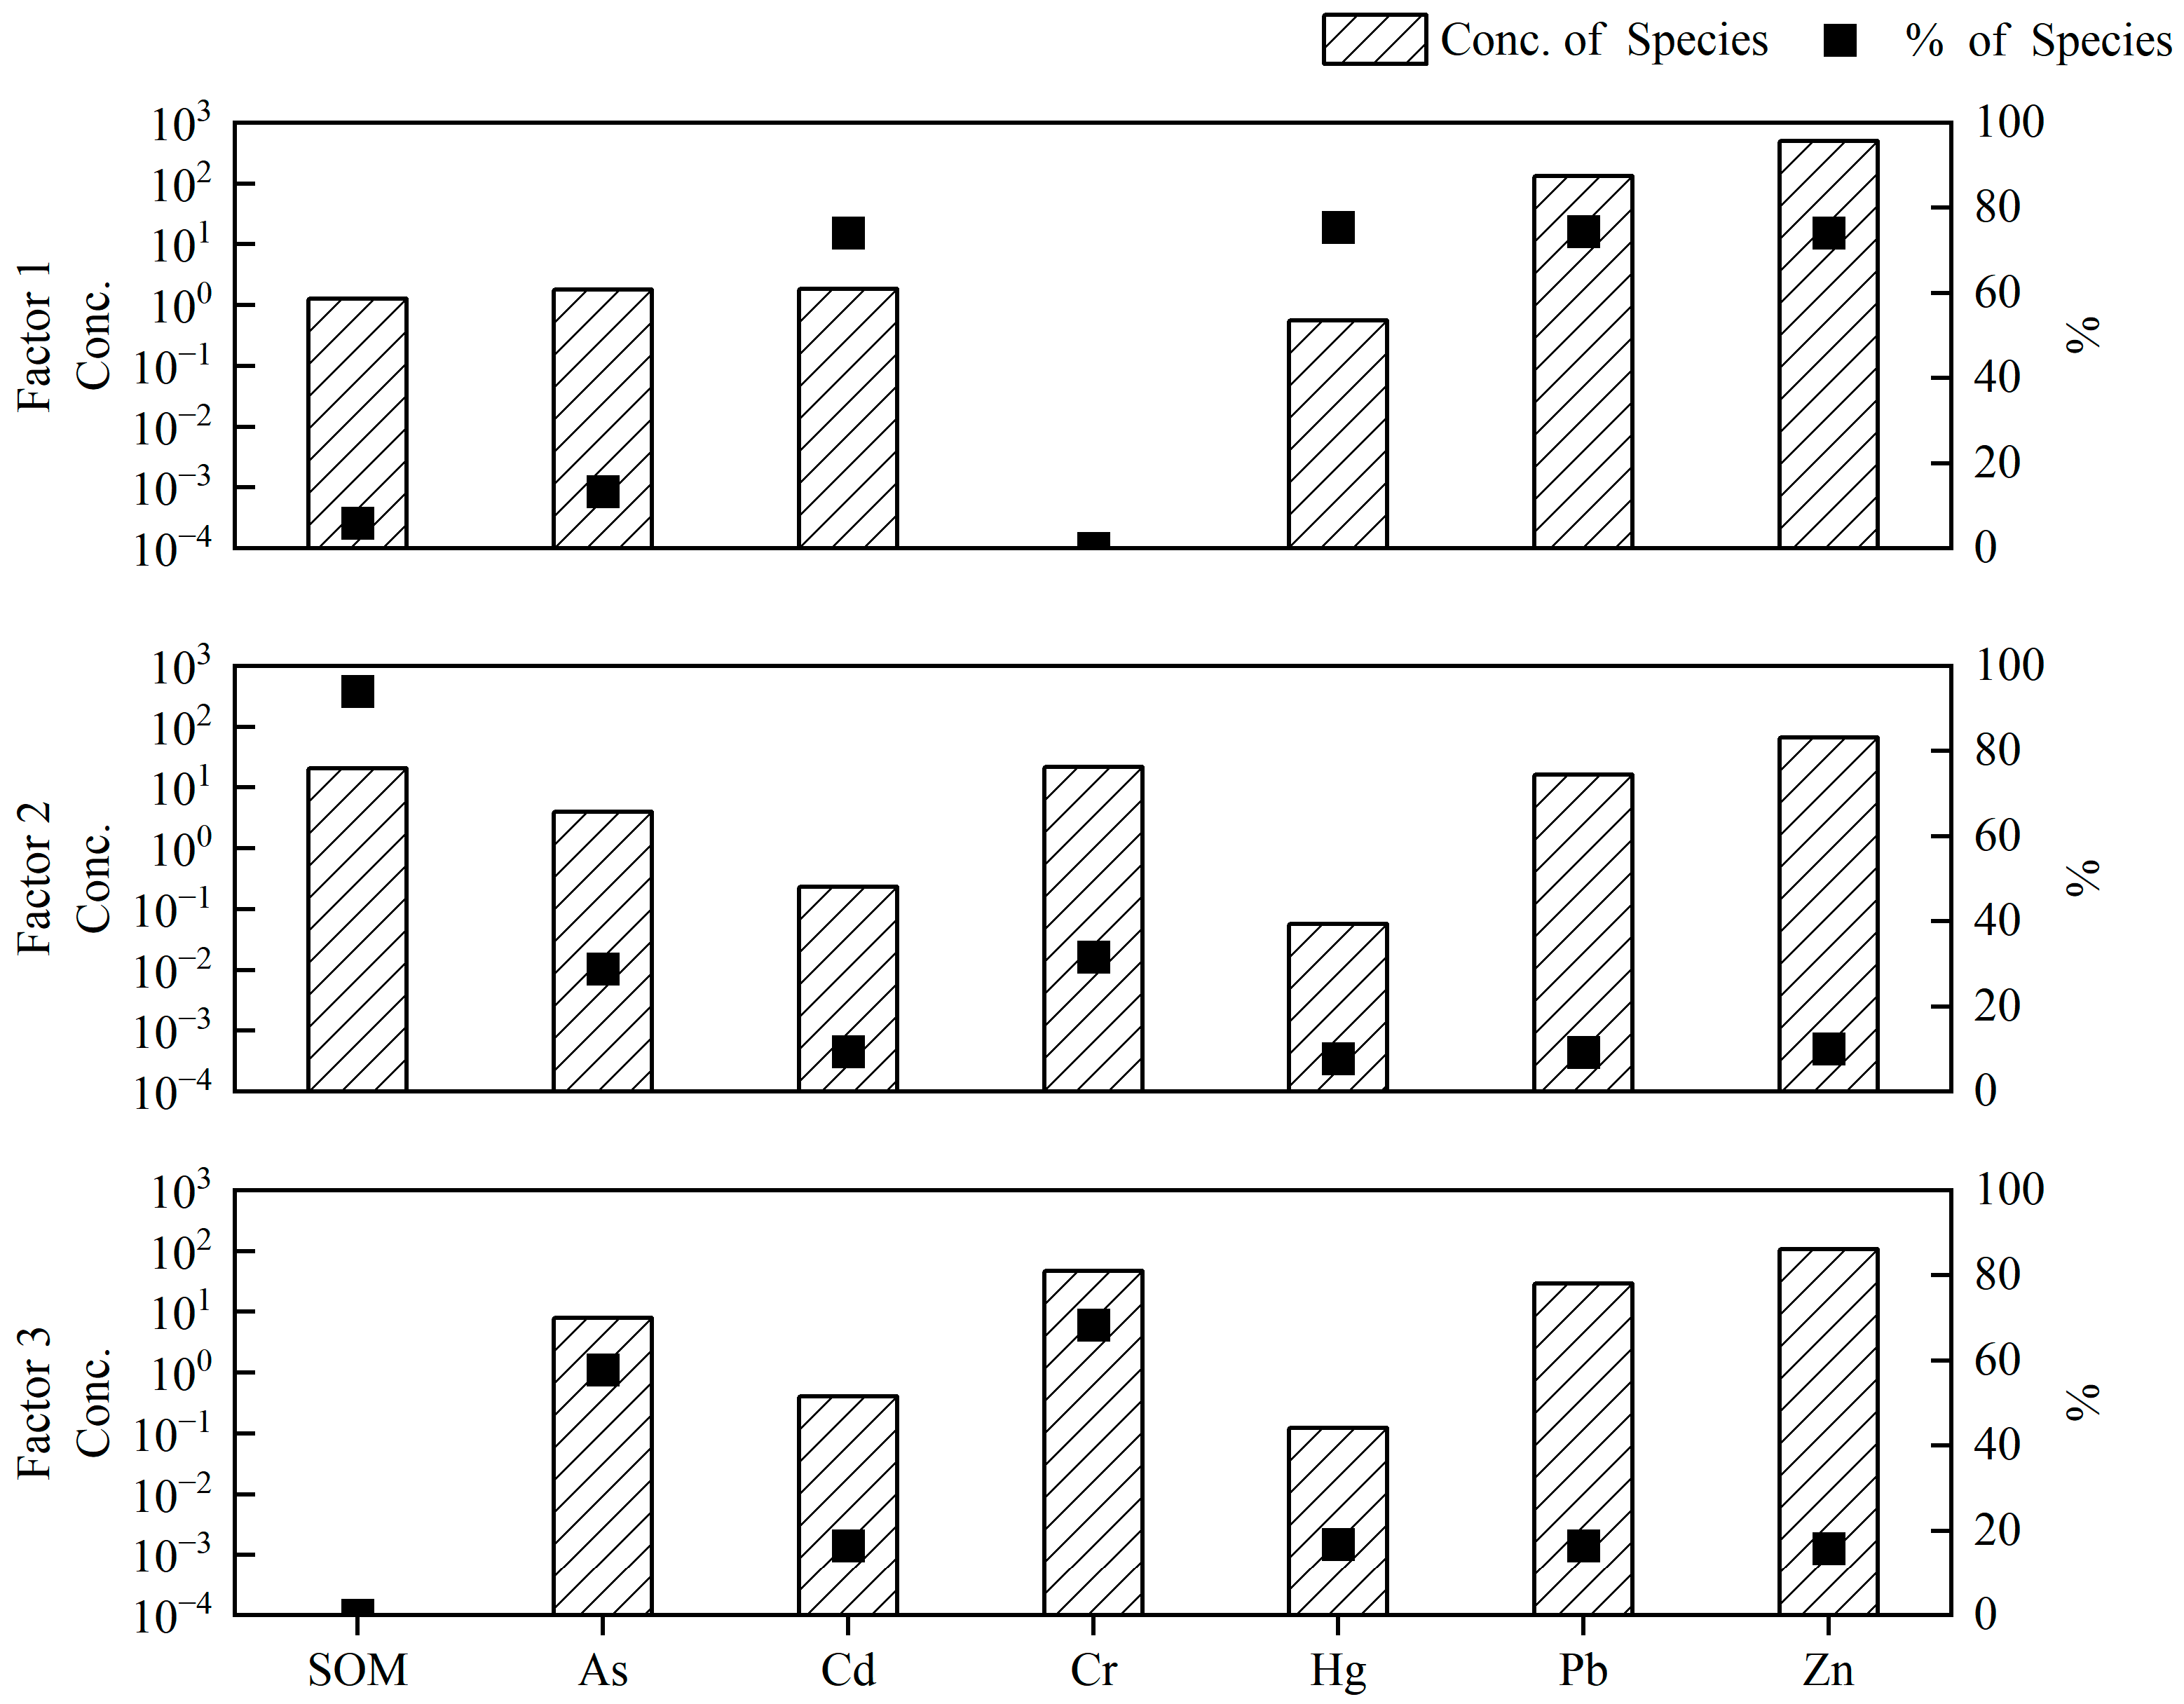
Figure 4 shows the Pearson correlation coefficients between the different heavy metal elements in the soil of Tianheba cropland. Among them, As, Cd, Hg, Pb, and Zn are significantly positively correlated with each other at the 0.01 level, and the correlation coefficients are greater than 0.8, which indicates that these five elements are likely to have a similar source of contamination. Cr is significantly positively correlated with As only at the 0.01 level, but the correlation coefficients are equal to 0.2, and the correlation coefficients are lower and significantly weak, indicating that there are differences between the sources of Cr and the other elements. The correlation coefficient is low, indicating a significantly weak correlation [38]; there is also a significantly negative correlation with the rest of the heavy metals, indicating that there are differences between the sources of Cr and those of the other elements.
The relationship between the soil heavy metal content and the soil physicochemical properties is a result of their interaction with the environmental conditions of the soil, which determine the toxicity of the soil and affect the heavy metal content [4]. The heavy metal contents in the soils of the study area were all negatively correlated and non-significantly correlated with pH, indicating that pH fluctuations in the study area do not affect the migration and aggregation of heavy metals in the soils but are the result of various factors such as mining area, acidic drainage, and soil environment; the relationship between the heavy metal contents and pH may be limited by the soil environment [39,40]. Therefore, pH is not used as a factor in the subsequent analysis of heavy metal sources. With the exception of Cr, the rest of the heavy metals showed a significant positive or a highly significant positive correlation with the SOM, which may be attributable to the fact that the soil organic matter has a good adsorption effect [39].

3.4.2. PMF Analysis

The sources of soil heavy metals are generally the soil-forming parent material and human activities [41]. By analyzing the possible local sources, the number of factors, from two to four, was chosen, and twenty iterations of the operations were performed, respectively. It was found that the simulation was best when the number of factors was three; the 10th result in the model operation was the best. The values of QRobust and Qtrue were 1349.9 and 1431.7, respectively, with a difference of 10% or less, and most of the residuals of the samples were in the range of −3 to 3, which indicated that it had good feasibility. The R2 values of the fit for Zn, As, Cd, Cr, Hg, Pb, and SOM were 0.99, 0.82, 0.99, 0.70, 0.99, 0.99, 0.99, and 0.99, respectively, indicating a good fit.
Figure 5 shows the PMF source-resolved contributions and eigenvalues of the heavy metals in the Tianheba cropland, with factor 1 contributing the most to Zn, Cd, Hg, and Pb with 74.1%, 74.1%, 75.4%, and 74.4%, respectively, and to As with 13.3%. The study area is located in the Pb-Zn metallogenic belt, where the soil is subjected to fouling through wastewater from mineral processing plants. Pb and Zn enter the soil through rain erosion, atmospheric deposition, metal smelting, and transportation, leading to soil enrichment and even contamination [4,42,43]. Hg has been described as a notable indicator of industrial emissions, and metal smelting and combustion are important causes of Hg accumulation [44]. Dust from mining is an important source of Zn and Cd, which are deposited into the soil along with coal combustion and burning dust [45], and groundwater and canal water irrigation containing heavy metals may also be a source of contamination [46]. From 1994 to 2008, three metallurgical enterprises, Huixian Junhui Limited Liability Company Essence Concentrator, Gansu Luoba Group Company Liulin Town Concentrator, and Huixian Xieping Concentrator, caused pollution of the cropland via the uncontrolled discharge of wastewater and wastewater diffusion. The production wastewater and domestic wastewater of the residential areas flowed into the soil through surface runoff and the infiltration of irrigation canals connected to the Yongning River. The surface soil of the cropland in the study area showed a significant positive correlation between Cd, Hg, Pb, and Zn, which had a high degree of similarity in their spatial distributions, so factor 1 is the industrial source related to the mining activities. Factor 2 had the highest contribution of SOM, at 94.1%, and of As and Cr, at 28.9% and 31.7%. SOM can represent soil fertility and nutrients [47], and fertilizers contain relatively high levels of As and Cr [48], so factor 2 is the fertilizer application source. Factor 3 had the highest contribution of As and Cr, at 57.8% and 68.3%, respectively, and the Cr content and spatial distribution were mainly influenced by soil geochemistry [49]. Both the As and the Cr contents were close to the background values with low levels of contamination, so factor 3 was a natural source.

4. Discussion

Through the analysis of six heavy metal elements in the soil of the Tianheba cropland near the lead and zinc processing plant, it was found that under the standard of the Gansu background value, all the sample points of Cd, Hg, Pb, and Zn exceeded the background value, and the average values were 26.60, 37.50, 9.87, and 9.96 times that of the background value, respectively. Combined with the analysis of the single-factor index, it can be determined that the main pollutants in this place are Cd, Zn, and Pb, of which the average value of Cd reaches the level of heavy pollution, and Zn and Pb are both at the level of medium pollution, which proves that the pollution of Cd is the most serious in this site; this conclusion is basically consistent with the conclusions of Lago-Vila [50] and Liu et al. [11], who analyzed an old lead–zinc mine site (Rubiáis) in northwestern Spain. Lago-Vila et al. concluded that the quasi-total content of Zn, Pb, and Cd in the soils of this mining area was very high, far exceeding the general reference level for ecosystem establishment. Liu et al. analyzed the soil of a cultivated area around a lead–zinc mining area in Hebei Province, which was contaminated with heavy metals to varying degrees, with Cd being the most serious. Yu et al. [25] found that the Chongqing paddy soil heavy metals were not whole contaminants, but Cd and Hg also existed to some extent as slight and moderate pollutants, indicating that Cd is not a serious contaminant in the cropland of the mining area but is also one of the main polluting elements in the non-mining areas. In this study, although the one-way index analysis of Hg showed that it was non-polluting, its index of geoaccumulation exceeded the highest pollution of Cd with a coefficient of variation as high as 175.82%, which is similar to the findings of Liu et al. [11]. However, there is a slight difference in the results of the index of geoaccumulation, which may be due to the difference in soil heavy metal pollution due to the different locations. The trend found by the research is consistent; Hg is gradually becoming a global pollutant, and Hg is transformed into methylmercury (MeHg), a highly toxic organic form that affects human health and still needs attention.
According to the relevant information, the primary source of pollution in the Tianheba cropland is the uncontrolled discharge of wastewater. The analysis of the sources enables us to have a better understanding of the main sources for pollution of each type of heavy metal and to target the treatment of each heavy metal. Combined with the spatial distribution map of the soil heavy metals and the Pearson correlation analysis, the spatial distributions of Cd, Hg, Pb, and Zn in the study area were highly similar, with Pearson correlation coefficients greater than 0.8, and the analysis of the pollution sources was consistent with the results of the PMF analysis. The coefficients of variation of Cv of the four elements were greater than 100% and were greatly affected by anthropogenic factors; so, the main sources were related to the mining activities of the industrial sources, whose contribution rates were 74.09%, 75.37%, 74.40%, and 74.11%, respectively. Cr was weakly variable, being mainly affected by natural factors. The overall Cr was not a contaminant in the cultivated soils of Tianheba, with a large difference in spatial distribution and a low correlation with the various metal elements; so, it was mainly from natural sources. As was moderately variable, which was affected by both anthropogenic and natural causes, and it was similar to both Cr and the rest of the heavy metal elements in spatial distribution. But As was significantly weakly correlated with Cr and significantly moderately correlated with the rest of the heavy metals; its source was highly similar to that of Cr in the source analysis, and its contribution rate in factor 1 was only 13.32%. It may be due to the relatively small number of overall points, so that it leads to the model having some bias, or it may be that in the Tianheba cropland, the pollution level of As is low and not polluting overall, so it is mainly a natural source.

5. Conclusions

In this study, the following main conclusions were drawn from descriptive statistics, spatial analysis, contamination assessment, and source analysis of 205 sampling points in the Tianheba cropland in Xieping Village, Hui County:
(1) The overall pollution of heavy metals in the cultivated soil of Tianheba is more serious, with the main polluting elements being Cd, Zn, and Pb, of which Cd is the most serious, followed by Zn, while the index of geoaccumulation of Hg is higher, which also needs to be paid attention to;
(2) The spatial distributions of the heavy metal contents of Zn, As, Cd, Hg, and Pb in the Tianheba cropland were similar. Most of the high-value zones were located near the mine processing plant and the drainage channel between the residential area and the Yongning River, near the mine processing plant, with the localized agglomeration in the northern part of the country, whereas most of the high-value zones of the Cr content were located near the mine processing plant and the Yongning River;
(3) The main sources of soil heavy metal contamination in the Tianheba cropland are industrial sources related to mining, with Cd, Hg, Pb, and Zn contributing the most. As and Cr were mainly from natural sources, and a small amount came from fertilizer application.

Author Contributions

Conceptualization, Y.M. and X.Y.; methodology, Y.M.; validation, J.W., H.D., J.H., and T.W.; writing—original draft preparation, Y.M.; writing—review and editing, Y.M., X.Y., and H.D. All authors have read and agreed to the published version of the manuscript.

Funding

This research was funded by the National Soil Pollution Control Special Funds Program of China (grant number: A9920190301000002001) and the Strategic Action Plan of Oasis Science (grant number: NWNU-LZKX-202301).

Data Availability Statement

Not applicable.

Acknowledgments

The authors would like to thank Xiaoping Wang (The Third Institute of Geology and Mineral Resources Gansu Bureau of Geology and Mineral Resources Exploration and Development, Lanzhou) for providing the relevant data and information in this paper.

Conflicts of Interest

The authors declare no conflict of interest.

References

  1. Sun, Z.H.; Xie, X.D.; Wang, P.; Hu, Y.A.; Cheng, H.F. Heavy metal pollution caused by small-scale metal ore mining activities: A case study from a polymetallic mine in South China. Sci. Total Environ. 2018, 639, 217–227. [Google Scholar] [CrossRef] [PubMed]
  2. Atuchin, V.V.; Asyakina, L.K.; Serazetdinova, Y.R.; Frolova, A.S.; Velichkovich, N.S.; Prosekov, A.Y. Microorganisms for Bioremediation of Soils Contaminated with Heavy Metals. Microorganisms 2023, 11, 864. [Google Scholar] [CrossRef] [PubMed]
  3. Baidourela, A.; Liu, L.; Zhayimu, K.; Pan, C.; Manglike, R.; Peng, X.; Abudukadeer, M. Distribution characteristics and correlation of heavy metals in soil and total suspended particles of Urumqi City. Int. J. Environ. Sci. Technol. 2022, 19, 4947–4958. [Google Scholar] [CrossRef]
  4. Jia, L.; Liang, H.L.; Fan, M.; Wang, Z.; Guo, S.S.; Chen, S. Spatial Distribution Characteristics and Source Appointment of Heavy Metals in Soil in the Areas Affected by Non-Ferrous Metal Slag Field in the Dry-Hot Valley. Appl. Sci. 2022, 12, 9475. [Google Scholar] [CrossRef]
  5. Zhou, W.; Li, L.L.; Zhou, X.; Shi, P.Q.; Huang, D.Q. Influence factor analysis of soil heavy metal based on geographic detector and its pollution risk assessment. Ecol. Environ. Sci. 2021, 30, 173–180. [Google Scholar] [CrossRef]
  6. Liu, M.X.; Han, Z.Q. Distribution and Bioavailability of Heavy Metals in Soil Aggregates from the Fenhe River Basin, China. Bull. Environ. Contam. Toxicol. 2020, 104, 532–537. [Google Scholar] [CrossRef]
  7. Zhao, F.J.; Ma, Y.B.; Zhu, Y.G.; Tang, Z.; McGrath, S.P. Soil Contamination in China: Current Status and Mitigation Strategies. Environ. Sci. Technol. 2015, 49, 750–759. [Google Scholar] [CrossRef]
  8. Chen, H.Y.; Teng, Y.G.; Lu, S.J.; Wang, Y.Y.; Wang, J.S. Contamination features and health risk of soil heavy metals in China. Sci. Total Environ. 2015, 512, 143–153. [Google Scholar] [CrossRef]
  9. Jiang, C.; Jun, Z.; Gao, L.H. Sources and Ecological Risk Assessment of Heavy Metal(loid)s in Agricultural Soils of Huzhou, China. Soil Sediment Contam. 2015, 24, 437–453. [Google Scholar] [CrossRef]
  10. Song, H.F.; Wu, K.N.; Li, T.; Shi, W.Y.; Liu, H.R. The Spatial Distribution and Influencing Factors of Heavy Metals in the Cold Black Soil Region: A Case of Hailun County. Chin. J. Soil Sci. 2018, 49, 1480–1486. [Google Scholar] [CrossRef]
  11. Liu, F.; Li, L.F.; Liu, Y.B.; Wei, J.; Hou, Z.S.; Chen, R.X.; Zhang, X.R. Evaluation and sources of heavy metal pollution in soils of cultivated land around a lead-zinc mine area in Hebei province. J. Arid. Land Resour. Environ. 2023, 37, 136–142. [Google Scholar] [CrossRef]
  12. Yang, Y.; Guo, T.T.; Liu, X.L.; Tie, B.Q. Spatial Distribution Characteristics and Assessment of Heavy Metal Pollution in Cultivated Soil of Agricultural Small Watershed in Typical Mining Area in South China. Environ. Sci. 2023, 44, 1602–1610. [Google Scholar] [CrossRef]
  13. Zhan, H.Y.; Jiang, Y.F.; Yuan, J.M.; Hu, X.F.; Nartey, O.D.; Wang, B.L. Trace metal pollution in soil and wild plants from lead-zinc smelting areas in Huixian County, Northwest China. J. Geochem. Explor. 2014, 147, 182–188. [Google Scholar] [CrossRef]
  14. Zhang, H.Y.; Cui, W.G.; Huang, Y.M.; Li, Y.L.; Zhong, X.; Wang, L. Evaluation and source analysis of heavy metal pollution of farmland soil around the mining area of karst region of central Guizhou Province. Acta Sci. Circumstantiae 2022, 42, 412–421. [Google Scholar] [CrossRef]
  15. Cao, X.M.; Yang, H.D. Evaluation on the polluntion of heavy metals in the cultivated soil in Hui County of Gansu Province. J. Gansu Agric. Univ. 2015, 50, 134–140. [Google Scholar] [CrossRef]
  16. NY/T395-2012; Technical Rules for Monitroing of Environmental Quality of Farmland Soil. China Agriculture Press: Beijing, China, 2012.
  17. HJ/T166-2004; The Technical Specification for Soil Environmental Monitoring. China Environment Science Press: Beijing, China, 2004.
  18. NY/T1377-2007; Determination of pH in Soil. China Agriculture Press: Beijing, China, 2007.
  19. NY/T1121.6-2006; Method for Determination of Soil Organic Matter. China Agriculture Press: Beijing, China, 2006.
  20. GB/T22105-2008; Soil Quality—Analysis of Total Mercury, Arsenic and Lead Contents—Atomic Fluorescence Spectrometry. Standards Press of China: Beijing, China, 2008.
  21. GB/T14506.30-2010; Methods for Chemical Analysis of Silicate Rocks—Part 30: Determination of 44 Elements. Standards Press of China: Beijing, China, 2010.
  22. Zhang, J.T.; Sun, H. Differences of Nemerow Index Method and Fuzzy Comprehensive Evaluation Method in Evaluation Heavy Metal Pollution in Soil. Adm. Tech. Environ. Monit. 2016, 28, 27–31. [Google Scholar]
  23. GB 15618-2018; Soil Environmental Quality Risk Control Standard for Soil Contamination of Agricultural Land. China Environment Science Press: Beijing, China, 2018.
  24. Wang, L.; Zeraatpisheh, M.; Wei, Z.D.; Xu, M. Heavy metal pollution and risk assessment of farmland soil around abandoned domestic waste dump in Kaifeng City. Front. Environ. Sci. 2022, 10, 946298. [Google Scholar] [CrossRef]
  25. Yu, H.Y.; Tang, Z.Q.; Wang, N.; Zhang, W.; Fu, T.T.; Zeng, T.T.; Huang, Y.C.; Yan, Y.H. Characteristic analysis and risk assessment of heavy metal pollution of paddy soil in Chongqing. Southwest China J. Agric. Sci. 2023, 36, 1066–1073. [Google Scholar] [CrossRef]
  26. Ma, J.; Shen, Z.J.; Zhang, P.P.; Liu, P.; Liu, J.Z.; Sun, J.; Wang, L.L. Pollution Characteristics and Source Apportionment of Heavy Metals in Farmland Soils Around the Gangue Heap of Coal Mine Based on APCS-MLR and PMF Receptor Model. Environ. Sci. 2023, 44, 2192–2203. [Google Scholar] [CrossRef]
  27. Mama, C.N.; Nnaji, C.C.; Igwe, O.; Ozioko, O.H.; Ezugwu, C.K.; Ugwuoke, I.J. Assessment of heavy metal pollution in soils: A case study of Nsukka metropolis. Environ. Forensics 2022, 23, 389–408. [Google Scholar] [CrossRef]
  28. Paatero, P.; Tapper, U. Positive matrix factorization:A non-negative factor model with optimal utilization of error estimates of data values. Environmetrics 1994, 5, 111–126. [Google Scholar] [CrossRef]
  29. Paatero, P. Least squares formulation of robust non-negative factor analysis. Chemom. Intell. Lab. Syst. 1997, 37, 23–35. [Google Scholar] [CrossRef]
  30. Gao, J.J.; Tian, H.Z.; Cheng, K.; Lu, L.; Wang, Y.X.; Wu, Y.; Zhu, C.Y.; Liu, K.Y.; Zhou, J.R.; Liu, X.G.; et al. Seasonal and spatial variation of trace elements in multi-size airborne particulate matters of Beijing, China: Mass concentration, enrichment characteristics, source apportionment, chemical speciation and bioavailability. Atmos. Environ. 2014, 99, 257–265. [Google Scholar] [CrossRef]
  31. Ren, J.H.; Fan, J.; He, P.L.; Tang, J.; Liao, Q.L.; Xu, W.W.; Hao, S.F. Pollution characteristics and source apportionment of heavy metals in soil around a typical industrial enterprises. Environ. Pollut. Control 2023, 45, 855–861+869. [Google Scholar] [CrossRef]
  32. Hu, Y.N.; Cheng, H.F. Application of Stochastic Models in Identification and Apportionment of Heavy Metal Pollution Sources in the Surface Soils of a Large-Scale Region. Environ. Sci. Technol. 2013, 47, 3752–3760. [Google Scholar] [CrossRef] [PubMed]
  33. Guo, H.; Sun, Y.J.; Wang, X.L. Spatial distribution characteristics and source analysis of soil heavy metals in county-level city. Acta Sci. Circumstantiae 2022, 42, 287–297. [Google Scholar] [CrossRef]
  34. Martín, J.A.R.; Arias, M.L.; Corbí, J.M.G. Heavy metals contents in agricultural topsoils in the Ebro basin (Spain). Application of the multivariate geoestatistical methods to study spatial variations. Environ. Pollut. 2006, 144, 1001–1012. [Google Scholar] [CrossRef]
  35. Zhou, M.; Liao, B.; Shu, W.S.; Yang, B.; Lan, C.Y. Pollution Assessment and Potential Sources of Heavy Metals in Agricultural Soils around Four Pb/Zn Mines of Shaoguan City, China. Soil Sediment Contam. 2015, 24, 76–89. [Google Scholar] [CrossRef]
  36. Chai, L.; Wang, X.; Ma, L. Sources appointment of heavy metals in cultivated soils of Lanzhou based on PMF models. China Environ. Sci. 2020, 40, 3919–3929. [Google Scholar] [CrossRef]
  37. Liu, Y. Study on the Spatial Distribution of Soil Lead Content in California Based on Ordinary Kriging Interpolation. Agric. Technol. Equip. 2022, 39, 41–43. [Google Scholar] [CrossRef]
  38. Natasha, N.; Shahid, M.; Murtaza, B.; Bibi, I.; Khalid, S.; Al-Kahtani, A.A.; Naz, R.; Ali, E.F.; Niazi, N.K.; Rinklebe, J.; et al. Accumulation pattern and risk assessment of potentially toxic elements in selected wastewater-irrigated soils and plants in Vehari, Pakistan. Environ. Res. 2022, 214, 114033. [Google Scholar] [CrossRef]
  39. Wang, Z.Q.; Hong, C.; Xing, Y.; Wang, K.; Li, Y.F.; Feng, L.H.; Ma, S.L. Spatial distribution and sources of heavy metals in natural pasture soil around copper-molybdenum mine in Northeast China. Ecotoxicol. Environ. Saf. 2018, 154, 329–336. [Google Scholar] [CrossRef] [PubMed]
  40. Yang, Z.J.; Jing, F.; Chen, X.M.; Liu, W.; Guo, B.L.; Lin, G.Z.; Huang, R.H.; Liu, W.X. Spatial distribution and sources of seven available heavy metals in the paddy soil of red region in Hunan Province of China. Environ. Monit. Assess. 2018, 190, 611. [Google Scholar] [CrossRef] [PubMed]
  41. Liao, Z.Y.; Li, J.Q.; Shen, Z.J.; Li, C.X.; Luo, C.Z.; Mei, N.; Zhang, C.; Wang, D.Y. Assessment and Source Analysis of Heavy Metal Pollution in Arable Land Around an lron Ore Mining Area in Chongqing. Environ. Sci. 2023, 1–16. [Google Scholar] [CrossRef]
  42. Chen, H.M.; Zheng, C.R.; Tu, C.; Zhu, Y.G. Heavy Metal Pollution in Soils in China: Status and Countermeasures. AMBIO J. Hum. Environ. 1999, 28, 130–134+207. [Google Scholar]
  43. Yang, S.Y.; He, M.J.; Zhi, Y.Y.; Chang, S.X.; Liu, X.M.; Xu, J.M. An integrated analysis on source-exposure risk of heavy metals in agricultural soils near intense electronic waste recycling activities. Environ. Int. 2019, 133, 105239. [Google Scholar] [CrossRef]
  44. Rachwal, M.; Magieral, T.; Wawer, M. Coke industry and steel metallurgy as the source of soil contamination by technogenic magnetic particles, heavy metals and polycyclic aromatic hydrocarbons. Chemosphere 2015, 138, 863–873. [Google Scholar] [CrossRef]
  45. Sun, L.; Guo, D.K.; Liu, K.; Meng, H.; Zheng, Y.J.; Yuan, F.Q.; Zhu, G.H. Levels, sources, and spatial distribution of heavy metals in soils from a typical coal industrial city of Tangshan, China. Catena 2019, 175, 101–109. [Google Scholar] [CrossRef]
  46. Song, T.J.; Su, X.S.; He, J.; Liang, Y.K.; Zhou, T. Source apportionment and health risk assessment of heavy metals in agricultural soils in Xinglonggang, Northeastern China. Hum. Ecol. Risk Assess. 2018, 24, 509–521. [Google Scholar] [CrossRef]
  47. Zhao, X.T.; Hui, C.M.; Zhu, S.H.; Liu, W.Y.; Cai, C.L.; Zhang, W.J.; Tu, D.D.; Zhu, L.Y. Response of Soil Organic Matter Content and Its Infrared Spectral Characteristics to Different Planting Durations of Dendrocalamus brandisii. Acta Agric. Univ. Jiangxiensis 2022, 44, 1448–1456. [Google Scholar] [CrossRef]
  48. Li, Z.Y.; Xiao, M.; Ren, D.; Ren, S.; Xiong, B. Heavy metal source analysis of the farmland soil of Zhijiang and Dangyang. Acta Sci. Circumstantiae 2023, 43, 398–406. [Google Scholar] [CrossRef]
  49. Hanesch, M.; Scholger, R.; Dekkers, M.J. The application of fuzzy C-means cluster analysis and non-linear mapping to a soil data set for the detection of polluted sites. Phys. Chem. Earth Part A Solid Earth Geod. 2001, 26, 885–891. [Google Scholar] [CrossRef]
  50. Lago-Vila, M.; Rodriguez-Seijo, A.; Arenas-Lago, D.; Andrade, L.; Vega, M.F.A. Heavy metal content and toxicity of mine and quarry soils. J. Soils Sediments 2017, 17, 1331–1348. [Google Scholar] [CrossRef]
Figure 1. Study area overview and sampling locations.
Land 12 01945 g001
Figure 2. Spatial distribution of heavy metals and soil properties in the surface soils of the study area.
Land 12 01945 g002
Figure 3. Spatial distribution of the Nemero composite index of heavy metal elements in arable soils at Tianheba.
Land 12 01945 g003
Figure 4. Pearson correlation analysis between different soil indicators. Notes: ** correlation is significant at the 0.01 level (2-tailed); * correlation is significant at the 0.05 level (2-tailed).
Land 12 01945 g004
Figure 5. Characteristic values and contribution of PMF source analysis of heavy metals in surface soils of the Tianheba cropland.
Land 12 01945 g005
Table 1. Test methods for heavy metals of soil samples.
ItemAnalysis MethodsTest StandardTesting EquipmentMDL (mg/kg)
pHPrecision pH meterNY/T1377-2007 [18]PHS-3 Cacidimeter/
SOMVOLNY/T1121.6-2006 [19]Buret0.12 g/kg
AsHG-AFSGB/T22105-2008 [20]AFS-830a Dual Channel Atomic Fluorescence Photometer0.1
CdICP-MSGB/T22105-2008NexION 300X ICP Plasma Mass Spectrometer0.02
CrXRFGB/T14506.30-2010 [21]ZSX Primus II X-Ray Fluorescence Spectrometer4
HgHG-AFSGB/T22105-2008AFS-830a Dual Channel Atomic Fluorescence Photometer0.002
PbXRFGB/T14506.30-2010ZSX Primus II X-Ray Fluorescence Spectrometer0.06
ZnXRFGB/T14506.30-2010ZSX Primus II X-Ray Fluorescence Spectrometer1
Table 2. Statistics of heavy metal concentrations and soil properties of soil samples (n = 205) and comparisons with various standards (mg/kg).
ItemMin.Max.MeanS.DC.V (%)B.VGNGS.VCNC
pH7.699.118.320.192.29----
SOM g/kg8.9279.121.797.7635.59----
As9.1447.114.155.4538.521.417306
Cd0.39312.54.16166.060.0942050.6166
Cr55.596.869.895.357.6670.2772500
Hg0.0710.10.751.33175.820.022053.48
Pb30.42238185.59317.1170.8618.820517045
Zn1229376691.151243.55179.9369.420530076
Notes: Min, minimum; Max, maximum; S.D, standard deviation; C.V, coefficient of variation. B.VG and NG denote the heavy metal background values in Gansu Province and the quantity of soil samples that exceed these values, respectively. S.VC and NC denote the standard values for heavy metals and quantity of soil samples that exceed these values, respectively, with reference to the Environmental Quality Risk Control Standard for Soil Contamination of Agricultural Land (GB 15618-2018).
Table 3. The Nemero single-factor pollution index and comprehensive pollution index of heavy metal elements in the Tianheba cropland.
Pollution IndexPAsPCdPCrPHgPPbPZnPN
IndexMin.0.30.650.220.020.180.410.51
Max.1.5751.670.392.9713.1631.2538.27
Mean0.474.170.280.221.092.33.12
Pollution evaluation gradeNo97.0719.0210096.178.0562.9310.73
Light2.9345.3702.935.3714.6327.8
Medium09.2700.987.322.9333.17
Strong06.83005.857.325.37
Extremely019.51003.4112.222.93
Table 4. Igeo and its number of graded points in the Tianheba cropland.
ItemMin.Max.MeanPercentage of Grading Points (%)
≤00~11~22~33~44~5>5
As−1.810.55−1.2597.562.4400000
Cd1.477.783.230014.6348.7813.178.2915.12
Cr−0.92−0.12−0.6100000000
Hg1.228.43.71004.8835.6129.7610.7319.02
Pb0.116.311.74040.4931.228.299.277.323.41
Zn0.236.491.76041.4630.738.298.786.833.9
Disclaimer/Publisher’s Note: The statements, opinions and data contained in all publications are solely those of the individual author(s) and contributor(s) and not of MDPI and/or the editor(s). MDPI and/or the editor(s) disclaim responsibility for any injury to people or property resulting from any ideas, methods, instructions or products referred to in the content.

