Article

Assessing the Impact of Rural Multifunctionality on Non-Point Source Pollution: A Case Study of Typical Hilly Watershed, China

1
Nanjing Institute of Geography and Limnology, Chinese Academy of Sciences, Nanjing 210008, China
2
College of Resources and Environment, University of Chinese Academy of Sciences, Beijing 100049, China
3
Key Laboratory of Watershed Geographic Sciences, Nanjing Institute of Geography and Limnology, Chinese Academy of Sciences, Nanjing 210008, China
*
Author to whom correspondence should be addressed.
Land 2023, 12(10), 1936; https://doi.org/10.3390/land12101936
Submission received: 4 September 2023 / Revised: 13 October 2023 / Accepted: 14 October 2023 / Published: 18 October 2023

Abstract

:
In the context of rural development and transformation, it is crucial to identify the impact of rural multifunctionality on non-point source (NPS) pollution. This study applies the Soil and Water Assessment Tool (SWAT), geographical detector, and principal component analysis in Liyang, a typical hilly subbasin in China, in order to assess the rural multifunctional development that influences the spatial differentiation of NPS pollution and detect the interactive effects of rural multifunctionality. The R2 and NSE demonstrated that the calibrated SWAT model successfully simulated NPS pollution in Liyang. The village scale was identified as the optimal research scale for examining the rural multifunctional development on NPS pollution distribution. The rural multifunctional indicators, such as the proportion of vegetable farming, sowing area, and grain farming, would influence NPS distribution. The number of family farming cooperatives, the area of pond farming, and the nature reserves area were also significant. The rural multifunctionality in Liyang could be classified into five categories: grain production, mixed agriculture, ecological conservation, leisure tourism, and industry and business function. The superposition of rural multifunctionality has a strengthening effect on NPS pollution, especially when the ecological conservation function is combined with the grain production or modern agriculture function. The study could provide NPS pollution control strategies for policymaking in rural multifunctional development.

1. Introduction

With ongoing socioeconomic development in rural China, the primary function of rural area has changed from solely agricultural production to diversification, leading to corresponding alterations in the rural landscape and environmental responses [1,2]. Non-point source (NPS) pollution is the main source of eutrophication, which refers to diffuse pollution from agriculture, street runoff, and atmospheric deposition [3]. The reasons for NPS pollution in China include excess fertilizer, policy factors, and social and environmental changes [4].
As China’s rural development enters a new phase of transformation and upgrading, rural areas have been significantly reconfigured in the spatial pattern [5]. The rural multifunctionality has also been constantly strengthened [6]. A rural territory system is composed of economic, social, and environmental sub-systems, which possesses complicated characteristics [7]. From the traditional productionist perspective, the rural territory just has a single function that provides food and natural resources. With the development of urbanization and industrialization, the interactions between urban and rural territorial systems are gradually increasing. The flow of socioeconomic factors, such as population and capital, has driven the emergence of rural industries, business, and tourism. The ecological function of rural space has been paid more attention. The connotation of multifunctional development in rural areas is gradually enriched [7]. In Europe, the potential rural functions were identified as four types: intensive farming, off-farm employment, countryside tourism and biodiversity preservation [8]. In China, Liu et al. [9] suggested that the diverse needs of society and the different environments make the rural space have various functions, which can be summarized into four types: economic development, food production, social security and ecological conservation. However, environmental problems, especially NPS pollution, have gradually emerged during the process of rural multifunctional development [10]. Agricultural NPS pollution accounted for more than half of the total nitrogen (TN) and total phosphorus (TP) pollutants [11,12].
NPS pollution is characterized by spatial extensiveness, timing indeterminacy, and hysteresis, resulting in the difficulty in estimation [13,14]. The common methods of estimating NPS pollution load generally include cross-sectional measurement [15], empirical statistical models such as output coefficient, inventory analysis [16], and physically based models [17]. Among them, the cross-sectional measurement method is often limited by the discontinuity of monitoring periods, monitoring errors, and other factors. The empirical statistical model is used to multiply the unit pollution production coefficient of different land types to obtain the pollutant output. This method does not take into account the migration and transformation mechanism of NPS pollutants in soil and rivers. The mechanism model generalizes the actual NPS pollution formation process such as regional rainfall runoff, soil erosion, surface solute leaching and soil solute seepage with the large number of mathematical equations, and then it determines the key parameters to estimate the load [18]. The Soil and Water Assessment Tool (SWAT), one of the physically based models, was selected due to its advantages in working with spatial data, which is also suitable for urban–rural transitional areas with mixed land use [19]. Previous research has proved that the calibrated SWAT models could well simulate the transport processes and intensity of NPS pollution loads [20]. Several scholars have conducted SWAT simulations on national and local scales [21,22]. Relevant scholars also have conducted some applicability simulation in Liyang, confirming the model’s effectiveness [23,24]. As the process of generation and transport could be influenced by different landscapes, management practices and other natural conditions and socio-economic activities, NPS pollution loads have represented significant spatial heterogeneity [25].
The impact factors of environmental change can be classified into direct and indirect factors. The former refers to processes directly affecting the ecosystem, including physical, chemical, and biological elements. The latter emphasizes socioeconomic factors, such as demographics, economics, management practices, technology and culture, which have important implications for environmental protection [26]. The research on the effect of land use, farming practices and landscape changes on NPS pollution has yielded profound and substantial results [27,28]. Most studies concentrated on NPS pollution with the consideration of direct factors, thus neglecting the socioeconomic changes of rural multifunctional development and NPS pollution. They ignored the comprehensive effects of rural multifunctionality in the transforming phase [29]. Existing hydrological models focus more on natural boundaries, such as subbasins or hydrological response units (HRUs). However, the socioeconomic survey, policymaking and local planning are often conducted based on administrative boundaries. This results in a discrepancy between model simulations and policy implementation. The relationship between NPS and rural transformation was investigated through the inventory analysis method in the plain river network [30]. Although plenty of research has been conducted in plain areas, the research on the relationship between rural development and NPS in the hilly area is still inadequate because of the complicated hydrological and nutrient processes.
To fill the gap in the literature, this study focuses on the spatial association between rural multifunction and NPS pollution in Liyang, which is a typical hilly watershed in China. This study aimed to explore the relationship between rural multifunctionality and NPS pollution followed by the process. This study aims to address the following three questions: (1) What is the optimal research scale for identifying the relationship between rural multifunctional development and NPS pollution? (2) What are the primary rural multifunctional indicators influencing the spatial heterogeneity of NPS pollution? (3) In rural multifunctional development, how does the interaction between different functions impact NPS pollution? This research aims to propose effective NPS control strategies in the context of rural multifunctional development in China.

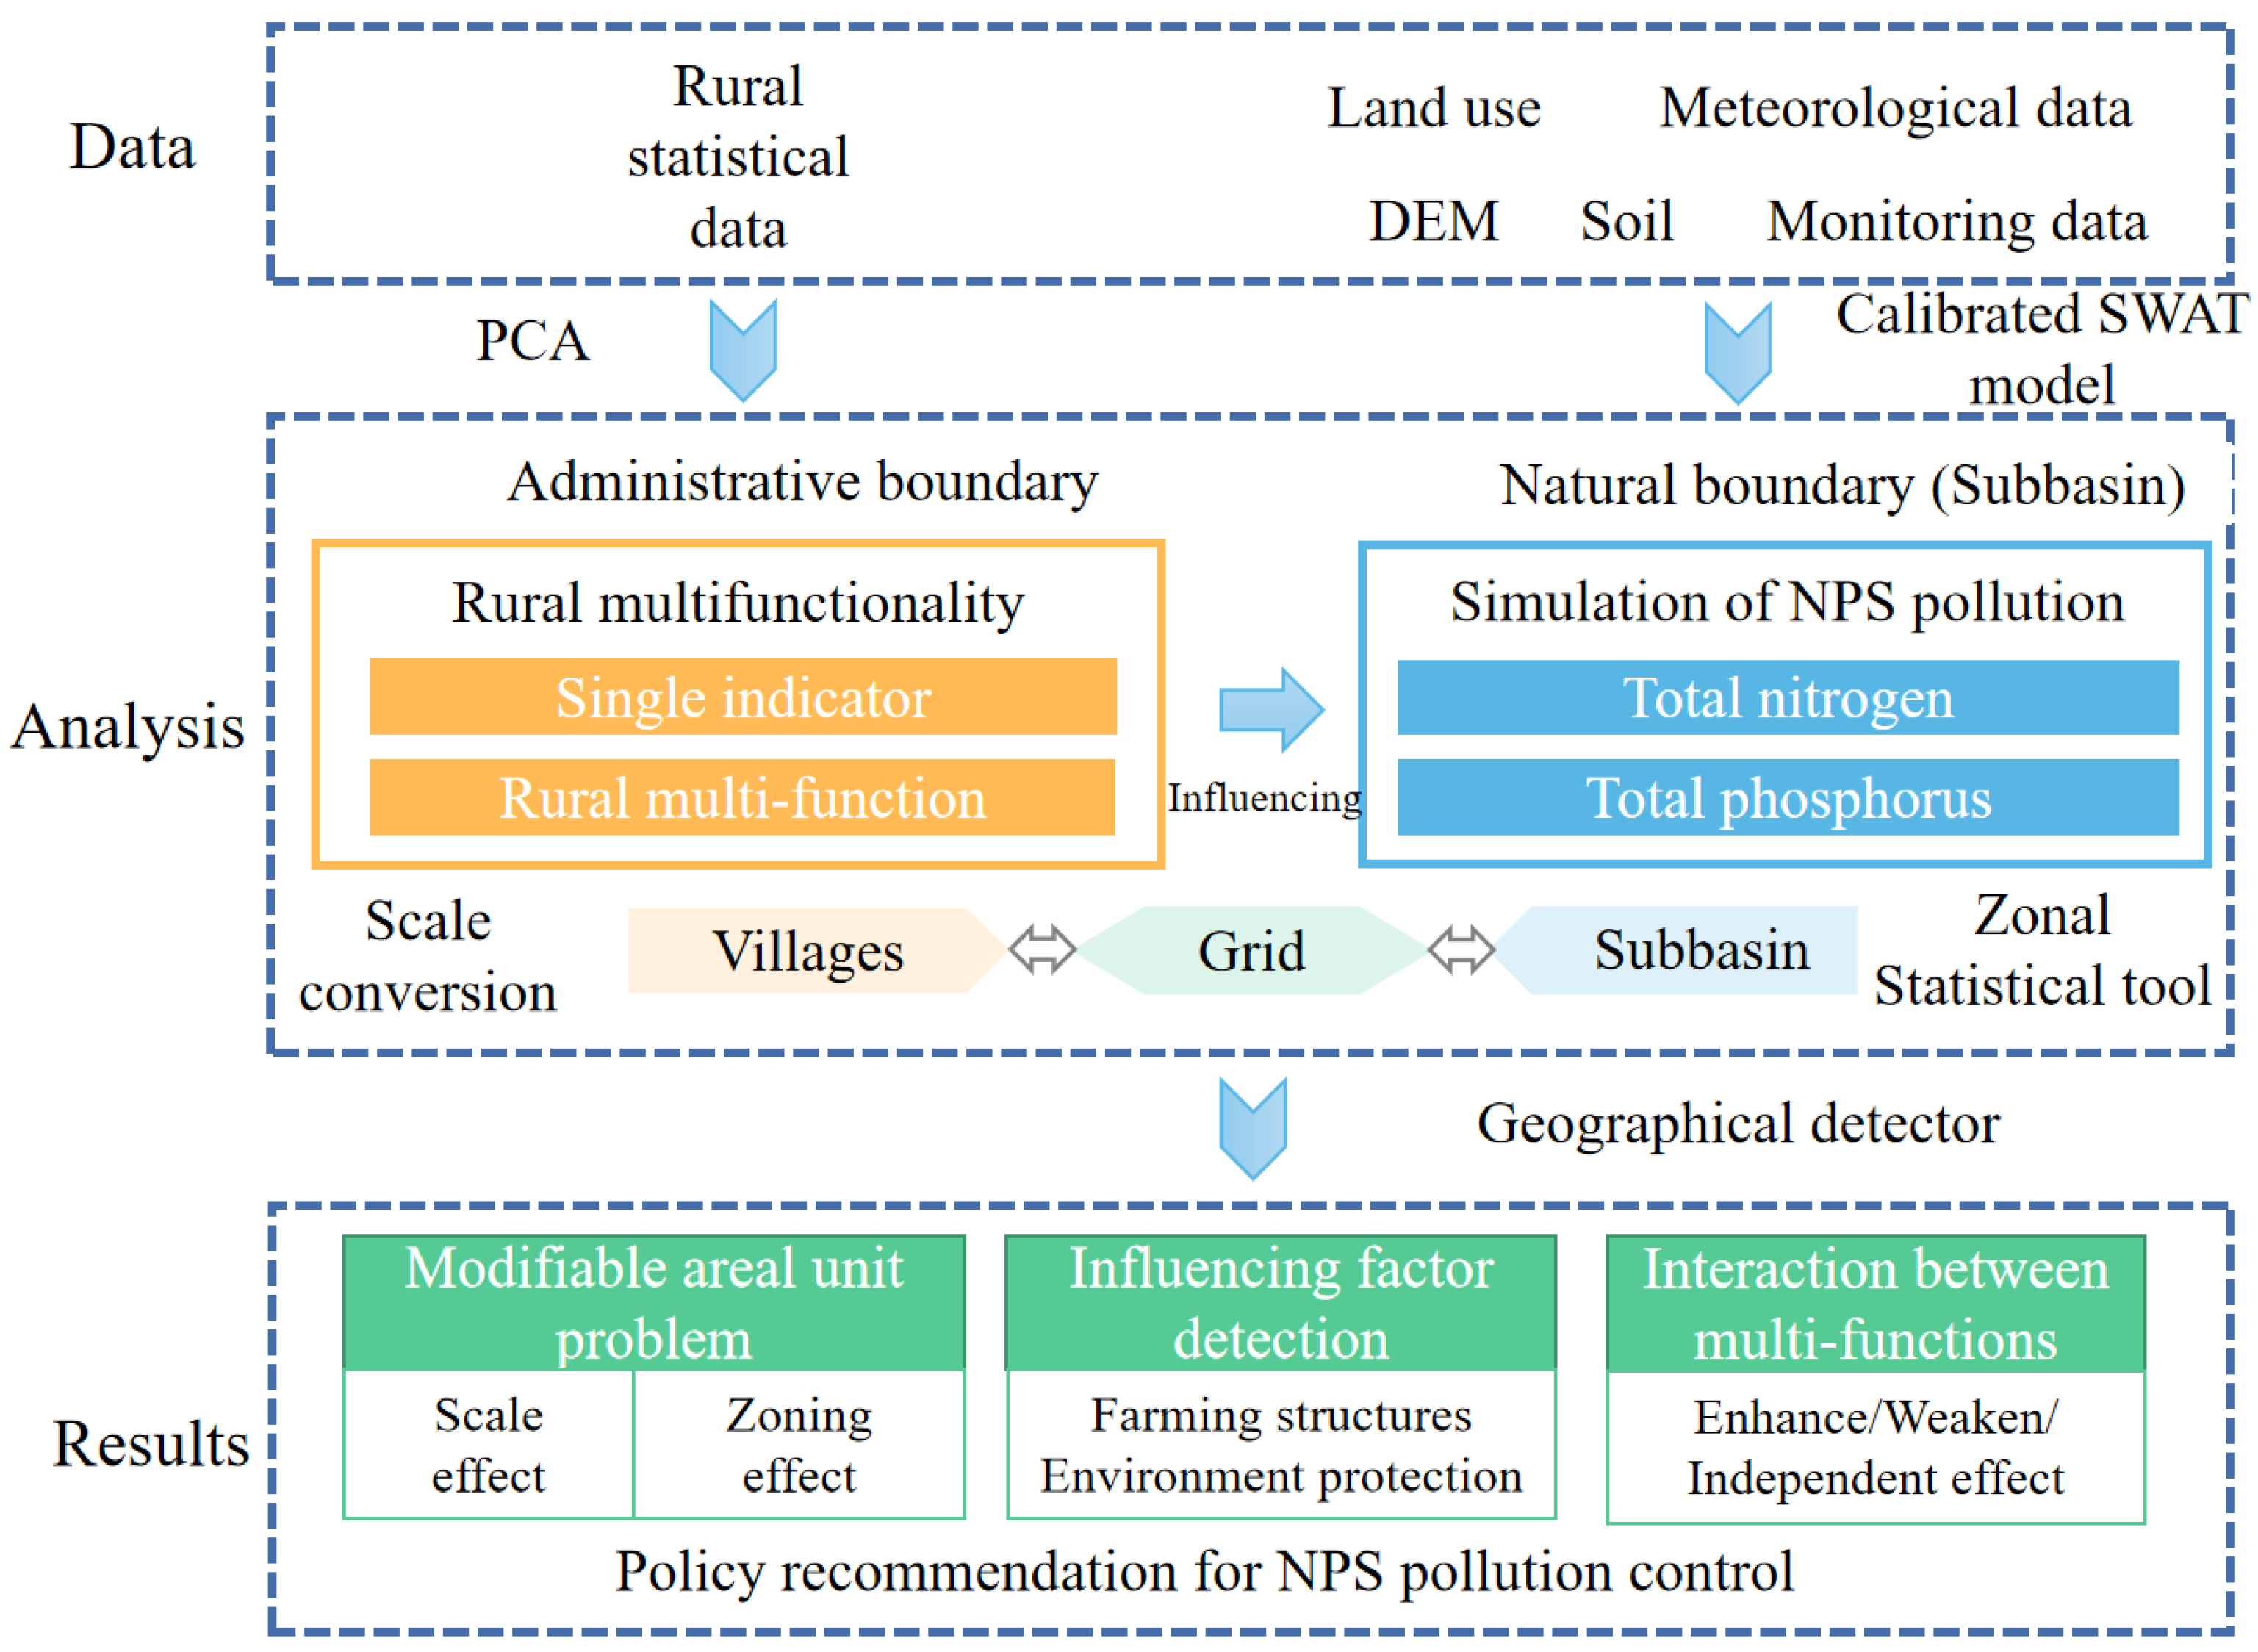
2. Material and Methods

2.1. Study Area

Liyang is a typically hilly area in China. It is situated in the alluvial plain of the Taihu Lake watershed in the lower reaches of the Yangtze River, which is characterized by low mountains and hills, plains and polders, and rivers, lakes, ponds, and reservoirs, resulting in a diverse ecosystem (Figure 1). The watershed is named after Liyang City, which comprises a main proportion of the watershed. The southern part of Liyang benefits from suitable precipitation and heat conditions, making it ideal for agricultural production, particularly wheat, oil, tea, aquatic products, and bamboo. Agriculture plays an essential role in Liyang city. In addition, Liyang also has strengths in its rural industries and business services, which have become the primary driving force for rural development. The rural service industry, especially rural tourism, has developed rapidly. The rural industry and tourism sectors have seen rapid growth and development in this region.

2.2. Data Sources

This study used the following data to evaluate the impact of rural multifunctional development and simulate NPS pollution in Liyang, including land use data, geospatial data, and statistical data. All data are described in the table below (Table 1).

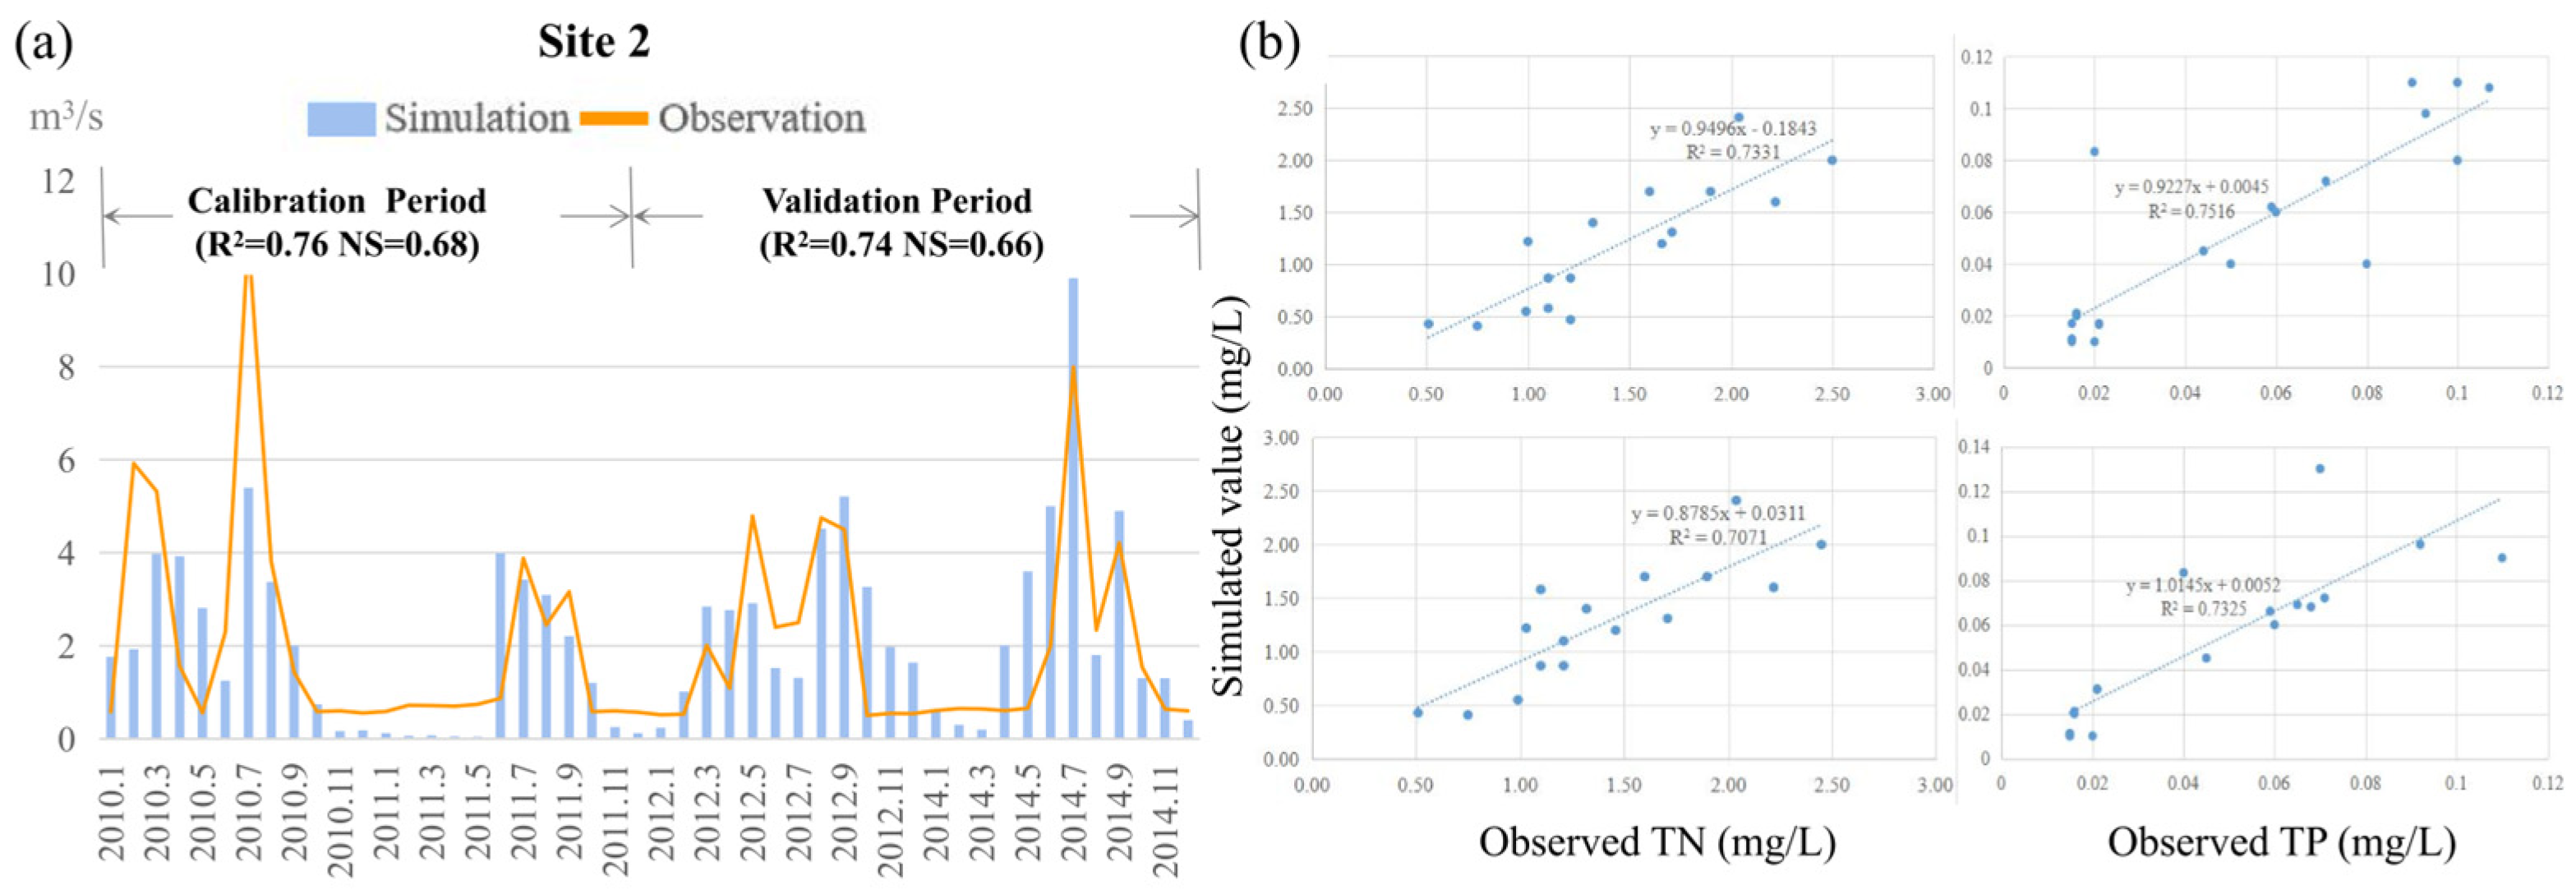
2.3. The Simulation of NPS Pollution

The simulation of NPS pollution was assessed with the SWAT model, a continuous-time, long-term, distributed-parameter model, which is usually used to simulate flows, sediments and nutrients in a watershed system [34,35]. The water cycle processes in this model include rainfall, snowmelt, infiltration, evaporation, plant uptake, lateral flow, percolation, and baseflow. The SWAT model in the Liyang watershed was calibrated with SWAT-CUP. The SWAT model was used to obtain the estimates of TN and TP pollutant at the sub-watershed level for the watershed for 10 years. Before the analysis, the parameters of the model were calibrated and verified. Using SWAT-CUP, combined with the monthly data of the monitoring stations from 2010 to 2014, the multi-station calibration test was adopted. The R2 and NSE were used for the model’s accuracy [36,37,38]. The SWAT model was adapted to typical conditions in the hilly area [21]. The database was built with DEM, meteorological station data, land use, soil type and river network data. Hydrological monitoring data were used for calibration and validation.
R 2 = i = 1 n   Q o , i Q avg   Q p , i Q pavg   i = 1 n   Q o , i Q avg   2 i = 1 n   Q p , i Q pavg   2 0.5 2
N S E = 1 - i = 1 n     Q o , i Q p , i 2 i = 1 n     Q o , i Q a v g   2
where Q o , i is the observed value of runoff/TN/TP, Q p , i is the simulation, Q a v g   is the mean value of the observation, Q p r r g   is the average value of simulation.

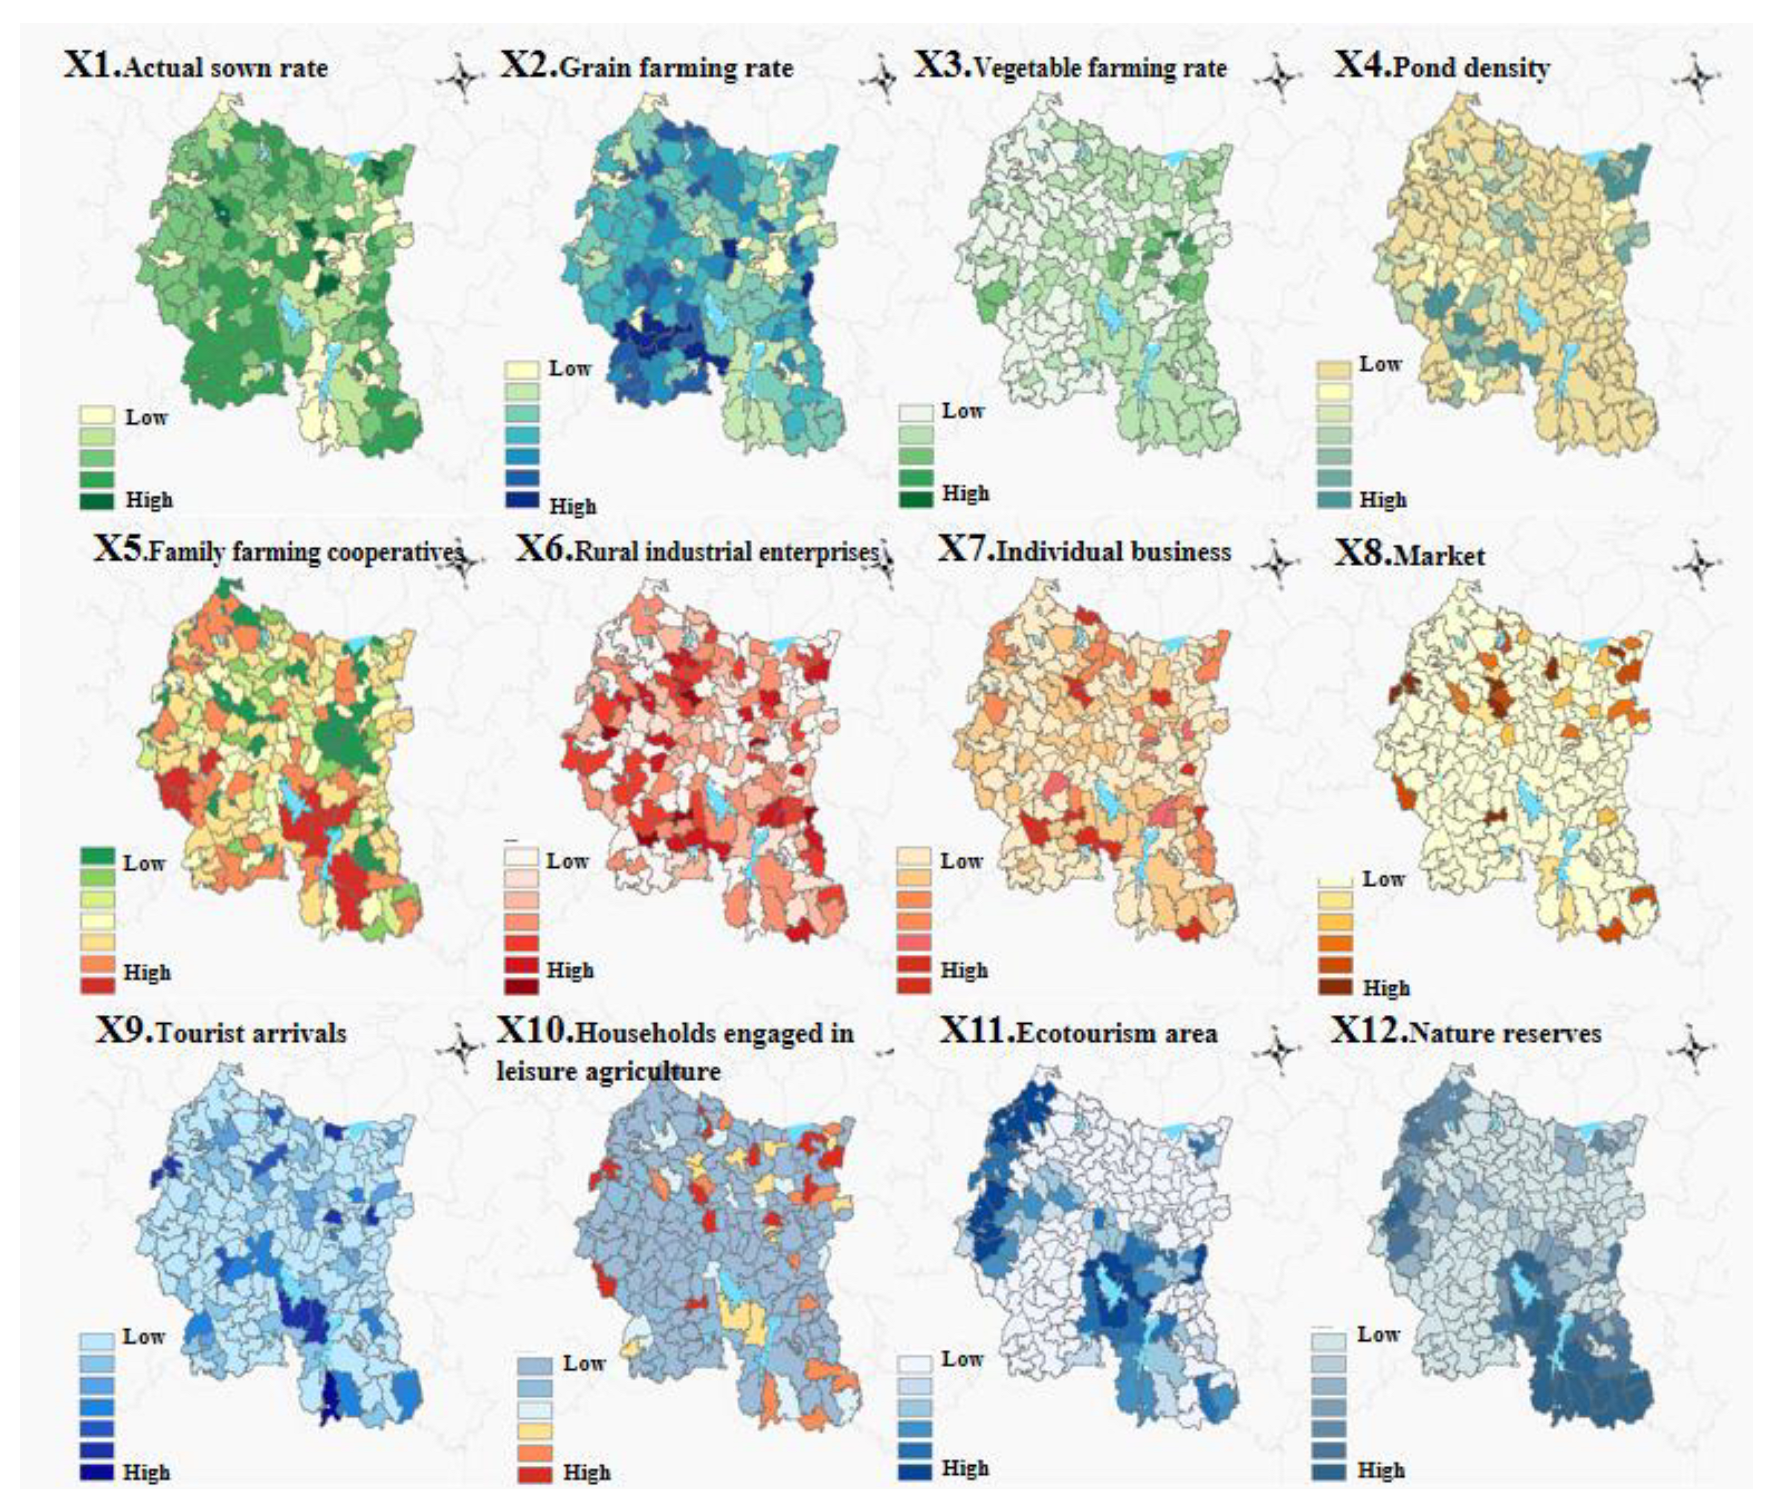
2.4. The Identification of Rural Multifunctionality

The rural multifunctionality is supported by local resources, environment and the social economy. In order to identify the multifunctionality of villages, it is essential to fully understand their socioeconomic characteristics. This paper proposed using the socioeconomic data to explore the potential influencing factors of NPS pollution, and corresponding factors were selected based on the availability, comparability and accessibility of the relevant data (Table 2). The rural multifunctional indicators, collected at the village scale, encompass various metrics such as agricultural production and other industries, reflecting the farming structure, diversified development, and environment protection. It provides a comprehensive reflection of the multifaceted development in rural areas. This study examines the spatial differentiation of rural multifunctional development in Liyang in 2018 due to data availability.
Therefore, the rural multifunctionality is represented from two levels: the indicator level and function level. The indicator level was represented by socioeconomic factors. To ensure comparability, absolute values have been transformed into proportions or densities. On the other hand, rural multifunctionality is a complex system formed by social, economic and other factors, and it is difficult to fully summarize the development situation with a single indicator. Therefore, the multifunction level was encapsulated as different functions, expressing the relative development intensity of the village. Principal component analysis (PCA) is a common statistical tool for examining and diagnosing a set of variables with internal relationships [39]. This method also could reduce the dimension of factors, which is conductive for subsequent interactive analysis [40].

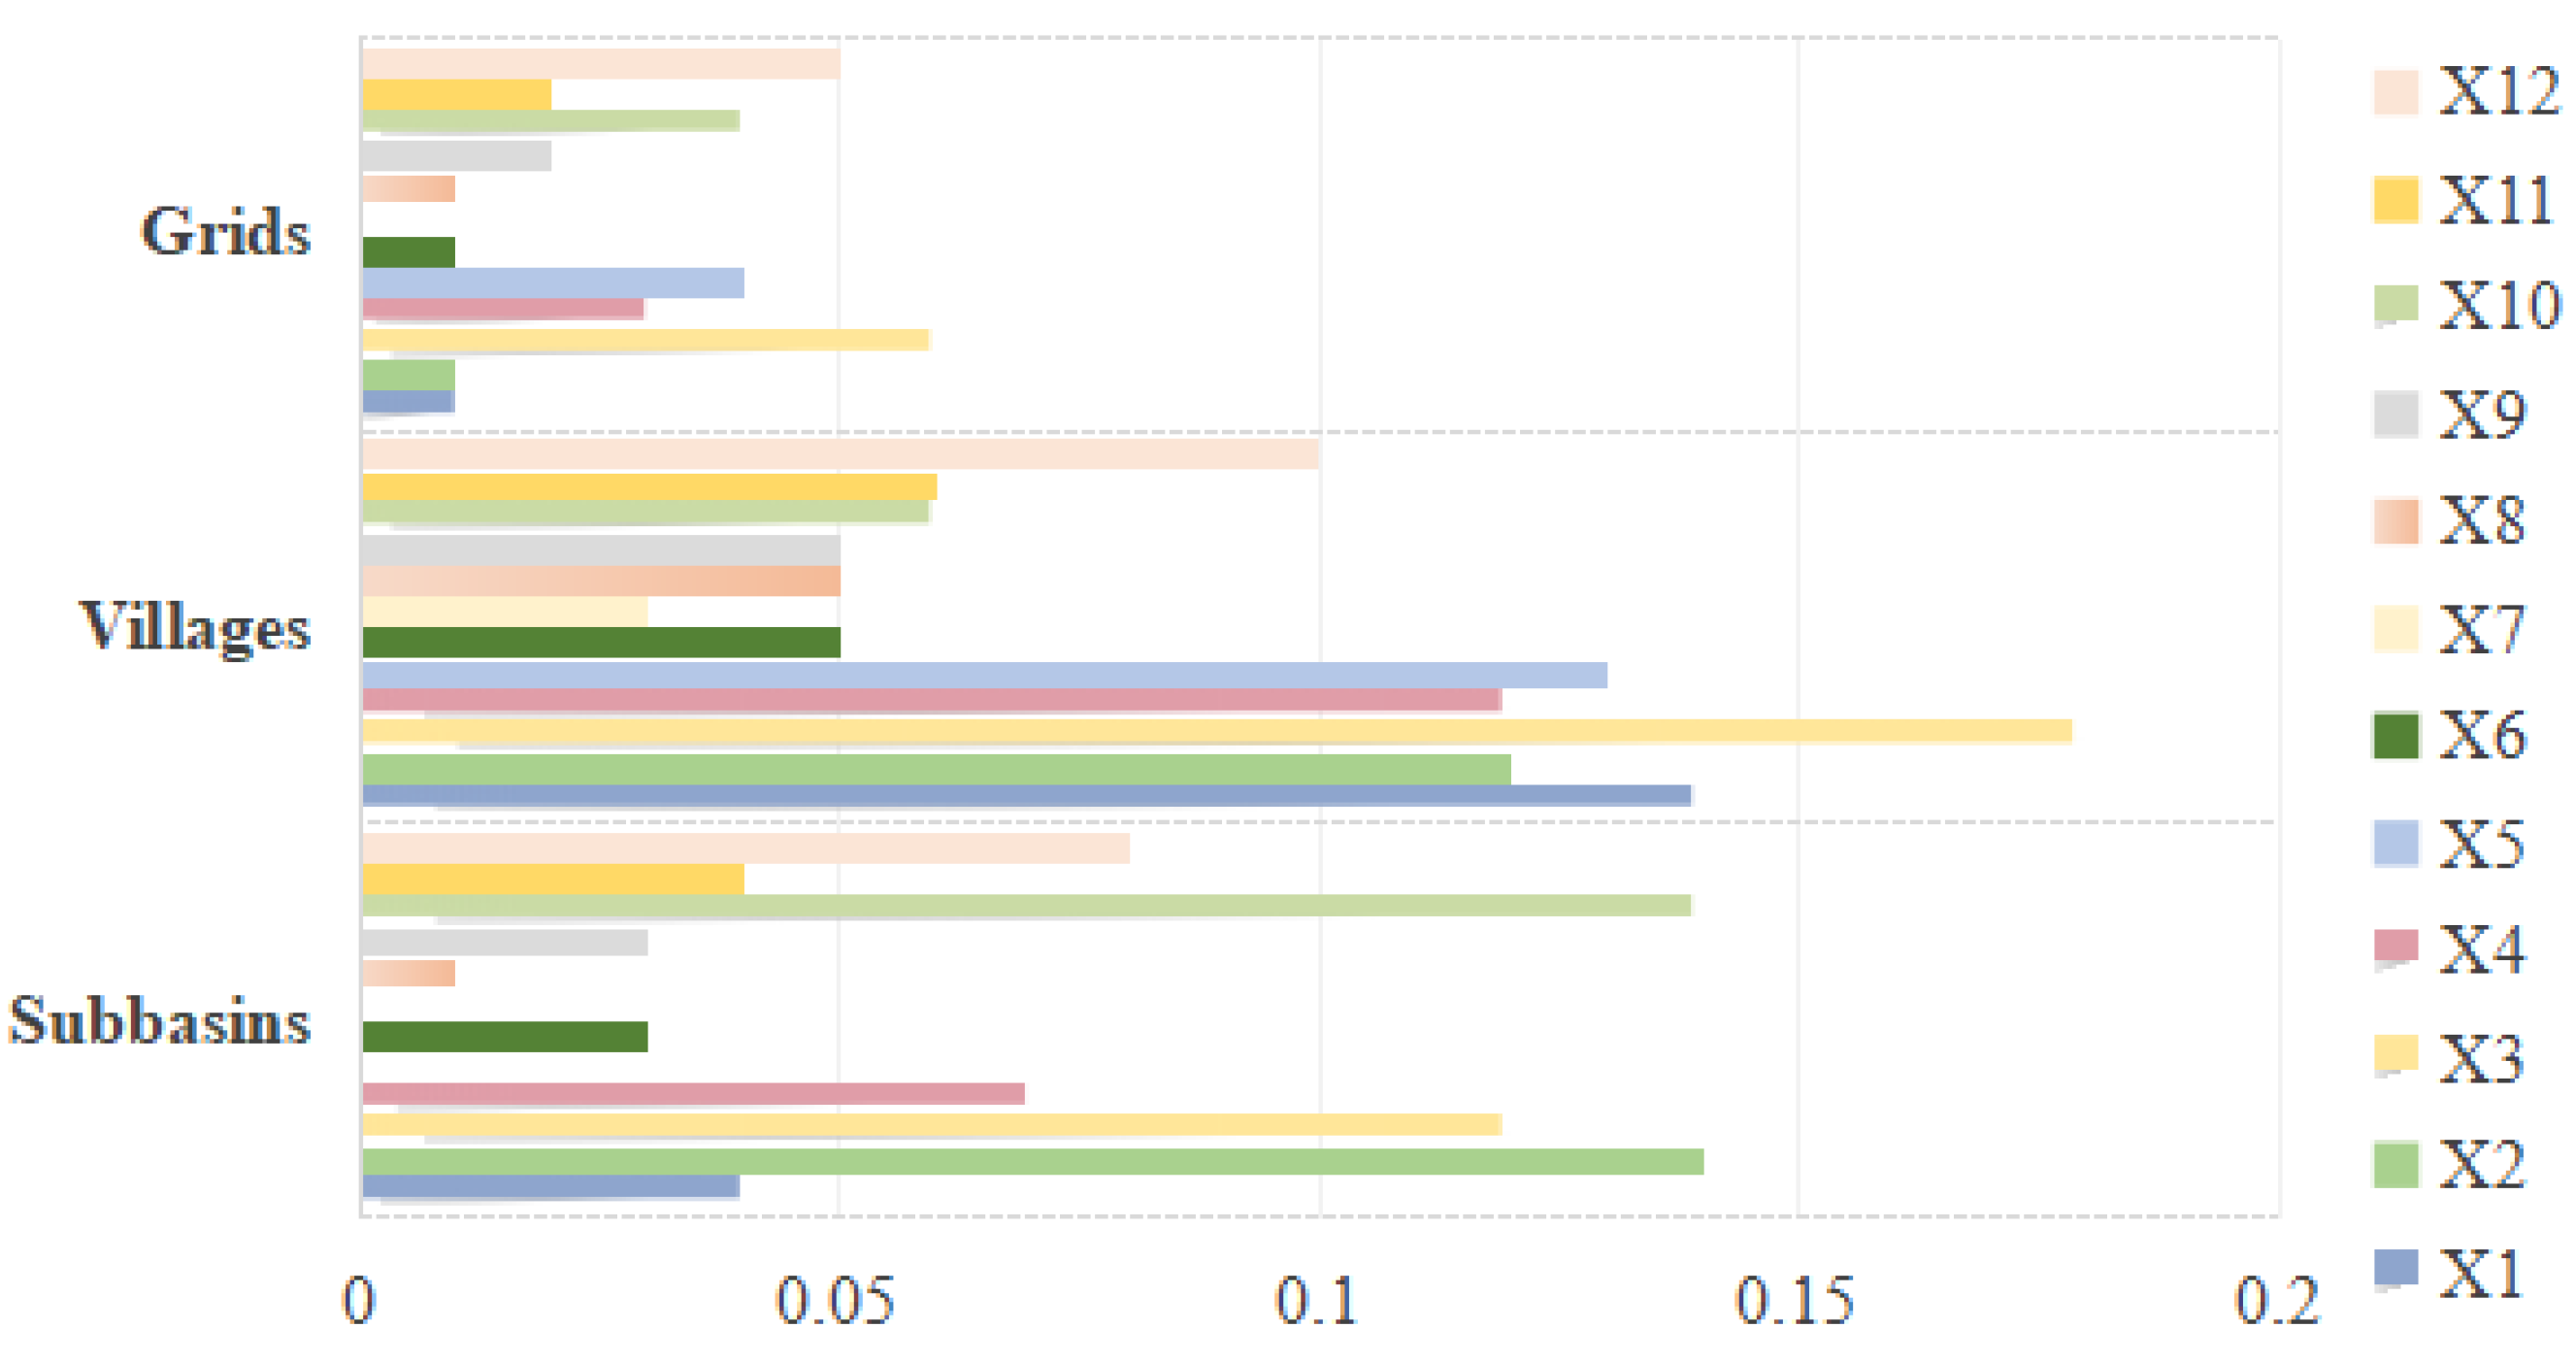
2.5. Geographical Detector

The spatial representation of the complicated coupling process of natural and social forces is spatial differentiation [41]. The geographical detector model was employed to assess the impact of rural socioeconomic factors on NPS pollution through spatial variation analysis of the geographical strata. This method enables the comparison of the relative importance of different functions in driving the spatial differentiation of NPS pollution.
The socioeconomic indicators and NPS pollution load were imported into the geographic detector model to calculate the influence value. A higher q-value indicates a greater effect on NPS pollution, while a lower q-value indicates a lesser effect. The p-value was also calculated. Factors with a p-value less than 0.1 were selected.
The factor detector was utilized to determine the degree of influence of the socioeconomic factor on the NPS load. The following equation is used:
q = 1 i = 1 h   N i σ i 2 N σ 2
where q indicates the impact of the determinant. The q -value is referred to as q ( X ) , where X represents the values of factors and their interannual variations.
The interaction detector examines if two components work independently or not or if their effects are diminished or enhanced when they coexist in space. In this case, interaction detectors are employed to detect whether rural multifunctions have interactive effects on the spatial distribution of NPS.
The q x i x j denotes the interaction between components, which is used to identify whether co-actions between drivers increased or decreased the explanatory power of the analyzed variables. The interaction detector describes the interaction as follows:
(1)
Nonlinear-weaken: q   x i x j < m i n q x i , q x j
(2)
Uni-enhance/weaken: m i n q x i , q x j < q   x i x j < m a x q x i , q x j
(3)
Bi-enhance:
q x i x j > m a x q x i , q x j
(4)
Nonlinear-enhance: q x i x j > q x i + q x j
(5)
Independent: q x i x j = q x i + q x j
According to Equation (4), the three types of enhancement are distinct. The interactions labeled as “nonlinear-enhance” exhibit the highest strength, while the interactions termed as “uni-enhancement” are the weakest.
The research procedure is graphically represented in Figure 2. Firstly, this study encompassed a comprehensive data collection process, incorporating rural statistical data, land use data, a Digital Elevation Model (DEM), soil type information, and meteorological data. Then, the analysis could be divided into two parts: rural multifunctionality and NPS pollution. The rural multifunctionality considered both single indicators and rural functions at the village scale. The socioeconomic data selected as single indicators represented rural multifunctional development. Then, PCA was applied to reduce dimensionality to extract the predominant rural functions. The NPS pollution utilized the SWAT model to simulate the spatial variation of NPS at the subbasin scale, with TN and TP as the main pollutant. Since rural socioeconomic data were collected at the village scale, but NPS pollution was simulated at the subbasin scale, scale conversion is required. Referring to Min’s work, this study first converts the rural multifunctional development factor and NPS using unit area intensity to the grid scale (1 km × 1 km) with the Zonal Statistical tool in ArcGIS. Through this gridding process, this study facilitated the conversion of NPS data and rural multifunctional data across three scales. Subsequently, the geographic detector was employed to explore the Modifiable Areal Unit Problem (MAUP), influencing the factor detection and interactions between functions. Finally, corresponding policy recommendations were proposed.

3. Results

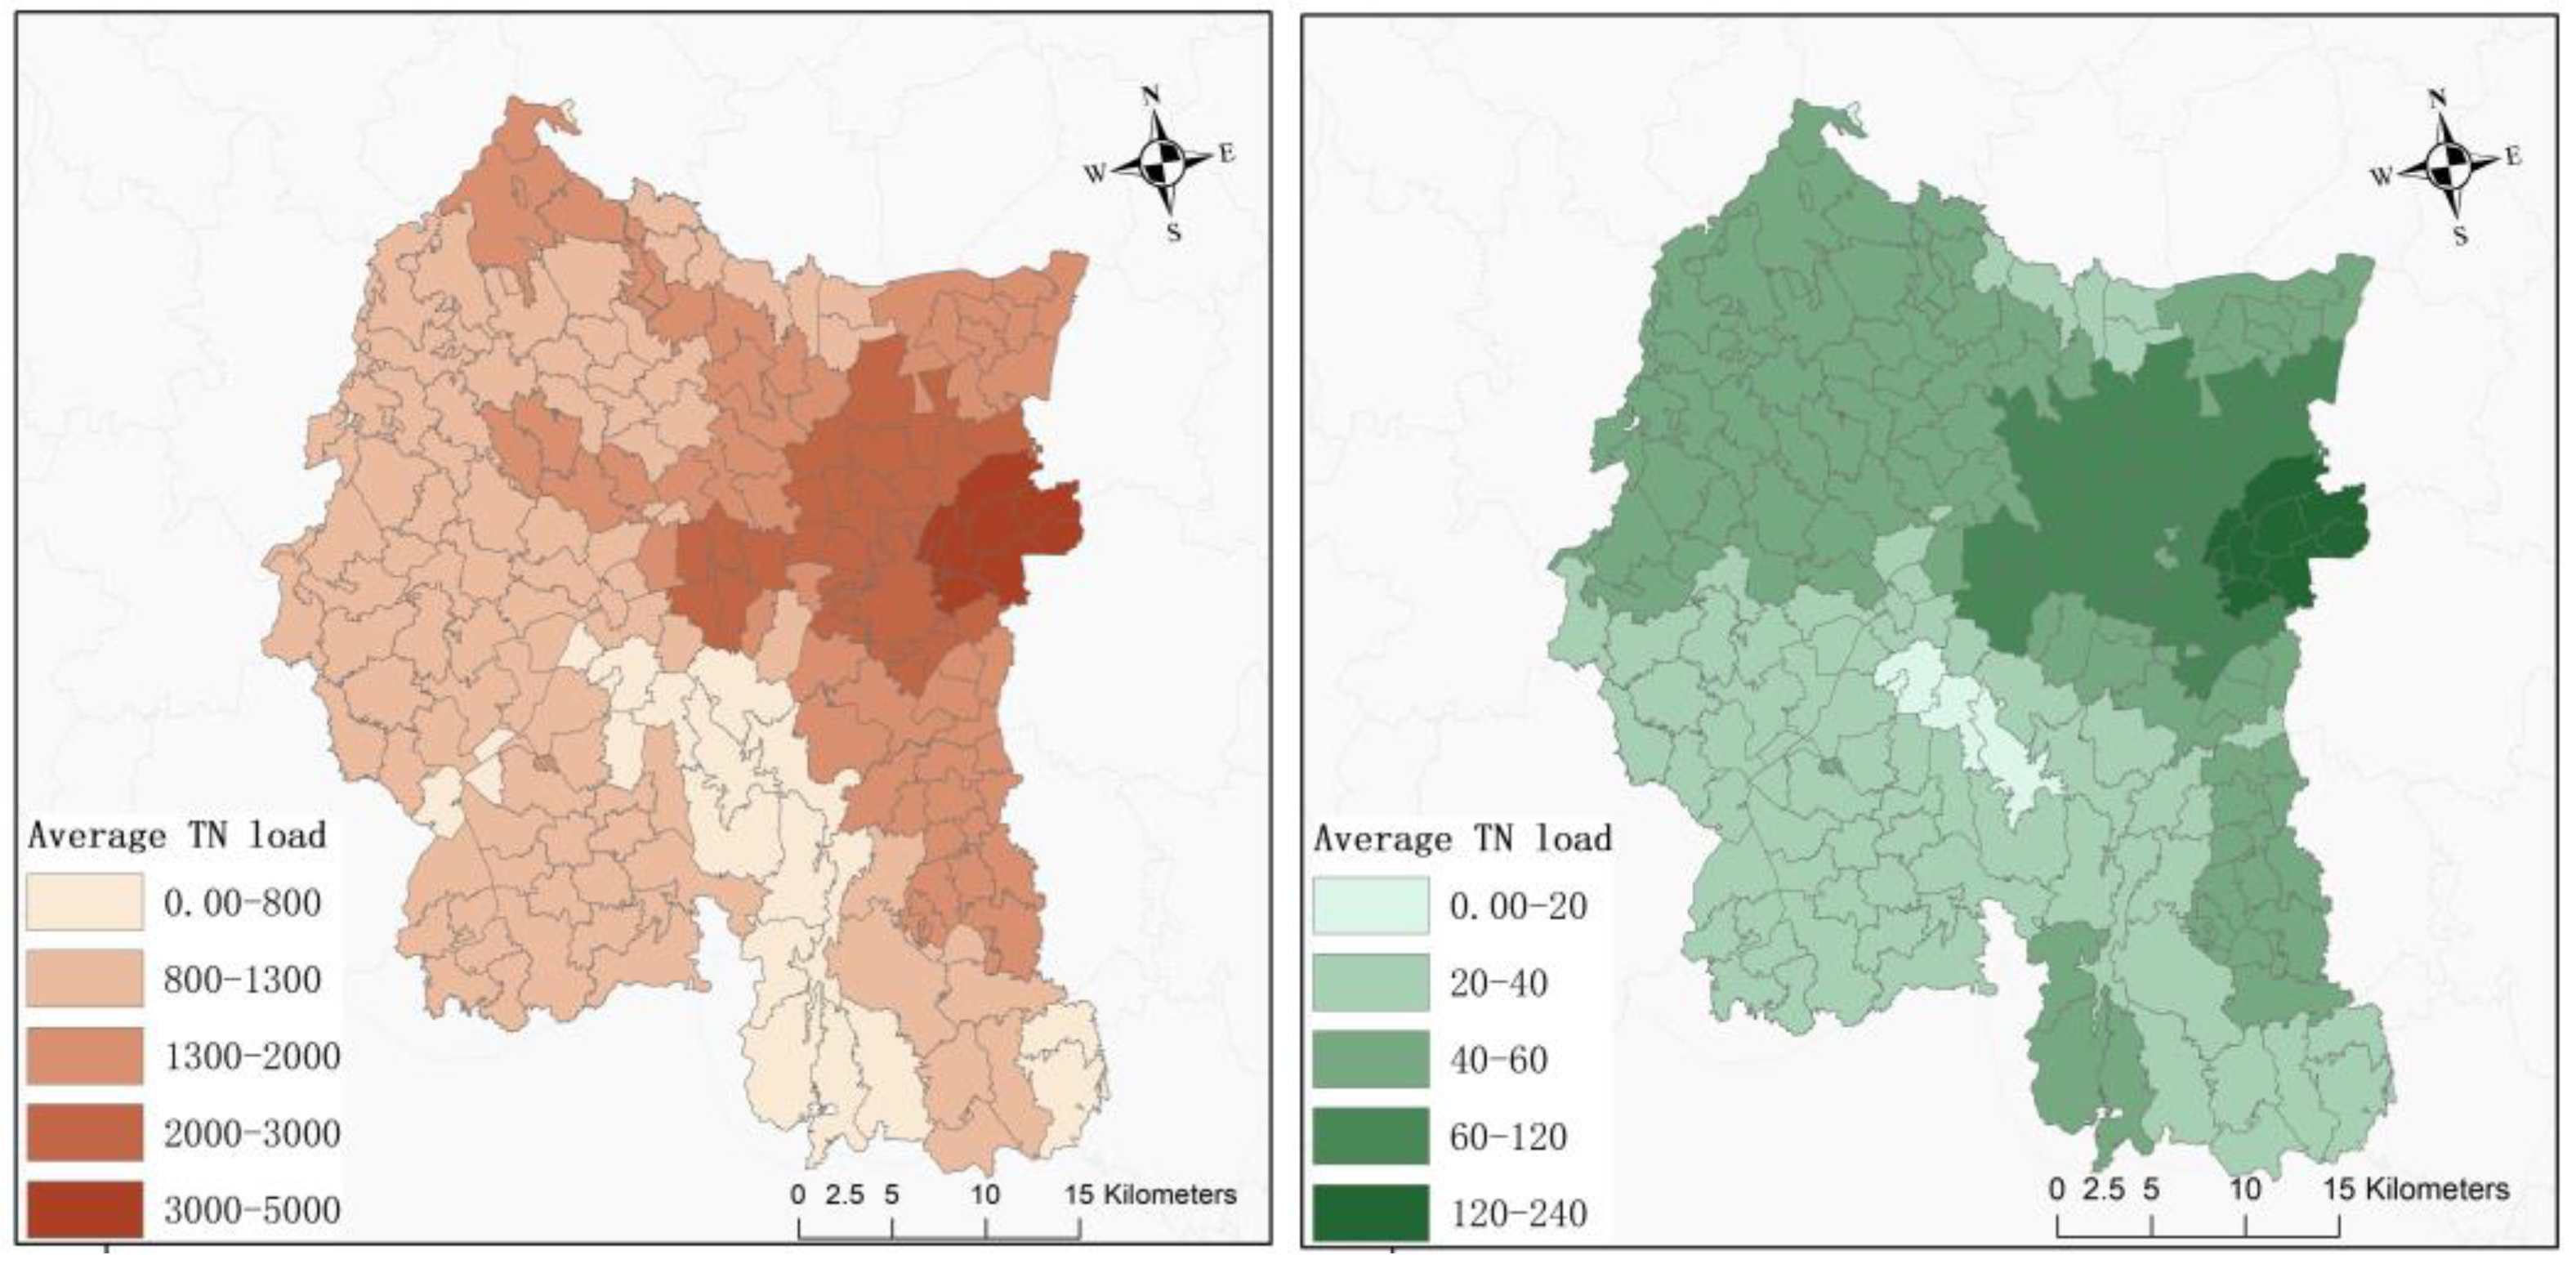
3.1. The NPS Pollution Estimation in Liyang

The SWAT model estimated the NPS pollution, delineating the Liyang watershed into 61 sub-watersheds. As indicated in Table S1 (see the supplementary document), the initial sensitivity analysis determined the final calibrated parameters. According to the sensitivity results, the parameters chosen in this model were suitable to estimate stream flow and nutrient loads.
The model calibrated the runoff through historical data in monitoring site 2 and calibrated nutrition (TN and TP) using all monitoring site data from January 2010 to December 2015. The values of simulations and observations were plotted on a scatter plot, along with a regression line, as depicted in Figure 3. The R2 for the comparison between simulated and estimated runoff was 0.76 and 0.74, respectively. The NSE was determined to be 0.68 and 0.66, respectively, demonstrating a satisfactory agreement.
The spatial distributions of the NPS unit load at the village scale are shown in Figure 4. For TN load, approximately 39% of the villages are in low and relatively low classes and 18% of the villages are in high and relatively high classes. The distribution pattern exhibited higher values in the northeast and lower values in the south. Approximately 31% of the villages have low and relatively low TP loads, while the proportion of villages with high and moderately high TP loads is 20%. Whether TN or TP, the high values were concentrated around the urban area, while the low values were concentrated in the villages around the reservoir. At the temporal scale, the spatial distribution of TN and TP load remained consistent, but the average loading experienced a slight increase. The average annual load for TN in 2010 and 2020 was recorded as 6.9 and 6.2 kg/ha/year, respectively. This trend can be directly attributed to the shrink of agricultural lands. Consequently, the NPS loading initially showed an increase and later a slight decrease (Figure S1). By examining the temporal–spatial distribution of NPS pollution and its interactions with changes in land use types, valuable insights could be gained to aid in reducing pollution.

3.2. The Modifiable Areal Unit Problem (MAUP)

The MAUP is a widespread issue in geographical and spatial analysis. It arises due to the fact that there are modifiable study units for geographical objects, leading to different results based on various aggregated sizes or spatial arrangements [42]. The MAUP has two related issues: the scale effect and the zoning effect. The former one refers to the variation in results obtained when data for one set of areal units are progressively aggregated into fewer and larger units for analysis. The latter one pertains to any variation in results due to the alternative classes of analysis while keeping the number of units constant.
This study analyzes both the scale and zoning effects. The scale effect is firstly examined to determine an optimal scale for analysis. The q-values represent the relative importance, which is crucial for subsequent analysis. The optimal spatial scale was selected when q-values were the highest for most variables [43]. Then, the zoning effect was tested using selected factors of different types at the optimal scale. The optimal scale for each factor was calculated using the optidisc function in R. Both the scale effect and zoning effect tests depend on the determination of the number of classes, which is crucial for accurate analysis [44]. Fewer classes might not adequately capture spatial heterogeneity, whereas more classes scatter the data over space. Therefore, it is crucial to investigate both scale and zoning effects before the research.
To determine the best scale for the geographical detector model, the scale effect is examined. The relative relevance of factors was represented by the q-value. There are 61 sub-watersheds, 184 villages, and 410 grids involved in this research area. The results of the influencing factor showed that the village scale had more statistically significant q-values. The q-value at the subbasin level was moderate, but more factors were statistically insignificant than at the village scale (Figure 5). The q-value at the grid scale was the lowest, suggesting that it has the least power of determination. Therefore, the village scale was the most appropriate for subsequent analysis.
The zoning effect refers to the pattern in which the analysis results vary with the difference of the classes and statistical method [42]. By applying five methods, we can observe the variation in the spatial distribution of NPS pollution based on different zoning schemes (Figure S2). The results showed that the q-values were various with five classification methods. The best results were extracted for subsequent analysis.

3.3. Factor Detector of NPS Pollution and Rural Multifunctionality

The results indicated that the spatial distribution of NPS pollution in Liyang was affected by various indicators (Figure 6). The q-value was used to assess the importance of different factors, and the factor detector identified nine factors that significantly impacted the distribution of TN and TP loads. The significant factors were ranked according to the size of the q-value as X3 > X1 > X5 > X2 = X4 > X12 > X10 > X11 > X6 (Table 3).
Regarding the TN pollution, the explanatory power of the proportion of vegetables was more than 0.18, which is the most important, and this was followed by the proportion of actual sowing area, which accounted for approximately 0.14. The explanatory power of the proportion of grain farming and the number of family farming cooperatives was similar: approximately 0.13. The explanatory power of pond density was 0.12. The area of nature reserves accounted for 0.10. These are essential factors affecting the spatial differentiation of NPS. In addition, the q-values of other factors were all over 0.03. Their influences on the spatial differentiation of TN loading were limited. The research showed that the rural multifunctional indicators explained the influence mechanism of NPS pollutant spatial differentiation to varying degrees. Based on the ranking of q-value, agricultural structure factors were dominant factors in explaining the spatial differentiation of NPS pollution, such as the proportions of grain, vegetable and pond farming. Followed by environmental protective factors, the areas of nature reserves and ecotourism also influenced NPS distribution. The agricultural operation factors were important, including the actual sown area and the number of family farming cooperatives.
Overall, the total impacts of rural multifunctional indicators on the distribution of TN and TP loads were similar, but TN was affected with a higher q-value. The mechanism of rural multifunctional indicators impact on NPS is complicated; the single indicator was not strongly affecting the distribution of NPS pollution in this study. Therefore, the synergic relationship was considered in the subsequent analysis.

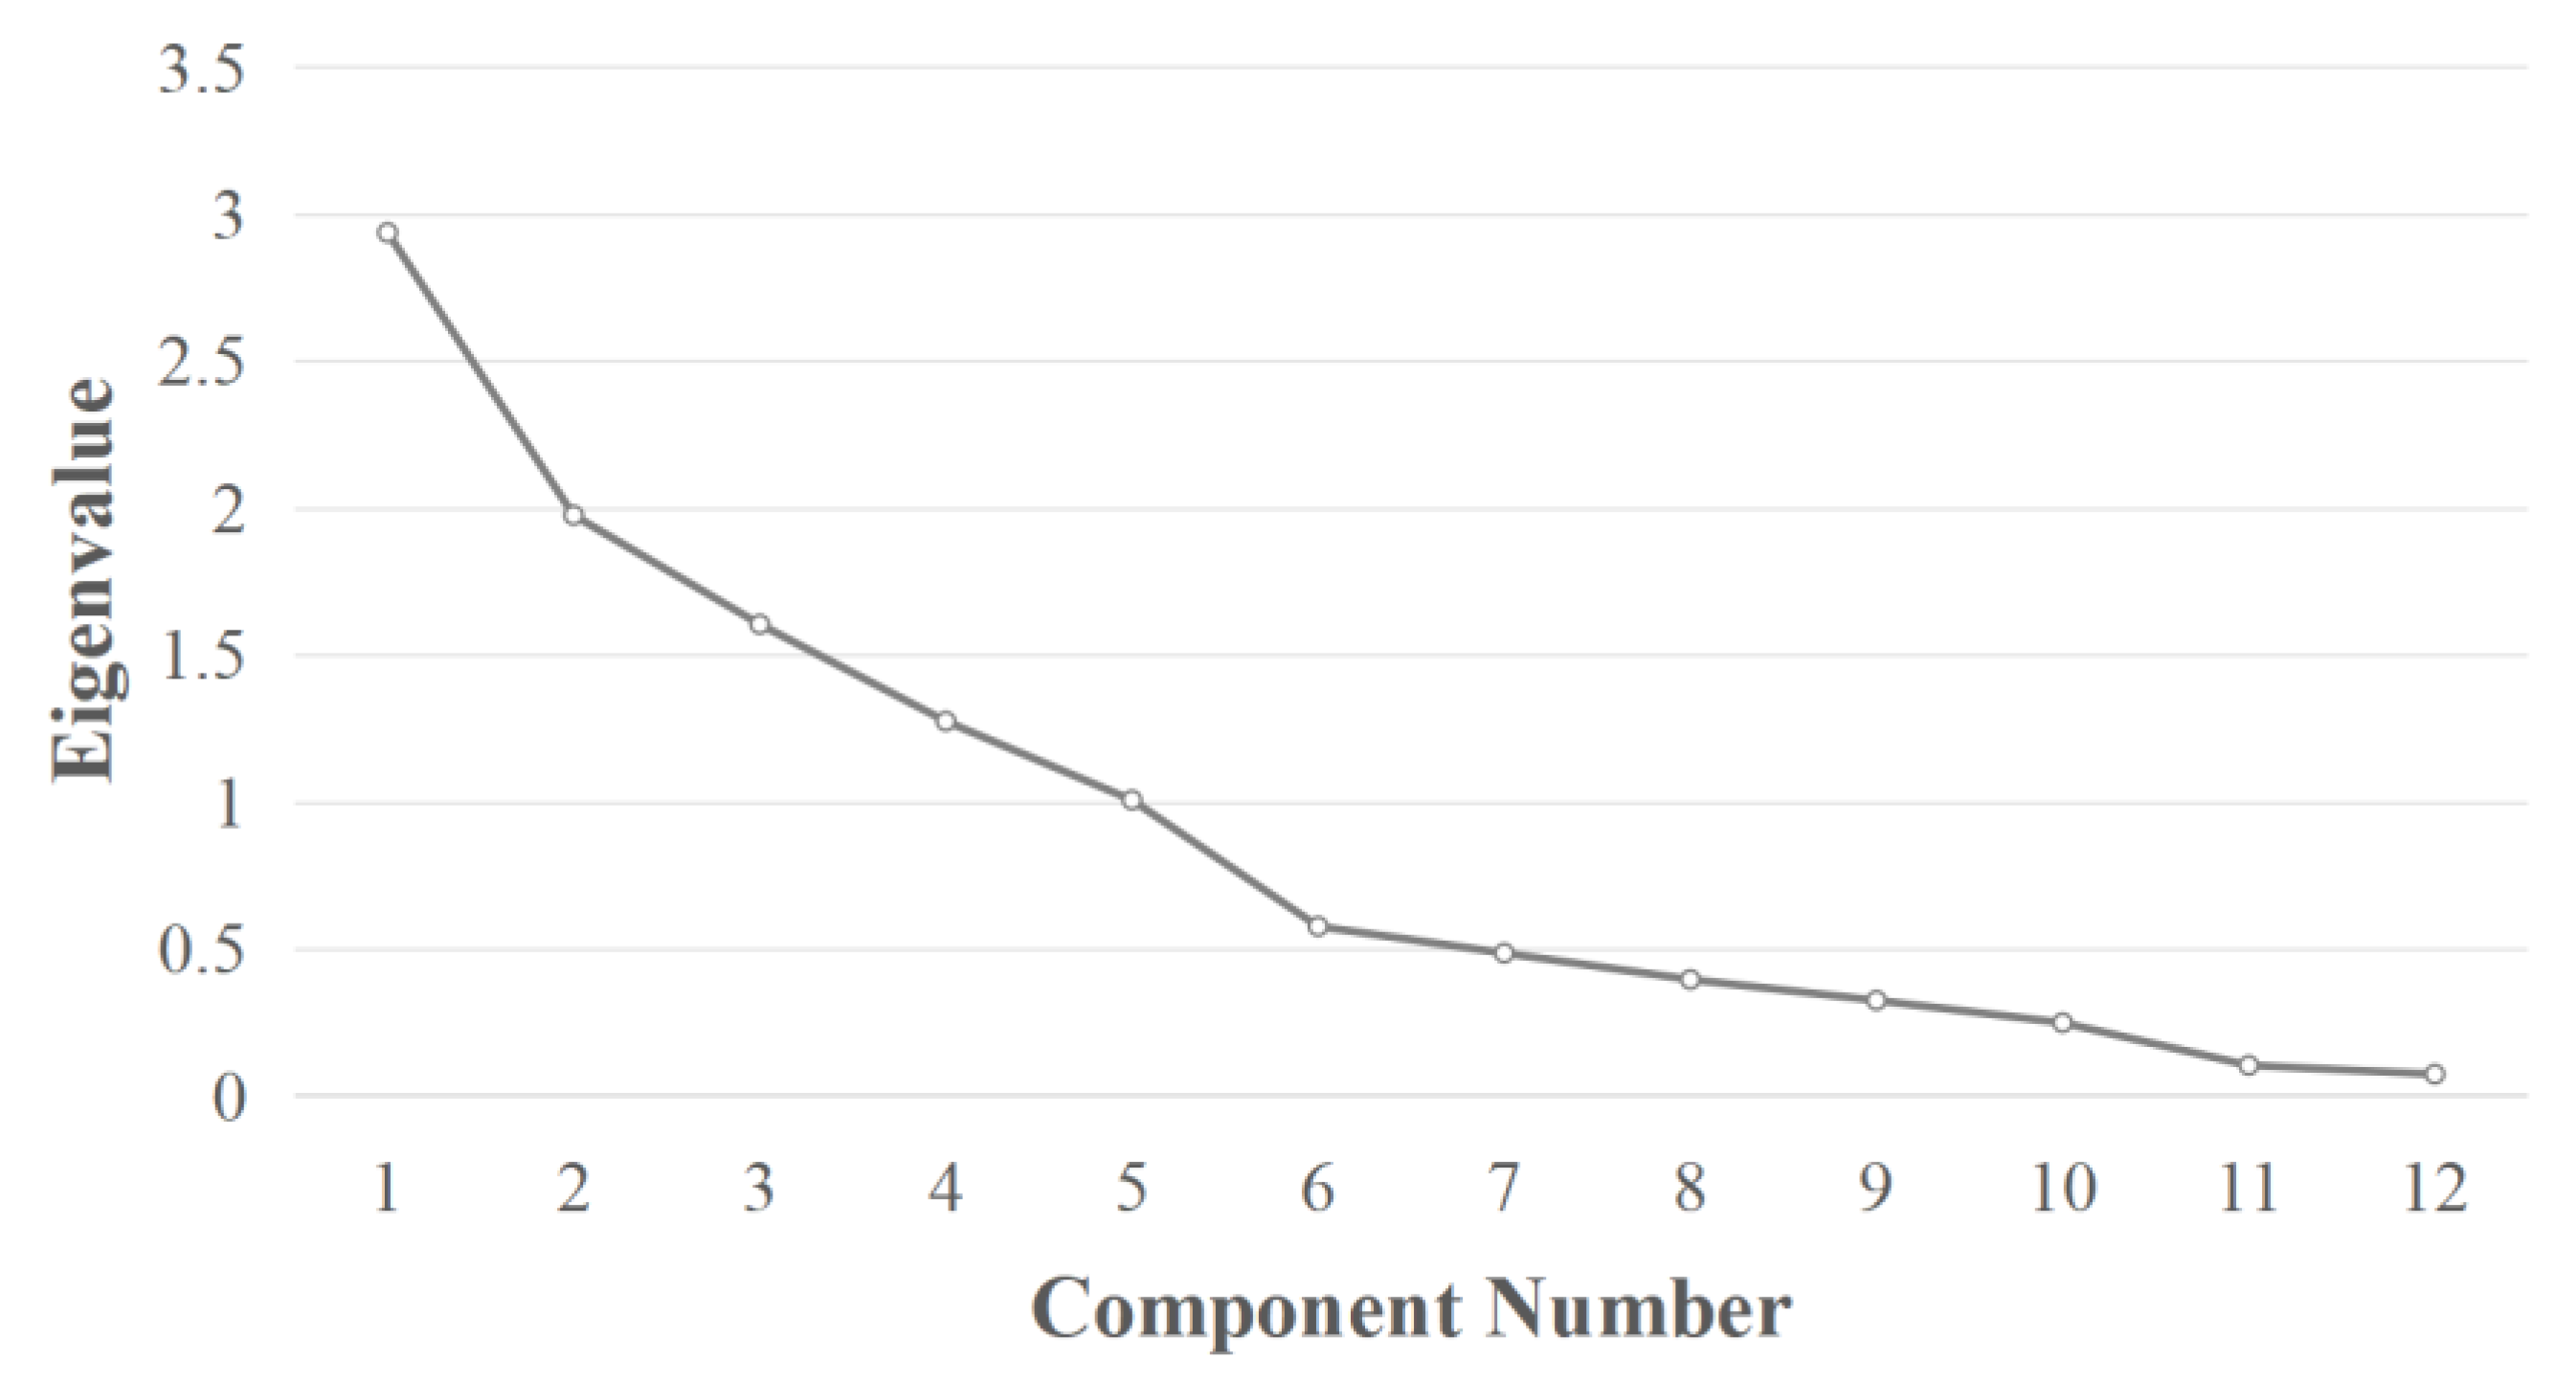
3.4. The Identification of the Rural Multifunctions

Due to the potential cooperation of rural multifunctional indicators, PCA was used to reduce the dimension for the subsequent interactive analysis. The standard deviation standardization method was used to standardize the 11 social and economic indicators of the rural development of Liyang, and then the software SPSS17.0 was employed to conduct PCA. It was found that the KMO test value was 0.6, and the p-value of the Bartlett was equal to 0.000, indicating that PCA can be performed in this study. According to Kaiser [45], the main principles were extracted according to an eigenvalue greater than 1 (Figure 7). The accumulative contribution rate of the five principal components was 77.41%. They comprehensively reflected that the rural multifunctional indicators could be generated as rural multifunctions, which can represent the trend of rural diversified development in Liyang (Table S3). The first principal component F1 was highly correlated with the proportion of nature reserves and ecotourism areas. F2 was highly correlated with the number of tourist arrivals and households engaged in leisure agriculture. F3 was related to the number of individual businesses, rural industrial enterprises, and markets. F4 was about the proportion of actual sown area and the area of grain production. F5 was related to the proportion of pond farming as well as the number of family farms and agricultural cooperatives. Therefore, the rural functions of Liyang could be classified into five categories, representing ecological conservation (EC), leisure agriculture (LA), industry and business (IB), grain production (GP) and modern agriculture (MA) functions, respectively.

3.5. The Interaction Detector of Rural Multifunctions

The results showed that the spatial distribution of NPS pollution in Liyang was affected by rural multifunctions (Figure 8). The factor detector measured the q-value to represent the relative importance of each function first. There are five rural functions that had greater impacts on the distribution of TN and TP loads, while all of them were statistically significant. The functions were ranked according to the size of q-value as GP (0.2134) > MA (0.1595) > LA (0.1287) > EC (0.0914) > IB (0.0556). The GP function of townships accounts for approximately 21.34% of the spatial variation in NPS and stands as one of the most influential rural functions, followed by MA. The IB functions in rural areas have a relatively minor impact on NPS, indicating that commercial trade has limited relevance to the spatial variation of NPS.
The results showed that the interaction between any two rural functions is more significant than a single function. The types of interaction were mainly bi-enhance and nonlinear-enhance, indicating that the result of spatial differentiation of NPS would be affected by the joint action of different rural functions. Specifically, MA and EC functions had the strongest effect on TN spatial differentiation, and the interaction detection q-value was the highest at 0.4955, which was followed by EC∩GP (0.4923), IB∩EC (0.4106), MA∩GP (0.3736), LA∩GP (0.3692) and EC∩IB (0.3271). Although the q-values of the other interactions were below 0.30, they also showed that the two functions have a higher influence on the spatial differentiation of NPS than the single function. In addition, LA∩MA (0.1795) is an interaction enhancement. The interactive detector had similar results between TN and TP loads.

4. Discussion

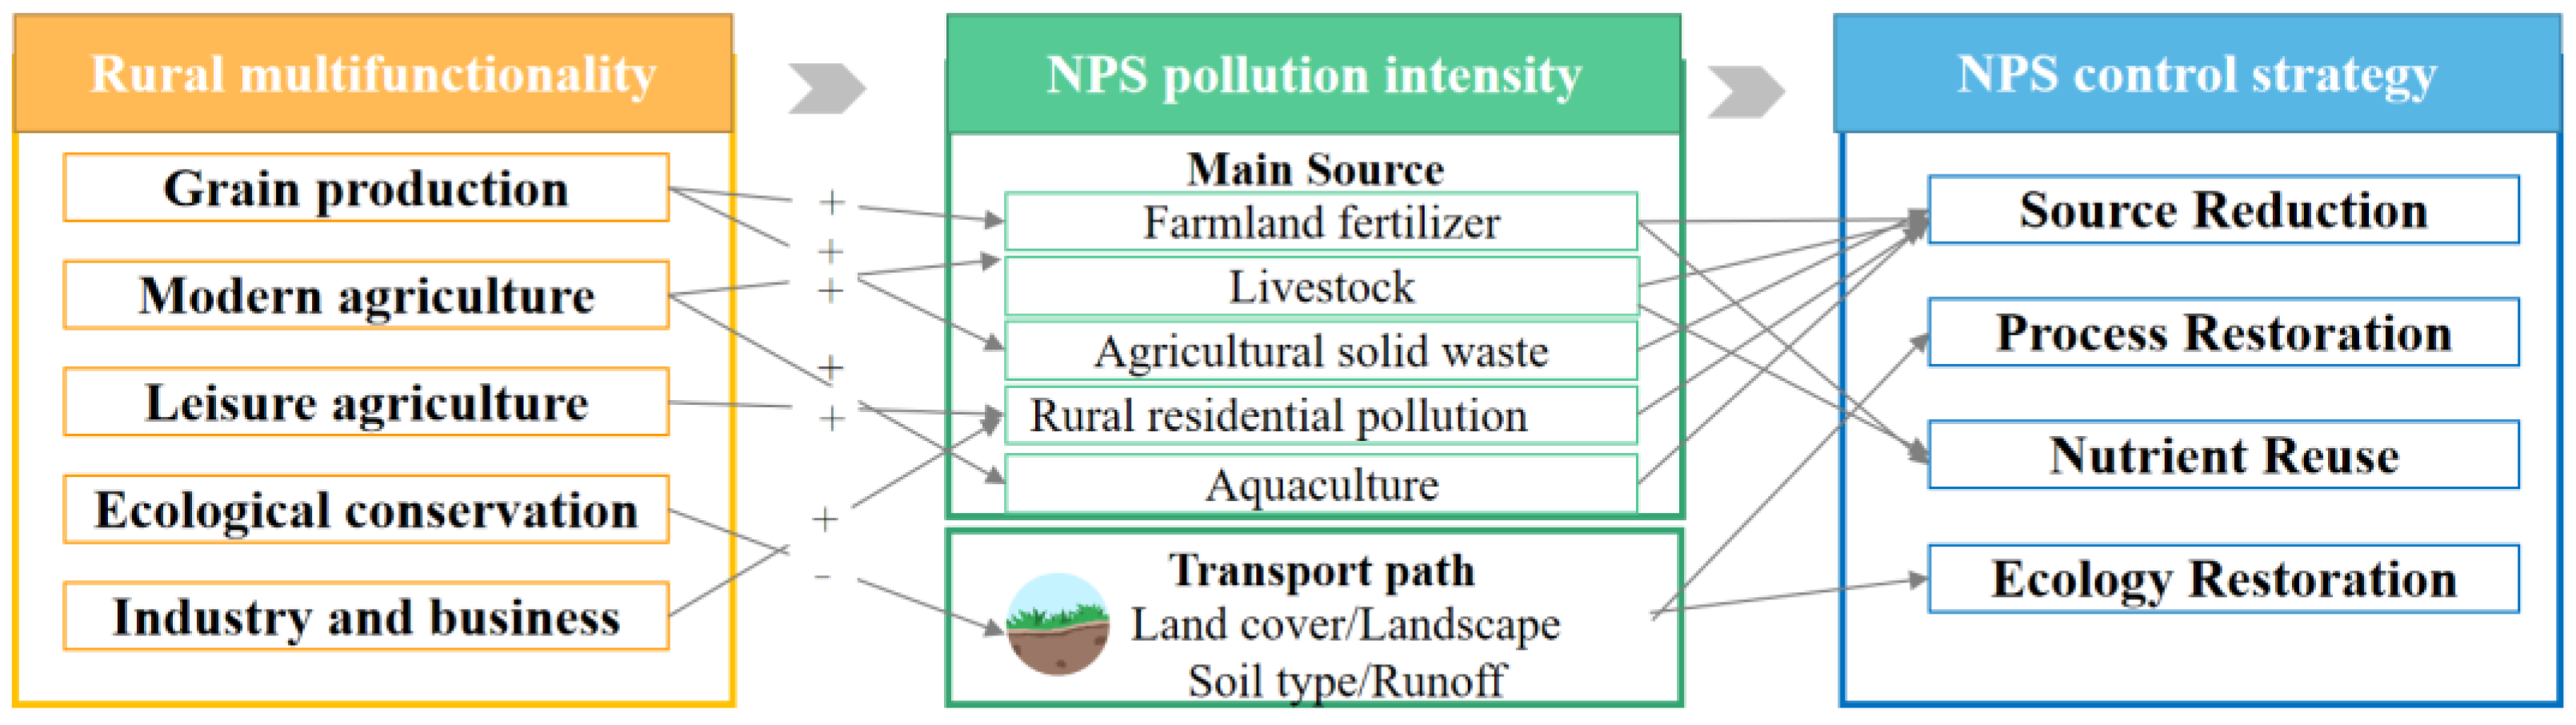
4.1. The Impact of Rural Multifunctionality on NPS Pollution

This research provides an important foundation for understanding the impact of rural multifunctionality on NPS pollution. First, the result reveals the influence of rural multifunctional indicators on NPS pollution. Specifically, rural multifunctional indicators, including the proportion of vegetable farming, sowing area, and grain farming would influence NPS distribution. The number of family farming cooperatives, the area of pond farming, and the nature reserves area also demonstrate influence. The variation of topography, soil, land cover, fertilization, and other factors are accumulated with precipitation, resulting in the creation, output, migration, and transformation of NPS pollution [46,47]. The high intensity of NPS is mainly distributed in the north of Liyang, and the southern hilly areas are low, which is consistent with previous studies [24,48]. The agricultural indicators have the most significant effect on the NPS loads. Long-term and intense agricultural activities produce environmental stresses through land-use variation and the discharge of NPS nutrients into streams [49]. The effects of rural multifunctional development on NPS pollution were consistent with previous assumptions. These findings substantiate the applicability of rural multifunctionality in the analysis and prognostication of the spatial distribution of NPS.
Second, the MAUP is an essential question from a geographical perspective [50]. It is necessary to explore the scale effect in multi-scale research. In the analysis of natural processes and rural multifunctional development, the spatial granularity of the two variables, Y and X, is often varied [41]. In this paper, the dependent variable Y (NPS pollution intensity) is an environmental variable that is generally formed based on natural boundaries such as hydrological watersheds or terrain units. The independent variable X is from the socioeconomic data, which are generally investigated in administrative units. The inappropriate selection of study units would lead to the inconsistent results [51]. Therefore, it is necessary to consider the balance between accuracy and efficiency in the research [44]. This paper discussed the MAUP through quantitative analysis and demonstrated that the village scale was optimal for evaluating the correlation between NPS pollution and rural multifunctionality. Duan and Li [52] found that the spatial scale would not influence NPS loads, which is inconsistent with this study. This difference may be due to the socioeconomic factors used in previous MAUP analysis, which are demographics and GDP rather than agricultural production factors. A village is the smallest regional unit that can reflect the characteristics of rural production and lifestyle, and it is also the geographical scope that reflects the multiple rural functions of the countryside [2]. The average area of a village in Liyang is approximately 8.32 km2. Liyang has both plains and hills, and the division of sub-watersheds is complicated because of the topography. A sub-watershed usually contains several villages, and it is difficult to describe the differentiation of villages. Subsequently, the village scale is an appropriate choice for exploring the spatial differentiation caused by natural and administrative boundaries in the study area.
Third, the impact of rural multifunctionality on TN and TP exhibits a comparable similarity albeit with varying degrees of impact. Upon comparative analysis of TN and TP, it was discerned that pond density exerts a greater influence on TN, while its effect on TP is relatively minor. A previous study has indicated that the primary pollutants discharged from rice and shrimp cultivation are TN followed by TP [53]. TN emerges as the pivotal pollutant for pollution prevention and control. In the case of Liyang, aquaculture predominantly centers around shrimp farming, with the concentrated discharge of shrimp culture effluents potentially heightening the risk of eutrophication in surrounding water bodies.
Finally, the differentiation of NPS pollution is the result of the combined effect of multiple functions in rural areas. While the geographical detector identified single factors, the power of socioeconomic data was not as high as the physical factor [54]. The potential reason is that the single indicator does not influence NPS pollution directly. They usually affect NPS pollution through the synergistic effect. PCA grouped these factors into different principal components to understand them in aggregation as the same rural function. The grain production function of villages is represented by agricultural indicators, such as actual sowing rate, grain farming rate, and the number of agricultural cooperatives that reflect the agricultural planting structure and production capacity. The agricultural factors demonstrated a circle distribution, and NPS pollution has a similar pattern. Higher NPS output usually occurs in areas with frequent agricultural production activities [48]. Farmers tend to pursue higher economic output in these areas, and they will apply more agricultural chemical fertilizers, further increasing the risk of NPS pollution [55]. The interaction types of the five main factors are all enhanced, and the interaction between GP and EC is the most significant, fully explaining the conflict between rural ecological functions and grain production functions, which indicates the profound effect of rural multifunctionality on the distribution of NPS pollution.

4.2. The Mechanism of Impacts of Rural Multifunctionality on the Spatial Differentiation of NPS Pollution and Policy Implication

The rural multifunctionality significantly affects NPS pollution through the generation and transport. The traditional pattern of rural development, which relies mainly on grain production, has changed. The specialization, regionalization and intensification of agriculture have broken the original energy cycle in traditional agricultural department [30,56]. In the context of rural vitalization, the coordinated development of the rural economy and environment is crucial to enhance rural resilience. Previous studies mostly analyzed NPS pollution risk areas from the direct driving force, such as soil and topography, so as to design the placement of NPS control measures. However, an NPS control strategy without the consideration of rural socioeconomic development would be inefficient [56]. Consequently, identifying rural multifunction can clarify the complicated and diverse driving mechanism between rural socioeconomic development and NPS pollution generation.
The main source of NPS pollution and the transition process are highly correlated with the NPS control strategy. The NPS control strategy encompassing “reduction, retention, reuse, and restoration” (4R) were suggested in south China [57]. A localized control strategy could be proposed with the consideration of rural multifunctionality and the NPS pollution control strategy (Figure 9). The corresponding control strategies can be emphasized based on different rural functions. Based on the results and literature, the increase in NPS pollution in GP and MA villages is primarily attributed to the generation of pollution from the source such the fertilizers and livestock. Therefore, effective strategies would involve source reduction and nutritional reuse. In LA and IB villages, tourism leads to an increase in rural residential pollution. The strategies could be directed toward source reduction to diminish the total amount of pollution. In EC’s villages, the higher ecosystem service would mitigate NPS pollution through the transport path. The expansion of ecological space can be further pursued through ecological restoration.
Environmental regulations have positive impacts on NPS pollution control. Establishing water conservation areas and nature reserves could reduce the NPS pollution loads through ecological restoration [53]. The ecological conservation function of a village is represented by environmental protective indicators, such as the proportion of nature reserves, which reflect the ecological importance of the village. There are two reservoirs in the study area, both of which are drinking water sources, as well as the surrounding wetland and forest protection areas, so they have high ecological service value. In this type of villages, due to the limitation of protected areas, agricultural production and industrial activities are often protected by stricter regulations. For instance, the upper limit of the application extent and number of fertilizers is under control according to Tianmu Lake Protection Regulations. In addition, there are some protective projects, such as ecological restoration between the ridgelines of the two reservoirs. A series of comprehensive measures have been implemented to maintain ecological function, which also reduces the NPS intensity.
The critical points of NPS pollution control and environmental policy in the future are as follows. First, the local NPS control strategy should be guided by rural multifunctionality. For instance, promoting green technologies and clean production in ecological function villages could drive the transformation of agricultural production to achieve sustainable agriculture. The most cost-effective NPS management involves prioritizing the implementation of comprehensive NPS management in GA or MA villages, combining policy tools such as incentive measures and Best Management Practices (BMPs). Second, the rural development should take into consideration the NPS control. This, in turn, facilitates the formulation of guiding policies. For instance, in areas with a higher ecological functionality, it is advisable to focus on eco-tourism or commerce for minimum NPS pollution. Finally, it may be considered to designate the village as NPS control units, such as incorporating pollution discharge limits for NPS control into rural planning.

5. Conclusions

Currently, rural policy is closely linked to two concepts: diversity (multifunctionality) and sustainability [58]. This study assessed the impact of rural multifunctional development on NPS pollution. Firstly, the distribution of non-point source pollution in Liyang City was simulated based on sub-watershed analysis, and it was found that the distribution of NPS pollution in Liyang City showed spatial heterogeneity. Secondly, the optimal research scale for examining the rural multifunctional development that affects the NPS pollution was the village scale, which is capable of both reflecting the spatial heterogeneity of NPS pollution and integrating well with socioeconomic data. Subsequently, factor detection results revealed that rural multifunctional indicators, particularly agricultural indicators, have a high influence on the differentiation of NPS loads. Finally, by reducing the dimensions of indicators, this study identified the rural functions of Liyang. The study found that the superposition of rural multifunctionality has a strengthening effect on NPS pollution, particularly when the ecological conservation function is combined with grain production or mixed agriculture function. This finding is conductive to clarifying the mechanism of socioeconomic factors influencing NPS pollution, and it provides a reference for the effective reduction in NPS pollutants and precise environmental governance policies.
The estimation and modeling of NPS is the foundation of exploring the environmental response of rural multifunctionality. The NPS pollution control may be unsuccessful if there is inadequate research on the influencing factors that generate and contribute to it at the administrative scale. Therefore, a combination of natural-process NPS estimation and rural multifunctional development is essential in informing policy making. In this study, the geographical detector has the advantage of capturing the interrelationships between the natural process and socioeconomic factors without making assumptions or imposing any limitation on the explanatory and response variables. However, it still has some limitations. First, because of the availability of data, it is difficult to obtain official data for every important indicator at the village scale (rural economic data, planting structure), which affects the integrity of the rural multifunctional development. The continuous analysis of rural multifunctional development impacts on NPS pollution is inadequate due to the lack of historical socioeconomic data. Second, the identification of rural multifunctions in the current study only considers the function of a village unit without detailed information about farmers’ behavior. Therefore, we suggest that future studies could focus on the process of rural multifunctionality and NPS variation with historical data. Additionally, as farmers are important agents in rural multifunctionality and NPS pollution, future research could consider the trade-off between the economic benefit and environmental effect from farmers’ perspectives.

Supplementary Materials

The following supporting information can be downloaded at https://www.mdpi.com/article/10.3390/land12101936/s1.

Author Contributions

Conceptualization, X.D.; Methodology, W.Y.; Software, J.K.; Validation, J.K.; Formal analysis, W.Y.; Resources, Z.M.; Writing—original draft, W.Y.; Supervision, X.D. All authors have read and agreed to the published version of the manuscript.

Funding

This research was funded by National Key R&D Program of China, grant number 2018YFD1100100.

Data Availability Statement

Data available on request due to restrictions.

Conflicts of Interest

The authors declare no conflict of interest.

References

  1. Yang, Y.; Chen, Y.; Zhang, X.; Ongley, E.; Zhao, L. Methodology for agricultural and rural NPS pollution in a typical county of the North China Plain. Environ. Pollut. 2012, 168, 170–176. [Google Scholar] [CrossRef] [PubMed]
  2. Gu, X.; Xie, B.; Zhang, Z.; Guo, H.D. Rural multifunction in Shanghai suburbs: Evaluation and spatial characteristics based on villages. Habitat Int. 2019, 92, 102041. [Google Scholar] [CrossRef]
  3. Ongley, E.D.; Xiaolan, Z.; Tao, Y. Current status of agricultural and rural non-point source pollution assessment in China. Environ. Pollut. 2010, 158, 1159–1168. [Google Scholar] [CrossRef]
  4. Min, J.; Kong, X. Research Progress of Agricultural Non-point Source Pollution in China. J. Huazhong Agric. Univ. 2016, 2, 59–66. [Google Scholar]
  5. Long, H.; Woods, M. Rural restructuring under globalization in eastern coastal China: What can be learned from Wales? J. Rural Community Dev. 2011, 6, 70–94. [Google Scholar]
  6. Lu, D.; Fan, J. Regional Development Research in China: A Roadmap to 2050; Springer Science & Business Media: Berlin/Heidelberg, Germany, 2011. [Google Scholar]
  7. Yang, R.; Luo, X.; Chen, Y. Spatial pattern and influencing factors of rural multifunctionality at county level in China. Prog. Geogr. 2019, 38, 1316–1328. [Google Scholar] [CrossRef]
  8. Van Berkel, D.B.; Verburg, P.H. Sensitising rural policy: Assessing spatial variation in rural development options for Europe. Land Use Policy 2011, 28, 447–459. [Google Scholar] [CrossRef]
  9. Liu, Y.; Liu, Y.; Chen, Y. Territorial multi-functionality evaluation and decision-making mechanism at county scale in China. Acta Geogr. Sin. 2011, 66, 1379–1389. [Google Scholar]
  10. Wang, Y.; Liu, Y. Pollution and restructuring strategies of rural ecological environment in China. Prog. Geogr. 2018, 37, 710–717. [Google Scholar]
  11. Zhang, Y.; Dore, A.; Ma, L.; Liu, X.; Ma, W.; Cape, J.; Zhang, F. Agricultural ammonia emissions inventory and spatial distribution in the North China Plain. Environ. Pollut. 2010, 158, 490–501. [Google Scholar] [CrossRef]
  12. Dong, G.; Yang, S.; Gao, Y.; Bai, J.; Wang, X.; Zheng, D. Spatial evaluation of phosphorus retention in riparian zones using remote sensing data. Environ. Earth Sci. 2014, 72, 1643–1657. [Google Scholar] [CrossRef]
  13. Shen, Z.; Liao, Q.; Hong, Q.; Gong, Y. An overview of research on agricultural non-point source pollution modelling in China. Sep. Purif. Technol. 2012, 84, 104–111. [Google Scholar] [CrossRef]
  14. Nobre, R.L.G.; Caliman, A.; Cabral, C.R.; de Carvalho Araújo, F.; Guerin, J.; Dantas, F.d.C.C.; Quesado, L.B.; Venticinque, E.M.; Guariento, R.D.; Amado, A.M. Precipitation, landscape properties and land use interactively affect water quality of tropical freshwaters. Sci. Total Environ. 2020, 716, 137044. [Google Scholar] [CrossRef] [PubMed]
  15. Wu, C.; Kao, C.; Lin, C.; Chen, C.; Lai, Y. Using a constructed wetland for non-point source pollution control and river water quality purification: A case study in Taiwan. Water Sci. Technol. 2010, 61, 2549–2555. [Google Scholar] [CrossRef] [PubMed]
  16. Lai, S.; Du, P.; Chen, J. Evaluation of non-point source pollution based on unit analysis. J.-Tsinghua Univ. 2004, 44, 1184–1187. [Google Scholar]
  17. Xu, F.; Dong, G.; Wang, Q.; Liu, L.; Yu, W.; Men, C.; Liu, R. Impacts of DEM uncertainties on critical source areas identification for non-point source pollution control based on SWAT model. J. Hydrol. 2016, 540, 355–367. [Google Scholar] [CrossRef]
  18. Bosch, N.S. The influence of impoundments on riverine nutrient transport: An evaluation using the Soil and Water Assessment Tool. J. Hydrol. 2008, 355, 131–147. [Google Scholar] [CrossRef]
  19. Xue, J.; Wang, Q.; Zhang, M. A review of non-point source water pollution modeling for the urban–rural transitional areas of China: Research status and prospect. Sci. Total Environ. 2022, 826, 154146. [Google Scholar] [CrossRef]
  20. Laurent, F.; Ruelland, D. Assessing impacts of alternative land use and agricultural practices on nitrate pollution at the catchment scale. J. Hydrol. 2011, 409, 440–450. [Google Scholar] [CrossRef]
  21. Fohrer, N.; Eckhardt, K.; Haverkamp, S.; Frede, H. Applying the SWAT model as a decision support tool for land use concepts in peripheral regions in Germany. In Proceedings of the Sustaining the Global Farm. 10th International Soil Conservation Organization Meeting, West Lafayette, IN, USA, 24–29 May 1999. [Google Scholar]
  22. Zhang, S. Influence of Land Use/Cover Change on Agricultural Non-Point Source Pollution under Different Slopes in Dianchi Lake Basin Based on GIS and SWAT Model; Yunnan Normal University: Kunming, China, 2014. [Google Scholar]
  23. Lai, Z.; Li, S.; Deng, Y.; Lv, G.; Ullah, S. Development of a polder module in the SWAT model: SWATpld for simulating polder areas in south-eastern China. Hydrol. Process. 2018, 32, 1050–1062. [Google Scholar] [CrossRef]
  24. Chang, D.; Lai, Z.; Li, S.; Li, D.; Zhou, J. Critical source areas’ identification for non-point source pollution related to nitrogen and phosphorus in an agricultural watershed based on SWAT model. Environ. Sci. Pollut. Res. 2021, 28, 47162–47181. [Google Scholar] [CrossRef] [PubMed]
  25. Shen, Z.; Hong, Q.; Chu, Z.; Gong, Y. A framework for priority non-point source area identification and load estimation integrated with APPI and PLOAD model in Fujiang Watershed, China. Agric. Water Manag. 2011, 98, 977–989. [Google Scholar] [CrossRef]
  26. MEA. Ecosystems and Human Well-Being: Wetlands and Water; World Resources Institute: Washington, DC, USA, 2005. [Google Scholar]
  27. Shen, Z.; Hou, X.; Li, W.; Aini, G.; Chen, L.; Gong, Y. Impact of landscape pattern at multiple spatial scales on water quality: A case study in a typical urbanised watershed in China. Ecol. Indic. 2015, 48, 417–427. [Google Scholar] [CrossRef]
  28. Min, M.; Li, H.; Ma, T.; Miao, C. Will agricultural land scale management aggravate non-point source pollution?–Chaohu Lake Basin, China as a case study. Appl. Geogr. 2023, 158, 103056. [Google Scholar] [CrossRef]
  29. Holmes, J. Impulses towards a multifunctional transition in rural Australia: Gaps in the research agenda. J. Rural Stud. 2006, 22, 142–160. [Google Scholar] [CrossRef]
  30. Chen, T.; Lu, J.; Lu, T.; Yang, X.; Zhong, Z.; Feng, H.; Wang, M.; Yin, J. Agricultural non-point source pollution and rural transformation in a plain river network: Insights from Jiaxing city, China. Environ. Pollut. 2023, 333, 121953. [Google Scholar] [CrossRef]
  31. Xu, X.; Liu, J.; Zhang, S.; Li, R.; Yan, C.; Wu, S.; Multi-Period Land Use Land Cover Remote Sensing Monitoring Dataset in China (CNLUCC). Resource and Environmental Science Data Registration and Publication System. 2018. Available online: http://www.resdc.cn/ (accessed on 16 November 2022).
  32. Rodriguez, E.; Morris, C.S.; Belz, J.E. A global assessment of the SRTM performance. Photogramm. Eng. Remote Sens. 2006, 72, 249–260. [Google Scholar] [CrossRef]
  33. FAO-ISRIC. Jrc: Harmonized World Soil Database (Version 1.2); FAO: Rome, Italy; IIASA: Laxenburg, Austria, 2012. [Google Scholar]
  34. Arnold, J.G.; Srinivasan, R.; Muttiah, R.S.; Williams, J.R. Large area hydrologic modeling and assessment part I: Model development 1. JAWRA J. Am. Water Resour. Assoc. 1998, 34, 73–89. [Google Scholar] [CrossRef]
  35. Nasr, A.; Bruen, M.; Jordan, P.; Moles, R.; Kiely, G.; Byrne, P. A comparison of SWAT, HSPF and SHETRAN/GOPC for modelling phosphorus export from three catchments in Ireland. Water Res. 2007, 41, 1065–1073. [Google Scholar] [CrossRef]
  36. Nash, J.E.; Sutcliffe, J.V. River flow forecasting through conceptual models part I—A discussion of principles. J. Hydrol. 1970, 10, 282–290. [Google Scholar] [CrossRef]
  37. Krause, P.; Boyle, D.; Bäse, F. Comparison of different efficiency criteria for hydrological model assessment. Adv. Geosci. 2005, 5, 89–97. [Google Scholar] [CrossRef]
  38. Arnold, J.G.; Moriasi, D.N.; Gassman, P.W.; Abbaspour, K.C.; White, M.J.; Srinivasan, R.; Santhi, C.; Harmel, R.; Van Griensven, A.; Van Liew, M.W. SWAT: Model use, calibration, and validation. Trans. ASABE 2012, 55, 1491–1508. [Google Scholar] [CrossRef]
  39. Vyas, S.; Kumaranayake, L. Constructing socio-economic status indices: How to use principal components analysis. Health Policy Plan. 2006, 21, 459–468. [Google Scholar] [CrossRef] [PubMed]
  40. Camdevyren, H.; Demyr, N.; Kanik, A.; Keskyn, S. Use of principal component scores in multiple linear regression models for prediction of Chlorophyll-a in reservoirs. Ecol. Model. 2005, 181, 581–589. [Google Scholar] [CrossRef]
  41. Wang, L.; Xu, C.; Wang, J.; Qiao, J.; Wu, N.; Li, L. Spatiotemporal associations between hand, foot and mouth disease and meteorological factors over multiple climate zones. Int. J. Biometeorol. 2023, 67, 1493–1504. [Google Scholar] [CrossRef]
  42. Jelinski, D.E.; Wu, J.G. The modifiable areal unit problem and implications for landscape ecology. Landsc. Ecol. 1996, 11, 129–140. [Google Scholar] [CrossRef]
  43. Song, Y.; Wang, J.; Ge, Y.; Xu, C. An optimal parameters-based geographical detector model enhances geographic characteristics of explanatory variables for spatial heterogeneity analysis: Cases with different types of spatial data. GIScience Remote Sens. 2020, 57, 593–610. [Google Scholar] [CrossRef]
  44. Ju, H.; Zhang, Z.; Zuo, L.; Wang, J.; Zhang, S.; Wang, X.; Zhao, X. Driving forces and their interactions of built-up land expansion based on the geographical detector–a case study of Beijing, China. Int. J. Geogr. Inf. Sci. 2016, 30, 2188–2207. [Google Scholar] [CrossRef]
  45. Kaiser, H.F. A note on Guttman’s lower bound for the number of common factors. Br. J. Stat. Psychol. 1961. [Google Scholar] [CrossRef]
  46. Liu, R.; Zhang, P.; Wang, X.; Chen, Y.; Shen, Z. Assessment of effects of best management practices on agricultural non-point source pollution in Xiangxi River watershed. Agric. Water Manag. 2013, 117, 9–18. [Google Scholar] [CrossRef]
  47. Wang, W.; Chen, L.; Shen, Z. Dynamic export coefficient model for evaluating the effects of environmental changes on non-point source pollution. Sci. Total Environ. 2020, 747, 141164. [Google Scholar] [CrossRef] [PubMed]
  48. Li, Z.; Luo, C.; Xi, Q.; Li, H.; Pan, J.; Zhou, Q.; Xiong, Z. Assessment of the AnnAGNPS model in simulating runoff and nutrients in a typical small watershed in the Taihu Lake basin, China. Catena 2015, 133, 349–361. [Google Scholar] [CrossRef]
  49. Jain, C. A hydro-chemical study of a mountainous watershed: The Ganga, India. Water Res. 2002, 36, 1262–1274. [Google Scholar] [CrossRef]
  50. Wong, D.W. The modifiable areal unit problem (MAUP). In WorldMinds: Geographical Perspectives on 100 Problems: Commemorating the 100th Anniversary of the Association of American Geographers 1904–2004; Springer: Berlin/Heidelberg, Germany, 2004; pp. 571–575. [Google Scholar]
  51. Fotheringham, A.S.; Wong, D.W. The modifiable areal unit problem in multivariate statistical analysis. Environ. Plan. A 1991, 23, 1025–1044. [Google Scholar] [CrossRef]
  52. Duan, T.; Li, Y. A multiscale analysis of the spatially heterogeneous relationships between non-point source pollution–related processes and their main drivers in Chaohu Lake watershed, China. Environ. Sci. Pollut. Res. 2023, 30, 86940–86956. [Google Scholar] [CrossRef] [PubMed]
  53. Chen, Y.; Liu, C.; Chen, J.; Hu, N.; Zhu, L. Evaluation on environmental consequences and sustainability of three rice-based rotation systems in Quanjiao, China by an integrated analysis of life cycle, emergy and economic assessment. J. Clean. Prod. 2021, 310, 127493. [Google Scholar] [CrossRef]
  54. Wang, X.; Feng, A.; Wang, Q.; Wu, C.; Liu, Z.; Ma, Z.; Wei, X. Spatial variability of the nutrient balance and related NPSP risk analysis for agro-ecosystems in China in 2010. Agric. Ecosyst. Environ. 2014, 193, 42–52. [Google Scholar] [CrossRef]
  55. Zhang, Y.; Long, H.; Li, Y.; Tu, S.; Jiang, T. Non-point source pollution in response to rural transformation development: A comprehensive analysis of China’s traditional farming area. J. Rural Stud. 2021, 83, 165–176. [Google Scholar] [CrossRef]
  56. Zou, L.; Liu, Y.; Wang, Y.; Hu, X. Assessment and analysis of agricultural non-point source pollution loads in China: 1978–2017. J. Environ. Manag. 2020, 263, 110400. [Google Scholar] [CrossRef]
  57. Xue, L.; Hou, P.; Zhang, Z.; Shen, M.; Liu, F.; Yang, L. Application of systematic strategy for agricultural non-point source pollution control in Yangtze River basin, China. Agriculture, Ecosystems Environment. 2020, 304, 107–148. [Google Scholar] [CrossRef]
  58. Rizov, M. Rural development under the European CAP: The role of diversity. Soc. Sci. J. 2005, 42, 621–628. [Google Scholar] [CrossRef]
Figure 1. The location of the study area and the spatial units at different scales.
Land 12 01936 g001
Figure 2. The research procedure of assessing the impact of rural multifunctionality on NPS pollution.
Land 12 01936 g002
Figure 3. Calibration and validation results ((a) results for the runoff in monitoring site 2; (b) results for the TN and TP in all monitoring sites).
Land 12 01936 g003
Figure 4. The distribution of average TN and TP load at the village scale in Liyang (kg/km2).
Land 12 01936 g004
Figure 5. The scale effects on q-value of the significant factors (p).
Land 12 01936 g005
Figure 6. The distribution of rural multifunctional indicators in Liyang.
Land 12 01936 g006
Figure 7. Scree plot of PCA result analyzing the indicators of rural multifunctions.
Land 12 01936 g007
Figure 8. Interaction effect between rural multifunctions on NPS pollution (* means bi-enhanced while the others are nonlinear-enhanced).
Land 12 01936 g008
Figure 9. The mechanism of impacts of rural multifunctionality on NPS pollution and control strategy (“+” represent a strengthening effect on NPS pollution loads; “-” represents a weakening effect on NPS pollution loads).
Land 12 01936 g009
Table 1. Data sources.
NameSourcesResolutionApplication
Land-use dataRESDC [31]30 m × 30 mFor the distribution of land-use type(Farmland/water/forest/grassland/bare land/built-up land)
DEMUSGS [32]90 m × 90 mFor sub-watershed division, river network digitization, and slope division
Soil HWSD [33]1 km × 1 kmFor soil database in SWAT
Meteorological dataLiyang National meteorological Station2010~2020For weather database in SWAT
Flow and water quality dataMonthly Water Quality Report2010–2014For calibration and validation
Rural multifunctional indicatorLiayng Statistical Yearbook2018For the development analysis in the study area
Table 2. The description the rural multifunctional indicator at a village scale.
No.FactorsCalculationUnit
X1Actual sown rateThe ratio of actual sown area and total farmland at the end of the year%
X2Grain farming rateThe ratio of grain farming area and sown area %
X3Vegetable farming rateThe ratio of vegetable farming area and sown area %
X4Pond densityThe density of pond farming %
X5Family farming cooperatives The number of family farm and agricultural cooperatives per unit area/km2
X6Rural industrial enterprisesThe number of rural industrial enterprises per unit area/km2
X7Individual businessThe number of individual business per unit area/km2
X8Market The number of markets over 50 square meters per unit area/km2
X9Tourist arrivalsThe number of tourist arrivals per unit area/km2
X10Households engaged in leisure agricultureThe number of households engaged in leisure agriculture per unit area/km2
X11Ecotourism areaThe proportion of the ecotourism area%
X12Nature reservesThe proportion of nature reserves%
Table 3. Detection results of driving factors for spatial differentiation of TN load.
IndicatorsTNTP
q-ValueRankq-ValueRank
X10.1420.132
X20.1240.124
X30.1810.171
X40.1240.132
X50.1330.105
X60.0590.049
X70.03120.0112
X80.0590.067
X90.0590.0211
X100.0670.058
X110.0670.0310
X120.1060.096
Disclaimer/Publisher’s Note: The statements, opinions and data contained in all publications are solely those of the individual author(s) and contributor(s) and not of MDPI and/or the editor(s). MDPI and/or the editor(s) disclaim responsibility for any injury to people or property resulting from any ideas, methods, instructions or products referred to in the content.

