Article

Evaluation of the Smart City and Analysis of Its Spatial–Temporal Characteristics in China: A Case Study of 26 Cities in the Yangtze River Delta Urban Agglomeration

School of Mechanics and Civil Engineering, China University of Mining and Technology, Xuzhou 221116, China
*
Author to whom correspondence should be addressed.
Land 2023, 12(10), 1862; https://doi.org/10.3390/land12101862
Submission received: 4 September 2023 / Revised: 22 September 2023 / Accepted: 26 September 2023 / Published: 29 September 2023

Abstract

:
The smart city is recognized as a potent instrument for creating efficient urban environments and improving the quality of life of urban residents. However, there is an absence of research establishing a comprehensive evaluation model for the smart cities (SCs) and focusing on their spatiotemporal analysis. Thus, a comprehensive evaluation framework was developed and applied to 26 cities in the Yangtze River Delta Urban Agglomeration (YRDUA) in China from 2017 to 2020 to assess the smart city level (SCL) in China and analyze these cities’ spatial–temporal characteristics. The results indicated the following: (1) The overall SCL in the YRDUA has exhibited sustainable improvement, and the gap between cities is gradually narrowing. (2) The SCL of the YRDUA exhibits a higher SCL in the east and a lower SCL in the west of the YRDUA. The global spatial correlation of the SCL was random. Nantong, Hefei, Jiaxing, Zhoushan, Chizhou, Tongling, and Wuhu showed significant local spatial correlation. (3) The comprehensive evaluation framework is applicable for analyzing the SCs in China, and this framework can also be extended to other countries. Pertinent recommendations are put forth to enhance the SCL through the formulation of policies and fostering intercity collaboration. This research not only enriches the theoretical research on smart city evaluation but also clarifies the spatial–temporal characteristics of the SCs in China, thereby providing valuable insights that can foster sustainable smart city development.

1. Introduction

1.1. Background

The phenomenon of rapid urbanization has become an inescapable trend, resulting in a multitude of issues, including environmental degradation, resource depletion, and traffic congestion [1,2]. To address these challenges and improve the quality of life for citizens, the concept of the smart city (SC) is becoming increasingly prevalent across the globe. Generally, the SC refers to the use of the latest technologies and innovations to create highly efficient and sustainable urban environments. It is designed to be people-centric, providing citizens with improved access to services, greater convenience, and more transparent governance [3]. Since 2009, numerous governmental policies have been implemented in different countries, aiming to direct and facilitate the advancement of the SC [4,5,6]. For instance, China introduced ‘The Interim Management Measures on National Smart City Pilot’ in 2012, London launched the ‘Smart London Project’ program in 2013, and Singapore launched the ‘Smart Nation 2025′ program in 2014. With the increase in the number of smart cities (SCs) around the world, effective and comprehensive evaluation work that provides better guidance for the development of SCs has become an urgent need. The extant policies concerning the evaluation of the SC and delineating various standards include ‘The evaluation indicator system of the EU for medium-sized smart cities’ and ‘The smart city wheel evaluation indicator system’ [3]. Specifically, considering the actual situation of urban development in China, a succession of policies with the objective of evaluating and guiding the SC has been launched by the Chinese government, and one of the most famous among these policies is the ‘New Smart City Evaluation Indicators’. However, acquiring the data required by these policies poses a formidable challenge, and explicit calculation standards for certain indicators are missing, which significantly reduces the applicability of these evaluation methods to the SCs in China [7].
Given the aforementioned context, quantifying disparities among SCs across time and space remains challenging. Hence, it is imperative to establish an appropriate evaluation methodology for the SC and to explore the trends in its development. Spatial–temporal differentiation can comprehensively elucidate the evolutionary trajectory of the SC and offer tailored recommendations for achieving bilateral or multilateral collaboration in pursuit of sustainable urban development. Consequently, conducting spatial–temporal differentiation analysis holds significant importance.

1.2. Literature Review

Research on the development of the SC is in full swing. Studies and evaluations relevant to the development of SCs have maintained rapid progress around the world. As for the technical application of SCs, Information and Communication Technologies (ICTs), which include sensing technology, big data, cloud computing, and wireless communication networks, have been applied to different aspects of cities for the purpose of finding the intellectual solution that best matches the application environment [8,9,10]. For example, problems with information security and privacy protection in the data sharing of SCs have been partially addressed through blockchain technology [4]. In addition, to quantify the smart city level (SCL), some explorations of the evaluation systems of SCs have been attempted. Along with the application of ICTs, digital infrastructure has become a part of these evaluation systems [11,12]. The existing evaluation indicator systems generally contain the four aspects of smart living, smart environment, smart economy, and smart governance; some examples are the evaluation indicator system for the SC proposed by Bode Cohen and that in China proposed by Zhang et al. [3]. These indicator systems have thorough knowledge of the SC and pay greater attention to the experience of citizens [13]. With respect to weights of the evaluation indicators of the SC, different calculating methods were used within these systems, such as fuzzy logic, the Delphi method, and the Analytic Hierarchy Process [14]. Specifically, the Entropy Weight Method (EWM) was applied to determine the weights of SC evaluation indicators and showed good reliability [15]. Moreover, comprehensive evaluation methods have been broadly applied in various fields, encompassing a multi-case study approach, the Technique for Order of Preference by Similarity to Ideal Solution (TOPSIS), and Data Envelopment Analysis (DEA) [16,17].
However, there are some gaps in existing studies on the evaluation of SCs. First, there is relatively limited research on the dynamic changes in SCs in China, and the SCL in China has not been perfectly assessed due to partially absent data regarding the relevant evaluation indicators. Second, the lack of a comprehensive SC evaluation model results in the inability to achieve the required accuracy in the SC evaluation results, especially when determining evaluation indicator weights. Third, there have been few reports on spatiotemporal analyses of SCs and quantifying disparities across SCs. Consequently, formulating actionable recommendations for enhancing the SCL according to regional disparities is a formidable challenge.

1.3. Research Objectives and Significance
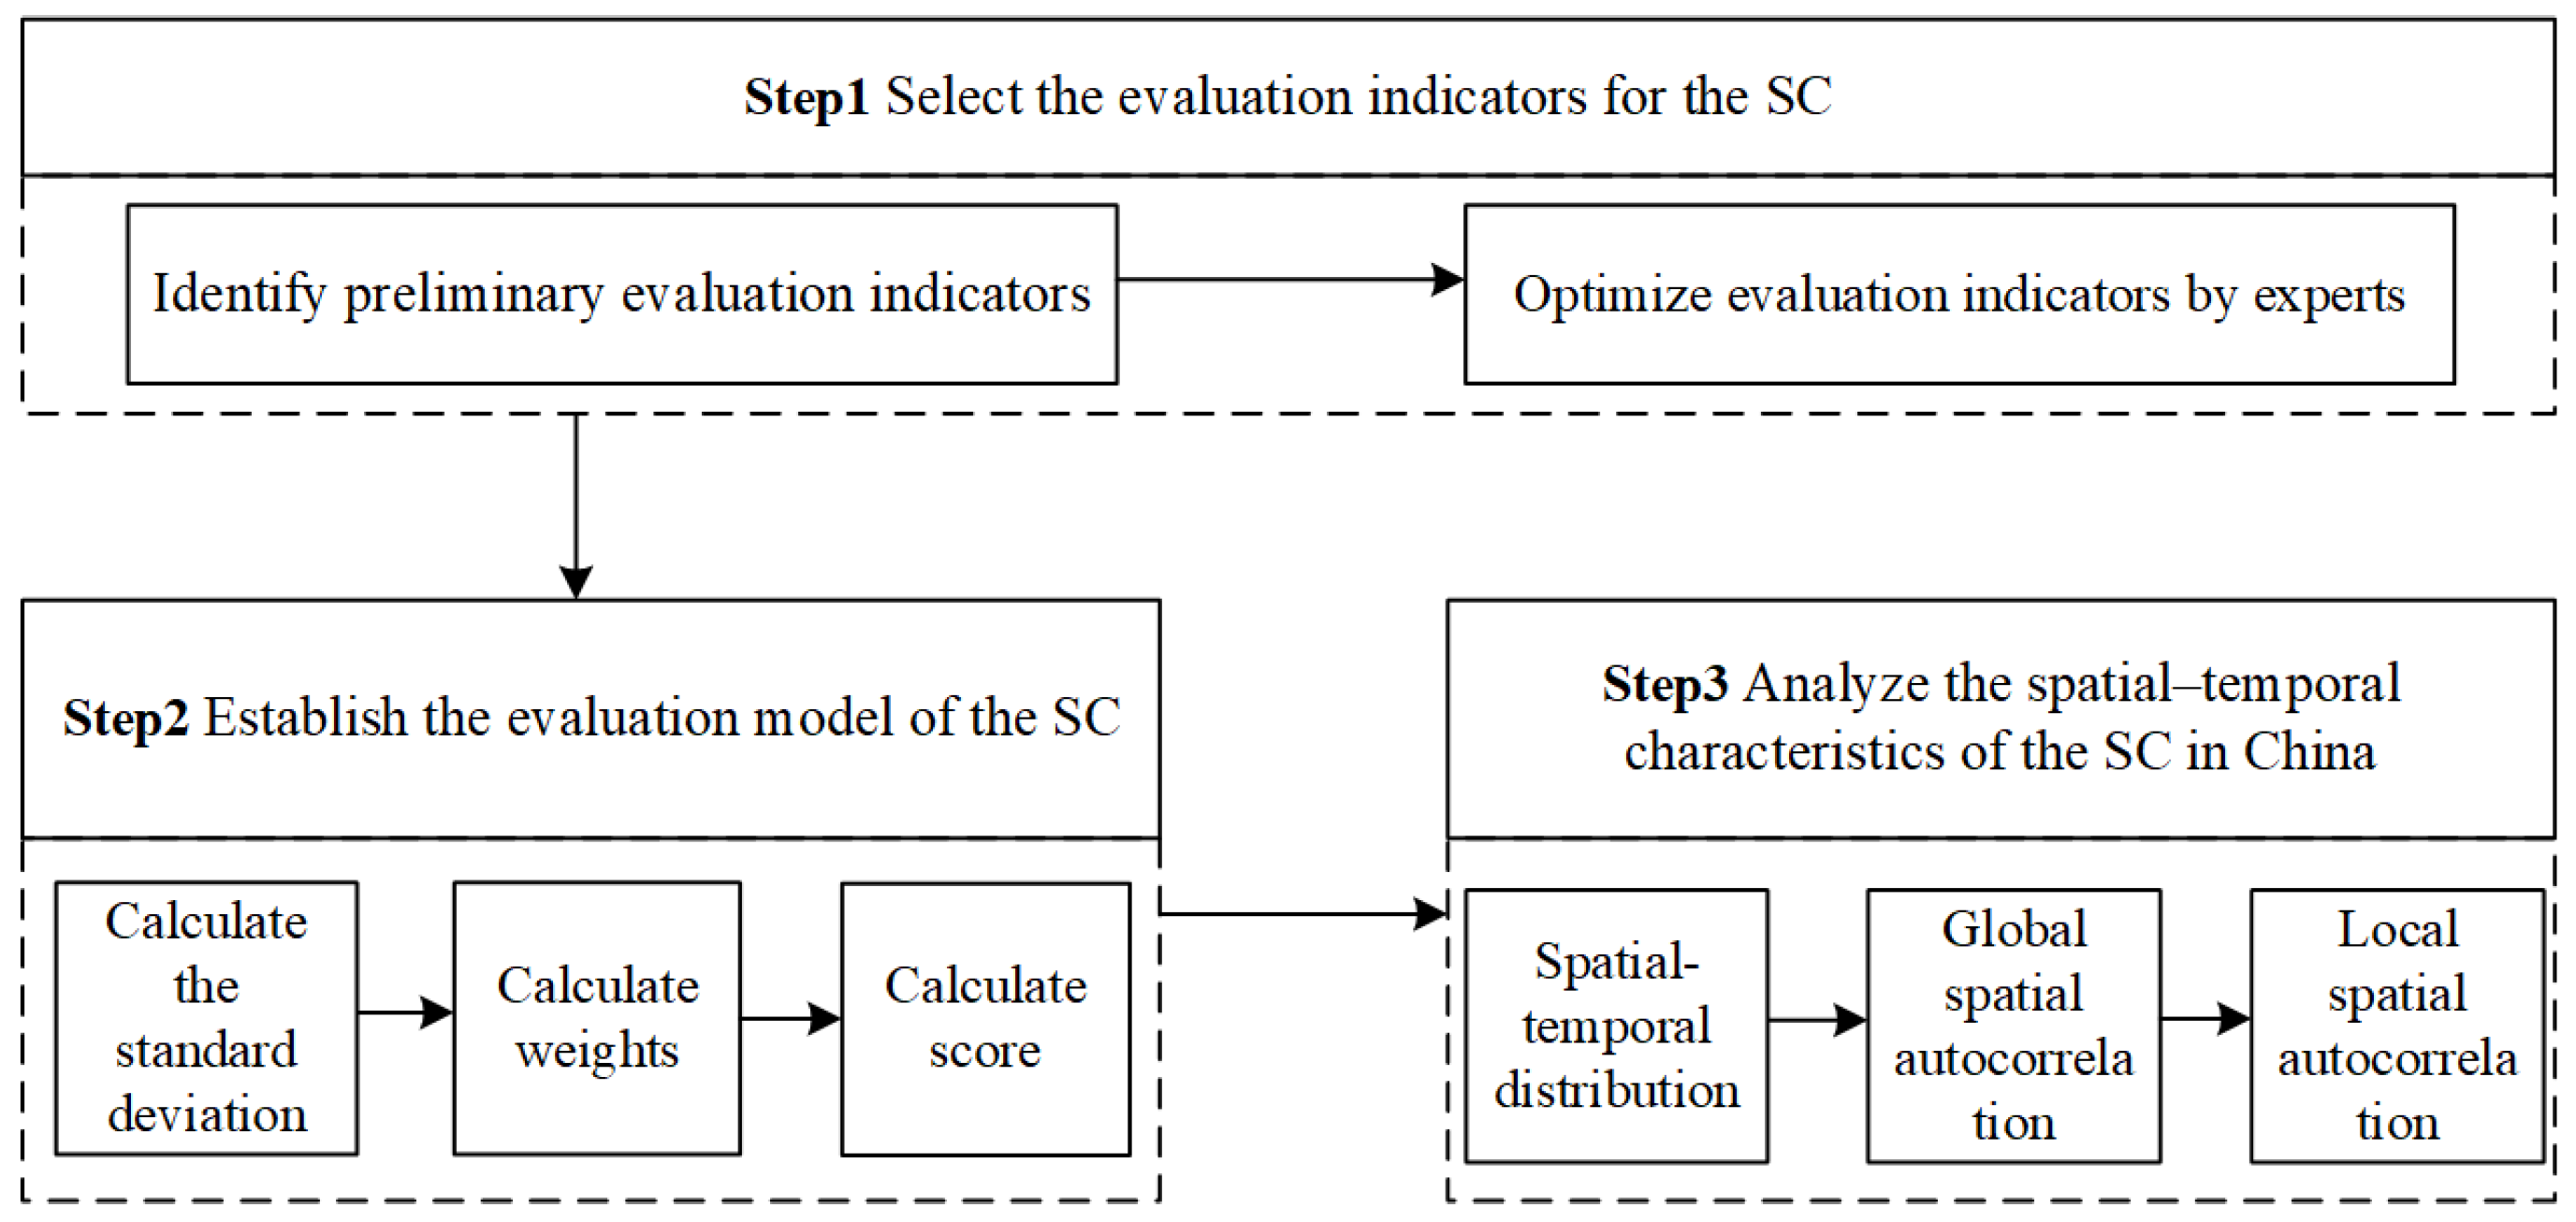
To promote overall coordinated development and narrow the differences between different cities in China, it is crucial to establish a comprehensive evaluation framework for SCs. Here, the SCL of 26 cities in the YRDUA in China over time were calculated, aiming to (1) select appropriate evaluation indicators for the SC through combining the development status of the SCs; (2) quantify the overall SCL under this evaluation indicator system; and (3) analyze the spatial–temporal differentiation characteristics of the SC through spatial correlation analysis. Then, corresponding improvement suggestions were proposed to enhance the development of SCs in China.
The significance of this paper can be summarized as follows: First, compared to the SC evaluation indicator systems mentioned in the previous literature, this paper established a more integrated and quantifiable evaluation indicator system from multiple dimensions. Second, this study establishes an SCL evaluation model based on the EWM, enabling the SC evaluation results to achieve the required accuracy and precision. Finally, this paper further explores the spatiotemporal characteristics of the 26 SCs in the YRDUA of China and provides recommendations for promoting the comprehensive development of the SC from both regional and municipal perspectives. Moreover, this study has practical implications as it not only provides insight into the current state of the SC development from a spatial–temporal perspective but also promotes a reduction in the disparities among SCs and facilitates intercity coordination.

2. Methodology

To quantify the level and analyze the spatial–temporal differentiation characteristics of SCs in China, a comprehensive evaluation framework of the SC was established utilizing the EWM and spatial autocorrelation method (global spatial autocorrelation and local spatial autocorrelation). The evaluation process is illustrated in Figure 1:
Step 1. Select the evaluation indicators for the SC.
Step 2. Establish the evaluation model of the SC.
Step 3. Analyze the spatial–temporal characteristics of the SC in China.

2.1. Selecting the Evaluation Indicators of the SC

The SC is generally viewed as a complex urban system involving many areas, such as ecological livability, industry systems, public services, infrastructure systems, and social management [5,18,19]. Aiming to establish a systematic evaluation indicator system for SCs in China, this paper conducts a literature-review-based analysis of government policies, the literature, and research reports. Within this process, there are several criteria to be met for the indicators to be appropriate: (1) The indicator needs to be generally accepted by existing researchers to improve its validity. (2) Digital technology is widely regarded as the cornerstone of the SC, so aspects of urban digital technology and intelligent applications need to be incorporated into the evaluation indicator system for the SC [20]. (3) The indicator should be specific and quantifiable. (4) The indicator should be in line with national and local policies in China, such as the ‘New Smart City Evaluation Indicators (2018)’, so that this entire evaluation indicator system is more consistent with the national context [21]. Based on the aforementioned criteria, the evaluation indicators of SCs in China were identified, resulting in an initial indicator system comprising 8 primary indicators and 43 second-level indicators. Subsequently, the availability of indicator data and consultation with 18 relevant experts led to the screening of the evaluation indicators, forming a final evaluation indicator system that consists of 8 primary indicators and 30 second-level indicators. The general information of the 18 relevant experts is provided in Appendix A, Table A1. Further details regarding these indicators are presented in Table 1.

2.2. Establishing the Evaluation Model of the SC

2.2.1. Determining Weights of Evaluation Indicators of the SC through the EWM

The EWM was first introduced by Shannon in 1948 to measure the degree of uncertainty or randomness in a system and has been widely used in urban development, environmental management, and other fields [34]. The EWM is able to proficiently manage scenarios that involve multiple criteria with varying units of measurement and scales, while also taking into account the interrelationships and correlations among the criteria, thereby resulting in more precise and consistent outcomes [35]. Considering the above advantages, it was selected to determine the weights of the SC evaluation indicators. The detailed calculation process using the EWM is as follows.
  • Data normalization.
Due to the significant differences in ranges and units of measurement of the evaluation indicators, data normalization is needed to bring all the data in a dataset to a common scale, making it easier to compare and analyze. The SCL increases with a larger positive indicator but decreases with a larger negative indicator. The following are the calculation formulas for data normalization.
The calculation formula for the positive indicator:
T i j = x i j m i n x i j m a x x i j m i n x i j
The calculation formula for the negative indicator:
T i j = m a x x i j x i j m a x x i j m i n x i j
where T i j represents the normalized data of the i-th indicator in the j-th city, and x i j represents the original data of the i-th indicator in the j-th city. m i n x i j   and   m a x x i j are the minimum and maximum values of the i-th indicator in the j-th city, respectively.
Due to subsequent calculations involving logarithmic calculations, data with a normalized value of 0 cannot be directly used. To solve this problem, all normalized data that equal 0 are transformed into non-zero data. The calculation formula for this transformation is as follows:
T i j = T i j + A
where T i j represents the processed data, T i j represents the normalized data, and A is a constant term (usually taken as 0.0001) [36].
b.
The entropy of the i-th indicator.
The entropy of the i-th indicator is calculated using the following formula:
e i = k i = 1 m p i j l n p i j
The coefficient k and coefficient pij are calculated as shown in Equations (5) and (6):
k = 1 l n m
p i j = T i j i = 1 n T i j i = 1 , 2 , , n ; j = 1 , 2 , , m
where m is the number of sample cities, and n is the number of indicators.
c.
The weight of the i-th indicator.
The weight of the i-th indicator is calculated with the following formula:
w i = g i i = 1 n g i i = 1 , 2 , , n
where Equation (8) is used to calculate the coefficient g i :
g i = 1 e i

2.2.2. Calculating the SCL

After obtaining the weights of the evaluation indicators, the SCL of each city can be calculated by combining the weights with the normalized data of each city. The SCL is calculated with the following formula, Equation (9):
F j = i = 1 n w i T i j
where wi is the weight of the i-th indicator, T i j represents the normalized data of the i-th indicator in the j-th city, and Fj represents the j-th SCL (the range of values for Fj is from 0 to 1).
Subsequently, the coefficient of variation (CV) is calculated to evaluate the degree of dispersion among different cities. The C V q in the q-th year can be determined according to Equation (10):
C V q = 1 F ¯ 1 m j = 1 m F j F ¯ 2 1 / 2
where F ¯ is the average SCL in the q-th year.

2.3. Analyzing the Spatial–Temporal Characteristics of the SC in China

To analyze the spatial–temporal characteristics of the SC in China, spatial autocorrelation analysis was utilized [37]. Spatial autocorrelation refers to the correlation between adjacent regions in space, which can be divided into global spatial autocorrelation and local spatial autocorrelation [38]. Global and local spatial autocorrelation patterns are identified using Moran’s I in order to understand the spatial dependence between different locations [39]. Moran’s I is a statistical analysis method based on Tobler’s first law of geography, which illustrates that everything is interconnected, but objects in close proximity are more strongly related than those further apart [40].
  • Global spatial autocorrelation
Moran’s I, a common indicator of spatial autocorrelation, is an important indicator used to test the global spatial autocorrelation of an attribute [41]. When Moran’s I exceeds 0, it represents that the spatial distribution is characterized by aggregation. The larger the Moran’s I, the greater the extent of aggregation. Conversely, when Moran’s I is less than 0, it indicates discretization. The smaller the Moran’s I value, the greater the extent of discretization. When Moran’s I is equal to 0, it indicates randomness. Moran’s I was calculated according to the following equation.
I = i = 1 m j = 1 m W i j F i F ¯ F j F ¯ S 2 i = 1 m j = 1 m W i j
In the formula S 2 = i = 1 m F i F ¯ 2 / m, W i j is the spatial weight matrix.
Moreover, the statistic Z that conforms to a normal distribution is used to determine the significance of the spatial correlation in the region. The Z-statistic is calculated as follows:
Z = I E I V A R I
where E(I) represents the expected I, and VAR(I) represents the variance of I.
The variance of I is calculated using Equation (13):
V A R I = m 2 S 1 m S 2 + 3 i = 1 m j = 1 m W i j 2 m 1 m + 1 i = 1 m j = 1 m W i j 2 1 m 1 2
S 1 = 1 2 i = 1 m j = 1 m W i j + W j i 2
S 2 = i = 1 m W i . + W . i 2
The expected I can be obtained from Equation (16):
E I = 1 m 1
b.
Local spatial autocorrelation
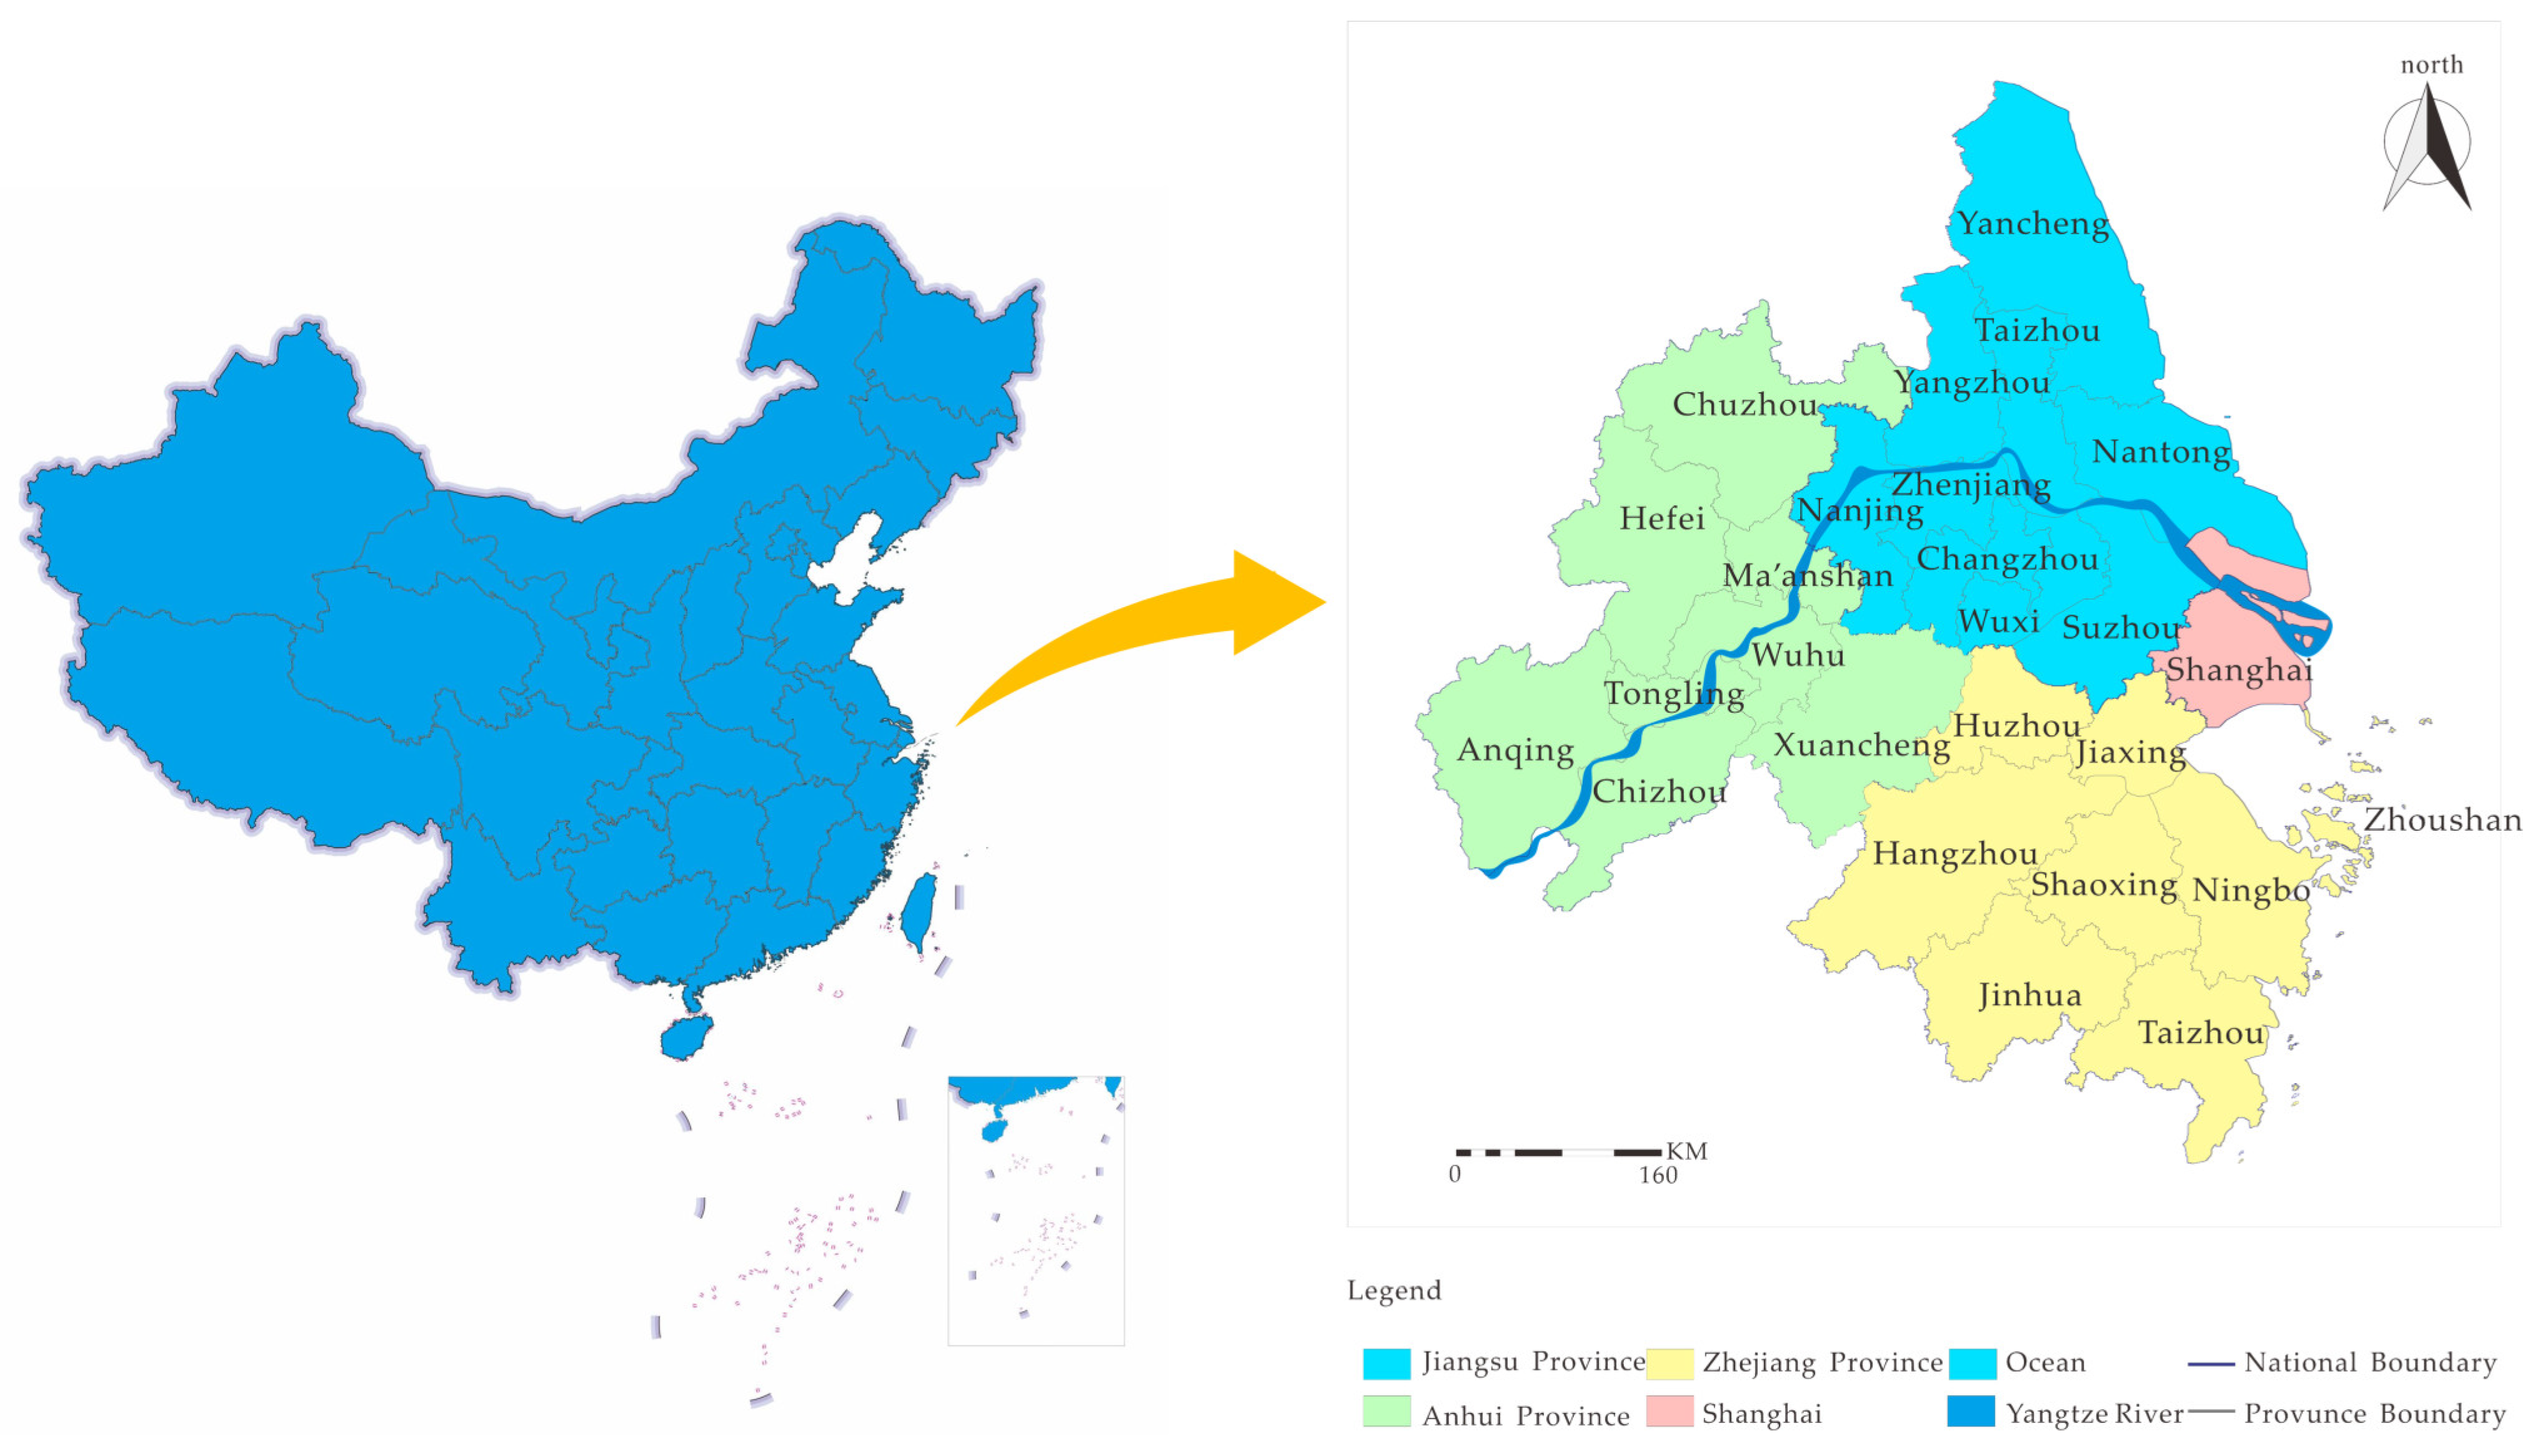
The utilization of local spatial autocorrelation serves to gauge the spatial clustering characteristics of local subsystems and investigate the spatial variation in the SCL between a given city and its neighboring cities [42]. The local autocorrelation statistic is as follows:
I i = F i F ¯ S 2 j = 1 m W i j F j F ¯
The Zi is calculated:
Z i = I i E I i v a r ( I i )
The local Moran’s I ( I i ) is frequently utilized to appraise the local spatial correlation of the SCL by means of the Local Indicators of Spatial Association (LISA) clustering map. In the LISA clustering map, cities that have undergone a z-test will exhibit four types of agglomeration. When I i exceeds 0, it indicates positive spatial autocorrelation, which means a ‘High–High’ cluster or a ‘Low–Low’ cluster. When I i is less than 0, it indicates negative spatial autocorrelation, which refers to a ‘High–Low’ cluster or a ‘Low–High’ cluster. Cities that did not pass the significance test were labeled ‘not significant’. This study employs a 95% confidence level.

3. Case Study

3.1. Study Area

The Yangtze River Delta Urban Agglomeration (abbreviated as YRDUA, latitude: 27°03′ N–34°27′ N and longitude: 115°45′ E–122°50′ E), situated in southeastern China and bordered by the Yellow Sea and the East China Sea, is recognized as the world’s sixth-largest urban agglomeration [43]. As of 2018, the YRDUA encompassed a total area of 217,000 square kilometers, with a population of 154 million. Despite occupying only 2% of China’s land area, the YRDUA accounts for a staggering 20% of China’s total economic output, cementing its status as the most vibrant and open strategic region for China’s economic development [44]. The YRDUA consists of nine prefecture-level cities in Jiangsu Province (Changzhou, Yancheng, Wuxi, Suzhou, Taizhou, Nantong, Yangzhou, Nanjing, and Zhenjiang), eight prefecture-level cities in Zhejiang Province (Ningbo, Zhoushan, Hangzhou, Shaoxing, Jiaxing, Jinhua, Taizhou, and Huzhou), eight prefecture-level cities in Anhui Province (Chizhou, Anqing, Chuzhou, Tongling, Ma’anshan, Wuhu, Hefei, and Xuancheng), and Shanghai, as shown in Figure 2.
The SCs in the YRDUA were selected as typical cases for the following reasons: First of all, the urban agglomeration of the YRDUA boasts the highest level of urbanization in China, with an average urbanization rate of 67.38% [45]. Moreover, the progress and development of cities in the YRDUA serve as critical engines of China’s social and economic advancement. Considering the context of China’s economic development and urbanization, the YRDUA has become a typical urban agglomeration that is useful for analyzing the current status and patterns of the development of SCs. The YRDUA is one of the four major SC clusters in China and was one of the first regions to undertake the construction of SCs. Its rapid progress in the construction of SCs, particularly in terms of regional cooperation and integrated development, has led to significant achievements in digital contributions [46]. Finally, the differences in the levels of economic and infrastructure development among the cities in the YRDUA are conducive to analysis [44]. Thus, as a highly developed SC agglomeration, the YRDUA is a good representative of SC research. Conducting a spatiotemporal analysis of SCs in the YRDUA can not only help clarify the spatiotemporal evolution pattern of the SCs in this region but can also provide valuable suggestions for the sustainable and healthy development of the SC in China more broadly.

3.2. Data Sources

To ensure the veracity and dependability of the research findings, the data utilized in this study were sourced exclusively from the China City Statistical Yearbook 2017–2020, Government Work Annual Report 2017–2020, the Government website Work Annual Report 2017–2020, Government Information Disclosure Annual Report 2017–2020, and ‘the 2020 Yangtze River Delta Government Opening Data Integration Report’. The data collection period covers the duration from the establishment of each municipal institution until January 2023. In the event of any data gaps, interpolation techniques were employed to fill in the missing values.

4. Results

4.1. Evaluation Results of SCs in the YRDUA

4.1.1. Weights of Evaluation Indicators through the EWM

After compiling all the data on the evaluation of the SC, the weights of 30 evaluation indicators were calculated based on the EWM, which avoided the effect of subjectivity factors. Detailed information regarding the weight of each indicator is presented in Table 2. The relevant data and process for determining the weights of evaluation indicators through the EWM are presented in the Supplementary Materials. According to Table 2, the calculated weights for the second-level indicators ranged from 0.0009 to 0.0978. Notably, the second-level indicators X5(0.0978), X6(0.0945), and X20(0.0933) emerged as the top three weighted indicators, illustrating significant disparities in these three aspects among the 26 cities of the YRDUA. Simultaneously, the lowest three second-level indicators in terms of weights were the X22(0.0009), X4(0.0010), and X19(0.0014), indicating that each city developed to a similar degree in these aspects. Of all the indicators, five had a weight less than 0.005, accounting for 16.7% of the total. Meanwhile, the largest proportion had a weight between 0.005 and 0.01, which comprised six second-level indicators. The weights of four second-level indicators fell between 0.01 and 0.02, while another four second-level indicators had a weight between 0.02 and 0.03, accounting for 13.3% of the total, collectively. The number of second-level indicators with a weight between 0.03 and 0.04 and between 0.06 and 0.07 was one each, collectively accounting for 3.3%. Additionally, the number of second-level indicators with a weight between 0.03 and 0.04 and between 0.06 and 0.07 was one each, collectively accounting for 3.3%. There were three indicators with a weight between 0.05 and 0.06, and two indicators with a weight between 0.07 and 0.08, accounting for 10% and 6.67%, respectively. In addition, four indicators had a weight exceeding 0.08, accounting for 13.3%.

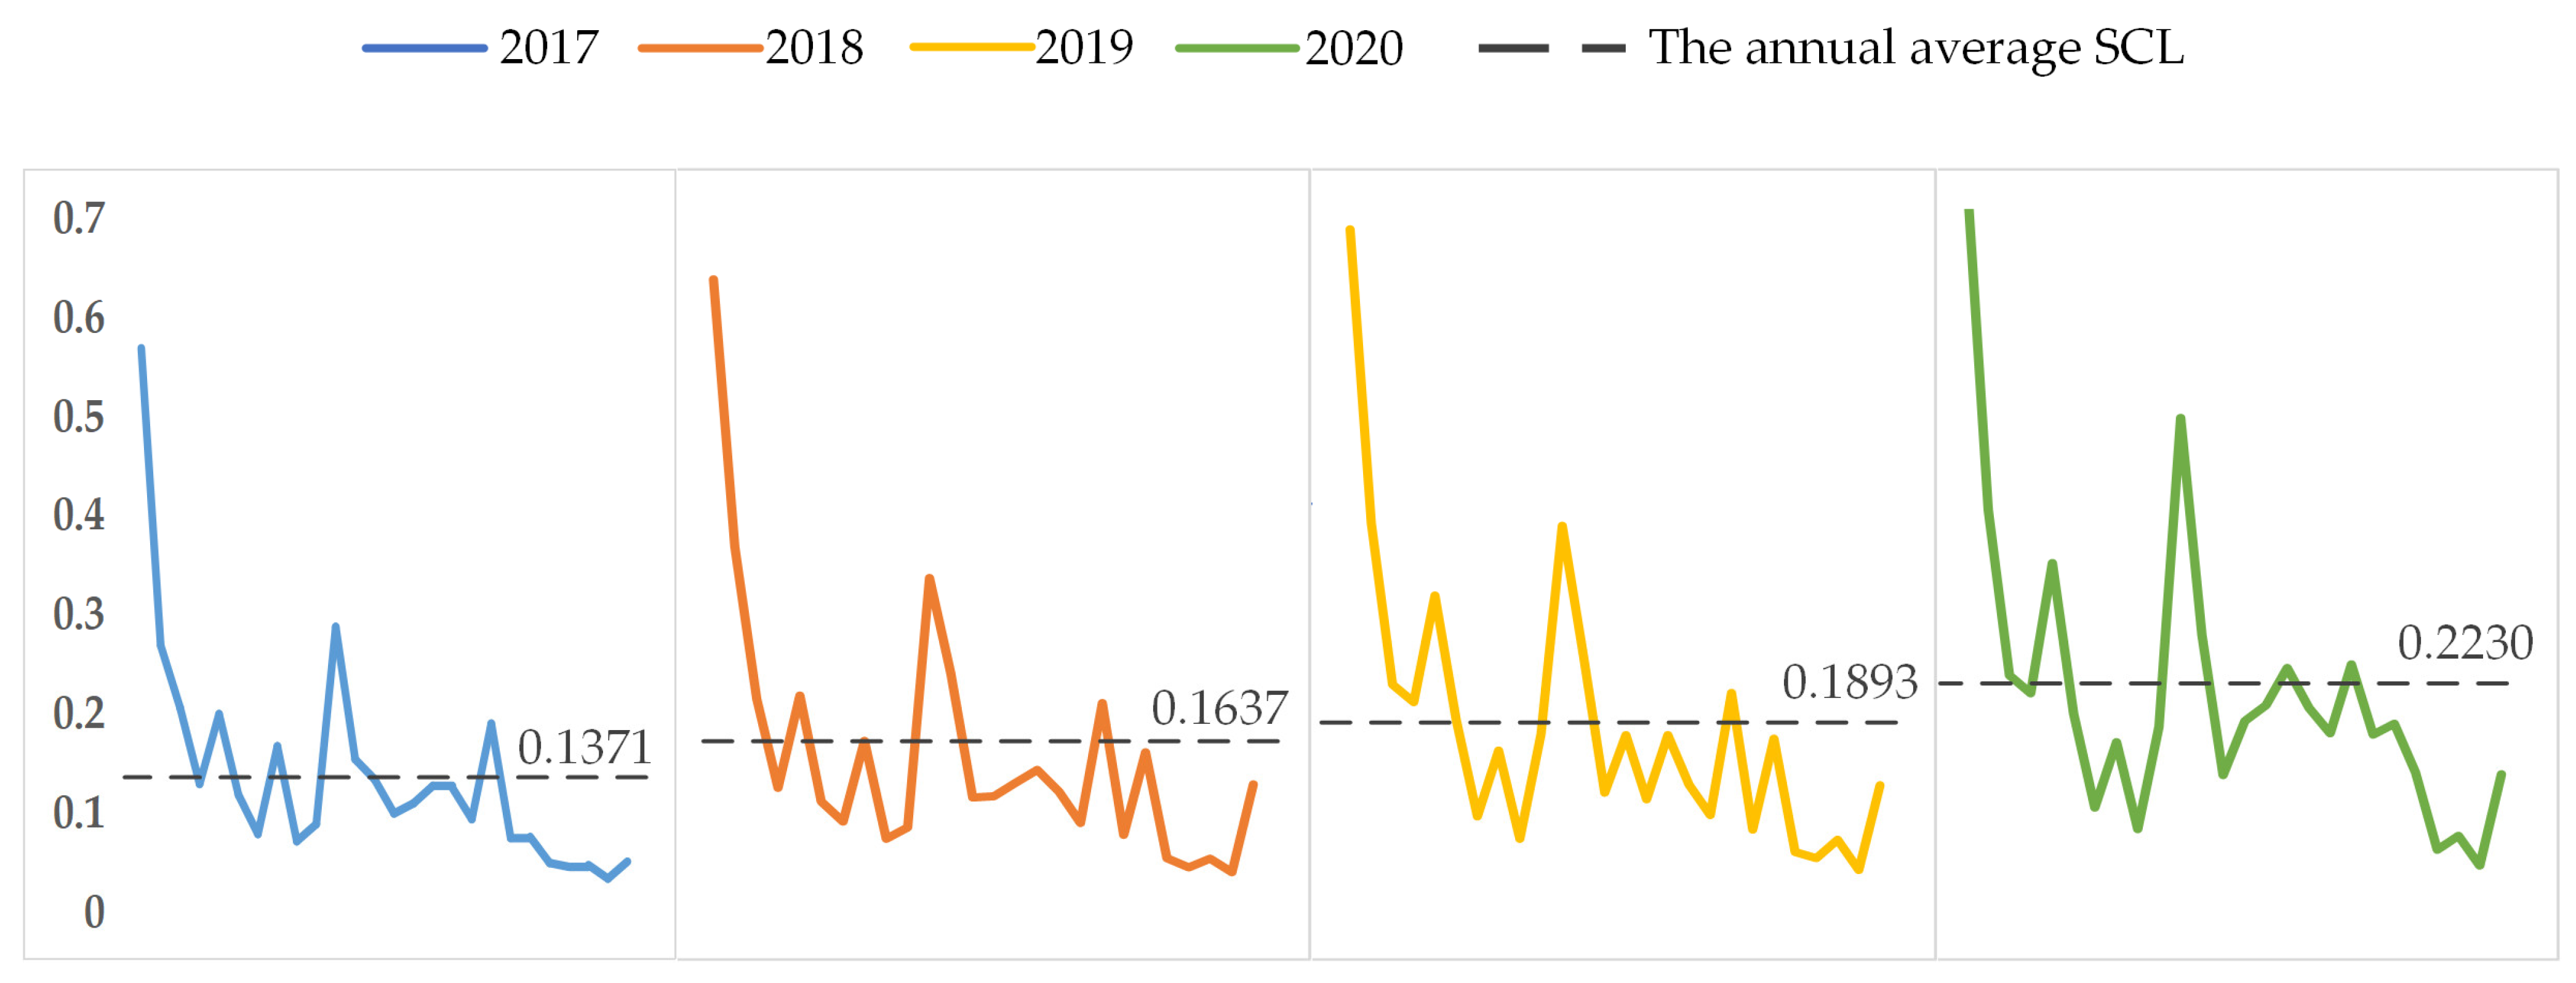
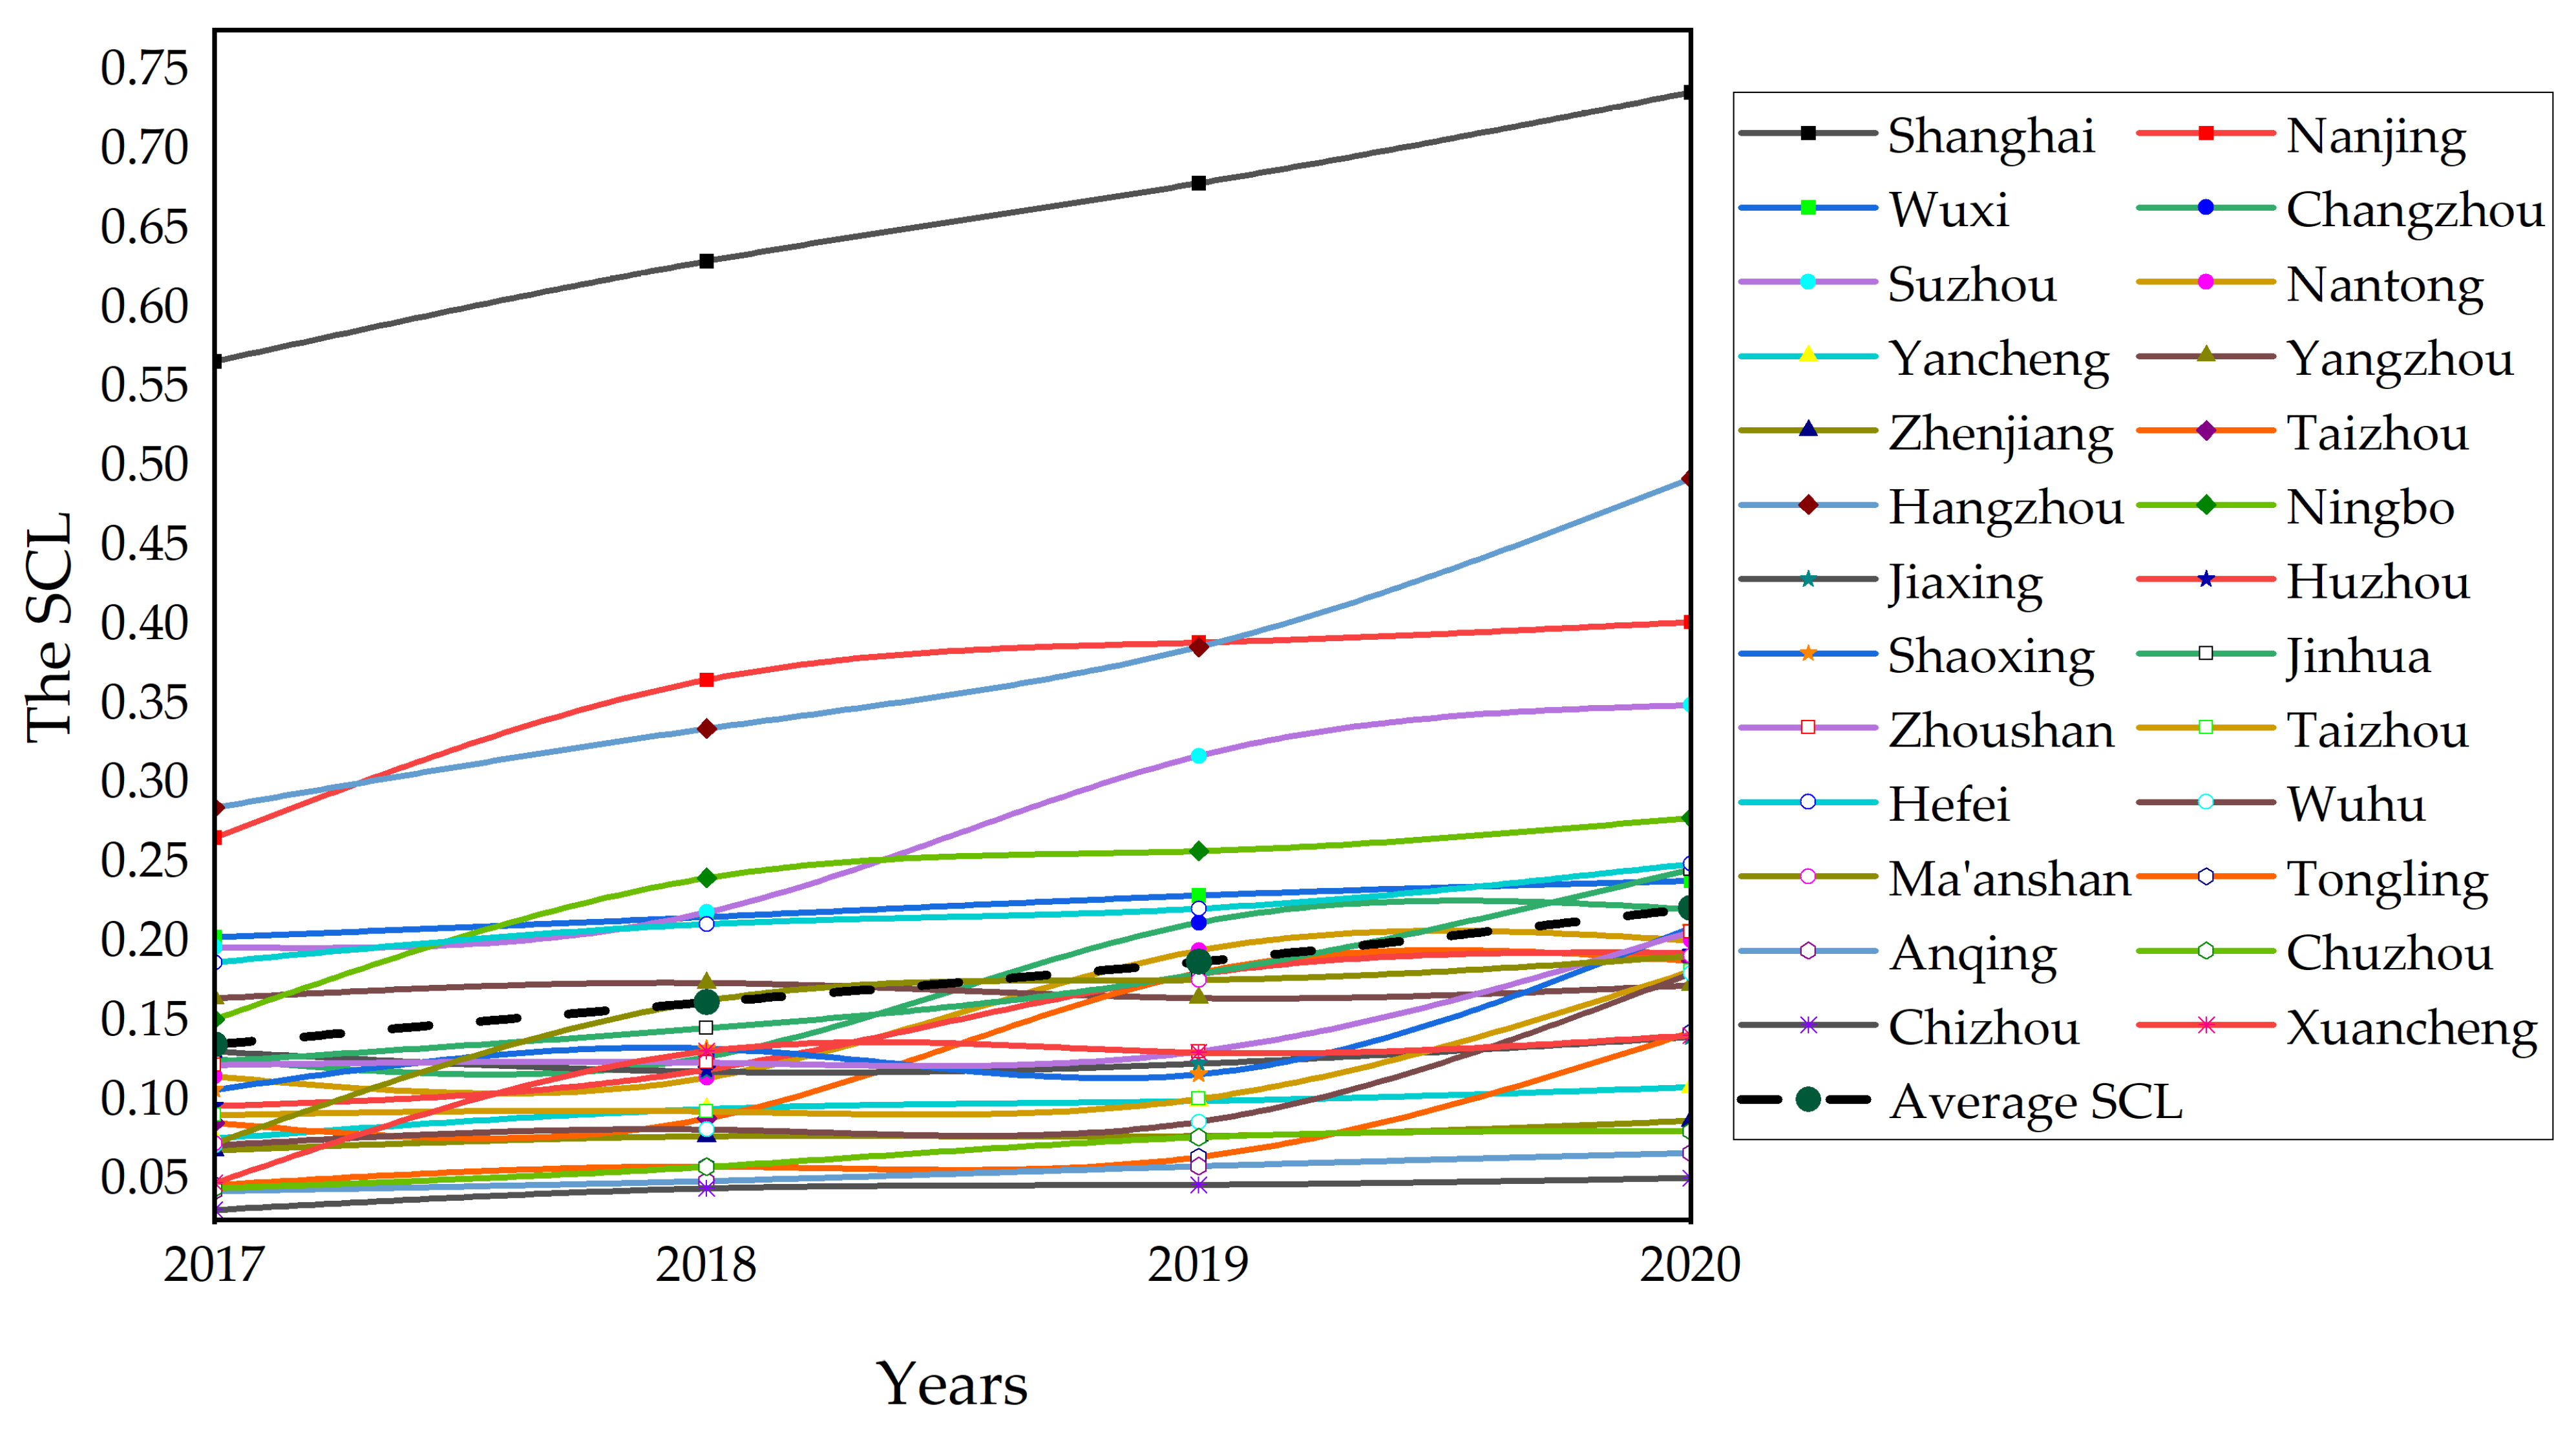
4.1.2. Calculation Results of the SCL in the YRDUA

Utilizing the evaluation indicator weights for the SC obtained through the EWM coupled with the annual indicator data for each city spanning from 2017 to 2020, the SCLs of cities in the YRDUA were calculated and are presented in Figure 3 and Figure 4 (the detailed calculation results of the 26 cities are provided in Appendix A, Table A2). From 2017 to 2020, the SCL of the YRDUA showed an overall upward trend, while the characteristics of the growth varied. Specifically, in the period of 2017 to 2018, the SCL of Nanjing, Ningbo, and Ma’anshan exhibited fast growth rates. In the years 2018 to 2019, the SCL of Suzhou, Taizhou, Changzhou, and Nantong indicated that they were the cities with faster growth rates. From 2019 to 2020, the SCL with the most significant growth was mainly located in Zhejiang Province, in cities such as Hangzhou, Shaoxing, and Taizhou. Notably, Shanghai consistently maintained a significantly higher SCL than the regional average from 2017 to 2020, with sustained rapid progress. In contrast, Chizhou maintained the lowest SCL throughout the period, with relatively slow growth.
To further observe the changes in the measures of dispersion and the growth of the average SCL from 2017 to 2020, the increase rate of the average SCL and the CV of the years 2017–2020 were calculated and are presented in Table 3. The results indicate that from 2017 to 2020, the average SCL increased each year, while the CV decreased, suggesting overall growth in SCL across the cities and a reduction in the disparity between them. Specifically, the average SCL showed the fastest growth in the years 2017–2018, with a growth rate of 19.38%, and then steadily increased to 0.22304 in 2020. This means that although the SCL of each city in the YRDUA showed a growing trend, the overall SCL in the region was still relatively low. Meanwhile, the CV decreased the fastest in the years 2019–2020, with a decline of up to 9.82%, reaching 0.636717 in 2020. This indicates that the spatial differences in SCL within the YRDUA have been gradually narrowing, and this trend of reduction is becoming more evident.

4.2. Spatial–Temporal Characteristics of the SC in the YRDUA

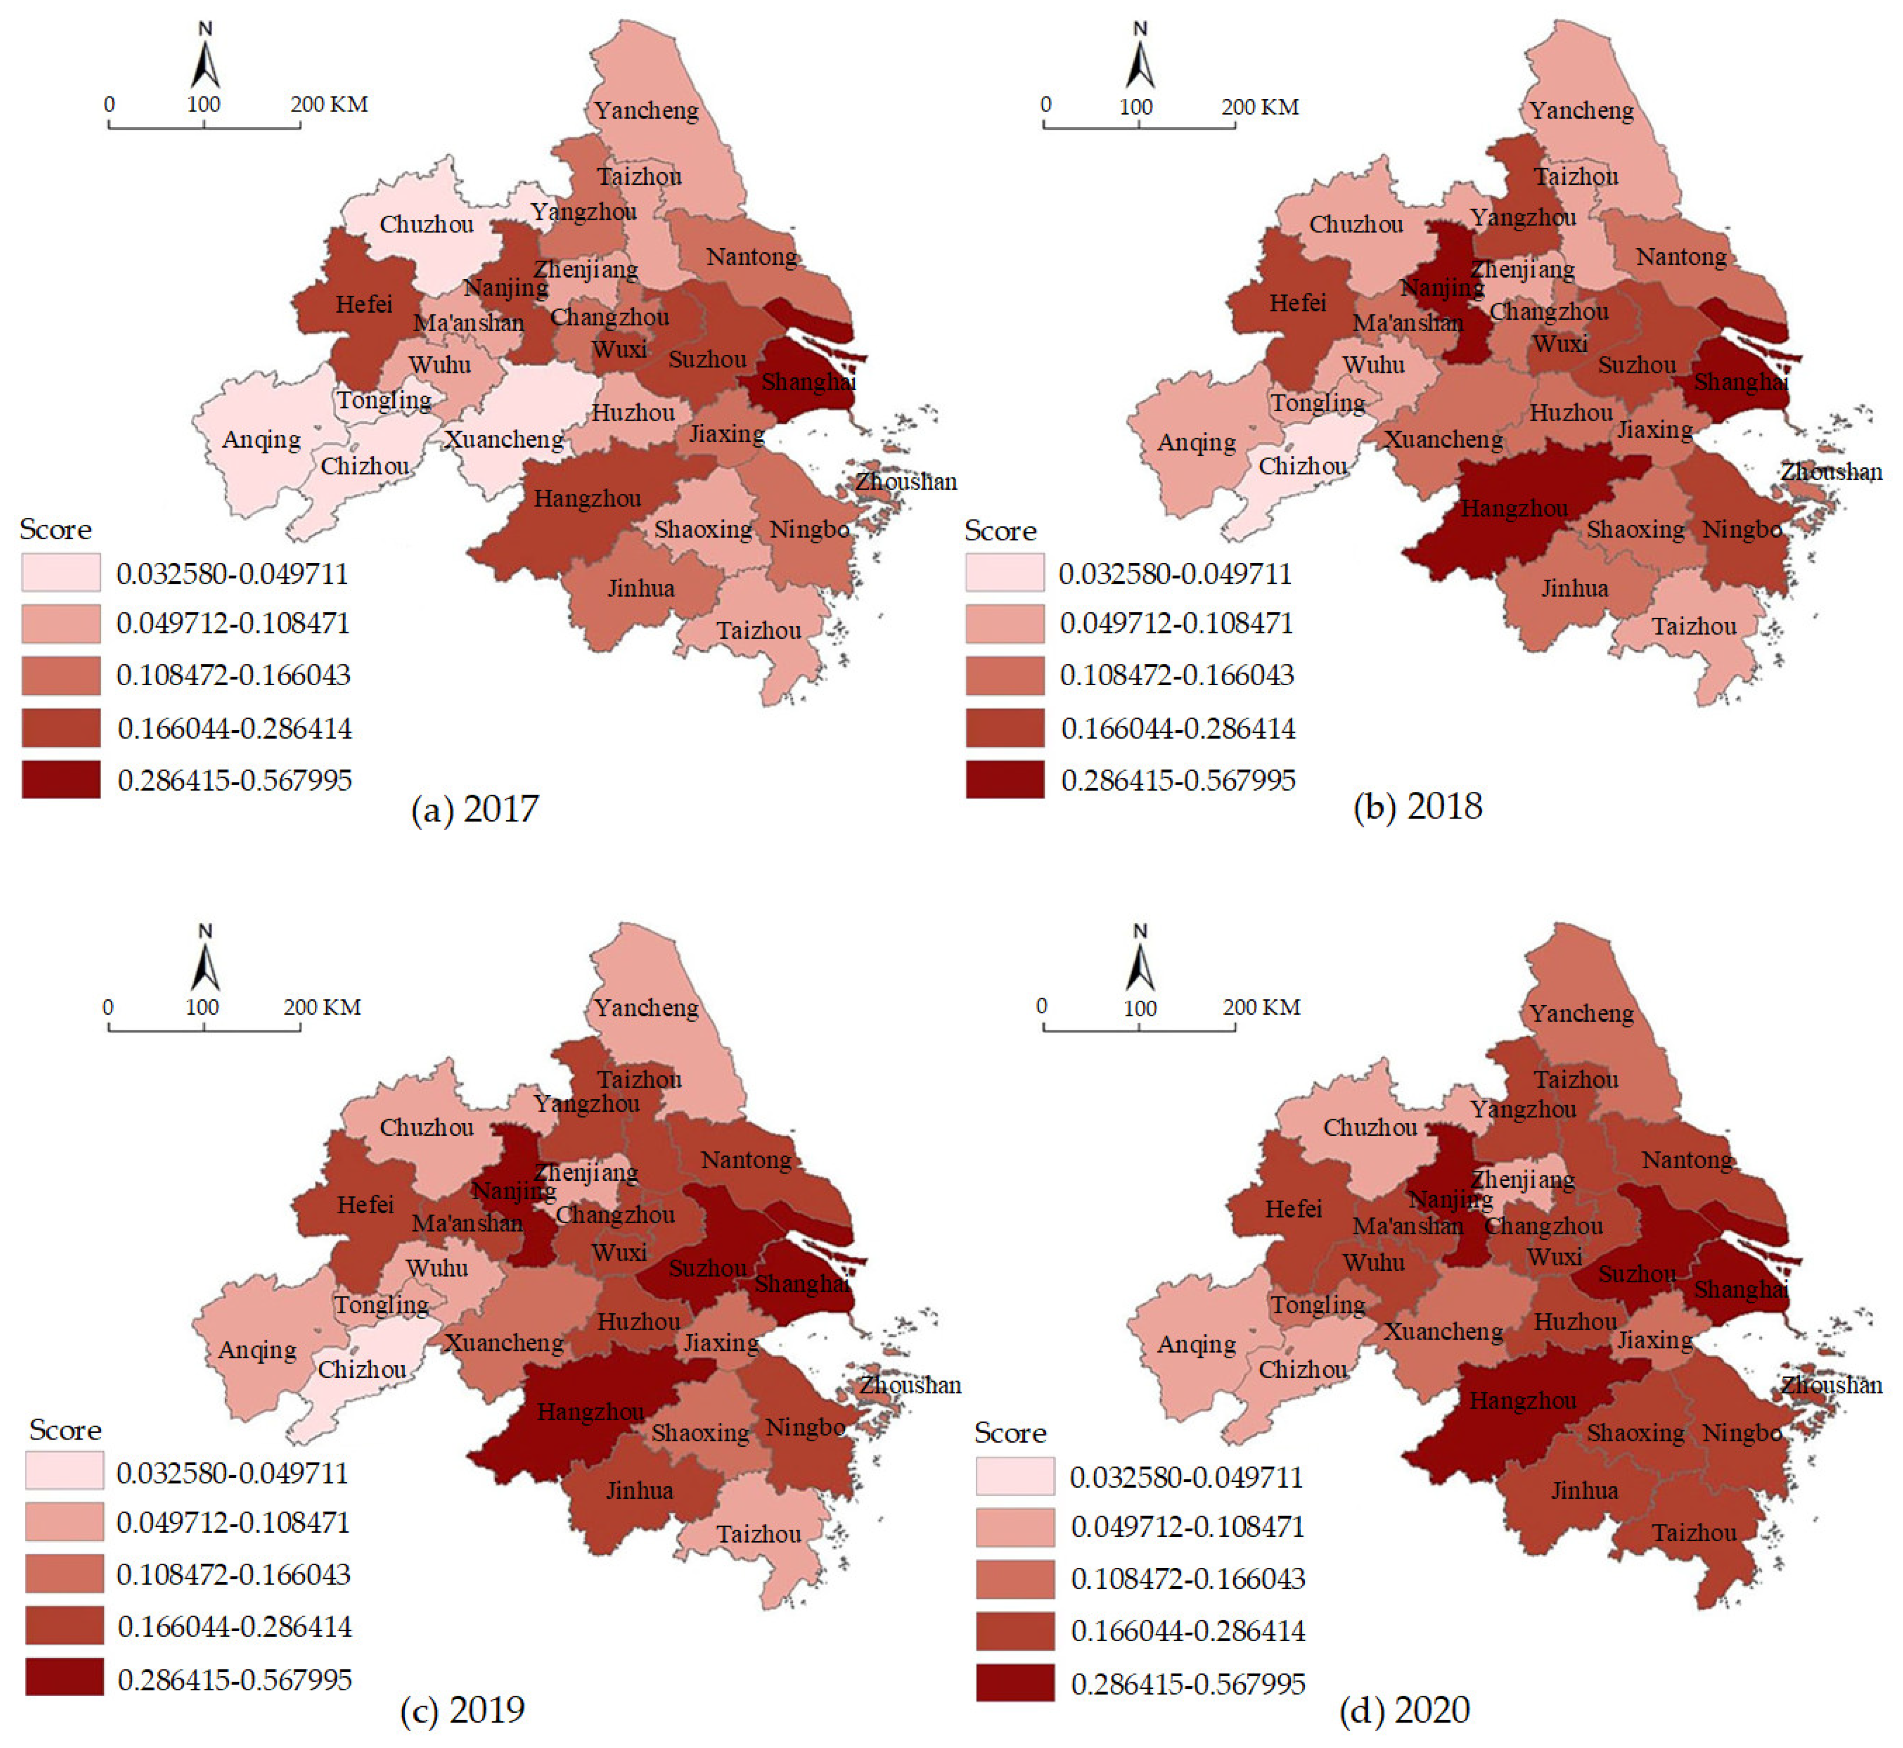
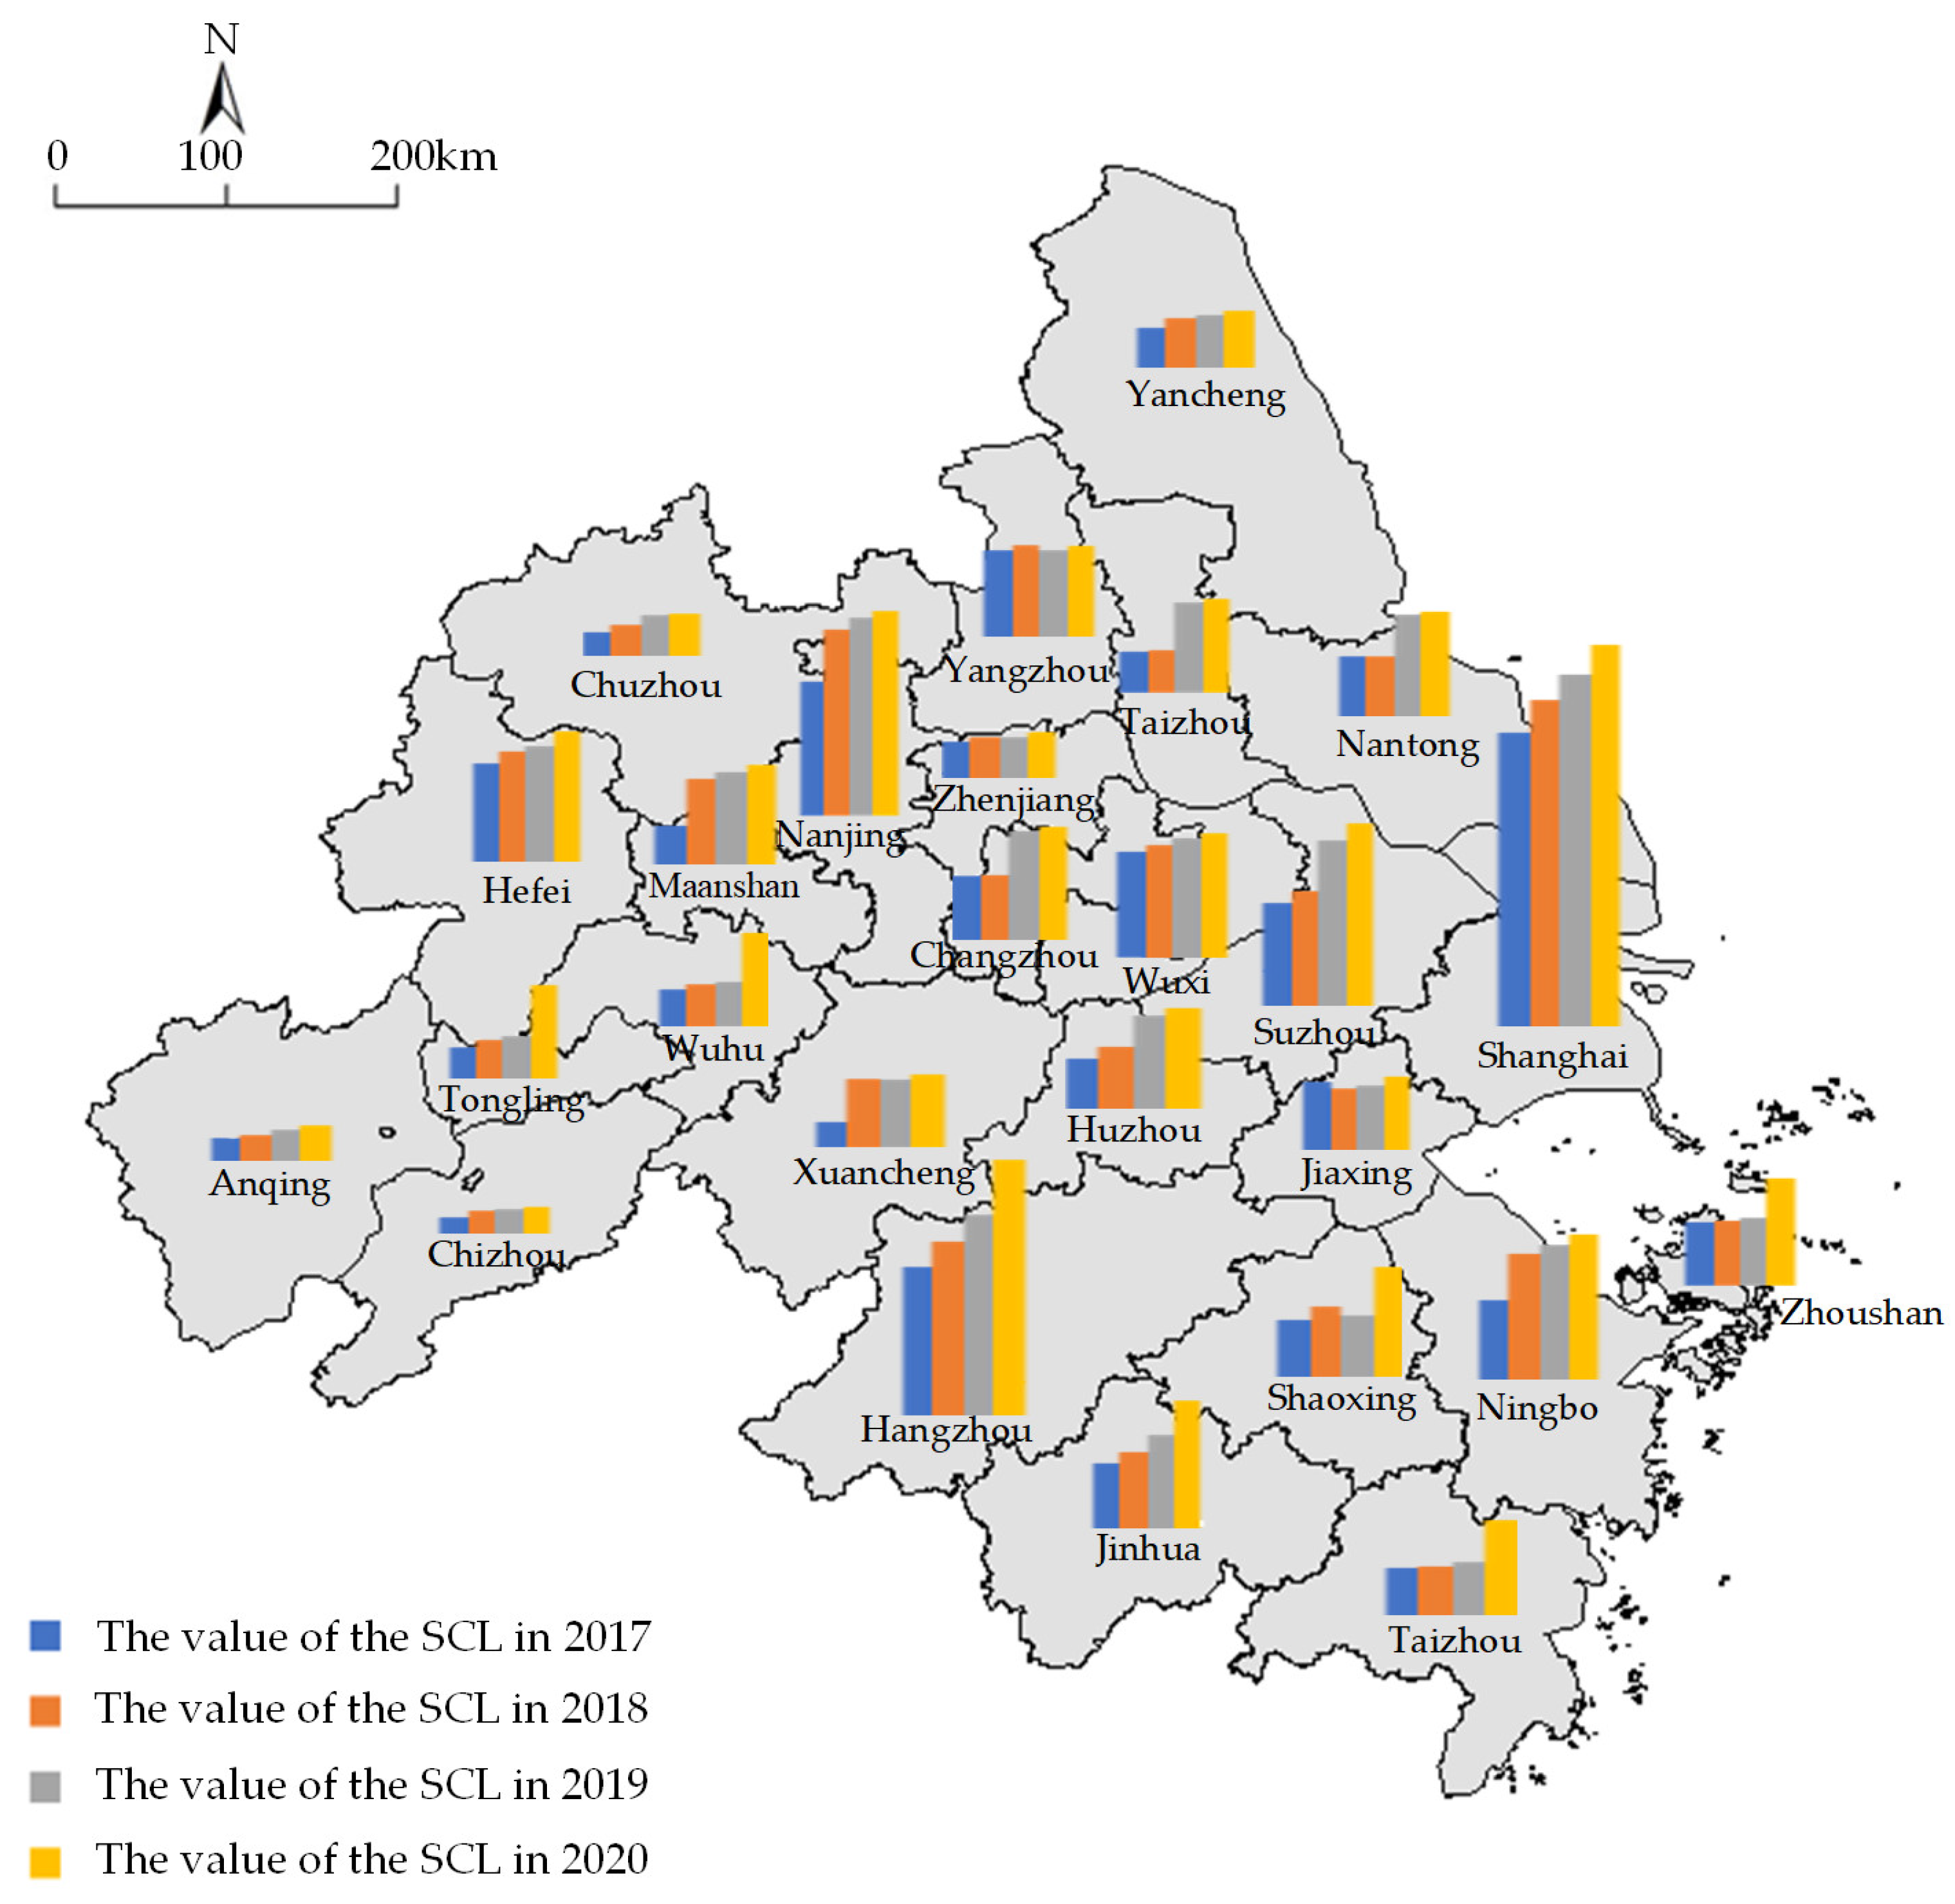
4.2.1. Spatial–Temporal Distribution of the SCL in the YRDUA

To gain a comprehensive understanding of the spatial and temporal distribution of the SC in the YRDUA, the SCL values of these 26 cities from 2017 to 2020 were inputted into ArcGIS software (10.8 version) and divided into five levels using the natural breakpoint method: excellent (0.286415–0.737779), good (0.166044–0.286414), general (0.108472–0.166043), inferior (0.049712–0.108471), and poor (0.032580–0.049711). The classification standards of the SCL in the YRDUA are presented in Table 4. Spatial distribution is shown in Figure 5, and temporal distribution is presented in Figure 6.
As can be seen in Figure 5, the majority of cities in the YRDUA showed an improvement in the SCL from 2017 to 2020, entering higher gradients. Notably, the number of cities in the excellent gradient increased from one to four, primarily located in the eastern part of the YRDUA, and they are all first-tier or new first-tier cities (Shanghai, Hangzhou, Nanjing, and Suzhou). Meanwhile, all cities have already moved away from the poor gradient. Moreover, it is observed from Figure 6 that the SCL of the YRDUA exhibited a consistent upward trend from 2017 to 2020. In particular, 21 cities demonstrated a stable growth pattern, while 5 cities (Yangzhou, Taizhou, Xuancheng, Jiaxing, and Shaoxing) experienced fluctuations in their growth.
Specifically, from 2017 to 2018, the number of excellent gradient cities increased from one (Shanghai) to three, with Hangzhou and Nanjing joining this group, where Nanjing showed significant growth in its SCL. Meanwhile, four cities in the western part of the YRDUA, Wuhu, Anqing, Tongling, and Chuzhou, moved from the poor to the inferior gradient. In 2018–2019, Suzhou, located in the eastern part of the YRDUA, moved from the good to the excellent gradient, and cities in the eastern part of the YRDUA generally improved, reaching the general gradient and above. Notably, cities like Nantong, Taizhou, and Suzhou experienced substantial growth in their SCL. In 2019–2020, Chizhou exited the poor gradient and entered the inferior gradient. By 2020, most cities in the western part of the YRDUA were in the general and inferior gradients, particularly Tongling and Wuhu, which witnessed rapid growth in their SCL and entered the general and good gradients, respectively. At the same time, cities like Zhoushan, Shaoxing, Taizhou, and Jinhua in the eastern part of the region showed significant growth in their SCL; as a result, the majority of cities in the eastern part of the region rose to the good gradient and above. Overall, the SCL in the YRDUA showed a distribution pattern of higher levels in the east and lower levels in the west.

4.2.2. Results of Global Spatial Autocorrelation Analysis

The global Moran’s I of the SCL in the YRDUA and the corresponding significance test results from 2017 to 2020 were calculated using ArcGIS software (10.8 version) and are presented in Table 5. The global Moran’s I values from 2017 to 2020 were less than 0, while their p-values were more than 0.05, and the z-scores were less than −1.65. This means that there are no clear dispersion distributions of the SCL across the YRDUA.

4.2.3. Results of Local Spatial Autocorrelation Analysis

To further explore the local spatial autocorrelation between neighboring cities, the LISA clustering map of the SCL in the YRDUA from 2017 to 2020 was generated using ArcGIS software (10.8 version). As shown in Figure 7, 19.2%, 19.2%, 23.1%, and 15.4% of cities showed significant spatial correlation from 2017 to 2020, respectively. During 2017–2020, Hefei showed the ‘H-L’ cluster, Chizhou showed the ‘L-L’ cluster, and Jiaxing and Zhoushan presented the ‘L-H’ cluster. Meanwhile, Wuhu presented the ‘L-L’ cluster in 2017, Tongling showed the ‘L-L’ cluster in 2018 and 2019, and Nantong showed the ‘H-H’ cluster in 2019.

5. Discussion

5.1. Analysis of Temporal Characteristics of the SC in China

From 2017 to 2020, the SCL in the YRDUA showed an upward trend, which is consistent with the research of Chao et al. (2023) [47]. There are two reasons for this trend. On the one hand, urban economic development is closely linked to social welfare. Sustained economic development provides production factors and development foundations for urban construction, promoting the development of SCs [22,48]. On the other hand, national and local governments have formulated and implemented SC policies, reorganizing urban development resources and improving the efficiency of SC development in the ecological environment and industrial reform sectors [49,50]. For example, The Ministry of Housing and Urban–Rural Development of China initiated the SC pilot project in 2013, followed by the introduction of various SC development policies. These include the ‘Opinions on Further Strengthening Urban Planning and Construction Management’ and the ‘National New Urbanization Plan (2014–2020)’, which accelerated the development speed of SCs [51].
The growth rate of the SCL varies across four years, primarily due to the differences in the implementation of SC policies in different regions [22,48]. Specifically, during the period of 2017 to 2018, the SCL in the three cities of Nanjing, Ningbo, and Ma’anshan witnessed rapid growth. This may be attributed to the implementation of corresponding SC policies in these cities [52]. The implementation of policies such as the ‘Thirteenth Five-Year Plan for the Development of Smart Nanjing’, the ‘Digital Ningbo Construction Plan (2018–2020)’, and the ‘2017 Work Points for Smart City in Ma’anshan’ has played a crucial role in promoting the development of the SCs. These policies have facilitated the establishment of SC information open platforms and contributed to significant improvements in the utilization capacity of urban information resources. As a result, there has been a rapid increase in the SCL [53]. In the years 2018 to 2019, Suzhou, Taizhou, Changzhou, and Nantong witnessed faster growth in their SCL. A probable cause may be their active response to the ‘Three-Year Action Plan for Smart Jiangsu Construction (2018–2020)’ issued by Jiangsu Province, which resulted in significant growth in their infrastructure systems [3,54,55]. From 2019 to 2020, the cities with rapid growth in SCL were mostly concentrated in Zhejiang Province. During this period, Zhejiang province has continuously developed high-tech industries and utilized advanced technologies to transform traditional industries, thereby optimizing the industrial structure and leading to a rapid improvement in the level of urban industrial systems [56]. Notably, Shanghai consistently maintained a significantly higher SCL than the regional average from 2017 to 2020, and it continued to grow at a high pace, which is consistent with the research of Li et al. (2018) [29]. The factors that contributed to this result may include Shanghai’s developed economy, improved infrastructure, and early initiation of the SC construction that dates back to 2010 [29]. Furthermore, Shanghai has continuously introduced relevant policies for the development of SCs in order to drive progress [57]. In contrast, Chizhou’s consistently low and slow growth in SCL over the four years is likely due to limitations imposed by its weak city resources and infrastructure [58].
Meanwhile, the disparity in the SCL among cities has gradually narrowed, and the CV of the SCL has continuously decreased over the four-year period. This is consistent with the research findings of Liu et al. (2022) on the high-quality development of cities in the Yangtze River Basin [59]. The main reason for the narrowing gap in urban development levels may be attributed to the regional coordinated development of the Yangtze Economic Belt, the facilitation of intercity cooperation, and the promulgation of policies for the integration of the YRDUA [59,60,61]. Additionally, in particular, during the ‘Thirteenth Five-Year Plan’ period, the government issued the ‘The 13th Five-Year Plan for Informatization Cooperation in the Yangtze River Delta’ to enhance the sharing of information and infrastructure resources in the YRDUA. In 2018, the integration of the YRDUA was elevated to a national strategy, and with the release of the ‘Outline of the Integrated Regional Development of the Yangtze River Delta’, the awareness of regional integration in the YRDUA was strengthened, which further promoted mutual coordination and common development among cities in the region [62].

5.2. Analysis of Spatial Characteristics of the SC in China

5.2.1. Analysis of Spatial Distribution of the SCL in the YRDUA

Based on an analysis of the spatial and temporal distribution of the SCL, it can be concluded that the SCL in the YRDUA is high in the east and low in the west. More precisely, Suzhou, Hangzhou, Shanghai, and Nanjing, located in the eastern region of the YRDUA, have achieved remarkable progress in SC construction and have consistently been in the excellent gradient since 2019. This result is consistent with the research of Wang et al. [63]. There are two reasons for these phenomena. On the one hand, these cities were among the first pilot cities involved in SC development in China and began their construction relatively early. On the other hand, they possess flourishing economies, abundant resources, and advanced infrastructure, providing a solid material foundation for launching corresponding SC construction plans [3]. However, cities that are in the inferior gradient in 2020 are mainly located in Anhui province and the western part of the YRDUA. The main reasons for the low SCL of these cities are insufficient innovation vitality, high rates of talent outflow, low-level development of smart industries, and the relatively late introduction of SC-related policies [58].

5.2.2. Analysis of Global Spatial Autocorrelation for the SC

As shown by the global autocorrelation result, the spatiotemporal distribution of the SCL in the YRDUA is not clustered or dispersed but presents randomness. Specifically, the eastern part of the YRDUA has developed into a high-level intelligent urban agglomeration with Shanghai as its center. In other parts of the YRDUA, cities such as Hefei and Nanjing, despite their high level of intelligence, have limited impact on the surrounding cities, resulting in a significant gap in the SC construction in this region. This has led to an uneven distribution of the SC development in the YRDUA as a whole. This is consistent with the findings of existing research [64,65]. The reason for this is that different cities possess varying urban scales, characteristics, and policy orientations, which in turn affect the efficacy of their SC policies [66]. Nevertheless, benefiting from the close interconnectivity between cities in the YRDUA, the interaction patterns of cities have influenced disparities between neighboring cities, leading to the widening or narrowing of existing development gaps [67].

5.2.3. Analysis of Local Spatial Autocorrelation for the SC

According to the result of local spatial autocorrelation analysis on the SCL in the YRDUA, there exist four clustering forms: ‘H-L’, ‘L-L’, ‘H-H’, and ‘L-H’. The spatial cluster pattern of the SC in the YRDUA maintains a stable trend. ‘H-H’ and ‘L-H’ clusters are exhibited in eastern cities, and ‘H-L’ and ‘L-L’ clusters are exhibited in western cities.
During 2017–2020, only Nantong showed the ‘H-H’ cluster in 2019, which can be explained by two reasons. For one thing, the SCL in Nantong is gradually increasing, particularly in the management of urban information resources [68]. For another, in the vicinity of Nantong, there exist cities that have made significant strides in SC development, such as Shanghai, Changzhou, and Suzhou. While the speed of development in Taizhou and Yancheng has fallen behind that in Nantong, this has resulted in Nantong’s failure to present the ‘H-H’ cluster in 2020. As for the ‘L-H’ cluster areas, Zhoushan and Jiaxing, in the eastern part of the YRDUA, consistently presented the ‘L-H’ cluster from 2017 to 2020, and this result aligns with existing research [69,70,71]. As a city composed of 1391 islands, Zhoushan faces unique challenges in its SC development [69]. The independence of each island has resulted in a dilemma for Zhoushan, with high costs and low returns on investment in the construction of the SC. Furthermore, the lack of concentrated resources makes scaling up SC projects in Zhoushan an arduous task [70]. Although the SCL of Jiaxing in the YRDUA is commendable, the surrounding cities have a significantly higher SCL, resulting in Jiaxing being classified as part of the ‘L-H’ cluster. While Jiaxing has made strides in the construction of the SC, its innovation capabilities and smart economy have yet to catch up with other aspects of the SC, thereby presenting a potential obstacle to its long-term development goals [71].
Contrary to Jiaxing, Hefei showed the ‘H-L’ cluster in the four years studied. This result is generally consistent with the findings in the existing literature [72]. As a city that excels in high-tech and high-quality development, Hefei has the potential to efficiently implement and utilize SC technologies. Since the introduction of the ‘Thirteenth Five-Year Plan for Smart Hefei Construction’ in 2016, the city has established a high-quality leading group working with digital resources, which has been committed to reforming and innovating Hefei’s information technology and data resources, leading to remarkable achievements in the development of the SC [62]. Additionally, as the capital city of Anhui Province, Hefei exerts a strong siphoning effect on the cities surrounding it, drawing in talent and resources from these cities. The difference in SC development between Hefei and its neighboring cities is further exacerbated for this reason [72,73].
In addition, Wuhu, Tongling, and Chizhou showed the ‘L-L’ cluster. This can be attributed to the weak scale of these cities, their industrial structure, and their surrounding cities, namely Anqing, Xuancheng, and Chuzhou, which have impeded the development of cutting-edge technologies in social governance, public management, and green development [72]. The lack of significant achievements and advancements in SC construction has led to a generally low SCL in this region; thus, they presented the ‘L-L’ cluster from 2017 to 2020.

5.3. Applicability of the Comprehensive Evaluation Framework for the SC

Through an in-depth analysis of the spatiotemporal characteristics of SCs, the comprehensive evaluation framework proposed in this study was found to have strong advantages in analyzing the spatiotemporal differentiation of SCs. Specifically, the evaluation indicators in this model for evaluating the SCL are easier to obtain and quantify compared to previous SC models. Second, the weights of the evaluation indicators within this model are determined using the EWM, which avoids subjectivity in the weight allocation process and provides more stable analytical results compared to the Delphi method and AHP method [74]. Subsequently, the model and indicator data were used to calculate the SCL in different cities, and based on this, a spatial–temporal analysis of the SCL was conducted. This more clearly shows the spatial–temporal patterns of these SCs and clarifies the future trends in the development of these SCs. Based on the results of this analysis, more targeted recommendations can be provided for the future development of SCs, thereby narrowing the gap in SCL between cities and promoting the integrated development of urban agglomeration.
Furthermore, the findings derived from the analysis using the comprehensive evaluation framework in this study are consistent with the present state of SC development in China, thus demonstrating the framework’s considerable suitability. The chosen evaluation indicators have been customized to suit China’s specific circumstances, enabling their further application in determining the SCL and examining the spatial–temporal differentiation among other urban agglomerations in China. They may also be extended to encompass all cities nationwide. Moreover, given the positive role of SC development in mitigating urbanization-related challenges and enhancing individuals’ well-being, this evaluation framework holds potential for broader application in different nations [1,2]. Nevertheless, it is crucial to acknowledge that when implementing this framework in other countries, modifications to the evaluation criteria must be made to suit the specific context of SC development in each locality. Once the necessary data on the evaluation indicators are acquired, this framework can facilitate the quantification of SCL and enable spatiotemporal dynamic analyses.

5.4. Suggestions for Promoting the Development of the SC

Drawing from this comprehensive analysis, some actionable recommendations are proposed for decision makers aiming to improve the SCL at both the regional and municipal level.
With respect to regional development, promoting coordinated development represents a crucial strategy for enhancing the overall SCL and narrowing the gap between different cities. To this end, it is suggested that a comprehensive SC blueprint could be developed based on the ‘Outline of the Development Plan for Integrated Development of the Yangtze River Delta Region’ to foster intercity collaboration through top-level designs. Based on this, the full utilization of urban resources is encouraged to promote joint construction of information infrastructure and public service platforms. This collaborative pattern has the potential to unlock significant economies of scale and to drive down the costs associated with the development of SCs. For instance, the ‘One Network Office’ platform for government services in the YRDUA has enabled the inter-provincial handling of 138 government services. In the future, regional platforms could be strengthened in various social service areas such as medical care, education, scientific research, and innovation to further narrow the gap between the various cities’ SCLs. Moreover, the higher-level SCs can offer experiential and technical support to the lower-level SCs. Specifically, core cities (Hefei, Nanjing, and Shanghai) can extend their industries to neighboring cities, driving the collaborative development of digital economies in those areas and promoting an overall increase in the SCL across the region.
From the perspective of individual cities, it is recommended that differentiated policies be adopted according to each city’s specific circumstances. Only in this way can cities make the best use of limited resources in the development of the SC. Firstly, appropriate measures should be adopted for the lower-level SCs in the western region of the YRDUA to improve their innovation capabilities and level of intelligence. For instance, giving priority to the development of urban infrastructure and implementing policies aiming to attract talent could be considered. Secondly, the higher-level SCs should concentrate on providing more information-based public services (such as smart healthcare, smart transportation, and smart education) and open data sharing to avoid excessive investment in infrastructure construction that may result in negative effects. Third, it is advisable for each city to maximize the potential of local resources and create unique cultural and eco-tourism cities tailored to their characteristics, thereby enhancing the competitiveness and sustainability of their urban development.

6. Conclusions

This study developed a comprehensive evaluation framework for the SCs in China by establishing an evaluation model and conducting a spatial–temporal differentiation analysis. The 26 cities in the YRDUA of China were selected as typical cases, and data for each city were collected from 2017 to 2020 to analyze their spatial–temporal differentiation characteristics. The specific findings were as follows. First, the SCL in the YRDUA has shown an overall improvement, and an increasing number of cities are approaching an average SCL within the YRDUA. The disparity between cities has progressively reduced. Second, the SCL in eastern cities like Shanghai, Nanjing, Hangzhou, and Suzhou was higher compared to western cities such as Chizhou, Tongling, and Xuancheng. The global spatial autocorrelation of the SCL in the YRDUA is random. The ‘L-H’ cluster exhibited by Jiaxing and Zhoushan and the ‘H-L’ cluster presented by Hefei in their local spatial characteristics indicate a significant gap in the SCL when compared to neighboring cities. Additionally, the western cities of the YRDUA mainly exhibited the ‘L-L’ cluster in their local spatial correlation. Third, through an analysis of the SCs in the YRDUA, it was found that the comprehensive evaluation framework established in this study has strong advantages and applicability, which can be applied not only to other urban agglomerations in China but also to SCs in other countries. On this basis, suggestions for enhancing the SCL and differentiated policies targeting urban characteristics were proposed from the perspective of regional cooperation between cities.
The application of the comprehensive evaluation framework for the SCs established in this study has facilitated the elucidation of the temporal and spatial characteristics of SC development in China. This research enhances the existing theoretical research on the evaluation of SCs and offers valuable recommendations for the sustainable development of SCs. However, there are two limitations in this study that need to be further explored and discussed by the academic community. On the one hand, this study is limited by the short time series chosen, which hinders a comprehensive examination of the spatial–temporal characteristics of the development of SCs. In subsequent research, the ongoing establishment of SCs will provide additional time data to facilitate a thorough investigation of the temporal development characteristics of SCs. On the other hand, the selection of SCs solely within the YRDUA as representative cases in this study fails to elucidate the present state and spatial distribution patterns of SC development across China as a whole. In future investigations, the study area should be expanded to encompass other city agglomerations, such as the Pearl River Delta, the Beijing–Tianjin–Hebei City Agglomeration, and the Beibu Gulf City Agglomeration in Guangxi. Additionally, it may be beneficial to establish relevant evaluation models that take into account the SC policies and the present circumstances in other countries. This approach would contribute to more comprehensive and effective support for the development of SCs globally.

Supplementary Materials

The following supporting information can be downloaded at: https://www.mdpi.com/article/10.3390/land12101862/s1. The relevant data and process for determining the weights of evaluation indicators through the EWM.

Author Contributions

Conceptualization, T.G.; methodology, S.L. and Y.S.; software, S.L.; validation, T.G., S.L., X.L. and Y.S.; formal analysis, T.G. and X.L.; investigation, E.H.; resources, M.N.; data curation, E.H.; writing—original draft preparation, S.L., X.L. and Y.S.; writing—review and editing, S.L., X.L. and Y.S.; visualization, S.L.; supervision, T.G.; project administration, T.G.; funding acquisition, T.G. All authors have read and agreed to the published version of the manuscript.

Funding

This research is funded by the National Natural Science Foundation of China (Grant No. 72104233).

Institutional Review Board Statement

Not applicable.

Informed Consent Statement

Not applicable.

Data Availability Statement

The data presented in this study are available on request from the first author.

Acknowledgments

The authors would like to thank the anonymous reviewers for their constructive comments that helped us improve the quality of this paper.

Conflicts of Interest

The authors declare no conflict of interest.

Appendix A

Table A1. The general information of interviewed experts.
Individual CharacteristicsItemsNumberPercentage (%)
GenderMale1161.11%
Female738.89%
Education levelDoctorate degree527.78%
Master’s degree844.44%
Others527.78%
OccupationCollege teachers422.22%
Government employee15.56%
Manager of the enterprise738.89%
Others633.33%
Working experienceMore than 5 years316.67%
3 to 5 years316.67%
1 to 3 years527.78%
Less than 1 year738.89%
Table A2. The SCL in the YRDUA.
Name2017201820192020
Shanghai0.5679950.6313230.6805380.737779
Nanjing0.2675470.3671790.3906670.403665
Wuxi0.2046990.2174420.2310150.240458
Changzhou0.1280060.1293070.2139150.222444
Suzhou0.198470.2205490.3190730.351161
Nantong0.1168960.1160660.1963510.202543
Yancheng0.0775720.0962020.1014760.110135
Yangzhou0.1660430.1757950.1662750.174337
Zhenjiang0.0702730.0790650.0792450.088851
Taizhou0.0875160.0904060.1822910.18961
Hangzhou0.2864140.3363960.3878860.49432
Ningbo0.1529480.2421150.2591390.280063
Jiaxing0.1326690.1197590.1248540.141828
Huzhou0.0982630.1210440.1813380.195055
Shaoxing0.1084710.1345280.118190.210991
Jinhua0.1261690.1472710.1813660.247507
Zhoushan0.1241010.1255750.1325420.208226
Taizhou0.0924850.0948990.1026060.183275
Hefei0.1888950.213030.2227880.251058
Wuhu0.0734520.0832630.0881850.181788
Ma’anshan0.0746370.1645440.1778310.192791
Tongling0.0483640.0600590.0660370.144774
Anqing0.0444480.0508950.0602830.068534
Chuzhou0.0463080.0598890.078440.0824
Chizhou0.032580.0462790.0484590.052766
Xuancheng0.0497110.1328610.1318770.142678

References

  1. Ismagilova, E.; Hughes, L.; Dwivedi, Y.K.; Raman, K.R. Smart cities: Advances in research—An information systems perspective. Int. J. Inf. Manag. 2019, 47, 88–100. [Google Scholar] [CrossRef]
  2. Sun, J.; Wang, Y.; Liu, S.; Dehghani, A.; Xiang, X.; Wei, J.; Wang, X. Mechanical, chemical and hydrothermal activation for waste glass reinforced cement. Constr. Build. Mater. 2021, 301, 124361. [Google Scholar] [CrossRef]
  3. Zhang, Y.; Zhang, Y.; Zhang, H.; Zhang, Y. Evaluation on new first-tier smart cities in China based on entropy method and TOPSIS. Ecol. Indic. 2022, 145, 109616. [Google Scholar] [CrossRef]
  4. Makhdoom, I.; Zhou, I.; Abolhasan, M.; Lipman, J.; Ni, W. PrivySharing: A blockchain-based framework for privacy-preserving and secure data sharing in smart cities. Comput. Secur. 2020, 88, 101653. [Google Scholar] [CrossRef]
  5. Neirotti, P.; De Marco, A.; Cagliano, A.C.; Mangano, G.; Scorrano, F. Current trends in Smart City initiatives: Some stylised facts. Cities 2014, 38, 25–36. [Google Scholar] [CrossRef]
  6. Shelton, T.; Zook, M.; Wiig, A. The ‘actually existing smart city’. Camb. J. Reg. Econ. Soc. 2015, 8, 13–25. [Google Scholar] [CrossRef]
  7. Huovila, A.; Bosch, P.; Airaksinen, M. Comparative analysis of standardized indicators for Smart sustainable cities: What indicators and standards to use and when? Cities 2019, 89, 141–153. [Google Scholar] [CrossRef]
  8. Bibri, S.E.; Krogstie, J. Smart sustainable cities of the future: An extensive interdisciplinary literature review. Sustain. Cities Soc. 2017, 31, 183–212. [Google Scholar] [CrossRef]
  9. Shafiq, M.; Tian, Z.; Sun, Y.; Du, X.; Guizani, M. Selection of effective machine learning algorithm and Bot-IoT attacks traffic identification for internet of things in smart city. Future Gener. Comput. Syst. 2020, 107, 433–442. [Google Scholar] [CrossRef]
  10. Ullah, Z.; Al-Turjman, F.; Mostarda, L.; Gagliardi, R. Applications of Artificial Intelligence and Machine learning in smart cities. Comput. Commun. 2020, 154, 313–323. [Google Scholar] [CrossRef]
  11. Ma, G.; Sun, J.; Aslani, F.; Huang, Y.; Jiao, F. Review on electromagnetic wave absorbing capacity improvement of cementitious material. Constr. Build. Mater. 2020, 262, 120907. [Google Scholar] [CrossRef]
  12. Klopp, J.M.; Petretta, D.L. The urban sustainable development goal: Indicators, complexity and the politics of measuring cities. Cities 2017, 63, 92–97. [Google Scholar] [CrossRef]
  13. Giffinger, R.; Haindlmaier, G.; Kramar, H. The role of rankings in growing city competition. Urban Res. Pract. 2010, 3, 299–312. [Google Scholar] [CrossRef]
  14. Huang, G.; Li, D.; Yu, L.; Yang, D.; Wang, Y. Factors affecting sustainability of smart city services in China: From the perspective of citizens’ sense of gain. Habitat Int. 2022, 128, 102645. [Google Scholar] [CrossRef]
  15. Shen, L.; Huang, Z.; Wong, S.W.; Liao, S.; Lou, Y. A holistic evaluation of smart city performance in the context of China. J. Clean. Prod. 2018, 200, 667–679. [Google Scholar] [CrossRef]
  16. Anand, A.; Winfred Rufuss, D.D.; Rajkumar, V.; Suganthi, L. Evaluation of Sustainability Indicators in Smart Cities for India Using MCDM Approach. Energy Procedia 2017, 141, 211–215. [Google Scholar] [CrossRef]
  17. Ozkaya, G.; Erdin, C. Evaluation of smart and sustainable cities through a hybrid MCDM approach based on ANP and TOPSIS technique. Heliyon 2020, 6, e05052. [Google Scholar] [CrossRef]
  18. Camero, A.; Alba, E. Smart City and information technology: A review. Cities 2019, 93, 84–94. [Google Scholar] [CrossRef]
  19. Lai, C.M.T.; Cole, A. Measuring progress of smart cities: Indexing the smart city indices. Urban Gov. 2023, 3, 45–57. [Google Scholar] [CrossRef]
  20. Yigitcanlar, T.; Kamruzzaman, M.; Buys, L.; Ioppolo, G.; Sabatini-Marques, J.; da Costa, E.M.; Yun, J.J. Understanding ‘smart cities’: Intertwining development drivers with desired outcomes in a multidimensional framework. Cities 2018, 81, 145–160. [Google Scholar] [CrossRef]
  21. Administration of Quality Supervision, Inspection, and Quarantine of the People’s Republic of China; The Standardization Administration of China. Evaluation Model and General Evaluation Indicator System for Smart Cities—Part 1: General FRAMEWORK and Requirements for Developing Evaluation Sub-Indicators. 2017. Available online: https://openstd.samr.gov.cn/bzgk/gb/Newgbinfo?Hcno=94a3d226fb1d802a5f2e348b0c4bedbc (accessed on 31 January 2023). (In Chinese)
  22. Liu, J.; Chen, N.; Chen, Z.; Xu, L.; Du, W.; Zhang, Y.; Wang, C. Towards sustainable smart cities: Maturity assessment and development pattern recognition in China. J. Clean. Prod. 2022, 370, 133248. [Google Scholar] [CrossRef]
  23. Wang, M.; Zhou, T. Understanding the dynamic relationship between smart city implementation and urban sustainability. Technol. Soc. 2022, 70, 102018. [Google Scholar] [CrossRef]
  24. Antwi-Afari, P.; Owusu-Manu, D.-G.; Ng, S.T.; Asumadu, G. Modeling the smartness or smart development levels of developing countries’ cities. J. Urban Manag. 2021, 10, 369–381. [Google Scholar] [CrossRef]
  25. Gavurova, B.; Kelemen, M.; Polishchuk, V. Expert model of risk assessment for the selected components of smart city concept: From safe time to pandemics as COVID-19. Socio-Econ. Plan. Sci. 2022, 82, 101253. [Google Scholar] [CrossRef]
  26. Kairui, Y. Intelligent evaluation approach for smart city based on DEA model: Taking Wuhan, China as an example. J. Intell. Fuzzy Syst. 2018, 35, 2667. [Google Scholar] [CrossRef]
  27. Li, Q.; Liu, L.; Guo, Z.; Vijayakumar, P.; Taghizadeh-Hesary, F.; Yu, K. Smart assessment and forecasting framework for healthy development index in urban cities. Cities 2022, 131, 103971. [Google Scholar] [CrossRef]
  28. Zhang, Y.; Liu, F.; Gu, Z.; Chen, Z.; Shi, Y.; Li, A. Research on Smart City Evaluation Based on Hierarchy of Needs. Procedia Comput. Sci. 2019, 162, 467–474. [Google Scholar] [CrossRef]
  29. Li, G.; Wang, Y.; Luo, J.; Li, Y. Evaluation on Construction Level of Smart City: An Empirical Study from Twenty Chinese Cities. Sustainability 2018, 10, 3348. [Google Scholar] [CrossRef]
  30. Sokolov, A.; Veselitskaya, N.; Carabias, V.; Yildirim, O. Scenario-based identification of key factors for smart cities development policies. Technol. Forecast. Soc. Change 2019, 148, 119729. [Google Scholar] [CrossRef]
  31. Silva, B.N.; Khan, M.; Han, K. Towards sustainable smart cities: A review of trends, architectures, components, and open challenges in smart cities. Sustain. Cities Soc. 2018, 38, 697–713. [Google Scholar] [CrossRef]
  32. Apanaviciene, R.; Vanagas, A.; Fokaides, P.A. Smart Building Integration into a Smart City (SBISC): Development of a New Evaluation Framework. Energies 2020, 13, 2190. [Google Scholar] [CrossRef]
  33. Macke, J.; Rubim Sarate, J.A.; de Atayde Moschen, S. Smart sustainable cities evaluation and sense of community. J. Clean. Prod. 2019, 239, 118103. [Google Scholar] [CrossRef]
  34. Shannon, C.E. A Mathematical Theory of Communication. Bell Syst. Tech. J. 1948, 27, 379–423. [Google Scholar] [CrossRef]
  35. Li, C.; Zhang, L.; Gu, Q.; Guo, J.; Huang, Y. Spatio-Temporal Differentiation Characteristics and Urbanization Factors of Urban Household Carbon Emissions in China. Int. J. Environ. Res. Public Health 2022, 19, 4451. [Google Scholar] [CrossRef]
  36. Tierney, B.T.; Tan, Y.; Kostic, A.D.; Patel, C.J. Gene-level metagenomic architectures across diseases yield high-resolution microbiome diagnostic indicators. Nat. Commun. 2021, 12, 2907. [Google Scholar] [CrossRef]
  37. Fu, X.M.; Ku, H.L.; Wu, W.Y.; Wang, L.X.; Chen, H.X.; Lin, C.Y.; Liu, Y. Spatial–temporal differentiation and convergence analysis of marine fishery innovation ability in China. Fish. Res. 2022, 254, 106393. [Google Scholar] [CrossRef]
  38. Cui, Y.; Qiu, K.; Li, G.; Jiang, H.; Kong, L. Spatiotemporal differentiation of energy eco-efficiency of shipbuilding industry in China. Ocean Coast. Manag. 2022, 230, 106347. [Google Scholar] [CrossRef]
  39. Liang, L.; Gong, P. Urban and air pollution: A multi-city study of long-term effects of urban landscape patterns on air quality trends. Sci. Rep. 2020, 10, 18618. [Google Scholar] [CrossRef]
  40. Tobler, W.R. A Computer Movie Simulating Urban Growth in the Detroit Region. Econ. Geogr. 1970, 46, 234. [Google Scholar] [CrossRef]
  41. Kumari, M.; Sarma, K.; Sharma, R. Using Moran’s I and GIS to study the spatial pattern of land surface temperature in relation to land use/cover around a thermal power plant in Singrauli district, Madhya Pradesh, India. Remote Sens. Appl. Soc. Environ. 2019, 15, 100239. [Google Scholar] [CrossRef]
  42. Ping, J.L.; Green, C.J.; Zartman, R.E.; Bronson, K.F. Exploring spatial dependence of cotton yield using global and local autocorrelation statistics. Field Crops Res. 2004, 89, 219–236. [Google Scholar] [CrossRef]
  43. Jiang, Y.; Lin, W.; Xu, D.; Xu, D. Spatio-temporal variation of the relationship between air pollutants and land surface temperature in the Yangtze River Delta Urban Agglomeration, China. Sustain. Cities Soc. 2023, 91, 104429. [Google Scholar] [CrossRef]
  44. Hu, H.; Lv, T.; Zhang, X.; Xie, H.; Fu, S.; Wang, L. Spatiotemporal coupling of multidimensional urbanization and resource–environment performance in the Yangtze River Delta urban agglomeration of China. Phys. Chem. Earth Parts A/B/C 2023, 129, 103360. [Google Scholar] [CrossRef]
  45. Yu, J.; Su, G.; Hirst, A.; Yang, Z.; Zhang, Y.; Li, Y. Identifying competing interest disclosures in systematic reviews of surgical interventions and devices: A cross-sectional survey. BMC Med. Res. Methodol. 2020, 20, 260. [Google Scholar] [CrossRef] [PubMed]
  46. Xiong, C.; Song, T.; Zhou, C. A Study on the Relationship between Artificial Intelligence and 5G Network Construction and the Level of Economic Development of Regional Cities. Wirel. Commun. Mob. Comput. 2022, 2022, 8020388. [Google Scholar] [CrossRef]
  47. Mao, C.; Wang, Z.; Yue, A.; Liu, H.; Peng, W. Evaluation of smart city construction efficiency based on multivariate data fusion: A perspective from China. Ecol. Indic. 2023, 154, 110882. [Google Scholar] [CrossRef]
  48. Yu, Y.; Zhang, N. Does smart city policy improve energy efficiency? Evidence from a quasi-natural experiment in China. J. Clean. Prod. 2019, 229, 501–512. [Google Scholar] [CrossRef]
  49. Luo, J.; Wang, Z.; Wu, M. Effect of place-based policies on the digital economy: Evidence from the Smart City Program in China. J. Asian Econ. 2021, 77, 101402. [Google Scholar] [CrossRef]
  50. Liu, K.; Meng, C.; Tan, J.; Zhang, G. Do smart cities promote a green economy? Evidence from a quasi-experiment of 253 cities in China. Environ. Impact Assess. Rev. 2023, 99, 107009. [Google Scholar] [CrossRef]
  51. Xu, H.; Jiao, M. City size, industrial structure and urbanization quality—A case study of the Yangtze River Delta urban agglomeration in China. Land Use Policy 2021, 111, 105735. [Google Scholar] [CrossRef]
  52. Lnenicka, M.; Nikiforova, A.; Luterek, M.; Azeroual, O.; Ukpabi, D.; Valtenbergs, V.; Machova, R. Transparency of open data ecosystems in smart cities: Definition and assessment of the maturity of transparency in 22 smart cities. Sustain. Cities Soc. 2022, 82, 103906. [Google Scholar] [CrossRef]
  53. Rejeb, A.; Rejeb, K.; Simske, S.; Treiblmaier, H.; Zailani, S. The big picture on the internet of things and the smart city: A review of what we know and what we need to know. Internet Things 2022, 19, 100565. [Google Scholar] [CrossRef]
  54. Wu, J.; Zhao, R.; Sun, J. What role does digital finance play in low-carbon development? Evidence from five major urban agglomerations in China. J. Environ. Manag. 2023, 341, 118060. [Google Scholar] [CrossRef]
  55. Yin, H.; Xiao, R.; Fei, X.; Zhang, Z.; Gao, Z.; Wan, Y.; Tan, W.; Jiang, X.; Cao, W.; Guo, Y. Analyzing “economy-society-environment” sustainability from the perspective of urban spatial structure: A case study of the Yangtze River delta urban agglomeration. Sustain. Cities Soc. 2023, 96, 104691. [Google Scholar] [CrossRef]
  56. Zhuang, L.; Ye, C. More sprawl than agglomeration: The multi-scale spatial patterns and industrial characteristics of varied development zones in China. Cities 2023, 140, 104406. [Google Scholar] [CrossRef]
  57. Wang, H.; Cheng, Z.; Zhu, D. Striving for global cities with governance approach in transitional China: Case study of Shanghai. Land Use Policy 2020, 90, 104288. [Google Scholar] [CrossRef]
  58. Zhong, Z.; Shen, L.; Wang, X. Evolution Characteristics and Influencing Factors of Smart Industry Space in the Yangtze River Delta Region. Econ. Geogr. 2021, 41. (In Chinese) [Google Scholar]
  59. Liu, T.; Zhou, B. Evaluation and obstacle factors of high-quality development in coastal cities along the Yangtze River. Ocean Coast. Manag. 2023, 244, 106818. [Google Scholar] [CrossRef]
  60. Tang, D.; Mao, M.; Shi, J.; Hua, W. The Spatio-Temporal Analysis of Urban-Rural Coordinated Development and Its Driving Forces in Yangtze River Delta. Land 2021, 10, 495. [Google Scholar] [CrossRef]
  61. Du, H.; Zhou, F. Study on the Layout of Ecological Space and the Integrated Management Mechanism of the Yangtze River Delta Urban Agglomeration. Land 2023, 12, 294. [Google Scholar] [CrossRef]
  62. Li, T.; Qi, Y.; Chen, M.; Hui, B.; Su, Y. Sub-central city’s green innovation in regional integration: Can it be a bridgehead even if it is far away? Ecol. Indic. 2023, 154, 110618. [Google Scholar] [CrossRef]
  63. Wang, F. Does the construction of smart cities make cities green? Evidence from a quasi-natural experiment in China. Cities 2023, 140, 104436. [Google Scholar] [CrossRef]
  64. Li, Z.; Tang, R.; Qiu, H.; Ma, L. Smart Energy Urban Agglomerations in China: The Driving Mechanism, Basic Concepts, and Indicator Evaluation. Sustainability 2023, 15, 11863. [Google Scholar] [CrossRef]
  65. Wu, Z.; Li, X.; Zhou, X.; Yang, T.; Lu, R. City Intelligence Quotient Evaluation System Using Crowdsourced Social Media Data: A Case Study of the Yangtze River Delta Region, China. ISPRS Int. J. Geo-Inf. 2021, 10, 702. [Google Scholar] [CrossRef]
  66. Li, C.; Zhang, X.; Dong, X.; Yan, Q.; Zeng, L.; Wang, Z. The impact of smart cities on entrepreneurial activity: Evidence from a quasi-natural experiment in China. Resour. Policy 2023, 81, 103333. [Google Scholar] [CrossRef]
  67. Yin, H.; Zhang, Z.; Wan, Y.; Gao, Z.; Guo, Y.; Xiao, R. Sustainable network analysis and coordinated development simulation of urban agglomerations from multiple perspectives. J. Clean. Prod. 2023, 413, 137378. [Google Scholar] [CrossRef]
  68. Nantong Municipal People’s Government Office. Nantong’s Big Data Development Plan (2019–2025). 2019. Available online: https://www.nantong.gov.cn/ntsrmzf/szfbwj/content/25144b62-b59e-4bc9-a2c1-d26f080c638a.html (accessed on 31 January 2023). (In Chinese)
  69. Zhou, D.; Xu, J.; Wang, L.; Lin, Z. Assessing urbanization quality using structure and function analyses: A case study of the urban agglomeration around Hangzhou Bay (UAHB), China. Habitat Int. 2015, 49, 165–176. [Google Scholar] [CrossRef]
  70. Guo, K.; Gu, Y. The Construction of Smart Tourism City and Digital Marketing of Cultural Tourism Industry under Network Propaganda Strategy. Secur. Commun. Netw. 2022, 2022, 4932415. [Google Scholar] [CrossRef]
  71. Qu, Y.; Li, J.; Wang, S. Green total factor productivity measurement of industrial enterprises in Zhejiang Province, China: A DEA model with undesirable output approach. Energy Rep. 2022, 8, 307–317. [Google Scholar] [CrossRef]
  72. Zhu, Y.; Yang, S.; Lin, J.; Yin, S. Spatial and Temporal Evolutionary Characteristics and Its Influencing Factors of Economic Spatial Polarization in the Yangtze River Delta Region. Int. J. Environ. Res. Public Health 2022, 19, 6997. [Google Scholar] [CrossRef]
  73. Chenhong, X.; Guofang, Z. The spatiotemporal evolution pattern of urban resilience in the Yangtze River Delta urban agglomeration based on TOPSIS-PSO-ELM. Sustain. Cities Soc. 2022, 87, 104223. [Google Scholar] [CrossRef]
  74. Ji, X.; Wang, K.; Ji, T.; Zhang, Y.; Wang, K. Coupling Analysis of Urban Land Use Benefits: A Case Study of Xiamen City. Land 2020, 9, 155. [Google Scholar] [CrossRef]
Figure 1. The comprehensive evaluation framework of the SC.
Land 12 01862 g001
Figure 2. The location of the surveyed cities in the YRDUA.
Land 12 01862 g002
Figure 3. The SCL of 26 cities in the YRDUA from 2017 to 2020.
Land 12 01862 g003
Figure 4. The trend of the SCL in the YRDUA from 2017 to 2020.
Land 12 01862 g004
Figure 5. Spatial distribution of the SCL in the YRDUA.
Land 12 01862 g005
Figure 6. Temporal distribution of the SCL in the YRDUA.
Land 12 01862 g006
Figure 7. Spatial clustering of the SCL in the YRDUA.
Land 12 01862 g007
Table 1. Evaluation indicators for SCs in China.
Primary IndicatorsSecond-Level IndicatorsPropertiesReferences
Ecological livability (B1)Rate of good ambient air quality/%+[3]
Per capita green areas/m2+[22,23]
Green coverage rate of built-up areas/%+[24]
Sewage disposal rate/%+[24,25]
Industry system (B2)Number of employees in the ICT industry/person+[23,26]
E-commerce transaction amount/100 million yuan+[24]
Ratio of added value of tertiary industry in GDP/%+[3,27]
Number of high-technology industries+[3,27]
Innovation capacity (B3)Number of patent applications/items+[22]
Number of R&D personnel/person+[26]
R&D expenditure as a percentage of GDP/%+[22,28]
Number of higher education graduates/person+[22,28]
Number of universities and colleges+[24]
Public services
(B4)
Inpatient hospital beds per 10,000 people/piece+[23,25]
Doctors per 10,000 people/person+[22,25]
Proportion of per capita education expenditure/yuan+[26]
Number of hospitals+[26]
Information resources (B5)Open data platforms+[24]
Satisfactory closing rate of disclosure application about government information/%+[29]
Information openness of intelligent government+[23,30]
Mechanism guarantee (B6)Smart city planning+[22]
Security mechanisms+[22,25]
Infrastructure system (B7)Fixed broadband Internet access for users/person+[22,23,25,31]
Mobile Internet users/person+[22,23,25,31]
Number of electric vehicle charging points+[32]
Number of public libraries+[3,23]
Social management (B8)Unemployment rate/%-[3,22,23,31,33]
Per capita GDP/yuan+[26]
Proportion of the population under minimum standard of living for city residents/%-[3]
Engel’s coefficient/%-[3]
Table 2. Weights of the evaluation indicators for the SC.
Primary IndicatorsWeightsSecond-Level IndicatorsCodeWeights
Ecological livability (B1)0.0778Rate of good ambient air quality/%X10.0057
Per capita green areas/m2X20.0607
Green coverage rate of built-up areas/%X30.0103
Sewage disposal rate/%X40.0010
Industry system (B2)0.2499Number of employees in the ICT industry/personX50.0978
E-commerce transaction amount/100 million yuanX60.0945
Ratio of added value of tertiary industry in GDP/%X70.0047
Number of high-technology industriesX80.0529
Innovation capacity (B3)0.2449Number of patent applications/itemsX90.0391
Number of R&D personnel/personX100.0899
R&D expenditure as a percentage of GDP/%X110.0079
Number of higher education graduates/personX120.0540
Number of universities and collegesX130.0540
Public services (B4)0.0751Inpatient hospital beds per 10,000 people/pieceX140.0143
Doctors per 10,000 people/personX150.0096
Proportion of per capita education expenditure/yuanX160.0223
Number of hospitalsX170.0289
Information resources (B5)0.1698Open data platformX180.0751
Satisfactory closing rate of disclosure application about government information/%X190.0014
Information openness of intelligent governmentX200.0933
Mechanism guarantee (B6)0.0093Smart city planningX210.0084
Security mechanismsX220.0009
Infrastructure (B7)0.1237Fixed broadband Internet access for users/personX230.0119
Mobile Internet users/personX240.0075
Number of electric
vehicle charging posts
X250.0773
Number of public librariesX260.0270
Social management (B8)0.0497Unemployment rate/%X270.0040
Per capita GDP/yuanX280.0242
Proportion of the population under minimum standard of living for city residents/%X290.0116
Engel’s coefficient/%X300.0099
Table 3. The annual average SCL and CV of 26 cities in the YRDUA.
YearAnnual Average SCLCV
ValueRate of Increase
20170.137113--0.788485
20180.16368219.38%0.749971
20190.18933315.67%0.706059
20200.2230417.80%0.636717
Table 4. The number of cities included in each gradient from 2017 to 2020.
GradientLevel2017201820192020
IExcellent1344
IIGood551014
IIIGeneral7944
IVInferior8874
VIPoor5110
Table 5. Global spatial autocorrelation test results of the SCL in the YRDUA.
Year2017201820192020
Moran’s I−0.017698−0.080158−0.016605−0.032158
z-score0.235568−0.4058600.2291040.076560
p-value0.8137680.6848450.8187880.938973
Disclaimer/Publisher’s Note: The statements, opinions and data contained in all publications are solely those of the individual author(s) and contributor(s) and not of MDPI and/or the editor(s). MDPI and/or the editor(s) disclaim responsibility for any injury to people or property resulting from any ideas, methods, instructions or products referred to in the content.

