Article

Dynamic Evolution and Regional Differences in the Efficiency of Compact Urban Development in Chinese Cities—Based on the Perspective of Compact Land Use

1
School of Public Administration, Central China Normal University, Wuhan 430079, China
2
School of Public Administration, Huazhong University of Science and Technology, Wuhan 430074, China
3
School of Politics and Public Administration, Guangxi Minzu University, Nanning 530006, China
*
Author to whom correspondence should be addressed.
Land 2023, 12(10), 1837; https://doi.org/10.3390/land12101837
Submission received: 8 August 2023 / Revised: 8 September 2023 / Accepted: 21 September 2023 / Published: 26 September 2023

Abstract

:
Modern cities require urban compact development to be sustainable. The evaluation of urban compact development may help create more accurate and realistic policies. The spatio-temporal dynamic evolution of urban compact development efficiency and its regional differences in China are examined in this study. This paper analysis uses 282 cities from 2005 to 2021. The unexpected output super-efficiency SBM model measures urban compact development efficiency. In this study, the urban compact development efficiency’s spatial and temporal patterns are also examined using kernel density estimation (KDE) and the Theil index (TI). The average efficiency of urban compact development in China has decreased slightly. However, compact efficiency disparities are decreasing. Eastern cities have a relatively stable compact efficiency, while central and western cities vary more. The compact efficiency polarisation has not changed fundamentally. The compact city growth model’s spatial agglomeration is poor, limiting its spatial spillover impact. Thus, compact urban development is necessary to speed up planning, facilitate inter-city production factor movement by creating a comprehensive transport network, and maximise co-location benefits with the regional integration strategy. This method will gradually reduce regional urban development disparities and push Chinese cities towards more refined and sustainable compact development.

1. Introduction

Due to Western urbanisation issues, the compact city (CC) concept emerged. The “Compact City Concept”, devised by Dantzig G. and Satty T. [1], optimises urban land use. This method limits urban growth by assigning public facilities, conserving a regional ecological balance, and achieving sustainable development [2]. Following this, the European Commission’s “Green Paper on Urban Environment” emphasised compact cities. The compact city is a promising urban development paradigm with high population density, diversified land use, and social and cultural diversity [3,4]. This idea expands and continues the sustainable development objectives, which aim to achieve balance among people, economy, society, environment, and nature via sustainable resource use. Thus, the compact city represents a sensible, sustainable approach to urban expansion. Encouraging compact development helps achieve global sustainable development objectives.
China’s urbanisation trajectory differs from Western countries’ owing to national conditions. Due to urban development, excessive urban construction land expansion, encroachment on agricultural land, inefficient urban land use resulting in resource scarcity, and the degradation of transportation and ecological environments have occurred [5,6]. The digitisation of the municipal administration in China and the deployment of smart cities have become crucial to tackling urban issues, often called “urban diseases”. The move to smart cities has also helped urban economies develop. In parallel, the urban land spatial development paradigm has shifted towards emphasising spatial structure adjustment. The compact city notion has emerged in official discourse with this transition. This development laid the groundwork for China’s compact city development [7].
According to this study, urban expansion in China focuses on optimising urban spatial organisation. This requires the aggressive revitalisation of previously existing construction land and the precise delineation of urban and rural construction land development boundaries to effectively control the unregulated expansion of construction land [8]. Thus, compact cities improve urban efficiency, reduce greenhouse gas emissions, protect arable land, and promote holistic land use [9]. This method maximises urban space use. Due to limited land resources, the Chinese government’s policy control on urban spatial structure optimisation focuses on land use structure and efficiency [10]. Compact land use is inevitable, and assessing the efficiency of compact development in Chinese metropolitan regions helps explain how quickly China is adopting compact city policies. Analysing the dynamic evolution aspects of urban compact growth efficiency may also reveal its future development. Regional differences in eastern, central, and western China must be compared to fully understand its trend towards compact urban structures.

2. Theory

2.1. Conceptual Framework of Compact Cities

Compact cities are considered to be a viable choice for smart development, new urbanism, and urban revitalisation [11]. According to the OECD, compact cities are defined as urban areas that place emphasis on promoting green growth and achieving integrated economic, environmental, and social progress [10]. Compact cities are characterised by two key factors: the arrangement and functionality of the urban environment. Compact cities are renowned for their notable characteristics, including a substantial concentration of population, a diverse range of services, and a vigorous pace of urban growth [12,13]. “The Compact City: A Sustainable Urban Form?” and “Achieving Sustainable Urban Form”, edited by Elizabeth Burton, Katie Williams, and Mike Jenks, are seminal works in the field of compact city studies. Based on recent research, an increasing number of experts hold the belief that compact urban forms are crucial in addressing the many issues associated with sustainable development. From this standpoint, several scholars have undertaken qualitative investigations on the informal and densely populated neighbourhoods of Havana. These studies examine the fundamental characteristics required for achieving a more equitable urban environment, as well as the strategies used by residents to increase good aspects and alleviate bad ones [14]. Academic research has also used data-driven technology in compact urban area planning strategies in order to accomplish sustainability objectives [15]. Numerous scholars have conducted investigations on compact cities via the use of case studies. Researchers conducted an evaluation of the geographical characteristics of compact urban districts in Northern Europe [16]. A separate study examined the impact of compact urban forms in medium-sized cities in Spain [17]. A subsequent investigation conducted a comprehensive analysis of urban sprawl in compact cities across three case studies in southern Europe, using diverse research methodologies [18]. From a pragmatic standpoint, notable advancements have been achieved in this domain by Portland, Paris, Flanders, and Copenhagen.
Chinese experts have shown a keen interest in compact cities as a result of the increasing urbanisation occurring in China. Research is now being conducted on compact cities with a focus on form, goals, and processes. While the form-oriented approach to compact cities is generally preferred by most experts [19], it is important to recognise that compact urban growth is a dynamic process. Urban development is a multifaceted process that encompasses several economic, social, and cultural factors [20]. The concept of compact cities should be seen as a strategic approach to urban expansion, rather than only as a physical arrangement [21]. Compact cities prioritise the efficient use of land, people, industry, and resources. The promotion of social and economic diversity is encouraged by urban design that is sustainable and energy-efficient [21,22,23]. Compact cities in China are characterised by a condensed urban structure that exhibits a notable population density, a diverse range of land uses, and convenient accessibility to public transit systems. The objective is to attain a cohesive and enduring advancement via the integration of spatial dimensions and functionalities [10,11,12,24]. Contemporary research on urban compactness employs several analytical techniques, including grey relational analysis, subjective-objective integrated weighting, principal component analysis, and generalised entropy value [2,4,12,13]. The effectiveness of these strategies is constrained by the selection of indicators, which may coincide with the assessment of land intensity [25]. Based on the references cited [12,23,26,27], the research framework encompasses governmental entities at the provincial, municipal, and regional levels. This research examines the dynamics and characteristics associated with confined urban areas. The factors included in this study encompass land use efficiency [28], labour productivity [8], carbon emission intensity [29], energy consumption [30], air pollution [31], and urban efficiency [19]. These publications provide comprehensive coverage of the issue due to their distinct research approaches.

2.2. The Intrinsic Logic of Compact Urban Development

Compact urban development aims to provide effective and superior urban development by means of a well-structured organisation [12], improved urban space use, and operational efficiency [4], integrating functionality and efficiency. Promoting compact development in Chinese cities should match compact city characteristics. The interconnected nature of these qualities necessitates explaining their operation.
Due to population concentration and economic activity clustering, high-density development consolidates human resources and economic capital. Urban space utilisation is reflected by population density [32]. Existing research shows that increasing the population density reduces infrastructure development and public service costs. Overall regional economic advantages increase as urban compactness increases [33]. High-density populations may increase demographic diversity and attract and retain skilled people, making the area more inclusive [34]. Additionally, high-density development may lower the infrastructure costs per unit area. Efficiently managing the urban infrastructure has increased public investment efficiency and attracted commercial investment. Thus, high-density development boosts urban employment and regional economic growth [33].
Compact land use depicts land use efficiency and development intensity holistically. Multiple land functions demonstrate the need for intense urban expansion [31]. Thus, high-density comprehensive land use creates a variety of land uses in a given area, including commercial, office, residential, and recreational activity. This strategy minimises the emphasis on high volume density in urban development without considering all responsibilities [35]. Mixed land-use favourably corresponds with urban mixed-functional layout optimisation. Public transport facilities improve urban accessibility and economic development [33]. This minimises communication costs from urban spatial distances and improves urban growth. Thus, high-density development and mixed land-use may minimise urban travel times, reducing the economic consequences of urban sprawl at both the individual and regional levels [33].
Thus, public transit helps link heavily populated urban regions [31]. Urban public transport infrastructure improvements can improve spatial links between locations, enable the optimal integration of diverse production variables across these regions, and boost the city’s economic efficiency and that of the surrounding area [33]. As a central point for interregional or intercity linkages, public transport infrastructure helps diverse functional areas in an urban setting function efficiently and reduces greenhouse gas emissions, especially through electric buses. A new electric bus reduces CO2 emissions by 50 tonnes per year, according to data. Thus, assessing the public transport system’s efficiency may reveal urban land use’s benefits and use [10].
Energy utilisation is strongly correlated with compact urban expansion. High-density land development and usage improve the public transit and reduce the transportation energy use. Because people and buildings are concentrated, centralised energy delivery systems may reduce energy losses and improve energy use. A scale effect from population agglomeration improves energy efficiency in lighting, heating, air conditioning, and residential appliances. Resource and service sharing affects the energy efficiency and quality [35].
Compact urban development models also aim to improve people’s quality of life. Public service quality is a key measure of the local quality of life [36]. Urban green ecological barriers help create sustainable cities. They are essential to environmental protection and human–nature balance. Mindful design and smart green space placement in heavily populated urban areas does this [33]. Research suggests that high-density development might reduce human impacts on the environment and reduce resource use [37]. High-quality medical care, education, and social welfare also indicate well-being.
In conclusion, compact urban development intensively and strategically uses people, land, economy, and infrastructure (Figure 1). This technique boosts economic production and infrastructure use to increase municipal efficiency [35]. Chinese cities’ dense urban expansion requires the coordinated and dynamic operation of many urban aspects [38]. Compact urban concept is a hot topic in land planning and spatial governance. Despite their dedication to urban principles, China’s cities’ capacity to transition to compact growth depends on their metropolitan size, resource availability, and pre-existing social and economic institutions [39]. Thus, a conceptual framework and logical analysis can construct an indicator system for urban compact development efficiency (compact efficiency). This technique helps understand Chinese city compact development and prepares for the transition to compact cities.

3. Materials and Methods

3.1. Measurement of Compact Urban Development Efficiency

By using the essential attributes of compact cities, the logical framework for urban development that promotes compactness, and pertinent academic literature on the subject [23,31,34], we aim to provide an all-encompassing indicator system that incorporates many levels of analysis. The present study aims to analyse inputs, anticipated outputs, and unforeseen consequences pertaining to the concept of compact urban growth. This system will include ecological considerations, land resource management, the provision of social services, energy supply, and environmental factors. The assessment of compactness efficiency will be conducted by analysing urban district data, while accounting for the considerable internal variations and diverse characteristics seen within prefecture-level cities.
The primary input indicators include economic input, land factors, human resources, infrastructure, and energy supply. The urban sustainability and future expansion are influenced by the quantity and quality of economic variables and human resources. Land resources are a critical component of the vitality index of urban spatial development patterns and serve as a basis for urban development. Urban land compactness is directly evaluated by assessing land development intensity and land usage. The physical organisation of densely populated urban regions places a significant demand on the transportation infrastructure. The effectiveness of compact urban development is shown by the rise of transport infrastructure. The achievement of compact development necessitates the provision of a suitable energy source, since the energy consumption in urban areas is mostly attributed to industrial and residential purposes. The use of natural gas and liquefied petroleum gas in the industrial and transportation sectors serves as a significant impetus for energy consumption. Electricity is the primary source of energy consumption in households and is used in several aspects of everyday living [30]. Therefore, energy plays a crucial role in facilitating the growth of dense urban areas, particularly during the first stages.
The objective of compact urban development is to optimise outcomes in terms of economic, social, and ecological aspects. The well-being of urban dwellers is contingent upon crucial factors such as education, healthcare, and social welfare. The ecological environment serves as a crucial indicator for assessing the progress of low-carbon urban development. The anticipated outcomes of urban expansion include ecological degradation, traffic congestion, and a range of societal concerns. Therefore, proponents of compact urban growth must acknowledge and confront unintended consequences. These unexpected outputs dimensions can be based on data pertaining to industrial and residential pollution. These particular qualities have been chosen due to their significance in evaluating unforeseen outcomes. The dimension indicators are shown in Table 1.

3.2. Research Methodology

3.2.1. Undesirable Output Super-Efficiency SBM Model

A compactness efficiency evaluation helps transform urban planning paradigms. However, compact cities produce pollution and possess economic, social, and ecological advantages from resource inputs. To evaluate the compactness efficiency, the super-efficiency slacks-based measure (SBM) model is used. Combining the undesired output SBM model with the super-efficiency DEA model yields the super-efficiency SBM model. In the undesirable SBM model, all decision-making unit (DMU) efficiency values are 1. The suggested technique fixes this. This also allows for the comparisons of resource inputs, anticipated outputs, and unpleasant outcomes across numerous decision-making units [40].
ρ = min 1 1 m i = 1 m S i x i 0 1 + 1 S 1 + S 2 ( r = 1 S 1 S r g Y r 0 g + r = 1 S 2 S r b Y r 0 b )
s . t . x 0 = X λ + S y 0 g = Y g λ S g y 0 b = Y b λ + S b S 0 ,   S g 0 , S b 0 ,   λ 0
In Equation (1), ρ represents compactness efficiency, m represents the types of input for each DMU, S 1 represents the types of expected outputs, and S 2 represents the types of undesirable outputs; S represents input slacks, S b represents undesirable output slacks, and S g represents the shortfall in expected outputs. λ is the weight vector.

3.2.2. Exploratory Spatial Data Analysis

Investigating the spatial connection and interdependence of variables facilitates the comprehension of spatial patterns and the evolutionary attributes of such variables. The Moran’s Index is a widely utilised metric for quantifying spatial correlation, encompassing both the global Moran’s Index (I) and the local Moran’s Index (Il). The equations for computing these quantities are shown in Equations (2) and (3) correspondingly.
I = i 1 n j 1 n W i j ( X i X ¯ ) ( X j X ¯ ) S 2 i 1 n j 1 n W i j , ( i j )
In Equation (2), n represents the number of cities, X i and X j represent the observed values of variable X in cities i and j , X ¯ represents the mean value of the observations, S 2 represents the sample variance, and W i j represents the spatial weight matrix.
I l = ( X i X ¯ ) S 2 j 1 n W i j ( X j X ¯ )
In Equation (3), the meanings of the symbols are the same as in Equation (2).

3.2.3. Kernel Density Estimation

KDE, a non-parametric estimate method, was utilised to show the temporal dynamics from 2005 to 2021 to highlight compactness efficiency-related spatial-temporal distribution characteristics. Three areas were created from the 282 cities: eastern (98 cities), central (100 cities), and western (84 cities) to simplify observation. These divisions were based on economic zones. Kernel density estimation estimates random variable probability density functions. No data distribution assumptions are used in this non-parametric technique. The predicted density curve location and shape include key variable information [41]. Data dynamic distribution is shown by kernel density curves. They may increase the parametric estimate accuracy by reducing the function establishment subjectivity [42]. This formula calculates.
f ( x ) = 1 N h i = 1 N K ( X i x ¯ h )
In Equation (4), N represents the number of observations, X i represents the independently and identically distributed observations, denotes the mean of the observations, h represents the bandwidth, and K ( ) represents the kernel function. The widely used Gaussian kernel function is specified by the following formula [41].
K ( x ) = 1 2 π exp ( x 2 2 )

3.2.4. Theil Index

The Theil Index has significance in the assessment of income disparity among people and regions. The application uses the idea of entropy from information theory to quantify dissimilarity in the target variable. The Theil Index, together with its constituent components, may be used to assess regional disparities [43] and measure the relative contributions of within-group and between-group factors to total disparities [44]. In this research, the Theil Index was used to assess the efficiency of compactness. The variances pertaining to the three areas, as well as the variances within each individual region, were computed in order to demonstrate the presence of regional disparities. For more elaboration, readers are encouraged to consult further sources [45]. The provided equation is a computational formula.
T h e i l = 1 n i = 1 n y i y ¯ L n ( y i y ¯ )
In Equation (6), Τ h e i l represents the Theil index of compact urban development efficiency, y i represents the compact urban development efficiency of the i -th region, and y ¯ represents the average level of regional compact urban development efficiency. T ∈ [0, 1], where a larger value of T indicates greater differences between regions.
In order to conduct a more comprehensive examination of the underlying factors contributing to overall disparities, it is possible to deconstruct the Theil index and compute the respective contribution rates of within-region and between-region gaps. This may be achieved by employing the following formula:
Τ h e i l = T b + T w = k = 1 K Y k ln ( Y k n k / n ) + k = 1 K Y k l g k Y l Y k ln ( Y l / Y k 1 / n k )
In Equation (7), Tb represents the between-region difference, and T w represents the within-region difference. The n cities are divided into k intervals, and let g k represent the k -th interval, which contains n k provinces, where: Y l = y l / i = 1 n y i , Y k = k = 1 n k y k / i = 1 n y i .

3.3. Data Sources

To enhance the statistical integrity and accessibility of the data, this research excludes prefecture-level cities located in Hong Kong, Macau, Taiwan, and the Tibet Autonomous Region. This research investigated a total of 282 Chinese prefecture-level cities for the period spanning from 2005 to 2021. Data collecting was restricted to odd-numbered years only. This research investigates the transformation of administrative entities from counties to districts or cities to districts. The selection of these entities by researchers in 2019 was predicated upon their jurisdictional power inside the municipal area. The primary sources of data are the “China Urban Statistical Yearbook”, the “China Urban Construction Statistical Yearbook”, and many additional city statistical yearbooks. The use of trend analysis was mostly employed in the compilation of data for the 2021 statistics yearbook, primarily driven by the absence of comprehensive data. Linear interpolation was used to fill a subset of the dataset.

4. Results

The non-discretionary output-oriented super-efficiency SBM model assessed 282 cities’ compactness efficiency from 2005 to 2021. Average values were calculated from the results, as shown in Figure 2 and Table 2. The natural breakpoint technique in ArcGIS divided the compactness efficiency into five tiers. The low efficiency is from 0.267 to 0.530, medium-low is from 0.531 to 0.822, medium is from 0.823 to 1.203, medium-high is from 1.204 to 1.805, and high is from 1.806 to 3.686. Efficiency values were recorded and classed by eastern, central, and western regions. Efficiency value distributions provide useful information.
The effectiveness of Chinese urban development in achieving compactness, as measured across 282 cities, showed a fall from 0.9317 to 0.862 between the years 2005 and 2021. The pace of China’s urban transition in smaller cities seems to be decelerating. In the year 2021, it was seen that the eastern, central, and western from had decreased levels of efficiency in comparison to the year 2005. The regions located in the middle and western parts had a more significant decline compared to the eastern region. As shown in Figure 3, there has been a notable rise in the quantity of eastern cities falling into the low- and medium-low-efficiency categories. The observed trend reveals a decline in the quantity of cities with medium-efficiency, suggesting the adoption of a dual-tier strategy towards achieving a compact expansion in eastern urban areas. There was a drop in the number of low-efficiency cities in the central area, but there was an increase in the number of cities with medium-to-low efficiency. The drop in efficiency of the compact city practises in the central region may be mostly attributed to the decrease in the number of medium- and high-efficiency cities. In Western regions, cities with medium efficiency, medium-high efficiency, and high efficiency exhibited stability. The data reveal an increase in the number of medium-low efficiency cities, suggesting an improvement in the compactness efficiency of Western cities. The effectiveness of city compactness varies throughout the eastern, central, and western regions due to differences in resource endowments, development patterns, and national policies.

4.1. Formatting of Mathematical Components

4.1.1. Evolution of the Overall Spatial Pattern

The study of the spatial pattern development of compact efficiency plays a crucial role in understanding the interconnectedness of urban spaces. The compact efficiency (I value) of 282 cities from 2005 to 2021 was determined by the use of the worldwide Moran’s I index technique, as shown in Table 3. The presented data indicate that, with the exception of the years 2005 and 2021, all other years exhibited statistical significance at a 10% level. The present study shown a positive correlation between the geographical factors and compact efficiency in a sample of 282 urban areas. This demonstrates that the compact efficiency of central cities has an impact on surrounding cities, and conversely, the efficiency of outer cities impacts central cities. Nevertheless, the value of I has never surpassed 0.2 in any given year. This suggests that there is a limited but favourable correlation between compact efficiency and regional factors. Therefore, the spatial impact of compact efficiency is constrained.

4.1.2. Evolution of Local Spatial Patterns

The local Moran’s index provides a more detailed analysis of the changeable spatial relationships. Table 4 displays the calculated results. Eastern high–high (H-H) cities, especially in the Pearl River Delta, have increased. The number of highly urbanised cities (H-H) in the central region has fluctuated little, with Heilongjiang Province having the highest concentration in 2005. The number of highly urbanised (H-H) cities in the west has declined, as has the clustering trend that arose in 2005. In all three domains, the number of cities with high–low (H-L) and low–high (L-H) characteristics decreased. No intense and continuous distribution pattern can be seen in these cities. The eastern cities of Liaoning Province showed a clustering pattern with low–low (L-L) values only in 2021. In the middle region, the Hunan–Hubei boundary showed a characteristic low–low (L-L) clustering phenomenon. Compactness efficiency shows that local spatial patterns depend on city location and the economic and social foundations developed through extended urban expansion. National urban agglomeration strategies and regional integration plans directly affect the results.

4.2. Temporal Evolution Characteristics of Urban Compactness Efficiency

Moran’s index revealed the compactness efficiency’s geographical pattern. More research is required to comprehend this index’s temporal evolution patterns. Thus, density curve plots were generated using KDE to show the compactness efficiency of 282 cities in 2005, 2013, and 2021 (Figure 4a). Meanwhile, the geographical divides of the eastern, central, and western areas were used to highlight the temporal dynamics of local compactness efficiency. Figure 4b–d show how this approach illuminates the total urban compact development.

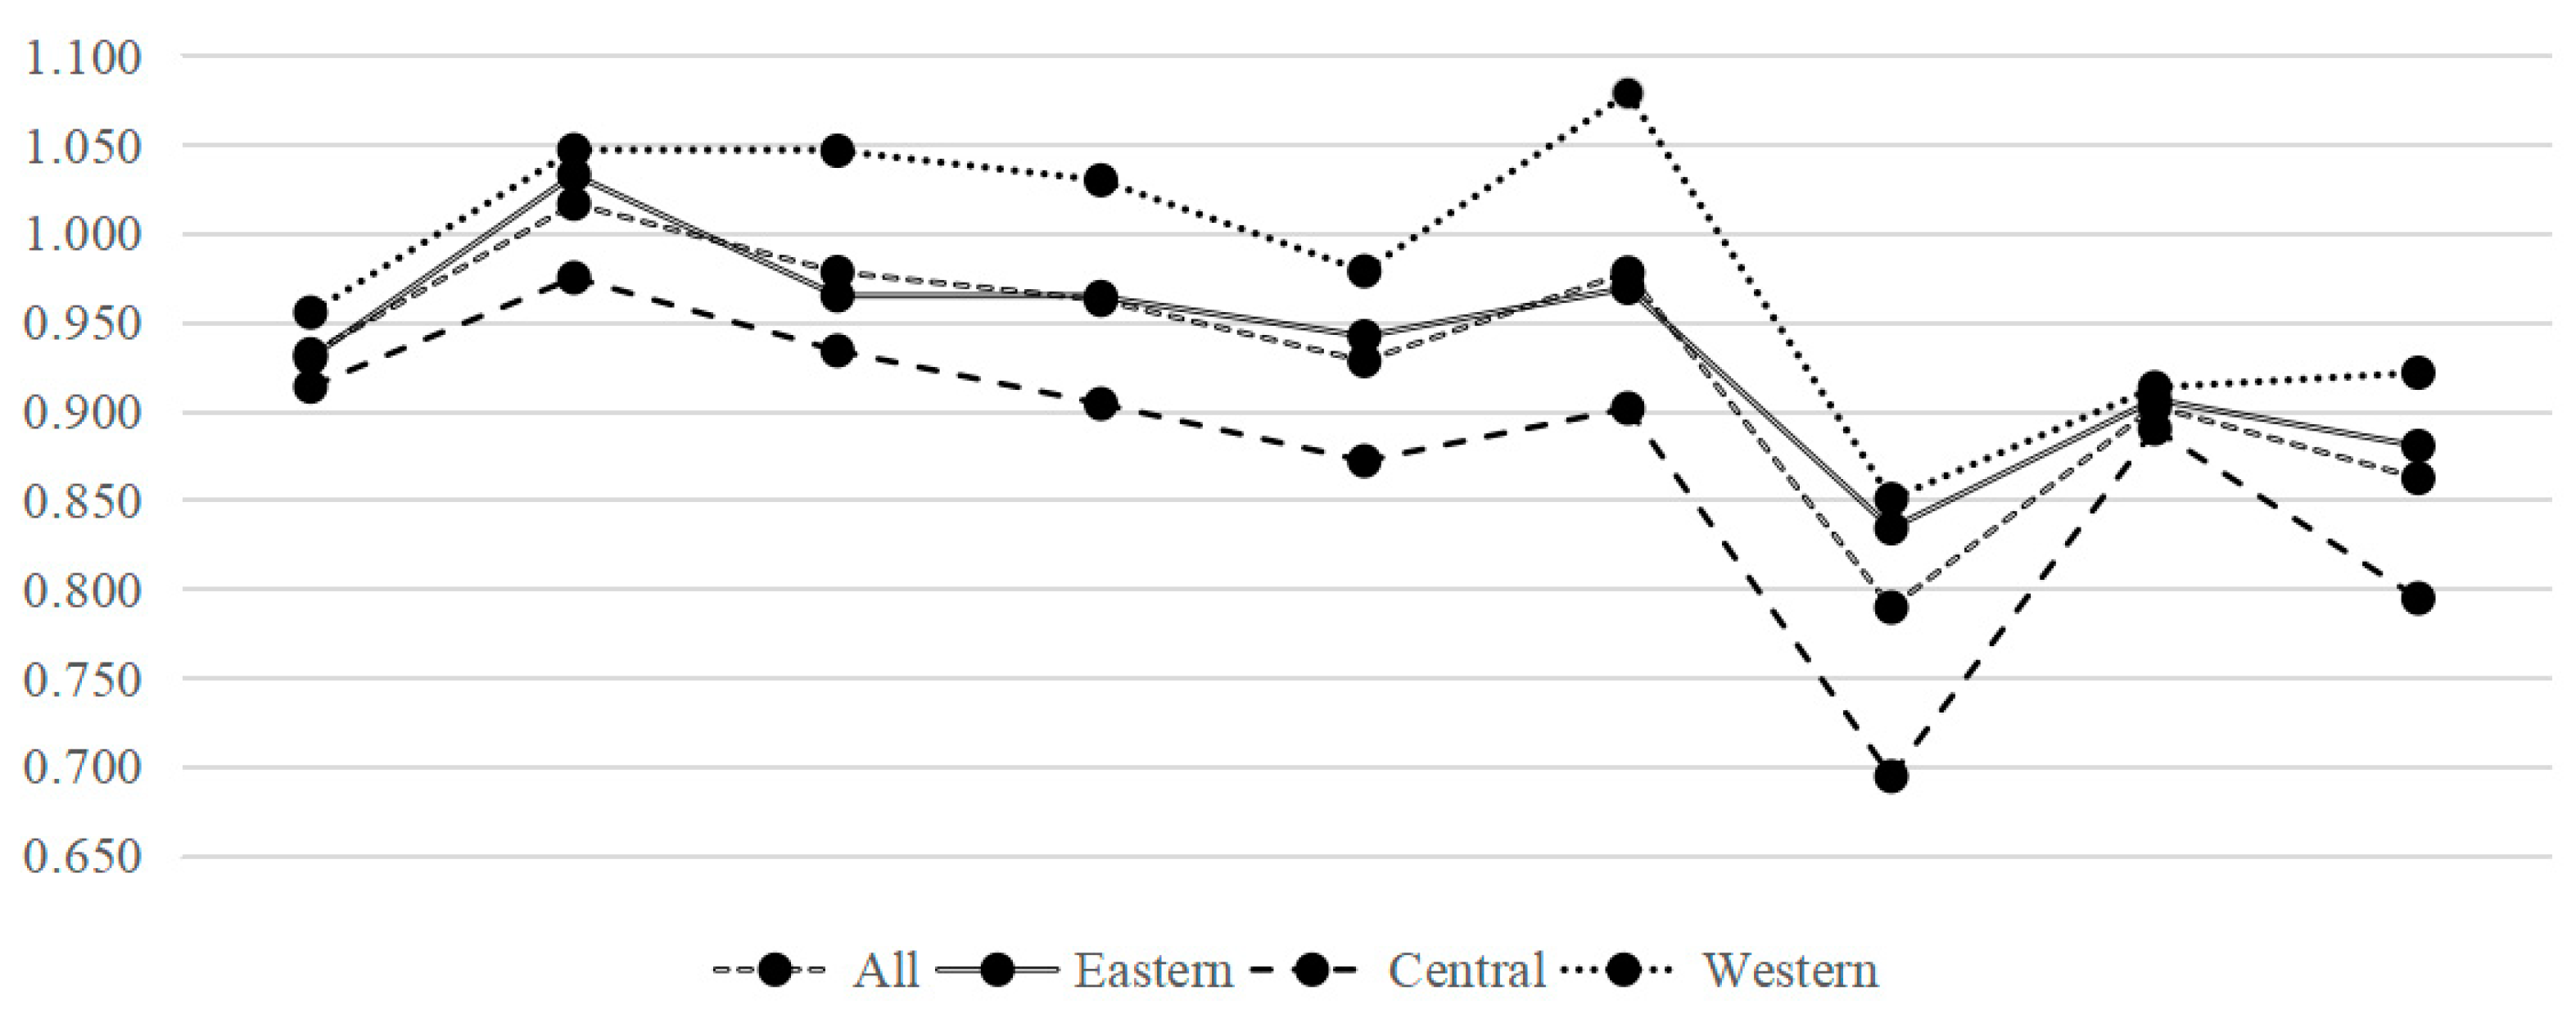
4.2.1. Overall Temporal Dynamics

Figure 4 illustrates the trends in national compactness efficiency. The placements of the curve centroids were constant from 2005 to 2021, indicating a level of compactness efficiency within a certain range. The heights of the curve peaks exhibited an upward trend between the years 2005 and 2013, followed by a subsequent fall from 2013 to 2021. This indicates a decreasing trend in the disparities in compactness efficiency across cities throughout the country. Nevertheless, the presented data indicate the presence of both primary and secondary peaks in the curves spanning from 2005 to 2021. This observation suggests that the issue of compactness efficiency polarisation does not need to be fully addressed. From 2005 to 2013, there was a noticeable reduction in both the length and height of the rightward distribution of the curve, suggesting a decline in the prevalence of efficient cities. The elongation and upward trajectory of the right tail from 2013 to 2021 indicates a significant increase in the prevalence of efficient cities. In summary, the compactness and efficiency of Chinese cities have undergone evolutionary changes over time, demonstrating their dynamic nature.

4.2.2. Local Temporal Dynamics

Figure 4 displays the kernel density estimate for the eastern, central, and western areas, aiming to examine differences in local compactness efficiency. Based on the available data, the following conclusions may be drawn. The centroid positions of the curves within each region exhibit consistent stability from 2005 to 2021, suggesting a high level of local compactness efficiency. The amplitudes of the peaks in the eastern and western curves exhibited an upward trend between 2005 and 2013, followed by a little reduction from 2013 to 2021. This graph demonstrates that there is an initial decline followed by a rise in the disparities of compactness efficiency in these two sites. Between the years 2005 and 2021, there was a consistent decrease in the maximum height of the curve within the central area, indicating a widening disparity in terms of density and effectiveness across urban centres. The findings of this investigation revealed the presence of both primary and secondary peaks throughout the observed time frame, indicating a persistent trend towards increased regional compactness efficiency. The eastern right tail had a decline from 2005 to 2013, followed by an increase from 2013 to 2021. The aforementioned data indicate that the emergence of highly efficient cities in the eastern region exhibits a degree of instability. The data indicate a persistent fall in the right-skewness of the distribution within the central area between 2005 and 2021, suggesting a decrease in the prevalence of highly efficient cities. The alterations seen in the western rightward tail of the distribution were found to be similar to those observed in the eastern section. Nevertheless, it is worth noting that the rightward tail in the western region had a greater extent, indicating an improvement in the compactness efficiency of some cities. The magnitudes of the curves in the eastern, central, and western regions are comparable and broader in comparison to those in the western region. This suggests that eastern and central cities have a somewhat lesser propensity for compactness compared to western ones. The compactness efficiency and temporal evolution characteristics exhibit variation across the three places, perhaps influenced by several reasons.

4.3. Analysis of Differences in Urban Compact Development Efficiency

Theil index analysis serves to explain differences in compactness efficiency. Table 5 displays the results of calculations. From 2005 to 2021, the Theil index declined, except for a 2017 peak of 0.1705. In particular, the value decreased from 0.0775 in 2005 to 0.0579 in 2013 to 0.0503 in 2019. A significant public health crisis in 2021 may have had a greater influence on the observed data point. In general, the efficiency gap between Chinese cities decreased.
In addition, the Theil index decomposition reveals a V-shaped pattern in regional variations. While intra-regional inequalities diminish, the intra-regional difference index consistently outpaces the inter-regional difference index over the course of many years. This demonstrates that regional variations are the primary cause of differences in Chinese city compactness efficacy. The eastern region’s contribution rate is the lowest, fluctuating around 25.28 percent over the years. However, the central region ranks second with a consistent contribution rate of 32.8 percent. Last but not least, the West has the highest average contribution rate, 40.0%. This demonstrates that the western region has a greater impact on the compactness efficacy than the eastern region.
The Theil index displays a V-shaped distribution for regional differences in eastern, central, and western China. After 2007, the indicator fluctuates linearly, indicating that eastern cities are progressing towards coordinated compactness efficiency. The results of urban clusters in the east and regional integration programmes support the claim. The trajectory of the core region resembles a “W”, indicating that regional divergence converges with compact expansion. However, the development efficacy of cities in various geographic locations varies, necessitating increased government cooperation to synchronise growth. The western region also exhibits a fluctuating W-shaped pattern, but its fluctuations are more pronounced, indicating that compactness efficiency fluctuates. This fits western development conditions.
In conclusion, intraregional development disparities cause differences in the compactness efficiency between Chinese cities. Notably, the western region has the strongest effect on the efficacy of national compactness. China’s urban compact growth must therefore look beyond the eastern region and recognise the strategic significance of the middle and western regions, notably western cities. When examining variations within a region, the eastern region’s internal disparities decreased. Internal disparities between the centre and west, particularly the west, persist. Consequently, it is essential to encourage compact urban development across regions and reduce efficiency disparities.

5. Conclusions

5.1. Main Conclusions

The sustainable growth of cities is contingent upon the implementation of the compact city concept. However, it is equally essential to accurately measure the efficiency of compactness. The study used the non-expected output super-efficiency SBM model to assess the compact efficiency of 282 cities and examine the potential changes in terms of geography, time, and area. One advantage of the non-desired output super-efficiency SBM model in assessing efficiency lies in its ability to encompass multiple dimensions of desired outputs in the measurement process. Additionally, this model takes into consideration non-desired outputs simultaneously, resulting in more accurate and realistic efficiency values. The study yielded the following findings.
1. The research findings indicate that the compact efficiency of Chinese cities remains stable during the study period. The average efficiency value for the whole area exhibits little fluctuations, although the central and western areas see significant variations. Based on the quantification of cities falling within the efficiency distribution interval, it can be shown that the phenomenon of bifurcation in compact efficiency within eastern cities has persisted without any reversal. Conversely, the central area experienced a marginal decline in efficiency, and the western region witnessed an improvement in efficiency. Efficiency statistics pertaining to compactness continue to have value in their capacity to serve as a dynamic indication in the promotion of compact urban development in the future.
2. The analysis of the spatial pattern of compact efficiency in the sample cities reveals that the growth of compact cities exhibits notable positive self-relevance in terms of spatial development. However, the overall spatial effect of compact efficiency is found to be relatively modest, indicating that the influence of compactness on spatial factors is limited. The analysis of the local Moran Index reveals that the spatial spillover effect of compact efficiency is relatively weak. Additionally, distinct levels of agglomeration patterns have emerged in the eastern, central, and western regions. However, it is important to note that these patterns are not yet characterised by a widespread, centralised, and continuous distribution of cities. The manifestation of differentiation and agglomeration effects in the practise of the compact city idea is shown by the geographical distribution pattern and evolutionary features exhibited by compact efficiency.
3. The temporal progression characteristics of compact efficiency exhibit fluctuations, with a mostly stable trend, and the efficiency values consistently demonstrate a bifurcated distribution over the course of the study. The analysis of wave width reveals that the level of compactness in eastern cities remains relatively stable within a restricted range, with the central regions exhibiting a similar pattern. Conversely, cities located in the western regions exhibit greater variability in their compactness levels. Regarding the distribution of cities exhibiting a higher compact efficiency, it can be seen that the eastern area displays a persistent state of fluctuation, whilst the central region sees a gradual decline. The western area has similarities to the eastern region, but with several cities in the former seeing a notable improvement in compact efficiency within a limited timeframe. The implementation of compact city strategies will perpetuate this evolutionary inclination, since the effectiveness of compactness is influenced by a range of factors.
4. The results from the analysis of the Theil Index and its decomposition indicate a gradual reduction in efficiency disparities across Chinese cities over the course of the study period. However, it is important to note that significant regional inequalities still persist. The Theil Index of the eastern area exhibits a consistent trend of straightening after 2007, suggesting a steady narrowing and stabilisation of its compact efficiency differential. In contrast, the centre region’s Theil Index has a tendency towards narrowing, but with some instability. On the other hand, the Theil Index of the western region shows a fluctuation pattern resembling the shape of the letter “W”. In terms of inter-regional dynamics, it can be seen that the western area has the most influence on the overall efficiency of regional compacts, whilst the eastern region exhibits the lowest impact.
In summary, this study contributes to the advancement of information on compact cities. However, it is important to note that the limited availability of works on compact efficiency evaluation constrained the use of indicators in this research. The methodology for evaluating compact efficiency attempts to include indicator values from several dimensions to the greatest extent possible; however, it may not encompass all elements of urban compact efficiency. The exclusion of carbon dioxide, a significant greenhouse gas, from the assessment of non-desired outputs due to limitations in data sources has the potential to introduce distortions in efficiency measures. Therefore, it is essential for future research to explore methods for constructing an impeccable indication system. However, despite the study’s focus on city districts to examine urban compact efficiency, it is important to acknowledge the presence of intra-city variations. Therefore, it is necessary to further define the study’s objectives and scope. The timeline for this research has been established as odd-numbered years between 2005 and 2021 due to limitations in data completeness and accessibility. However, it is important to note that this timeframe may not completely capture the growth of compact development efficiency in Chinese cities and may need more supplementation and updates in the future.

5.2. Main Measures

Compact efficiency enhancement involves many elements of urban development, not only the policy supply of the country and the region, but should focus more on the transformation and escalation of the city itself at the economic and social levels, in order to improve compact effectiveness as an opportunity to promote sustainable urban development. Therefore, based on the above findings and conclusions, the following policy recommendations.
1. It is essential to adhere to the execution of the compact city idea and expedite the planning and construction of compact cities. Local governments play a crucial role in the modernisation of urban governance by facilitating the transition towards a more compact urban development model. This may be achieved via the careful selection and effective implementation of various policy options. The government should proactively formulate urban development plans based on the city’s inherent characteristics and development positioning, promote high-density development, the multi-functional use of urban land by regulating and restricting various land uses, rationalise urban spatial layout, and curtail sprawling development in order to gradually explore the path of compactness-based sustainable urban development.
2. The intention is to establish a compact transport system and facilitate the spatial spillover phenomenon associated with urban compactness. It is imperative to actively encourage the widespread development of transportation infrastructure and the widespread adoption of public transportation systems. By leveraging the connectivity of the transportation road network, we can effectively harness the co-location effect. This will facilitate the efficient movement of production factors, such as economic talents and energy, within the region. Furthermore, it will promote the standardisation of urban compact development and enhance its efficacy. Simultaneously, the implementation of urban compact development can be associated with regional integration strategies, which enhance the pivotal role of core cities in the region and bolster the coordination and influence of peripheral cities. This approach aims to harness the developmental capabilities of diverse city types within the compact practise model.
3. The active promotion of regional compact efficiency and the reduction in development disparities between cities are key objectives. Based on the government’s strategic plan for the development of China’s east, central, and western regions, this study considers the developmental strengths of cities in terms of human resources, energy reserves, and geographical location. The aim is to enhance efficiency in all dimensions, promote inter-city and regional development, and reduce disparities within cities. Simultaneously, the surge in logistics resulting from the transformation and advancement of the industrial framework may be used to facilitate the amalgamation of the eastern, central, and western areas. It is noteworthy that, considering the ecological impact of the compact city idea, the western area need to adopt a distinct compact city development plan compared to other regions.
4. The objective is to actively advocate for the promotion of balanced regional development, with a focus on enhancing compactness and efficiency while simultaneously mitigating inequities in urban development across different areas. Given the strategic placements of the eastern, central, and western regions within the country, along with the developmental benefits offered by cities in terms of talent resources, energy reserves, and geographical location, it becomes imperative to improve efficiency in various dimensions and progressively move from reducing internal disparities to attaining balanced development among cities and even regional development. Furthermore, by placing a focus on the integration of urban and rural development through industrial transformation and upgrading, as well as adopting a rational spatial layout, the integration of development throughout the eastern, central, and western regions may be effectively accomplished through the implementation of transportation and logistics strategies. Furthermore, in light of the criteria for ecological environmental quality in compact cities, the western area must prioritise the safeguarding of regional ecological environments while implementing urban compact development. The implementation of a diversified development plan that is separate from the compact city model is necessary in the central and eastern areas.

Author Contributions

Conceptualisation, W.R. and L.W.; methodology, W.R.; software, H.Y.; validation, W.R. and L.W.; formal analysis, X.L.; investigation, W.R. and L.W.; resources, X.L.; data curation, L.W.; writing—original draft preparation, W.R.; writing—review and editing, W.R. and X.L.; visualisation, H.Y.; supervision, H.Y.; project administration, X.L.; funding acquisition, X.L. All authors have read and agreed to the published version of the manuscript.

Funding

This research was funded by the Key project of National Social Science Foundation of China, grant no. 21FGLA003.

Data Availability Statement

Publicly available datasets were analysed in this study. The data can be found here: (https://www.cnki.net (accessed on 27 December 2022)).

Acknowledgments

The authors extend great gratitude to the anonymous reviewers and editors for their helpful reviews and critical comments.

Conflicts of Interest

The authors declare no conflict of interest.

References

  1. George, B.D.; Thomas, L.S. Compact City: A Plan for a Livable City Environment; Free and Company: San Francisco, CA, USA, 1973. [Google Scholar]
  2. Tang, Y.; Song, Y.; Xie, J. Analysis of the changes in compactness of urban spatial forms in China from 2000 to 2010. Ecol. Sci. 2016, 35, 134–139. [Google Scholar]
  3. Morrison, N. The compact city: Theory versus practice—The case of Cambridge. Neth. J. Hous. Built Environ. 1998, 2, 157–179. [Google Scholar] [CrossRef]
  4. Jia, M.; Liu, X.Y.; Chen, T.; Fan, F. Measurement of compactness for Chinese prefecture-level and above cities. Urban Probl. 2019, 11, 4–12. [Google Scholar]
  5. Chen, B.Z. Compact and ecological city. Urban Plan. J. 2008, 3, 28–31. [Google Scholar]
  6. Lü, B.; Qi, L. Implications of compact city theory for urbanization in China. Urban Plan. J. 2008, 4, 61–63. [Google Scholar]
  7. Xinhua Net. Central Urban Work Conference held in Beijing [EB/OL]. Available online: http://www.xinhuanet.com//politics/2015-12/22/c_1117545528.htm (accessed on 17 June 2022).
  8. Li, S.C.; Li, X.Y. The impact of compact urban spatial structure on labor productivity: An analysis based on the perspective of regional economic development. Urban Probl. 2017, 7, 42–47. [Google Scholar]
  9. Rong, P.J.; Liu, H.; Lü, L.Q.; Qin, Y.C. Comprehensive evaluation of compactness of cities in Henan Province based on evolutionary tree model. Reg. Res. Dev. 2019, 38, 48–53. [Google Scholar]
  10. Li, J.; Xia, S.W. Measurement of compactness and analysis of multiple effects of Chinese mega-cities. Urban Dev. Res. 2016, 23, 109–116. [Google Scholar]
  11. Wang, J.; Yuan, F. Comprehensive evaluation of compactness of the Yangtze River Delta cities based on the evolutionary tree model. Resour. Environ. Yangtze Basin 2014, 23, 741–750. [Google Scholar]
  12. Huang, Y.B.; Dong, S.C.; Bai, Y.P.; Li, J.; Mao, Q.L. Study on the spatiotemporal evolution characteristics of compactness in Chinese cities at or above the prefecture level. Sci. Geogr. Sin. 2014, 34, 531–538. [Google Scholar]
  13. Zhang, W.M.; Fang, Q.M.; Liu, T. Evaluation of urban compactness based on grey correlation: A case study of the Chang-Zhu-Tan urban agglomeratio. Urban Probl. 2016, 10, 37–43. [Google Scholar]
  14. Zapata Campos, M.J.; Kain, J.H.; Oloko, M.; Stenberg, J.; y Zapata, P. Urban qualities and residents’ strategies in compact global south cities: The case of Havana. J. Hous. Built Environ. 2022, 37, 529–551. [Google Scholar] [CrossRef]
  15. Bibri, S.E. The underlying components of data-driven smart sustainable cities of the future: A case study approach to an applied theoretical framework. Eur. J. Futures Res. 2021, 9, 13. [Google Scholar] [CrossRef]
  16. Røe, P.G.; Kjærås, K.E.A.; Haarstad, H. The spatialities of the Nordic compact city. In Socio-Spatial Theory in Nordic Geography: Intellectual Histories and Critical Interventions; Springer: Cham, Switzerland, 2022; pp. 191–205. [Google Scholar]
  17. Gonzalo, A.L. Recent Transformations in the Morphology of Spanish Medium-Sized Cities: From the Compact City to the Urban Area. Land 2023, 12, 1276. [Google Scholar]
  18. Salvati, L.; Sabbi, A. Identifying Urban Diffusion in Compact Cities through a Comparative Multivariate Procedure. Ann. Reg. Sci. 2014, 53, 557–575. [Google Scholar] [CrossRef]
  19. Huang, Y.B.; Dong, S.C.; Bai, Y.P. Spatiotemporal characteristics of the relationship between urban compactness and urban efficiency in China. China Popul. Resour. Environ. 2015, 25, 64–73. [Google Scholar]
  20. Bai, Y.P.; Di, B.X.; Wang, P.L.; Huang, Y.B. Research on c ompactness and its influencing factors along the Longhai-Lanxin-Beijing-Junggar Railway. Econ. Geogr. 2012, 32, 37–42+49. [Google Scholar]
  21. Sun, F.X.; Lü, L.C. The Impact of Urban Compactness on Urban Innovation in China. Hum. Geogr. 2021, 36, 97–107. [Google Scholar]
  22. Hao, W.W.; Zhang, M.Q. Empirical Study on the Relationship between Transportation Improvement, Urban Compactness, and Urban Productivity: Based on the Spatial Panel Data Analysis of Chinese Prefecture-level Cities. Econ. Issues Res. 2016, 3, 66–75. [Google Scholar]
  23. Chen, T.; Zhang, Y.; Wang, Y.G.; Li, Z.Y. Study on the Coupling and Coordination Relationship between Urban Compactness and Ecological Environment Quality from the Perspective of Sustainable Development: Empirical Analysis of Chinese Provincial Capital Cities and Direct-administered Municipalities. Ecol. Econ. 2021, 37, 93–99+107. [Google Scholar]
  24. Mao, G.X.; Ding, J.H.; Cao, L. Comprehensive Measurement and Driving Force Analysis of Urban Compactness: A Case Study of Jiangsu Province. Sci. Geogr. Sin. 2009, 29, 627–633. [Google Scholar]
  25. Chen, Z.X.; Xu, Q. Empirical Analysis of Urban Compactness: Based on Guangdong’s Prefecture-level and Above Cities. Urban Obs. 2019, 1, 63–73. [Google Scholar]
  26. Han, G.; Yuan, J.D. Distribution Characteristics and Spatial Correlation Analysis of Urban Compactness in the Three Northeastern Provinces. Reg. Res. Dev. 2017, 36, 24–28+34. [Google Scholar]
  27. Zu, J.X.; Ye, C.S. Comprehensive Measurement and Analysis of Urban Compactness in Jiangxi Province. J. East China Univ. Technol. 2013, 32, 338–344. [Google Scholar]
  28. Shu, G.; Liu, S.K.; Lu, R.C.; Ye, Z.D.; Wang, Y.X.; Wang, J.J. Temporal and Spatial Characteristics of Urban Compactness and Land Use Efficiency in Guangxi from 2003 to 2018. Bull. Soil Water Conserv. 2021, 41, 300–309. [Google Scholar]
  29. Yang, H.; Lu, X.H.; Kuang, B.; Hou, J. Spatio-temporal Interaction Relationship and Driving Factors between Urban Compactness and Carbon Emission Intensity: A Case Study of Changsha-Zhuzhou-Xiangtan Urban Agglomeration. Resour. Environ. Yangtze Basin 2021, 30, 2618–2629. [Google Scholar]
  30. Cheng, K.M. Theoretical Mechanism and Empirical Analysis of the Influence of Urban Compactness on Energy Consumption. Econ. Geogr. 2011, 31, 1107–1112. [Google Scholar]
  31. Dou, J.M.; Tao, Z.P.; Wang, W. The Influence Mechanism of Urban Compactness on Air Pollution. Econ. Manag. 2020, 42, 5–26. [Google Scholar]
  32. Zheng, H.Y.; Wu, C.F.; Zheng, S.; Zhuo, Y.F.; Zhang, Q. Study on Urban Compact Development and Land Mixed Use from the Perspective of Spatial Consistency: A Case Study of Shanghai. China Land Sci. 2016, 30, 35–42. [Google Scholar]
  33. Chen, T.; Zhang, Y. The Influence Mechanism of Urban Compactness on Economic Vitality: Empirical Analysis of Chinese Direct-administered Municipalities and Provincial Capital Cities. Urban Probl. 2021, 6, 34–42. [Google Scholar]
  34. Guo, J.; Yue, W.R. Urban Compactness and Regional Innovation Capacity: A Case Study of Jiangsu Province. Technol. Econ. 2020, 39, 51–58. [Google Scholar]
  35. Tian, C.S.; Li, J. Research on the Relationship between Urban Compactness and Energy Efficiency in Large Cities. J. Nat. Resour. 2018, 33, 1781–1795. [Google Scholar]
  36. Han, G.; Yuan, J.D.; Wang, Z.B. Spatio-temporal Evolution and Correlation of Urban Compactness and Urban Efficiency in Jilin Province. China Popul. Resour. Environ. 2017, 27, 20–27. [Google Scholar]
  37. Hao, W.W.; Zhang, M.Q.; Liu, Z.Q. Empirical Study on the Relationship among Transportation, Urban Compactness, and Urban Productivity: Based on the Panel Data Analysis of Prefecture-level Cities in the Beijing-Tianjin-Hebei Region. Macroecon. Res. 2016, 1, 109–120. [Google Scholar]
  38. Hong, J.; Cao, X.Q. The Connotation of “Compact City” and Its Adaptability to the Development of Chinese Cities. J. Lanzhou Univ. 2014, 6, 110–116. [Google Scholar]
  39. Wu, G.C.; Yang, H.; Chong, D. Measurement and Comparative Study of Compact-style Development Efficiency with Unexpected Output in Cities. China Soft Sci. 2021, 2, 79–89. [Google Scholar]
  40. Zha, J.P.; Cai, W.X. Research on Water Use Efficiency and Spatial Spillover Effects in the Yellow River Basin. Water-Sav. Irrig. 2022, 1, 26–30+35. [Google Scholar]
  41. Han, C.F.; Song, F.L.; Teng, M. Spatial and Temporal Characteristics, Spatial Clustering, and Governance Strategies of Carbon Emission in the Yangtze River Delta Region. East China Econ. Manag. 2022, 36, 24–33. [Google Scholar]
  42. Ke NLu, X.H.; Kuang, B. Spatial and Temporal Evolution and Influencing Factors of Green and Low-carbon Land Use in Chinese Cities: An Empirical Study Based on Carbon Neutrality Targets. Urban Probl. 2021, 7, 33–40. [Google Scholar]
  43. Wang, J.; Zhu, J.; Luo, Q. Measurement and Evolution of China’s Digital Economy Development Level. J. Quant. Econ. Tech. Econ. 2021, 38, 26–42. [Google Scholar]
  44. Yan, M.T.; Qiao, J.J.; Qu, M.; Zhu, Q.K. Analysis of Spatial and Temporal Differentiation and Influencing Factors of High-quality Green Development Level in the Yellow River Basin. People’s Yellow River 2022, 44, 15–20. [Google Scholar]
  45. Pan, J.; Zheng, H.L. Spatial and Temporal Evolution Characteristics of Regional Economic High-quality Development Differences. Stat. Decis. 2021, 37, 88–92. [Google Scholar]
Figure 1. Conceptual diagram of compact urban development.
Land 12 01837 g001
Figure 2. Comparison table of urban compact development efficiency averages in three major regions of China (2005–2021).
Land 12 01837 g002
Figure 3. Comparison chart of the quantity distribution of urban compact development efficiency in China (2005 and 2021).
Land 12 01837 g003
Figure 4. Temporal dynamics and evolution characteristics of compact urban development efficiency in China: (a) all; (b) eastern; (c) central; (d) western.
Land 12 01837 g004
Table 1. Measurement indicator system for compact urban development efficiency.
LevelFactorIndexCalculation Method
InputEconomic
Factors
Proportion of Secondary and
Tertiary Industry Output
Output of Secondary and Tertiary Industries/GDP (%)
Economic Input IntensityTotal Fixed Asset Investment/Area (104 CNY/km2)
Land ResourcesLand Development IntensityBuilt-up Area/Administrative Area (%)
Land Utilization RateConstruction Land Area/Built-up Area (%)
Human
Resources
Population DensityPopulation/Administrative Area (104 Per/km2)
Proportion of Secondary and
Tertiary Industry Employees
Employees in Secondary and Tertiary Industries/Total Employment (%)
Transportation FacilitiesPer Capita Road AreaUrban Road Area/Population (m2)
Efficiency of Public Transportation SystemTotal Passenger Volume of Public Buses/Number of Operating Buses (10,000 Person-Times/Vehicle)
Energy
Supply
Electricity ConsumptionTotal Electricity Consumption (104 kWh)
Gas SupplyTotal Gas Supply (Artificial and Natural Gas) (104 m3)
Liquefied Petroleum Gas SupplyTotal Liquefied Petroleum Gas Supply (t)
Expect
Output
Economic DimensionPer Capita GDP OutputGDP/Administrative Area Population (CNY/Person)
GDP Density IndexGDP/Administrative Area (104 CNY/km2)
Social
Dimension
Education ServicesNumber of Primary and Secondary School Teachers/Number of Primary and Secondary School Students in Administrative Area (%)
Medical ServicesNumber of Hospital Beds in Urban Area/Urban Population (Units/104)
Social Welfare LevelTotal Retail Sales of Social Consumer Goods/Urban Population (CNY/person)
Ecological
Dimension
Per Capita Public Green Space AreaPer Capita Public Green Space Area (m2)
Built-up Area Green Coverage RateGreen Coverage Area of Built-up Area/Built-up Area (%)
Unexpected
Output
Industrial
Pollution
Industrial Wastewater DischargeIndustrial Wastewater Discharge (104 t)
Industrial SO2 EmissionsIndustrial SO2 Emissions (t)
Industrial Smoke and Dust
Emissions
Industrial Smoke (Dust) Emissions (t)
Domestic
Pollution
Sewage DischargeSewage Discharge (104 m3)
Domestic Waste TreatmentDomestic Waste Treatment (104 t)
Table 2. Average values of compact urban development efficiency in Chinese cities from 2005 to 2021.
200520072009201120132015201720192021
All0.932 1.017 0.978 0.962 0.928 0.978 0.789 0.903 0.862
Eastern region0.930 1.033 0.965 0.964 0.942 0.969 0.834 0.906 0.880
Central region0.914 0.975 0.934 0.904 0.872 0.902 0.694 0.890 0.794
Western region0.955 1.047 1.047 1.030 0.979 1.079 0.850 0.913 0.921
Table 3. Global Moran’s index (I) values of compact urban development efficiency in Chinese cities from 2005 to 2021.
200520072009201120132015201720192021
I0.0230.1110.1120.1970.1760.0810.1530.0630.031
P0.2590.0050.0030.0010.0010.0010.0010.0480.195
Table 4. Local spatial pattern distribution of compact urban development efficiency in Chinese cities in 2005 and 2021.
State20052021
EasternH-HZhongshan,Jiangmen, Zhuhai, Shenzhen,
H-LChengde, Suqian, Jining, Yancheng,Panjin, Jinan, Cangzhou
L-HZhaoqing, Jiangmen, Huizhou,Shantou, Guangzhou, Yancheng,
Tianjin, Fuzhou
L-LLinyi, Xuzhou, Yangzhou, Zhenjiang,Dalian, Anshan, Yingkou, Anqing, Tongling
CentralH-HHeihe, Qiqihar, Suihua, Yichun——
H-LShiyan, Huaihua, Xinyang, Bozhou, Huaibei,Nanyang
L-H——Linfen
L-LHefei, Suzhou, Bengbu, Huainan, Chuzhou, Fuyang, Lu’an,Xuchang, Luohe, Yongzhou, Jingmen, Huanggang
WesternH-HHulunbuir, Jiayuguan, Baiyin, Guyuan, Dingxi, Tianshui, Baoshan,Zhangye, Wuhai, Yan’an, Xianyang, Weinan,
H-LShizuishan, Mianyang, Ziyang, Zunyi, Guigang, Beihai,Laibin, Yulin
L-HZhangye, Wuhai, Qingyang,Jiuquan, Ya’an
L-L——Hezhou
Table 5. Regional differences and contributions of compact urban development efficiency in Chinese cities from 2005 to 2021.
Year2005 2007200920112013201520172019 2021
Overall
Difference
0.07750.04020.05320.04630.05790.05930.17050.05030.0844
Inter-Regional Difference0.00020.00050.00110.00140.00110.00270.00110.00010.0019
Intra-Regional Difference0.07740.03980.05210.04490.05670.05670.05670.05030.0825
Eastern0.05830.02160.03730.03450.03950.03650.03950.04640.0738
(26.08%)(18.95%)(24.01%)(25.93%)(24.06%)(21.20%)(24.06%)(32.21%)(31.03%)
Central0.07050.04160.04770.05300.06480.04460.06480.04420.0775
(31.61%)(35.13%)(30.38%)(38.14%)(37.28%)(24.59%)(37.28%)(30.73%)(30.03%)
Western0.10690.05870.07260.04790.06760.08980.06760.06170.0973
(42.10%)(44.73%)(43.51%)(32.94%)(36.69%)(49.73%)(36.69%)(36.95%)(36.70%)
Disclaimer/Publisher’s Note: The statements, opinions and data contained in all publications are solely those of the individual author(s) and contributor(s) and not of MDPI and/or the editor(s). MDPI and/or the editor(s) disclaim responsibility for any injury to people or property resulting from any ideas, methods, instructions or products referred to in the content.

