Article

Assessing Net Environmental and Economic Impacts of Urban Forests: An Online Decision Support Tool

by
Javier Babí Almenar
1,2,3,
Claudio Petucco
1,
Tomás Navarrete Gutiérrez
1,
Laurent Chion
1 and
Benedetto Rugani
1,*
1
RDI Unit on Environmental Sustainability Assessment and Circularity, Environmental Research & Innovation (ERIN) Department, Luxembourg Institute of Science and Technology (LIST), Maison de l’Innovation, 5 Avenue des Hauts-Fourneaux, L-4362 Esch-sur-Alzette, Luxembourg
2
Institute of Molecular Sciences, University of Bordeaux, 351, Cours de la Liberation, F-33400 Talence, France
3
Department of Civil, Environmental and Mechanical Engineering, University of Trento, Via Mesiano, 77, I-38123 Trento, Italy
*
Author to whom correspondence should be addressed.
Land 2023, 12(1), 70; https://doi.org/10.3390/land12010070
Submission received: 4 December 2022 / Revised: 19 December 2022 / Accepted: 22 December 2022 / Published: 26 December 2022
(This article belongs to the Special Issue Planning Sustainable Cities through Nature-Based Solutions)

Abstract

:
Nature-based solutions (NBS) are becoming popular in urban planning and policy making as cost-effective solutions capable of delivering multiple ecosystem services and addressing several societal challenges. So far, however, the cost-effectiveness of urban NBS projects has not been consistently quantified by built environment professionals, who lack user-friendly tools to account for the environmental costs and benefits of NBS. This paper presents a prototype online decision support tool (NBenefit$®) that calculates the negative and positive environmental impacts, externalities, and financial values of planned urban forests over their entire life cycle. NBenefit$ relies on a modelling framework that combines system dynamics, urban ecology, and life cycle thinking approaches, and it is presented as a visual web-based interface. An online map and a grid of cells is used to map the site of intervention, to delineate the size of the urban forest, and to define variations in abiotic, biotic, and management attributes in each site. Outputs are provided by year, for the entire site and NBS life cycle. The potential value of NBenefit$ as a supporting tool was exemplified with the calculation of 48 urban forest archetypes, a few of which were used to set scenarios for a hypothetical urban forest in Madrid (Spain). The results showcase the impact that decisions taken during the planning, design, or management of an NBS project may have on its long-term performance. Future works will expand the scope of NBenefit$, including other types of urban NBS.

1. Introduction

The use of nature-related concepts such as green infrastructure, ecosystem-based approaches, or nature-based solutions (NBS) have been recently pushed forward by policy makers, researchers, and innovative built environment professionals [1,2,3]. These concepts frame natural features or actions applied on them as solutions that supply or enhance the provision of ecosystem services (ES), i.e., ecosystem flows from which some societal benefits derive [4]. In particular, NBS are described as solutions inspired and supported by nature that address multiple societal challenges and produce multiple environmental, social, and economic benefits in a cost-effective way [5,6]. Specific examples of urban NBS include solutions such as urban forests, green roofs, green walls, and bioswales (see [7] for a detailed list). Urban forests, i.e., any woodland, group of trees, or individual trees present in urban or periurban areas [8], have especially attracted attention due to the wide range of ES that they supply [7,9].
To mainstream NBS, including urban forests, as a sustainable solution for urban areas, it is necessary to quantify their capability to address multiple societal challenges and their potential to provide multiple co-benefits in a cost-effective way. Cost-effectiveness is a key factor in the case of NBS, and it is rarely included in other nature-related concepts (see definitions in [10]). NBS are thus cost-effective solutions that should provide social, economic, and environmental benefits. When considered together, these benefits are expectedly higher than costs, generating a net benefit.
To assess the costs and benefits of urban NBS projects, ES accounting is considered a suitable approach [7,11]. In this approach, the benefits derived from nature, which are typically positive externalities, can be internalised. However, ES assessment methods tend to be framed ad hoc, i.e., they are non-generalizable, which hampers their widespread application to inform NBS projects over multiple urban settings [12,13]. In addition, ES methods do not usually account for the negative environmental impacts produced by NBS (e.g., CO2 emissions from life cycle management actions) or for their associated negative externalities (i.e., expenditures resulting from environmental damages, for which a market does not exist) and other financial costs (e.g., tree planting material costs). To cover these gaps, some studies assessed the “disservices” associated with NBS [14,15,16], others the life cycle financial costs making use of life cycle costing (LCC) [17,18], and some others negative environmental impacts by applying life cycle assessment (LCA) [19,20,21,22,23]. Overall, those studies suggest that other flows, beyond ES, should be accounted for in order to plan, design, and manage cost-effective urban NBS. Such efforts should be accompanied by the development of generalizable assessment methods that are potentially applicable to a broad range of urban settings and NBS.
Several generalizable ES assessment methods were already developed in the form of ES modelling tools that can be used as decision support tools for NBS planning. Some of these tools (e.g., InVEST, LUCI) assess ES supply based on land use/cover classes [24,25,26,27] and mainly focus on large spatial levels and rural contexts. However, land use/cover classes do not offer baseline data to assess some types of urban ES, such as regulating services [13], and might not be adequate for the assessment of specific urban NBS interventions either. Attempts at modelling that focus on urban systems are thus being developed for some of those tools (e.g., urban cooling InVEST) by considering additional variables beyond land use/cover classes. A second group of ES modelling tools originally developed for rural systems, such as RothC [28], SWAT [29], and BIOME [30], although requiring a higher and more diversified number of inputs (e.g., leaf area index, tree species), are able to identify spatio-temporal changes in ES at a scale suitable for modelling urban ES flows. A third group of tools, e.g., i-Tree [31], ENVI-met [32], and SWMM [33], were developed to specifically assess urban ES flows, for which they consider detailed attributes of NBS and their surrounding urban contexts.
Despite their strengths, all these tools still suffer from one or more of the following drawbacks [13,34,35]: (i) time-consuming data collection; (ii) lack of monetisation of ES values; (iii) missing consideration of negative environmental impacts or ES demand; (iv) inability to perform the simultaneous modelling of multiple ES over time. More details about these limitations are provided in Supplementary Material (SM) 1.
To become operational, generalizable assessment methods for NBS should be integrated in urban planning and design workflows via new tools. These tools need to be user-friendly and should require a low computational/technical effort, facilitating access to targeted users (e.g., architects, landscape architects). Scholars identified that a strong reliance on high environmental modelling knowledge would hamper the use of environmental analysis by practitioners [36]. Those knowledge accessibility barriers could explain, in part, why environmental assessments are generally absent or conducted only at advanced project stages [37,38]. Nevertheless, as suggested in the MacLeamy curve (Figure 1), applying environmental assessments at early planning/design stages is more desirable than at advanced stages because time (and budget) effort is reduced and there is more room to influence functionality and performance [39,40]. In the case of urban NBS, complexity and knowledge uncertainty about their capacity to deliver net benefits, together with a lack of decision support tools suitable for practitioners, currently represent knowledge barriers for NBS implementation [41,42,43]. Hence, user-friendly, low computational, and practitioner-oriented decision support tools might encourage the integration of NBS assessment procedures at early planning/design stages.
This paper aimed to overcome the abovementioned limitations in urban NBS assessments. It strived for a more comprehensive assessment of net environmental and economic impacts of NBS over their entire life cycle through the development of a generalizable online prototype decision support tool. The decision support tool was named NBenefit$® and calculates negative and positive environmental impacts, externalities, and financial values of planned urban forests, as an example of relevant NBS. The software relies on an underpinning modelling framework that combines system dynamics, urban ecology, and life cycle thinking methods, allowing it to go beyond the mere quantification of ES flows. Moreover, NBenefit$ can be easily integrated in urban planning and design workflows because it was conceived as a user-friendly tool with low computational requirements and can inform urban NBS decisions at early planning and design stages. The SM2 includes access details to an online demo of NBenefit$.
The next section conceptualises NBenefit$ and its framework and describes its design, building, and operation for urban forests. Section 3 illustrates the value of NBenefit$ via two simple urban forest examples. Section 4 discusses the current limitations and advantages of the tool and anticipates future work.

2. Methods: NBenefit$ from Concept to Online Decision Support Tool

NBenefit$ conceptualises and models urban forests as pre-calculated archetypes. Archetypes represent the combination of abiotic (e.g., soil texture, climate), biotic (e.g., plant species), and management (e.g., irrigation) attributes that influence spatio-temporal variations of an NBS. The environmental and economic performance of the archetypes is pre-calculated, making use of an underpinning modelling framework and a specific urban forest model derived from it.
This framework was developed at two modelling levels: foreground and background. The foreground is based on a system dynamics model that computes the externalities occurring in the sole “use” phase of the NBS life cycle, i.e., from NBS implementation on site until the solution remains operational. The background is based on a steady state model that accounts for externalities and financials costs all along the life cycle phases: “implementation”, “use”, and “end-of-life”. The NBS implementation phase extends from raw material extraction (e.g., minerals for fertilisers) until the delivery of seeds or plants to the NBS site, whereas the end-of-life phase spans from the management and collection of dead components (e.g., leaf litter, dead branches or trees) up to waste treatment. From this modelling framework, specific foreground models can be developed for each NBS type (e.g., urban forest, green roof, urban wetland). So far, only an urban forest model has been created for NBenefit$ using Simile, i.e., a visual declarative modelling software [45]. Section 2.2 provides an overview of the calculations performed for the urban forest model. Further details are included in the SM3, and a full description of the modelling framework and the urban forest model is provided in [46].
The development of NBenefit$ was split into three steps: the design step, the building step, and the operation step (Figure 2). The design step covers the selection of benefit and cost items, and the definition of archetypes for each NBS type. The building step corresponds to the creation of the specific NBS-type model, the NBenefit$ platform, and the pre-calculation of archetypes. The operation step defines the interaction of built environment professionals (users) with the platform.

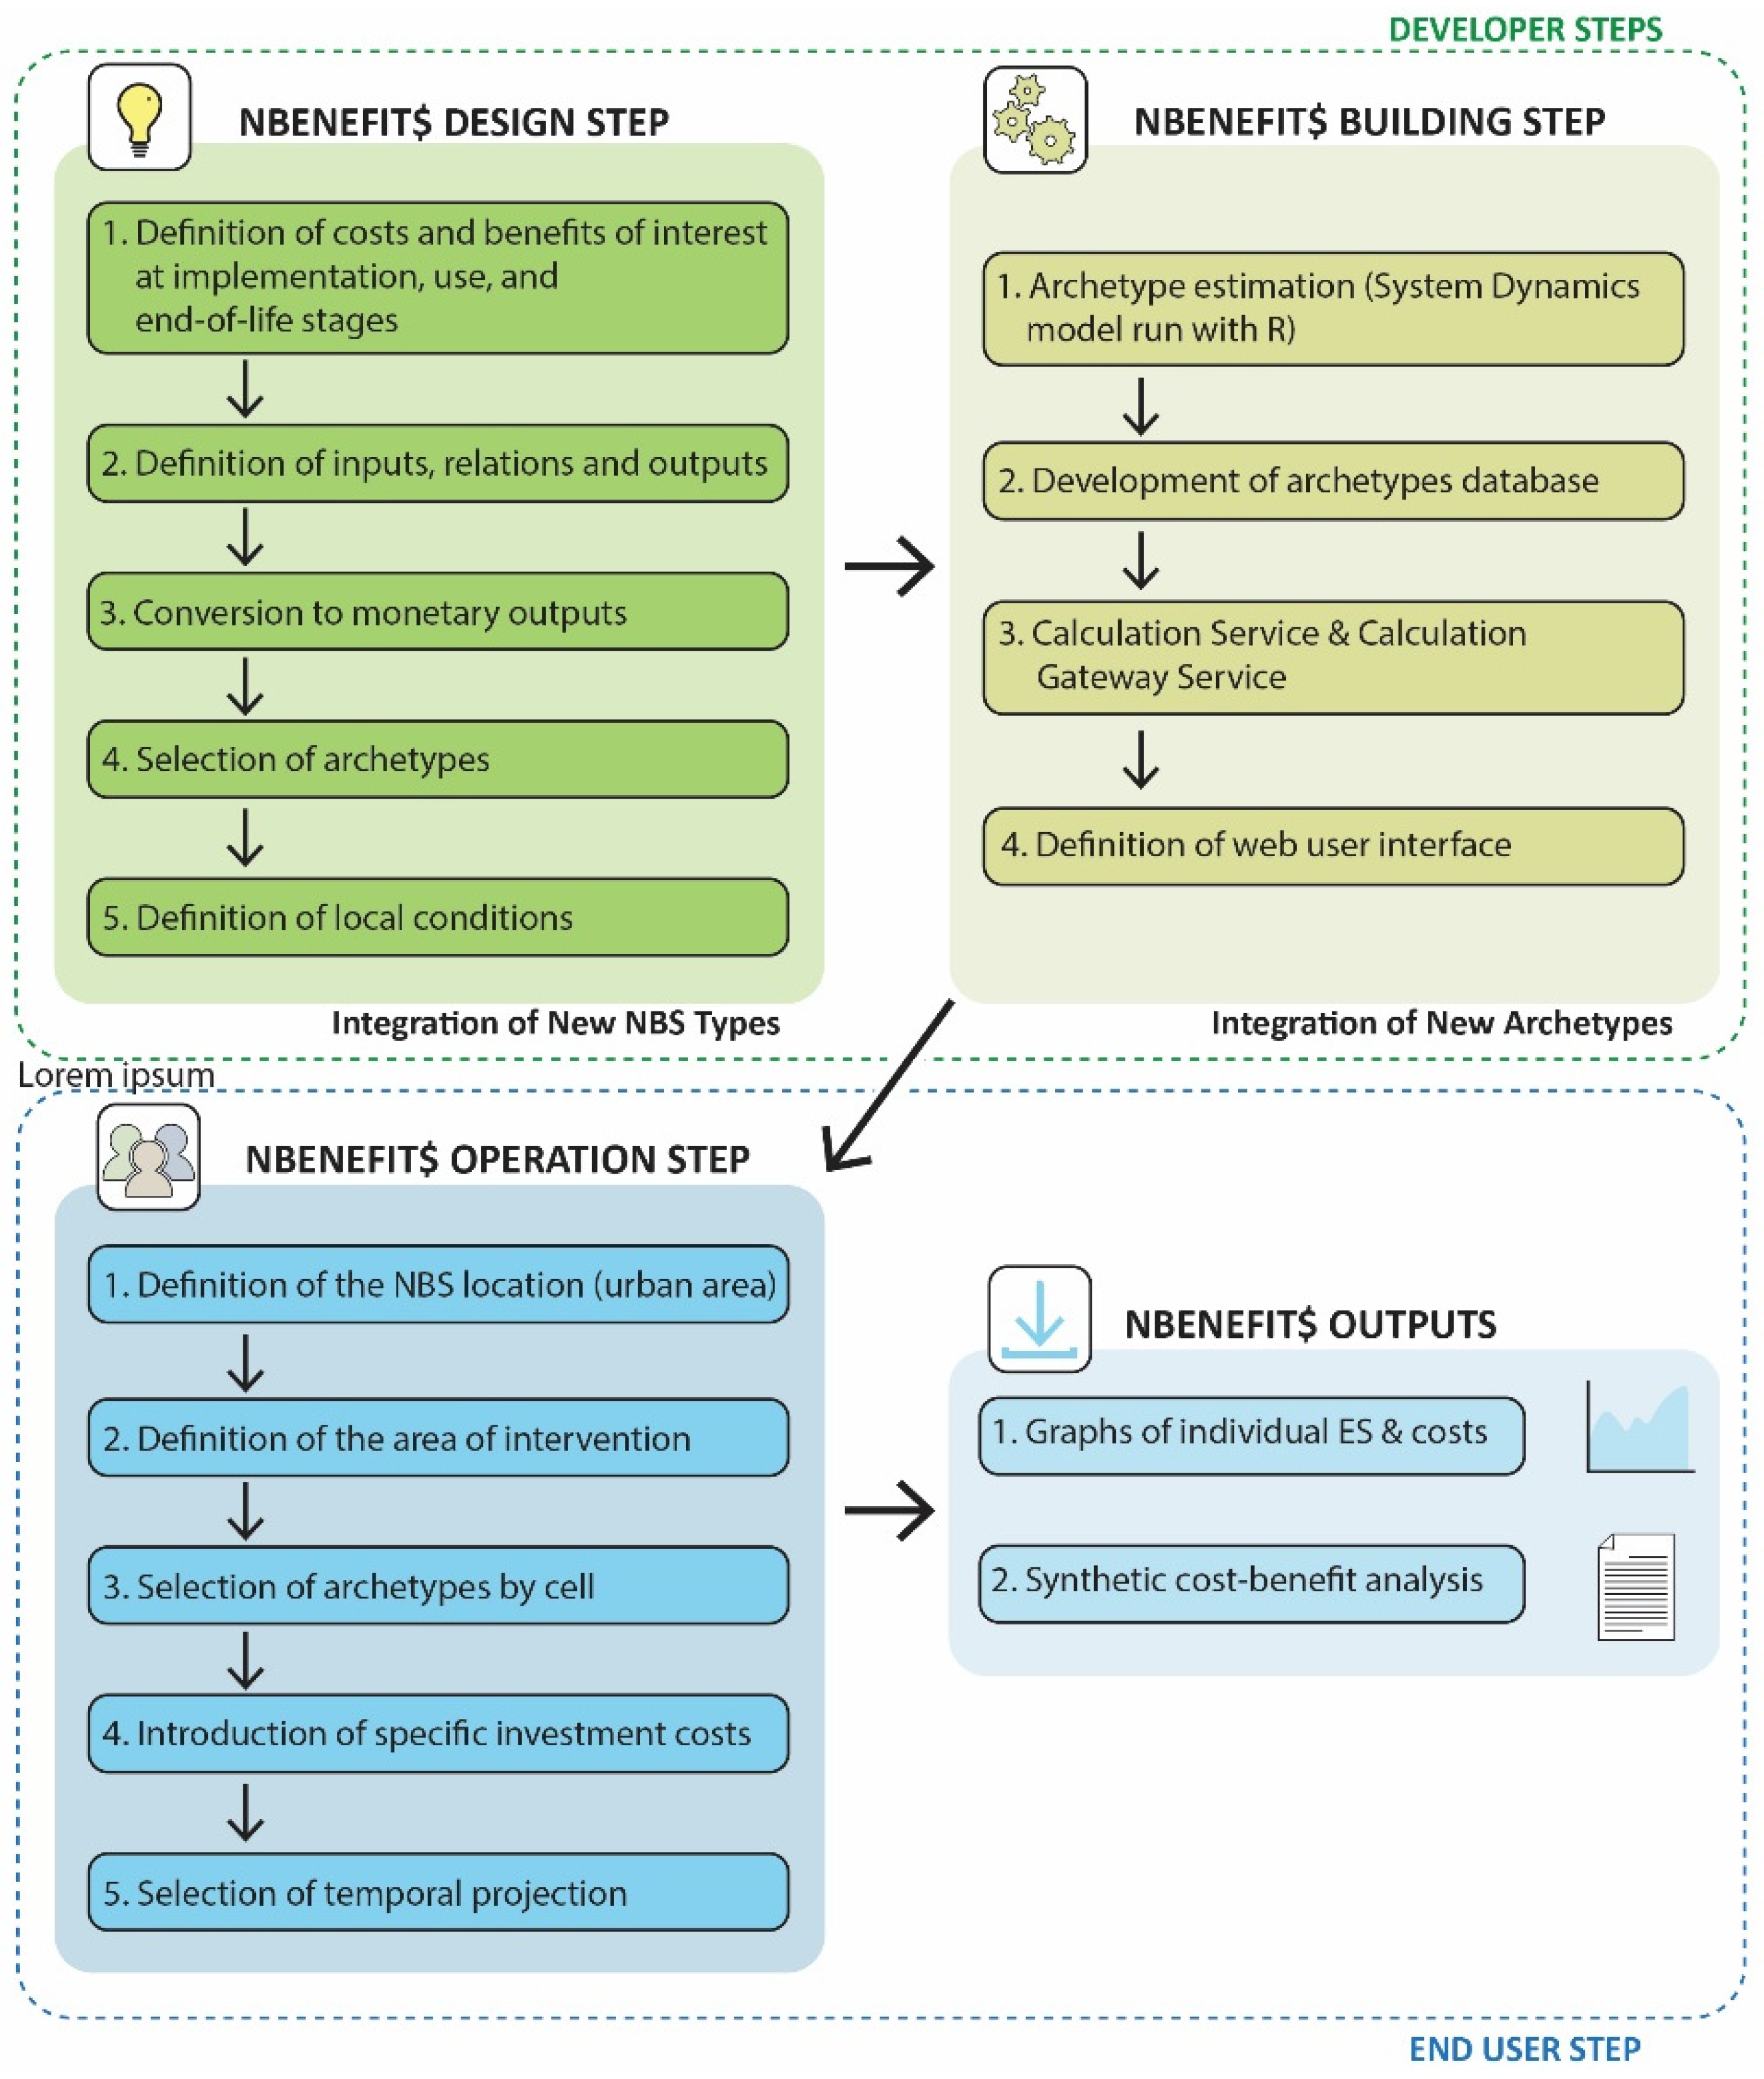
2.1. NBenefit$ Design Step

In the first step, the NBS type of interest is identified together with the relevant positive and negative environmental impacts, externalities, and financial values in each NBS life cycle phase (implementation, use, and end-of-life). NBS costs comprise negative externalities (i.e., the monetisation of detrimental environmental impacts) and financial expenditures (e.g., payment for plants or management actions). NBS benefits include positive externalities (mainly the monetization of ES flows, not representing real cash flows) and financial revenues (e.g., from selling wood or timber, whose generation is also an ES flow).
In the second step, the relevant socio-ecological processes, human actions, and NBS attributes affecting environmental impacts, externalities, and financial values are identified. Table 1 summarises the actions and ES from which costs and benefits are derived in the current prototype of NBenefit$. It also indicates the life cycle phases in which these costs and benefits occur, the socio-ecological processes modelled to calculate them, and the main attributes influencing those processes. Those attributes become inputs in the urban forest model and the NBenefit$ platform. Figure 3 summarises the biophysical indicators used to represent positive and negative environmental impacts in biophysical units. It also indicates for which categories positive and negative impacts are equivalent but inverse in value. For example, Global Warming Potential, calculated by accounting for CO2-equivalent emissions, and Regulation of the chemical condition of the atmosphere, calculated by accounting for the mass of biogenic CO2 storage, are equivalent impact indicators for which a net gain (benefit) or loss (cost) can be estimated from their difference.
In the third step, positive and negative environmental impacts are monetised to calculate externalities by making use of value transfer methods. These methods rely on monetary values from other studies that are initially obtained through primary valuation methods. Values are then transferred and adapted to new case studies for which conditions are considered equivalent. Value transfer is common practice in ES monetary valuation (e.g., [47,48,49]). Moreover, a number of platforms and inventories/databases collect economic values on ES and life cycle assessment (LCA) to provide data for value transfer (e.g., [50,51,52]).
For the current prototype of NBenefit$, monetary estimations of negative externalities are mainly obtained from a handbook of environmental prices valuable for the European Union [50]. For positive externalities, values from the same handbook [50] are complemented with those obtained in a review of monetary ES valuation provided by NBS [53]. Ultimately, specific literature is used to cover the gap of values not disclosed by those two sources. Values that are transferred are corrected for the purchasing power parity, inflation, and the income effect [53,54,55]. Current monetary values used in NBenefit$ are summarised in SM4.
In the fourth step, the archetypes for an NBS type are defined at different levels of detail to meet the needs of different planning/design stages in NBenefit$ (Table 2).
At early planning/design stages, e.g., strategic definition and concept design (see [56] for an example of design stages), archetypes are similar to land cover classes, such as deciduous forests (First and Second levels in Table 2). This level of definition of the archetypes is coherent with data availability on site condition and with how professionals plan/design NBS in early stages, i.e., mainly as zoning diagrams equivalent to land-use/cover maps.
Table 2. Levels of aggregation of archetypes according to tree species attribute. The first and second levels correspond to a combination of several species (disaggregated archetypes) and represent land use/cover classes.
Early Planning/Design StagesIntermediate and Advanced Planning/Design Stages
Second Level Archetypes ***First Level Archetypes **Disaggregated Archetypes *
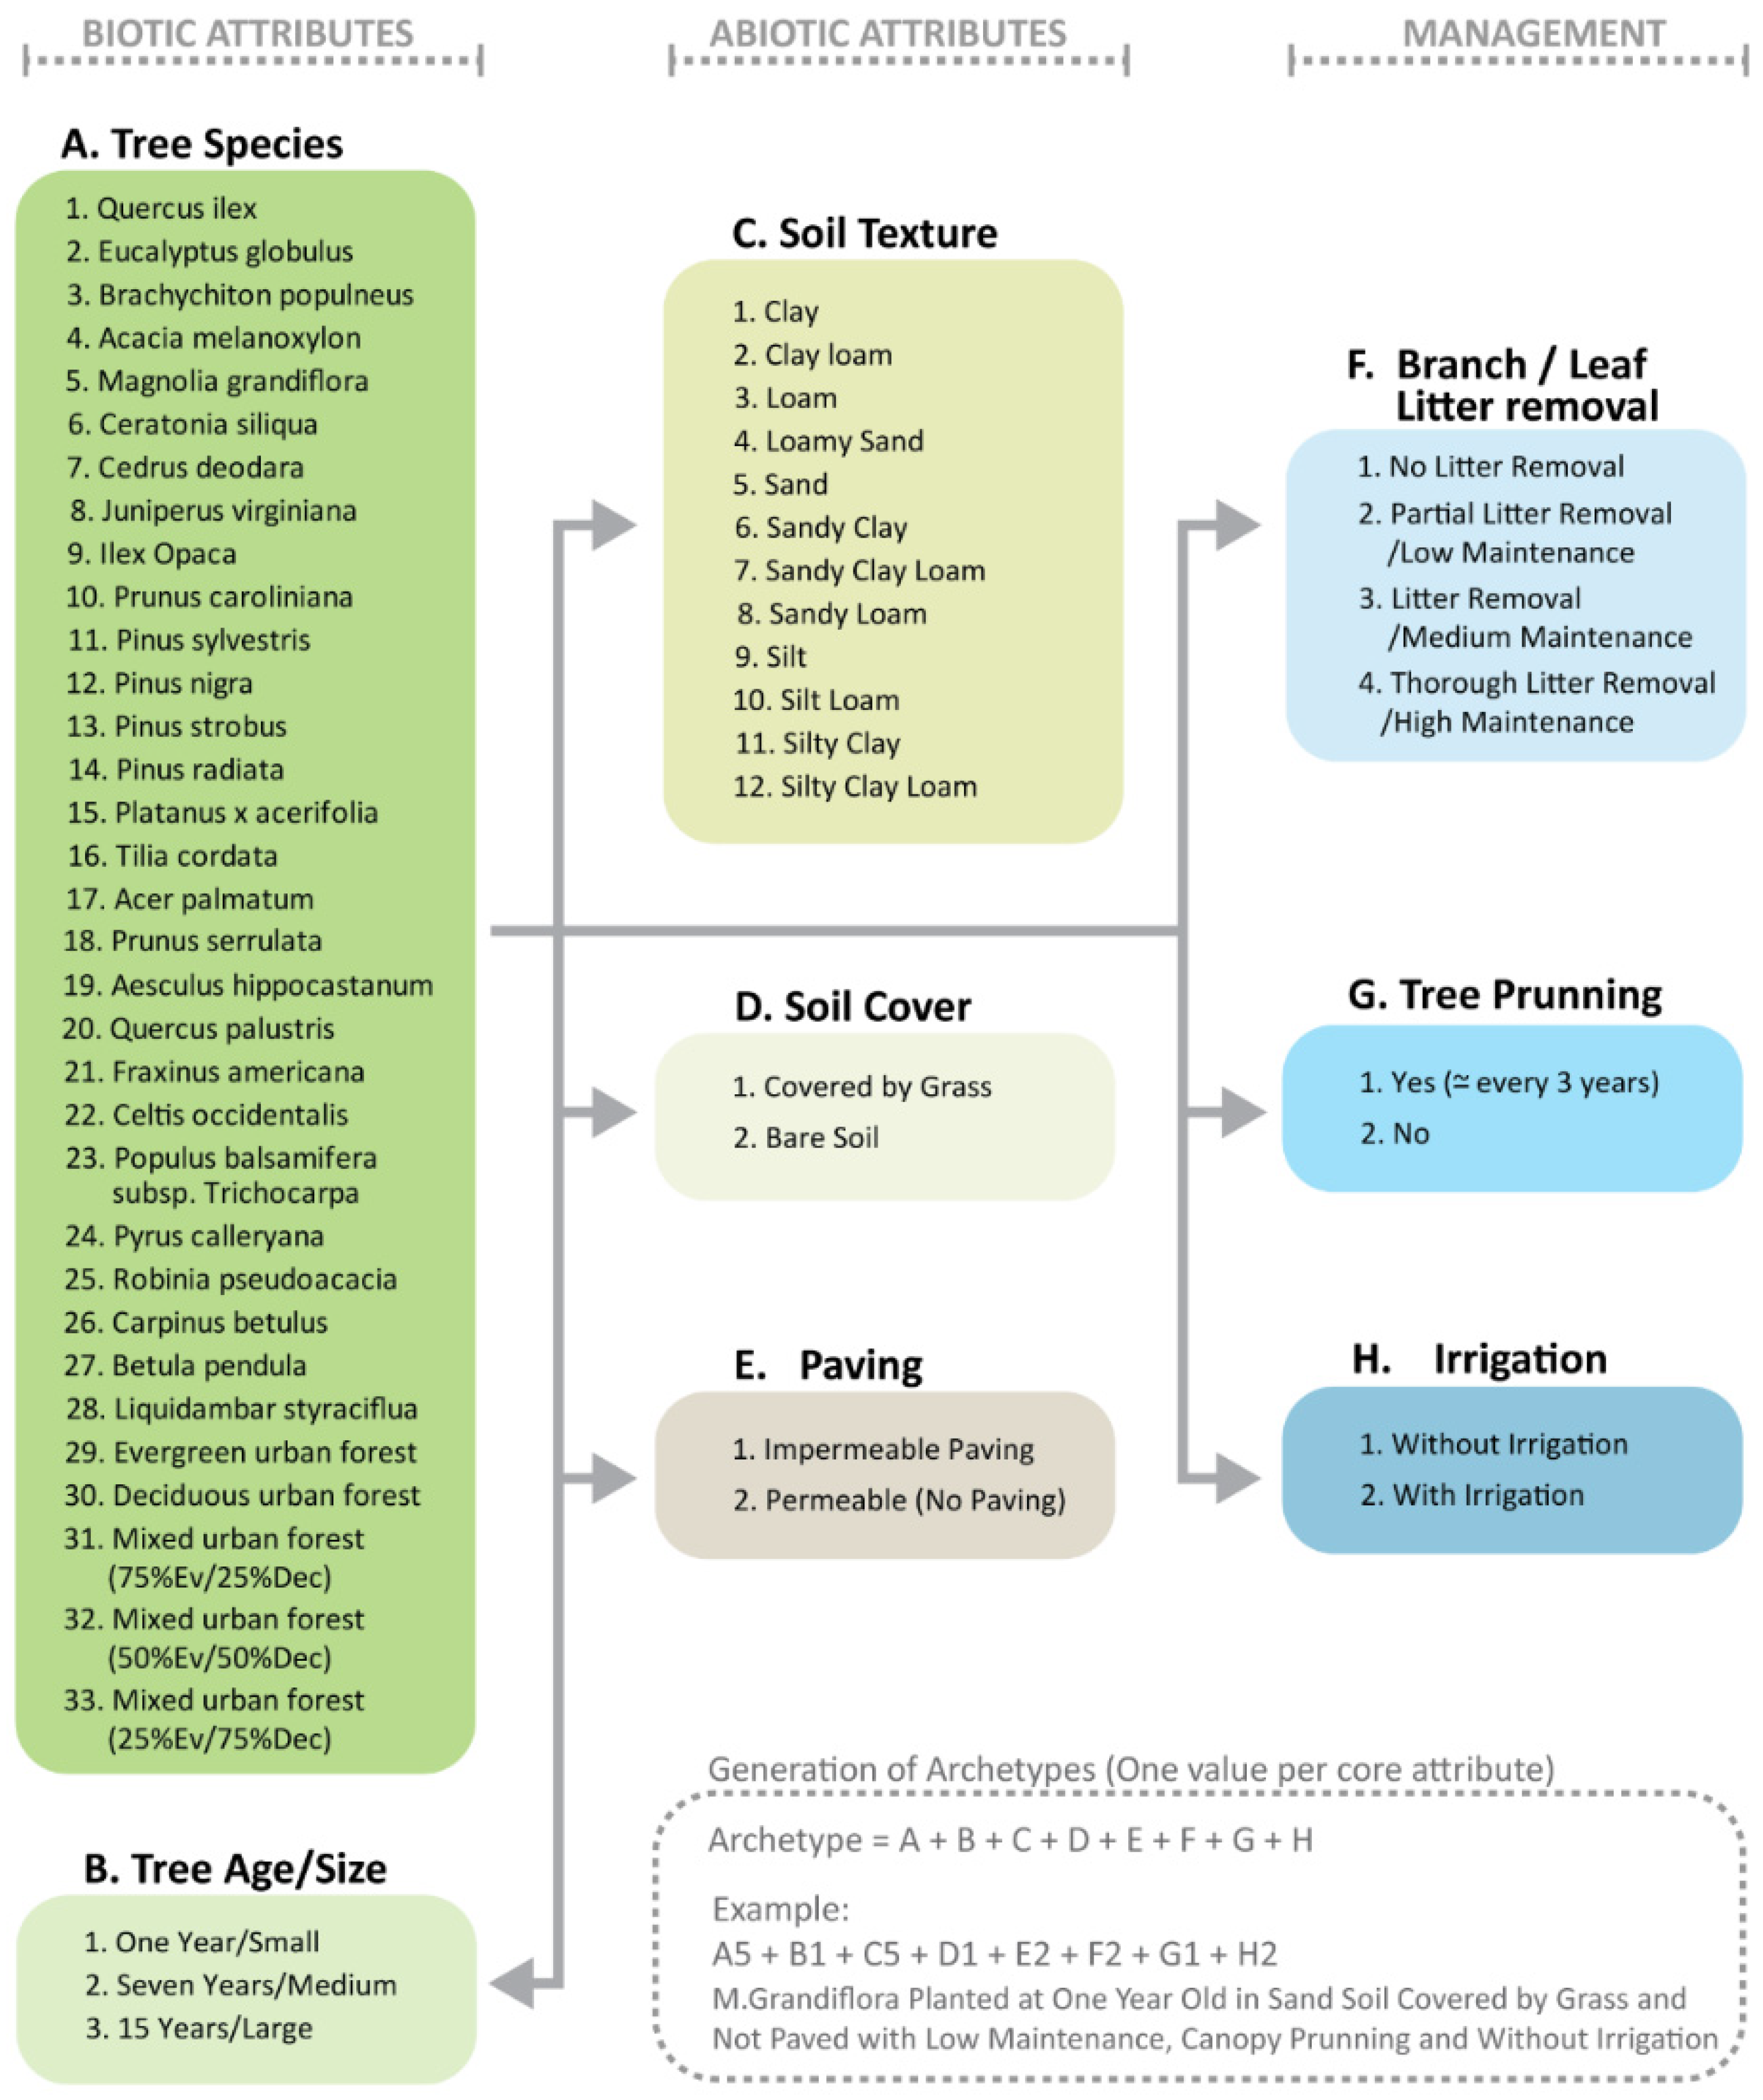
Mixed urban forest
(75% evergreen/25% deciduous)
Evergreen urban forestQuercus ilex
Eucaliptus globulus
Brachychiton populneum
Acacia melanoxylon
Magnolia grandiflora
Ceratonia siliqua
Cedrus deodara
Juniperus virginiana
Ilex Opaca
Prunus caroliniana
Mixed urban forest
(50% evergreen/50% deciduous)
Pinus sylvestris
Pinus nigra
Pinus strobus
Pinus radiata
Deciduous urban forestPlatanus acerifolia
Tilia cordata
Acer palmatum
Prunus serrulata
Aesculus hippocastanum
Mixed urban forest
(25% evergreen/75% deciduous)
Quercus palustris
Fraxinus americana
Celtis occidentalis
Populus balsamifera subsp. Trichocarpa
Pyrus calleryana ‘Bradford’
Robinia pseudoacacia
Carpinus betulus ‘fastigiata’
Betula pendula
Liquidambar styraciflua
Notes: * Disaggregated archetypes are perennial and deciduous species extensively used in European urban areas, for which there are available allometric equations. Species were selected with the support of French experts on plants and landscape design, making use of a 2007 French street tree census [57] and a compilation of species from 81 nursery catalogues and collections (including botanical gardens). ** First level aggregated archetypes are made by the equal combination of disaggregated archetypes split by evergreen and deciduous. *** Second level aggregated archetypes are made by the combination of evergreen and deciduous First level archetypes.
For intermediate and advanced stages, NBenefit$ offers urban forest archetypes differentiated for vegetation species, plant size/age at planting, soil texture, and management actions. This is to align with the high granularity of data (e.g., tree species, size of trees to be planted, management actions) needed for the design stages. It is also coherent with what professionals expect from decision support tools, i.e., to compare alternatives in a detailed manner and to capture changes in benefits and costs when specific abiotic, biotic, or management attributes are modified in an NBS project.
For urban forests, Figure 4 presents the configuration of biotic, abiotic, and management attributes (and their potential combination) currently available in NBenefit$.
The last operation in the design step of NBenefit$ is the definition of the local context, which focuses on meteorological conditions (i.e., temperature, wind speed, and precipitation) and air quality (i.e., concentration of CO, SO2, NO2, O3, and PM10). The system dynamics model underpinning NBenefit$ includes a weather and air pollutant ambient levels generator, which provides those variables at a daily level and allows for the modelling of socio-ecological processes. The generator provides daily values inside a realistic range to keep accuracy at a monthly level without disregarding the seasonal variations.

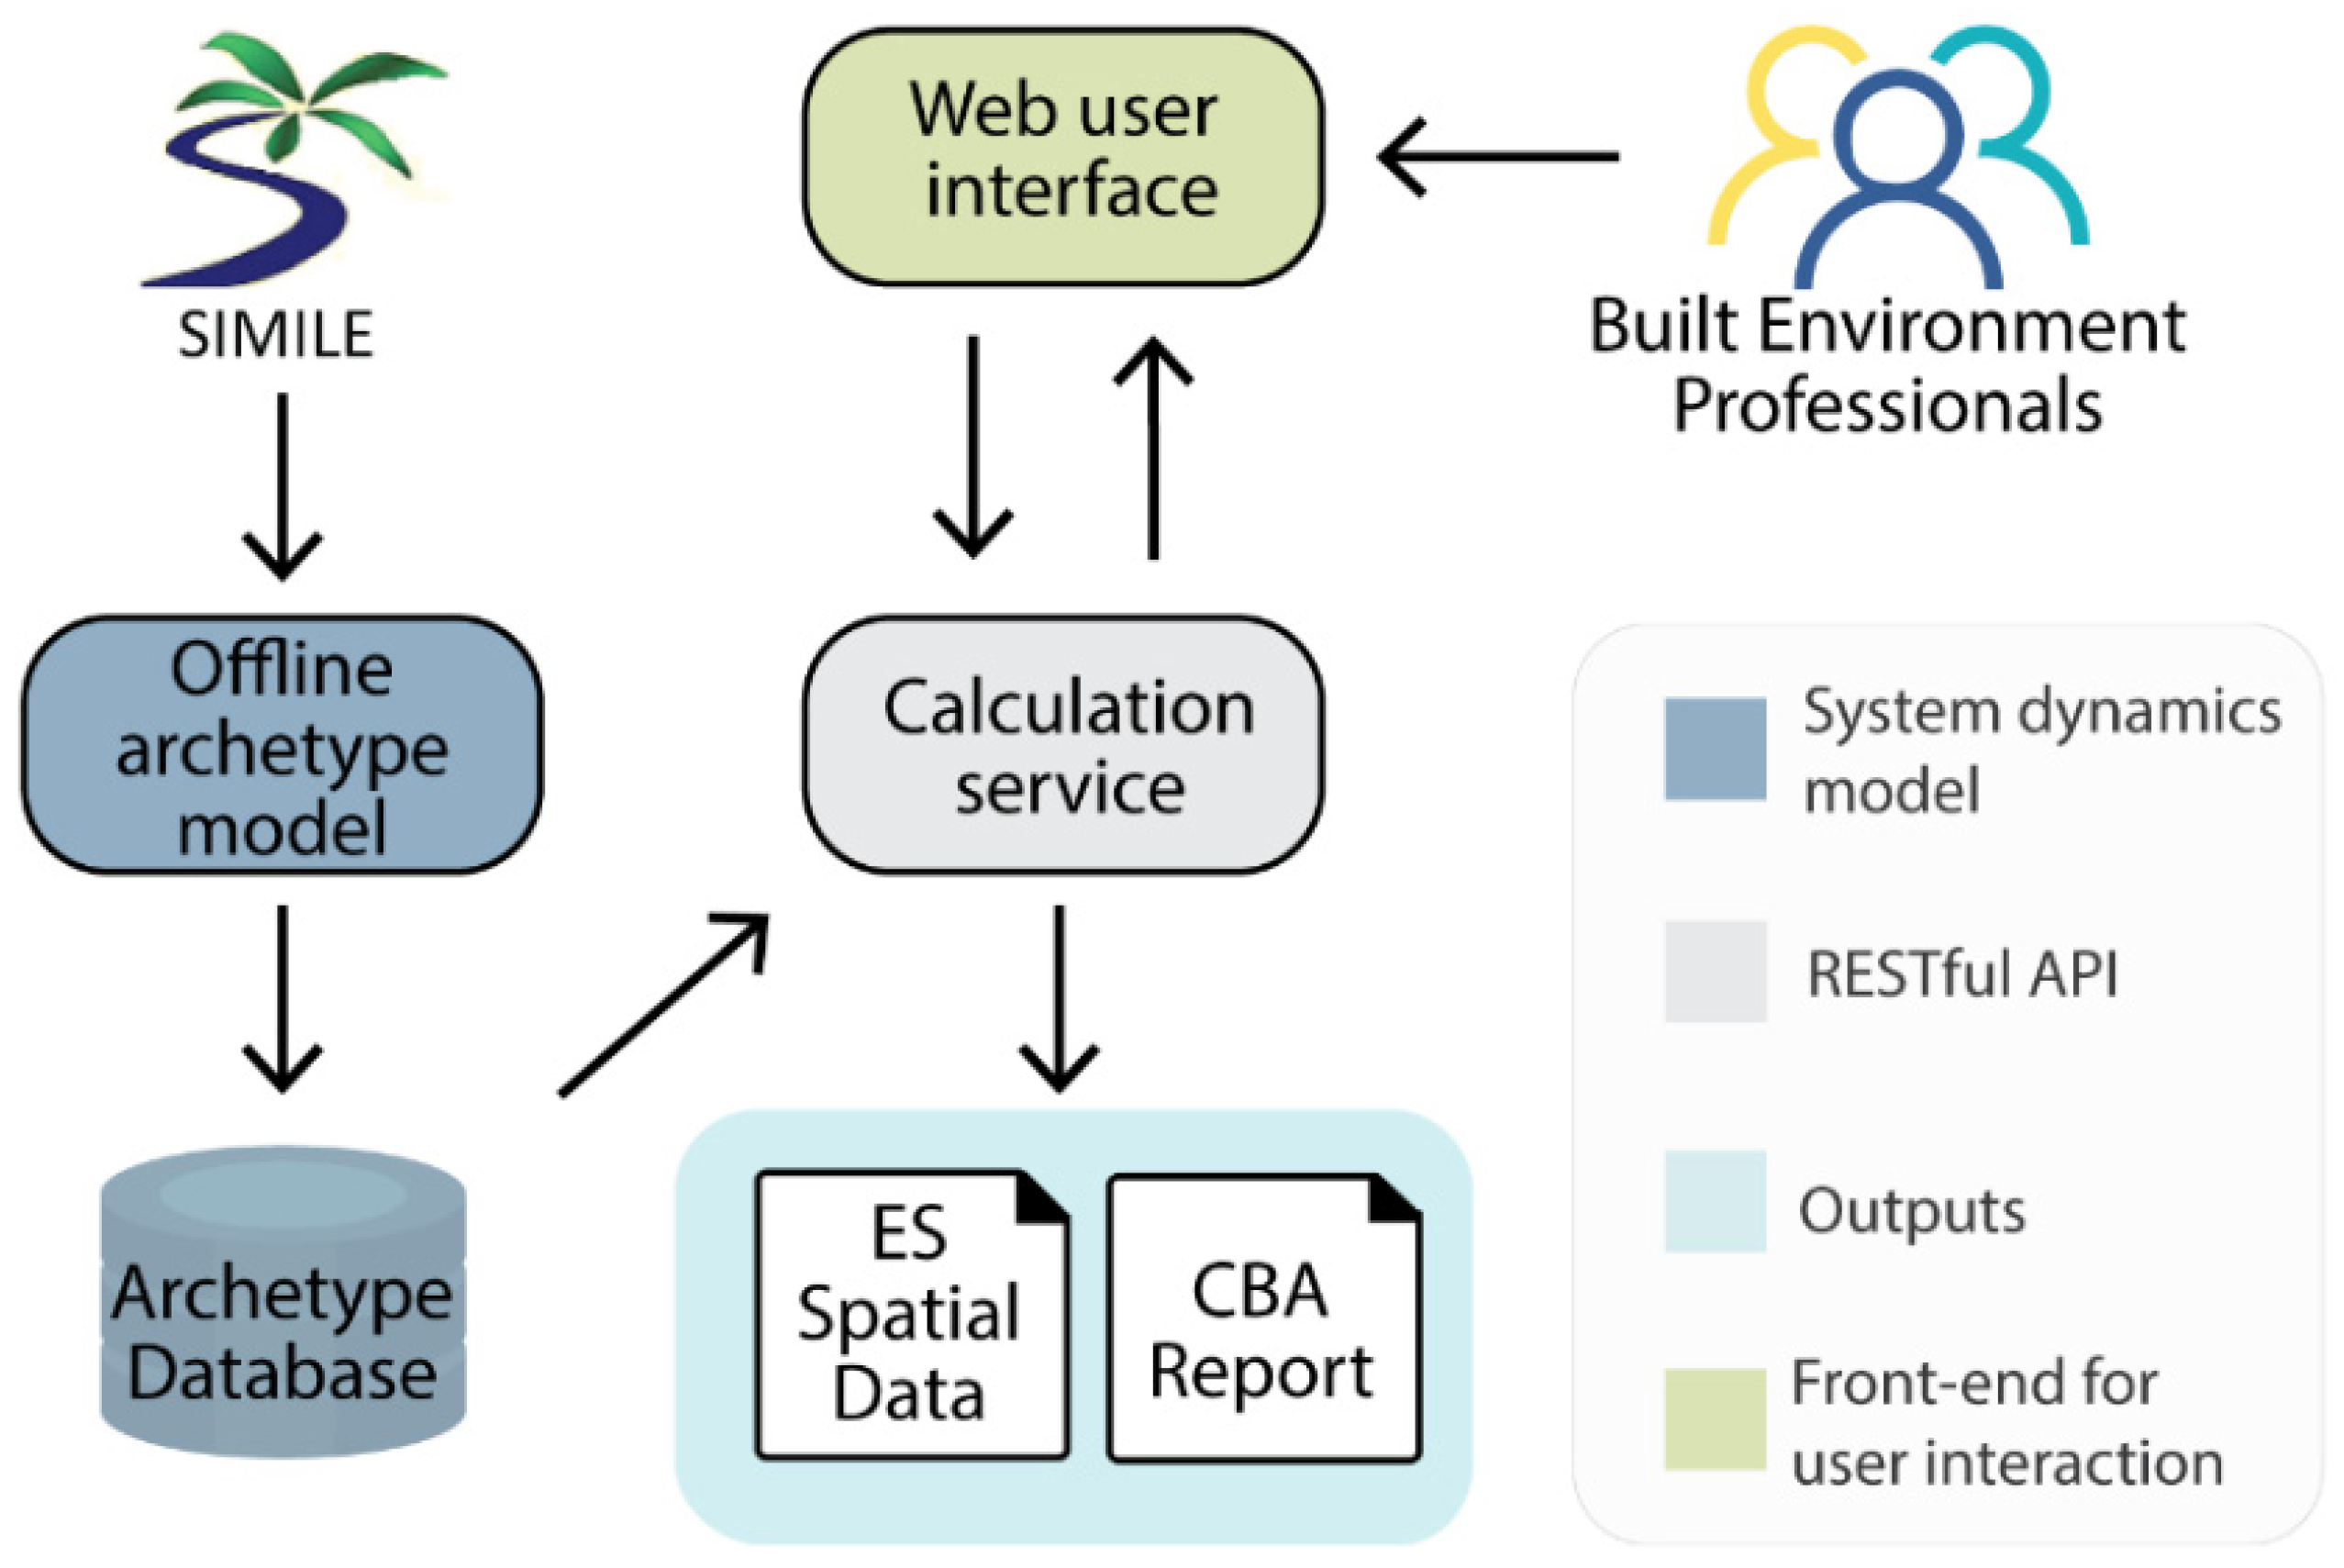
2.2. NBenefit$ Building Step

In this step, the modelling of archetypes per NBS type are related to the web user interface by making use of four core components: offline archetype model, archetype database, calculation service, and web user interface (Figure 5).

2.2.1. Offline Archetype Model and Archetype Database

In the offline archetype model, the urban forest archetypes defined in the design step are pre-calculated. First, their environmental performance (i.e., supplied ES and applied management actions) during the NBS life cycle operational phase is estimated in biophysical units. Such a performance is calculated using the system dynamics model for urban forests (the foreground level) built in Simile, which is compiled and run via the open statistical software R [58]. Outputs are calculated at daily and monthly temporal resolutions and then aggregated into yearly time steps. Yearly aggregations are used because the scope of NBenefit$ is to inform about the performance of NBS over their entire life cycle. However, modelling at a detailed temporal resolution is necessary because most of the socio-ecological processes are scale-sensitive due to their non-linearity (e.g., water infiltration, transpiration). Otherwise, the model would fail to account for dynamics (e.g., soil water balance) that occur at a much shorter time scale than years [59].
Due to the stochasticity of some ecological processes in the system dynamic model (e.g., rainfall, tree mortality, replanting), several simulations are run to obtain representative estimates of the archetypes (i.e., the mean and standard deviation of each output are representative of the range of potential values). To achieve a satisfactory number of replications, successive differences in the yearly mean and standard deviation for all the outputs are analysed for each additional replication [60] (see SM5 and SM6 for details about this analysis).
Once the performance of an urban forest archetype is calculated for the operational phase, its inputs (main abiotic, biotic, and management attributes) and part of the outputs from the system dynamics model are used to characterise the negative environmental impacts generated in all phases of the NBS life cycle. These impacts are assessed in the background level (steady state model), applying a life cycle impact assessment (LCIA) approach [61] with the support of the LCA software SimaPro, making use of the ReCiPe 2016 method at mid-point level [62]. To characterise midpoint level impacts, substance flows that have the potential to contribute to the same environmental effect are grouped in single impact categories (e.g., eutrophication, climate change). Such an operation of aggregation is similar to the quantification of positive environmental effects that occur in the ES biophysical assessment.
Once the negative and positive environmental impacts (i.e., ES classes and life cycle impact categories) are calculated in biophysical units for all the life cycle phases, their values are monetised (i.e., estimation of externalities) and stored in the archetype database. Lower and upper monetary values are also computed to provide the level of uncertainty in the monetisation of each environmental impact. The lower and upper boundaries depend on two factors: (i) on the range of values found in different source studies computing the total economic value of a specific ES; (ii) on the standard deviation of each type of environmental impact (in biophysical units) modelled. This helps to showcase that monetary values should be understood as indicative ranges and not as exact outputs and to show how the variability (uncertainty) from the environmental assessment propagates in the calculation of externality values.
On top of the externality values, the financial values (representing expected cash flows related to the NBS project) are added based on publicly available national cost databases and local datasets on expenses. Similarly, for financial values, central, lower, and upper monetary values are also provided. Accordingly, the valuation of economic impacts combining externality and financial values provides a better understanding of the net economic value of an NBS archetype (by year and for its entire life cycle).
Once all environmental impacts, externalities, and financial values are calculated for an archetype, values are stored in the archetype database of NBenefit$. End users of NBenefit$ do not need to re-calculate archetypes, as it is a time-consuming task on the side of the NBenefit$ developers. In this sense, the archetype database acts as a repository of disaggregated values for all the pre-calculated archetypes. The database is linked to the web user interface through a RESTful API, i.e., the calculation service (Figure 5).

2.2.2. Calculation Service

The calculation service is a RESTful API written in Python language, in which all the environmental impacts, financial values, and externality values for a specific urban forest intervention are produced. Once the combination of different archetypes for a specific urban forest intervention is defined in the web user interface, the calculation service obtains the disaggregated values and calculates the overall balance of environmental impacts and monetary values (financial and externality) for the specific intervention.

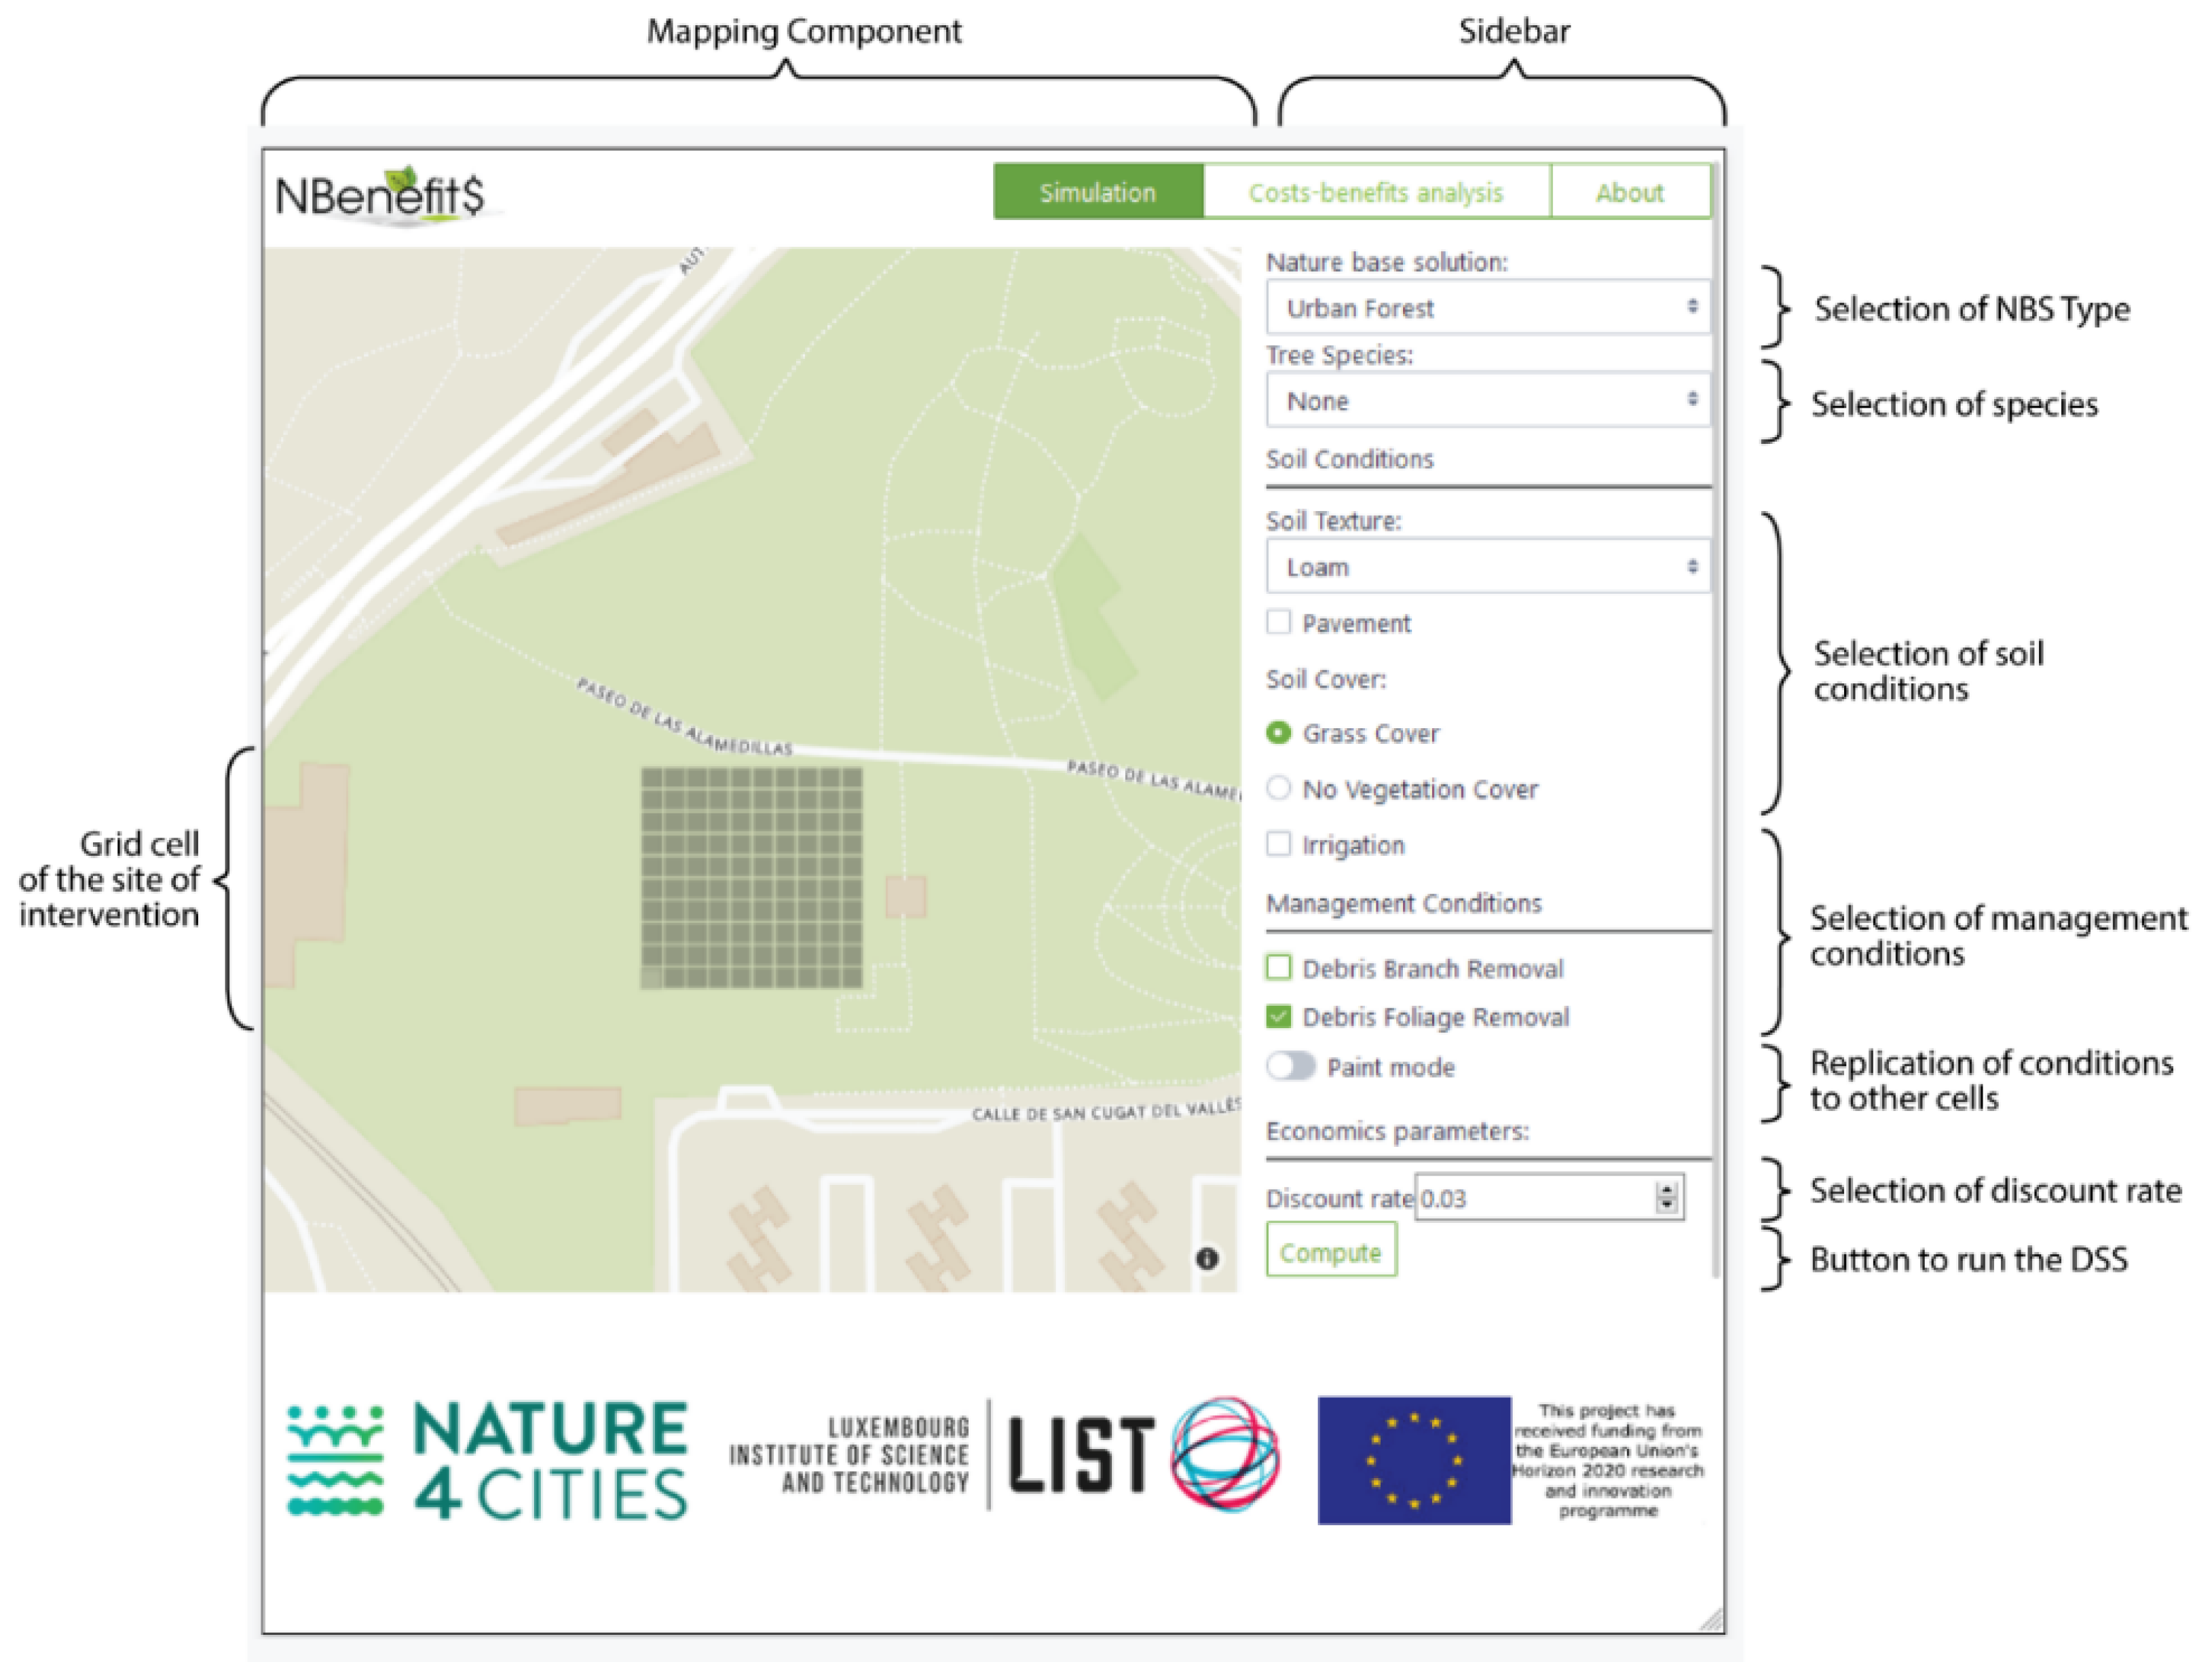
2.2.3. Web User Interface

The web user interface is split into two sections: the mapping component and the sidebar (Figure 6). The mapping component is presented as a window that embeds an Openstreet map. It also holds the cell grid. The sidebar helps the user to introduce the different NBS types (urban forest in this research) and archetypes applied to each cell in the grid. It also contains the button to run the decision support tool.

2.3. NBenefit$ Operation Step

This step allows for the user to define location, area of the project, and archetypes of the planned urban forest to be evaluated by NBenefit$. The mapping component can be used to identify the specific urban area and site where the urban forest project will be located. Locations are associated with the parametrisation of meteorological conditions. Once the site of intervention is identified in the mapping component, the main biotic, abiotic, and management attributes of the urban forest can be defined, and their combination automatically calls the pre-calculated archetypes to be retrieved for the NBS assessment.
The sidebar provides qualitative options for each attribute (those presented in Figure 4). Attributes can be input cell by cell, since some attributes, e.g., tree species and their upstream archetypes, may change over space in a same project. This means that NBenefit$ allows multiple combinations of archetypes to ensure its applicability to complex urban forest projects. A discount rate can also be applied to future costs and benefits if needed. Once the inputs are set for each cell, the simulation can start by clicking on “Compute”. This action sends the data from the web application to the calculation service, where they are processed.

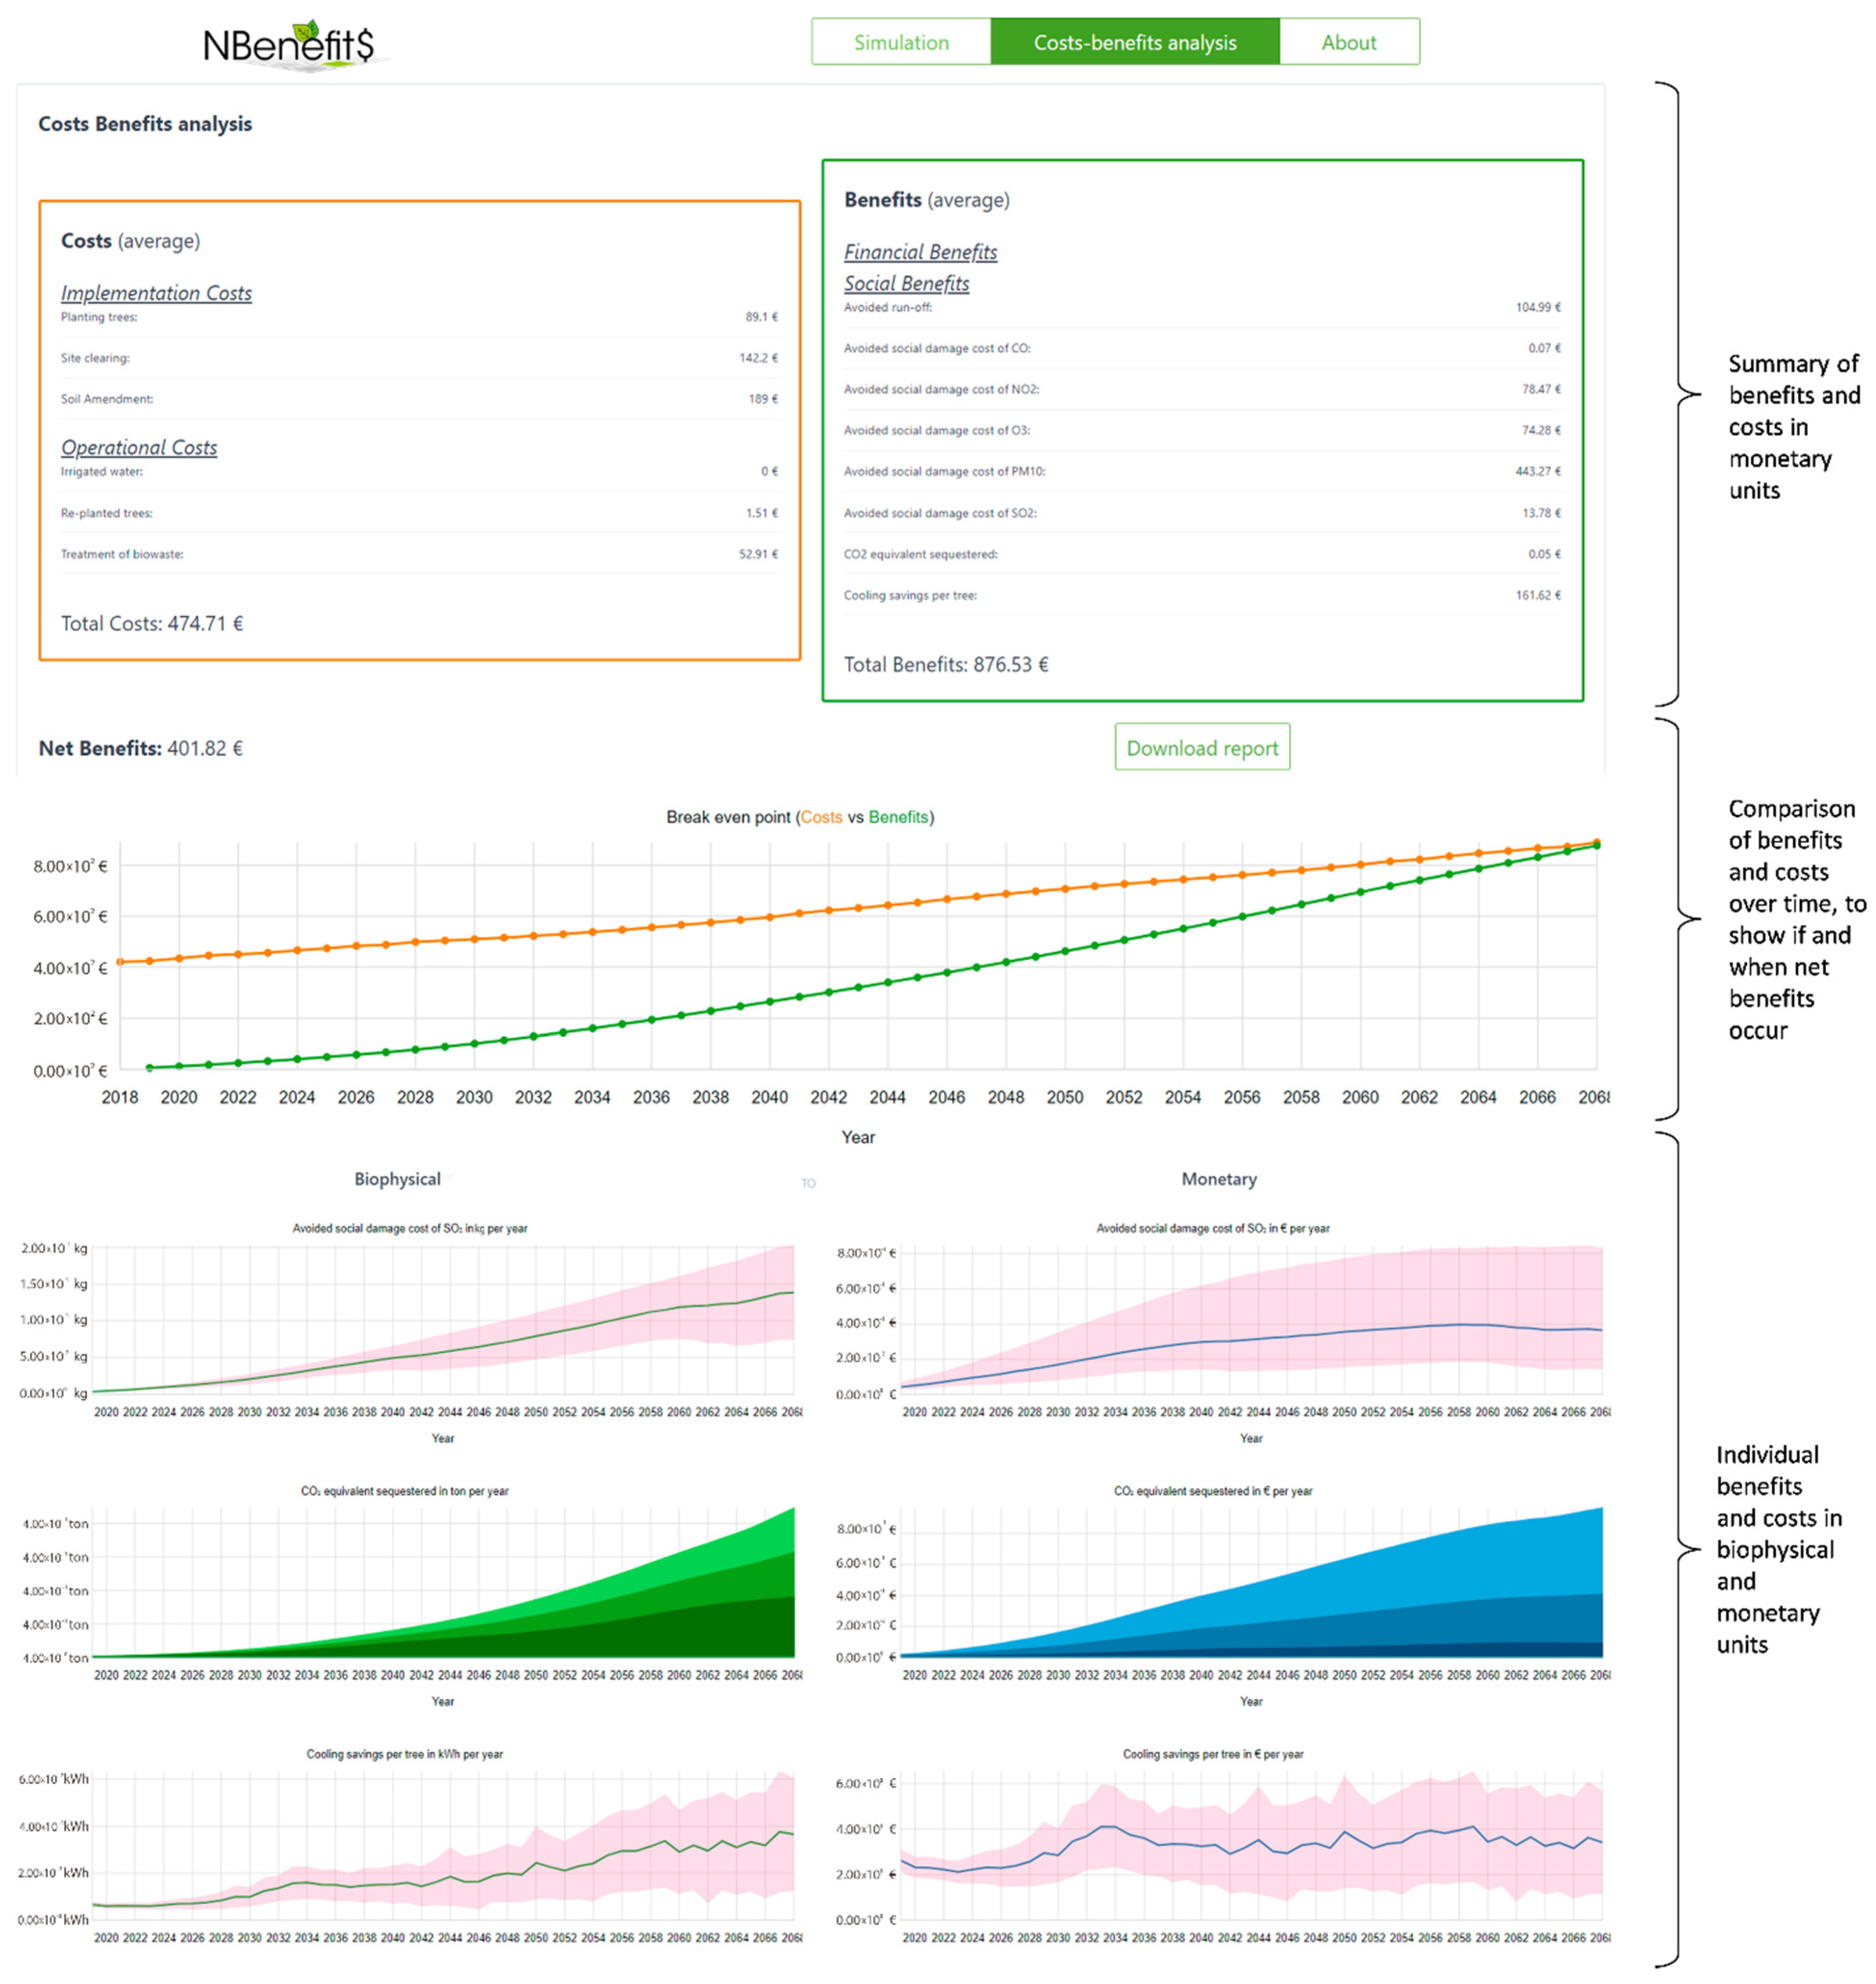
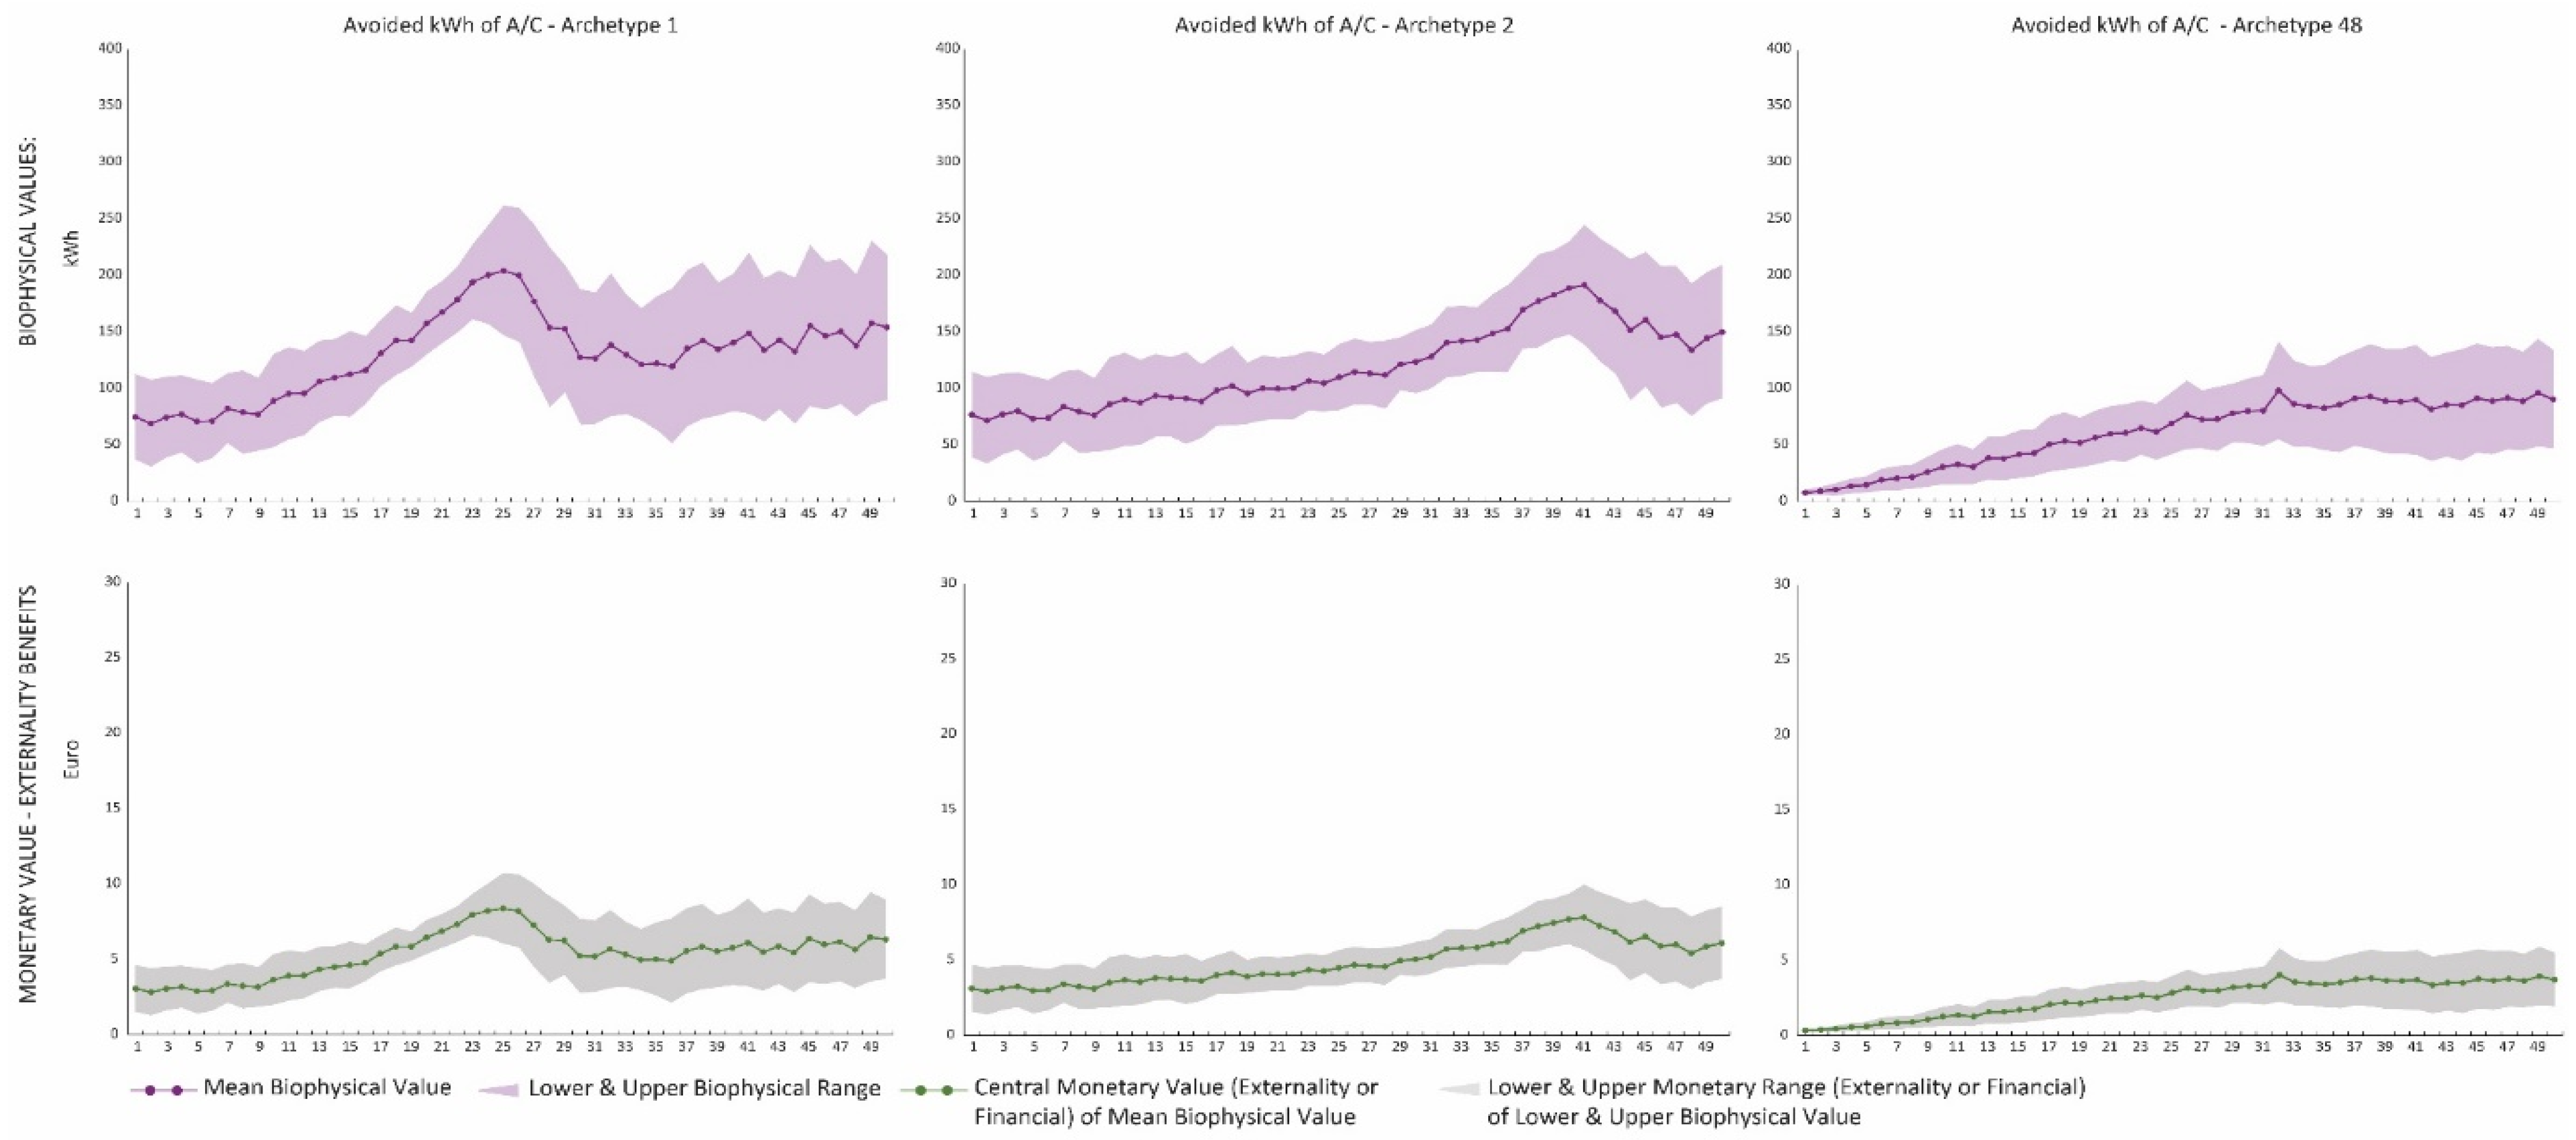
2.4. NBenefit$ Outputs

NBenefit$ provides two main types of outcomes: (1) a graph of the evolution of each environmental impact (in biophysical units), externality, and financial value (in monetary units) over time (Figure 7); and (2) a simplified cost-benefit analysis for the entire life cycle of the specific NBS intervention.
This second output is also provided as a downloadable report in PDF format that includes a balance of positive and negative environmental impacts and the cost-benefit analysis of financial and externality values. For the balance of positive and negative environmental impacts, the outputs are provided by process/activity per life cycle stage (e.g., pruning) and as an aggregated total for the entire life cycle. The outputs are also shown as bar charts. The average value by impact category for an evaluated alternative (i.e., sum of all cell values divided by number of cell) is compared against a reference value. This comparison is intended to inform on the magnitude of the impacts associated with the NBS, and thus, to allow for an immediate understanding by non-experts (see for instance Figure 15). The environmental reference used is the impact of an average person in the world for the year 2010 (values are provided in SM7). Alternative environmental references for the normalisation of graphical outputs may also be applied in the decision support tool if considered more suitable for a specific project.
In the case of cost-benefit analysis, outputs are provided by process/activity per type of cost and benefit (externality or financial) as well as a net value for the entire life cycle of the planned NBS in both tabular and graphic format. By default, the graphical format of the results is normalised, making use of the total value of the alternative with the highest net benefits as a reference value (see for instance Figure 16). The selection of a reference value intends to provide an easy comparison of total and disaggregated outputs. As in the case of the environmental assessment, the reference can be replaced by other options.

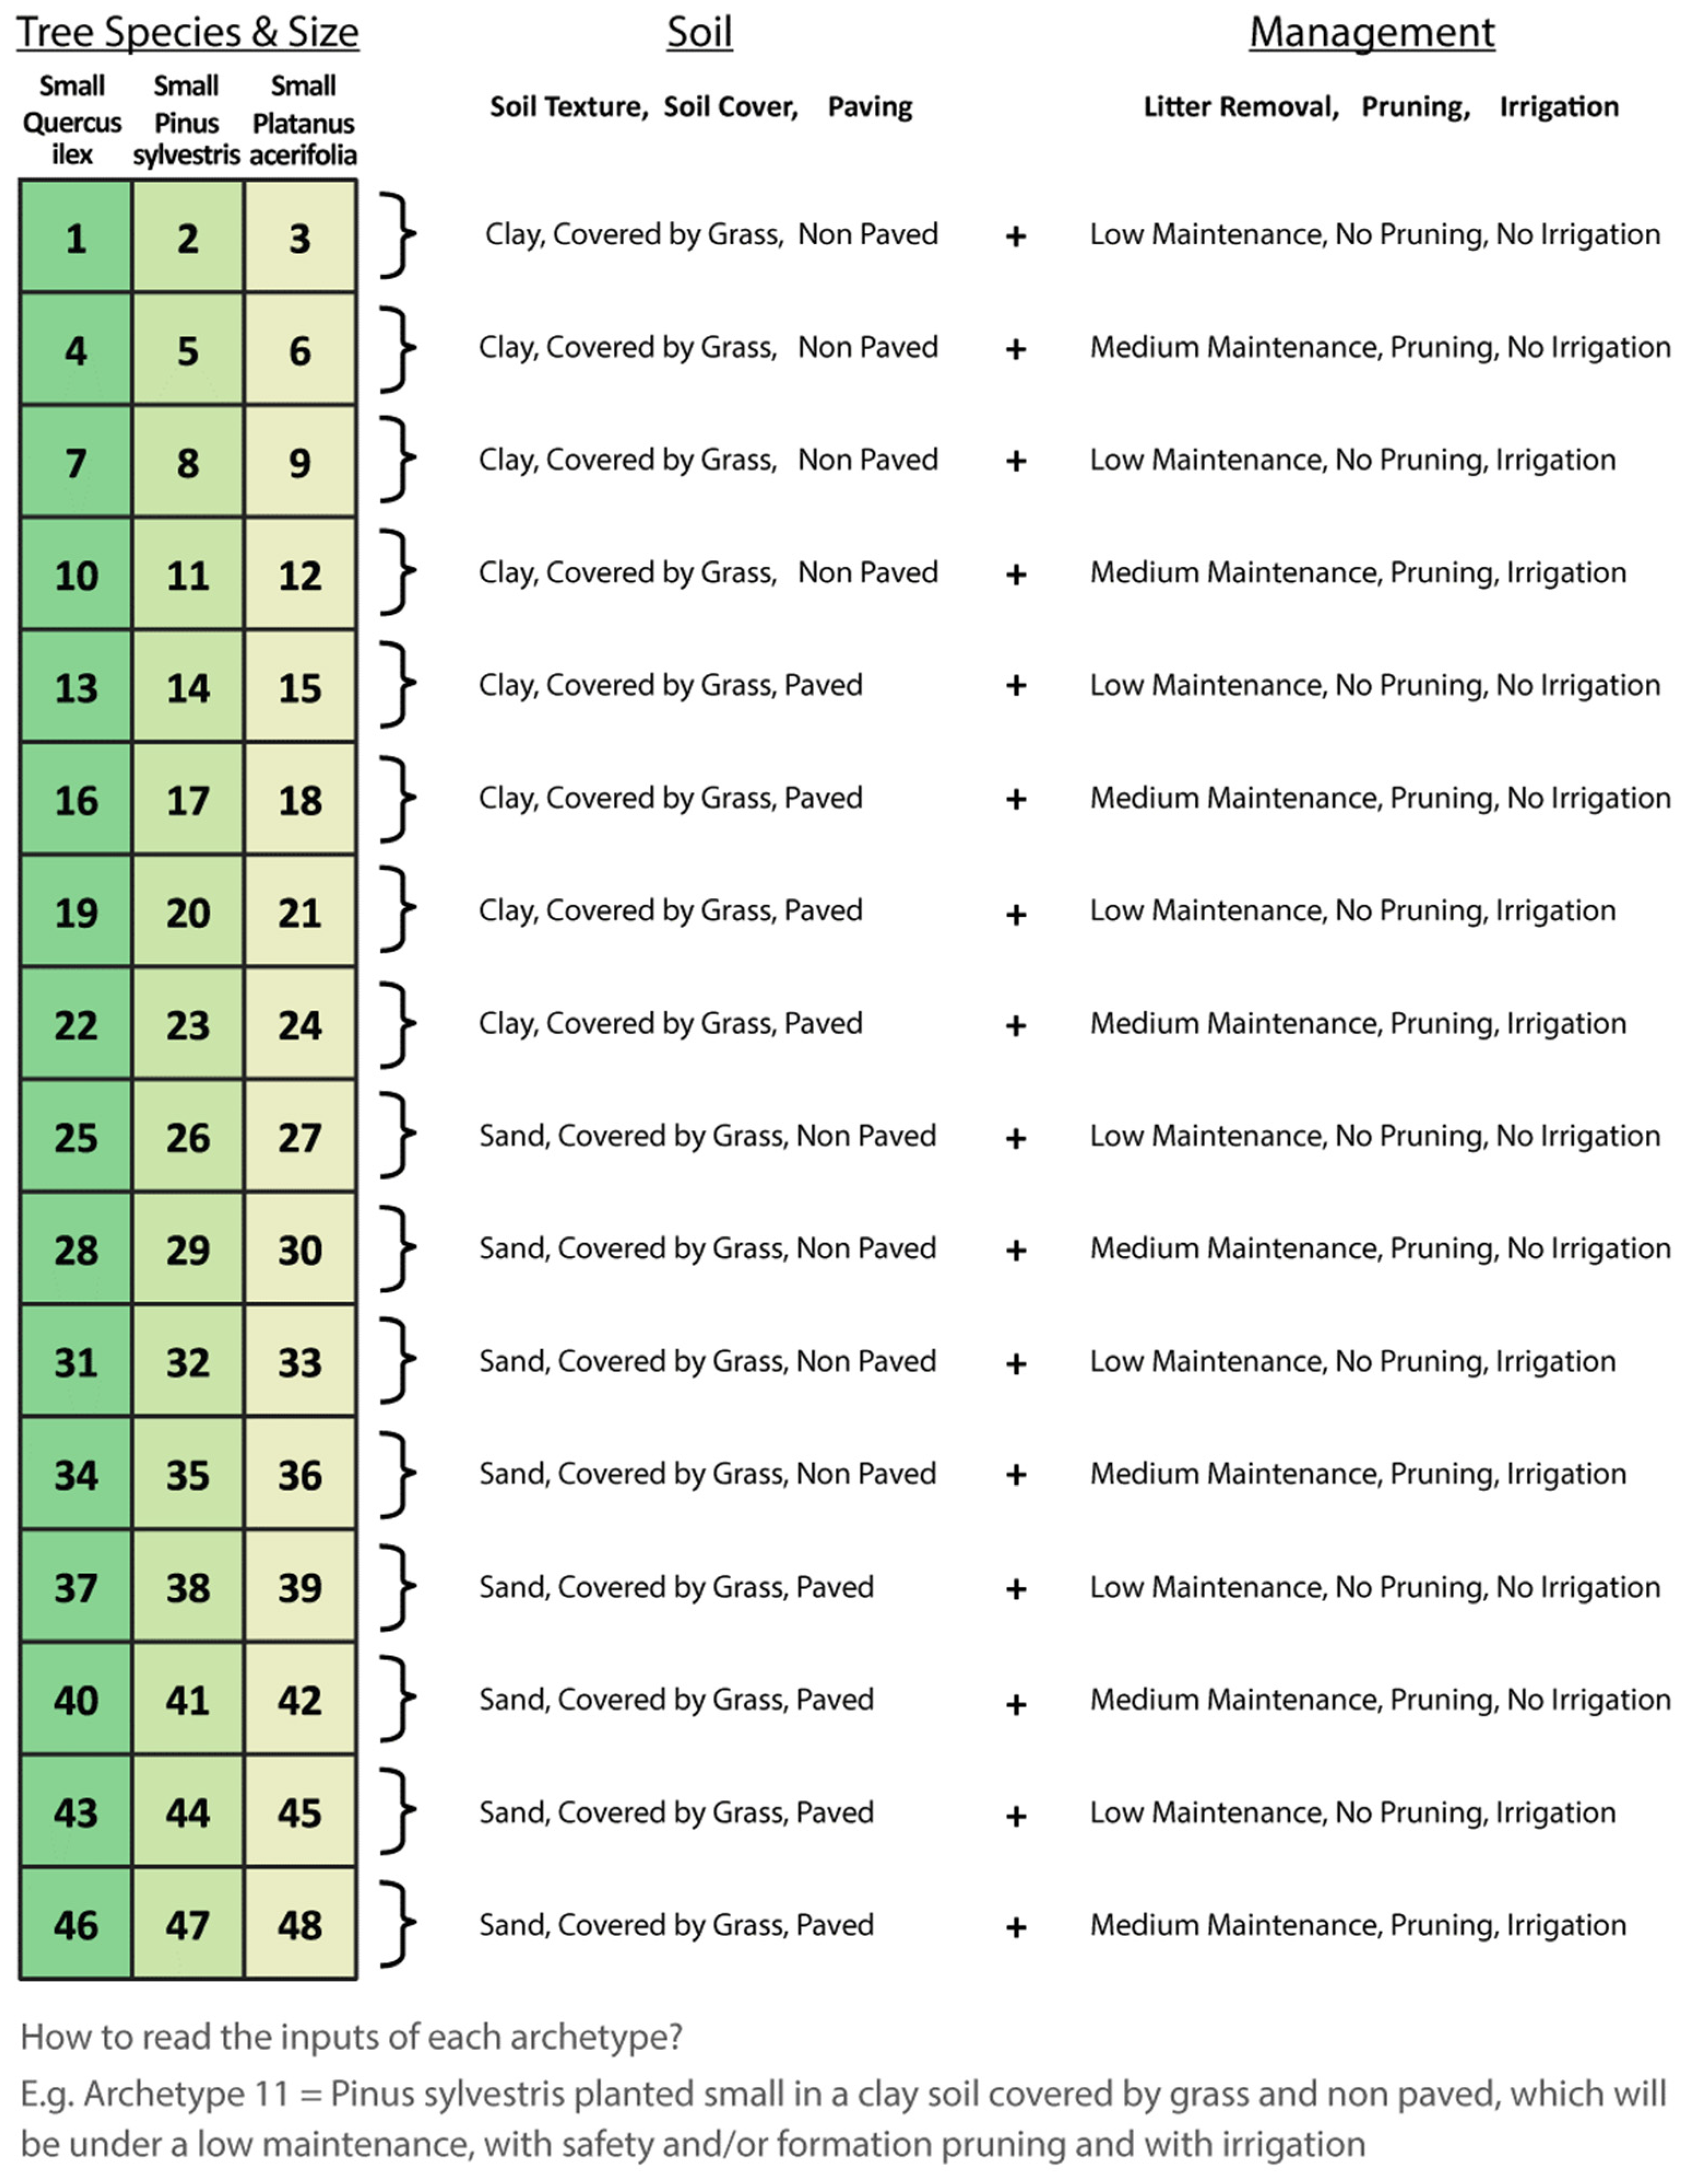
3. Application of NBenefit$ to Evaluate Urban Forests

To illustrate the functionality of NBenefit$, 48 urban forest archetypes were prepared for the environmental conditions of Barajas, in the northeast of Madrid (Spain). Section 3.1 provides an overview of these archetypes. Detailed output data for the 48 archetypes are provided in SM8. In Section 3.2, three alternatives using three archetypes are tested for a hypothetical project of a small urban forest (0.1 Ha, 10 cells).

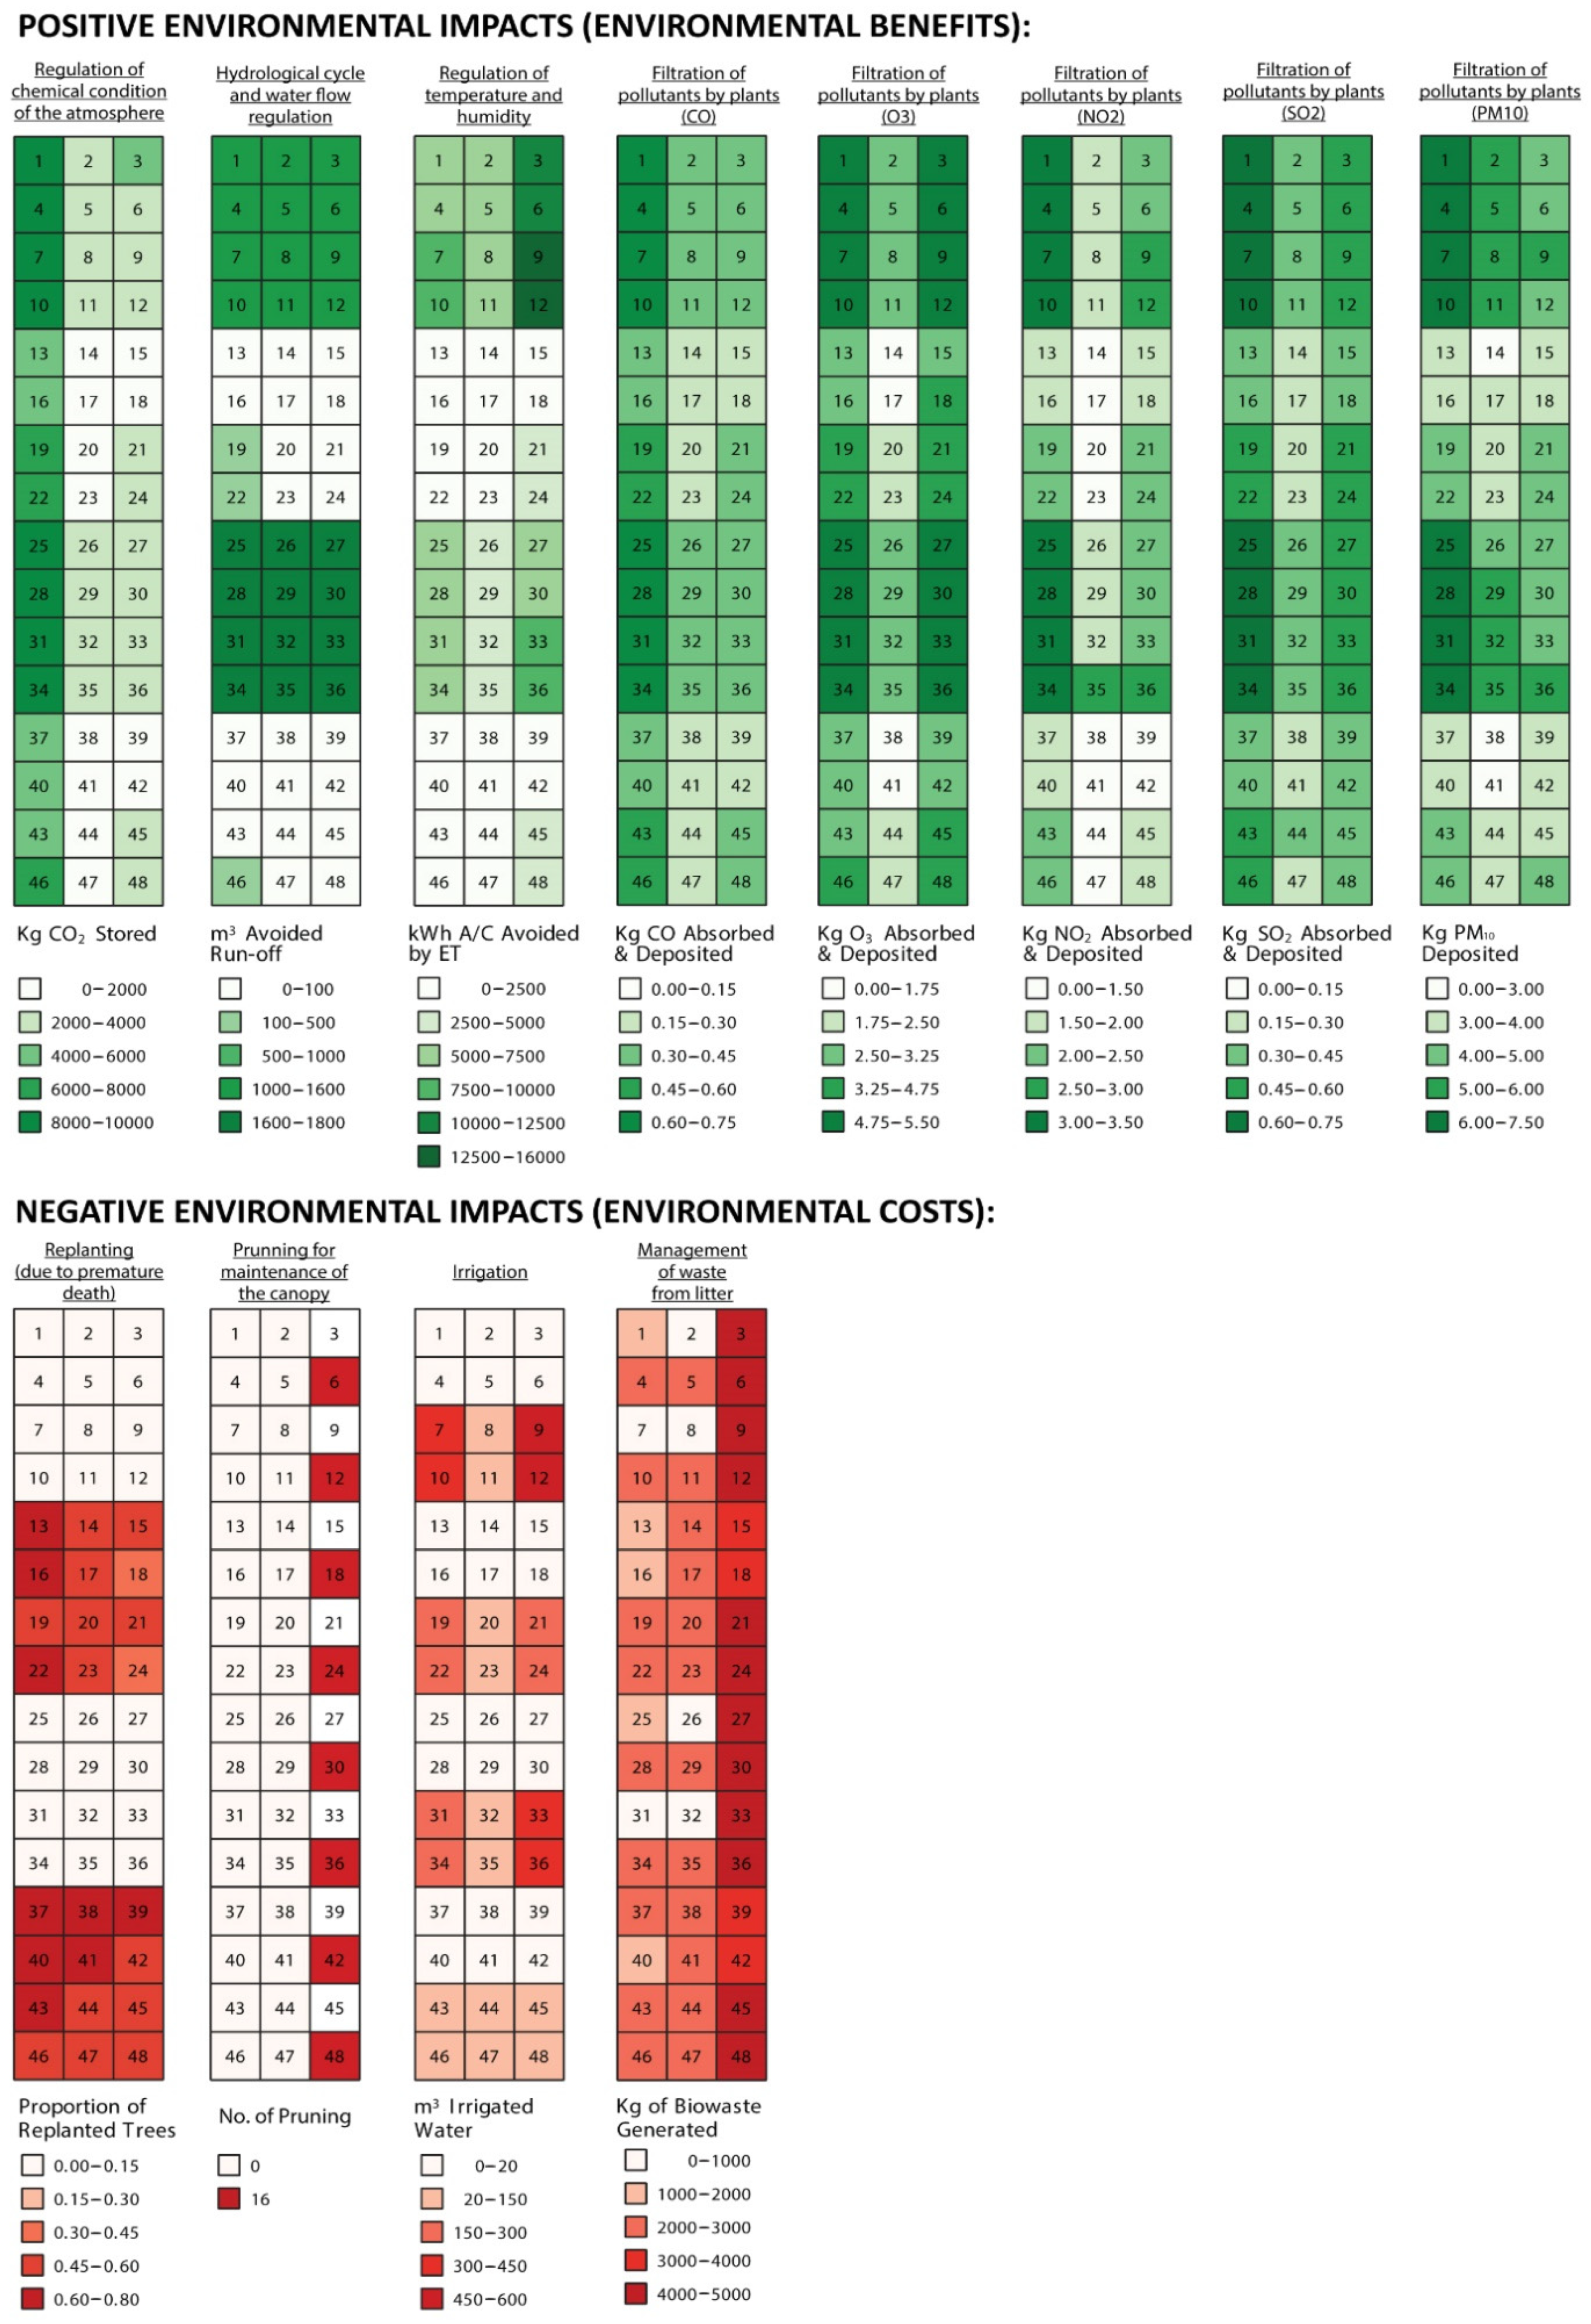
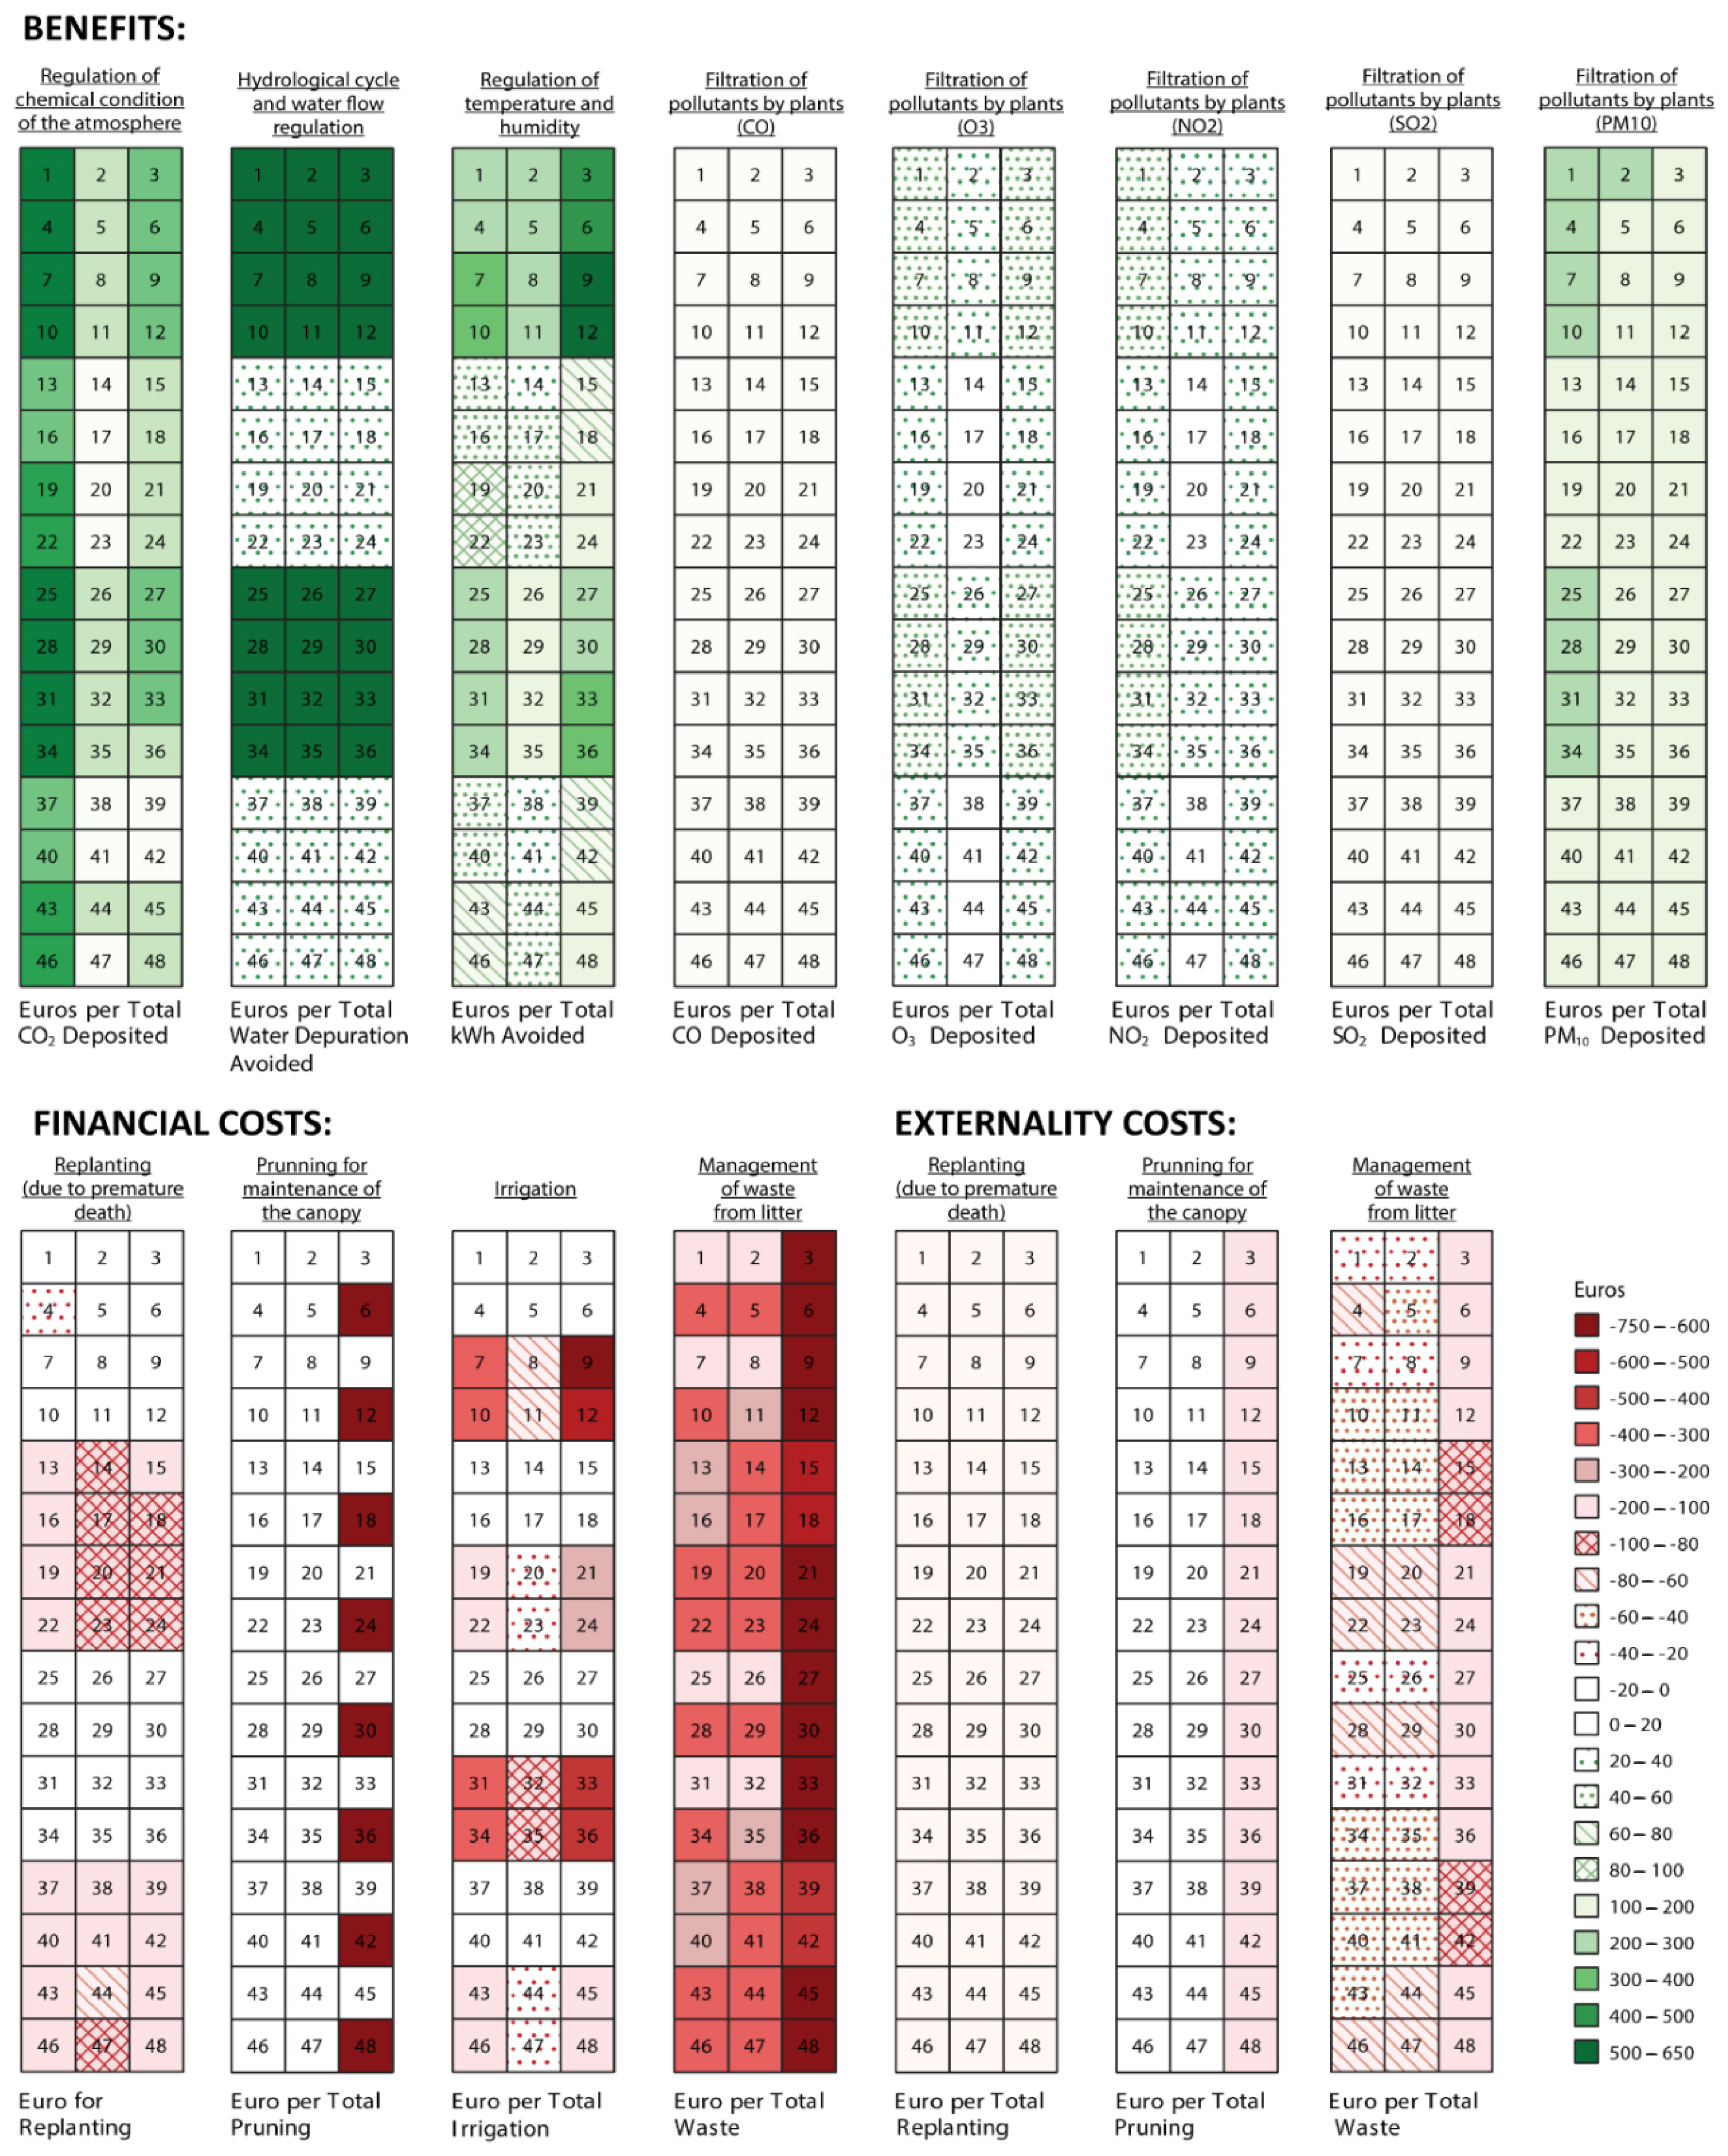
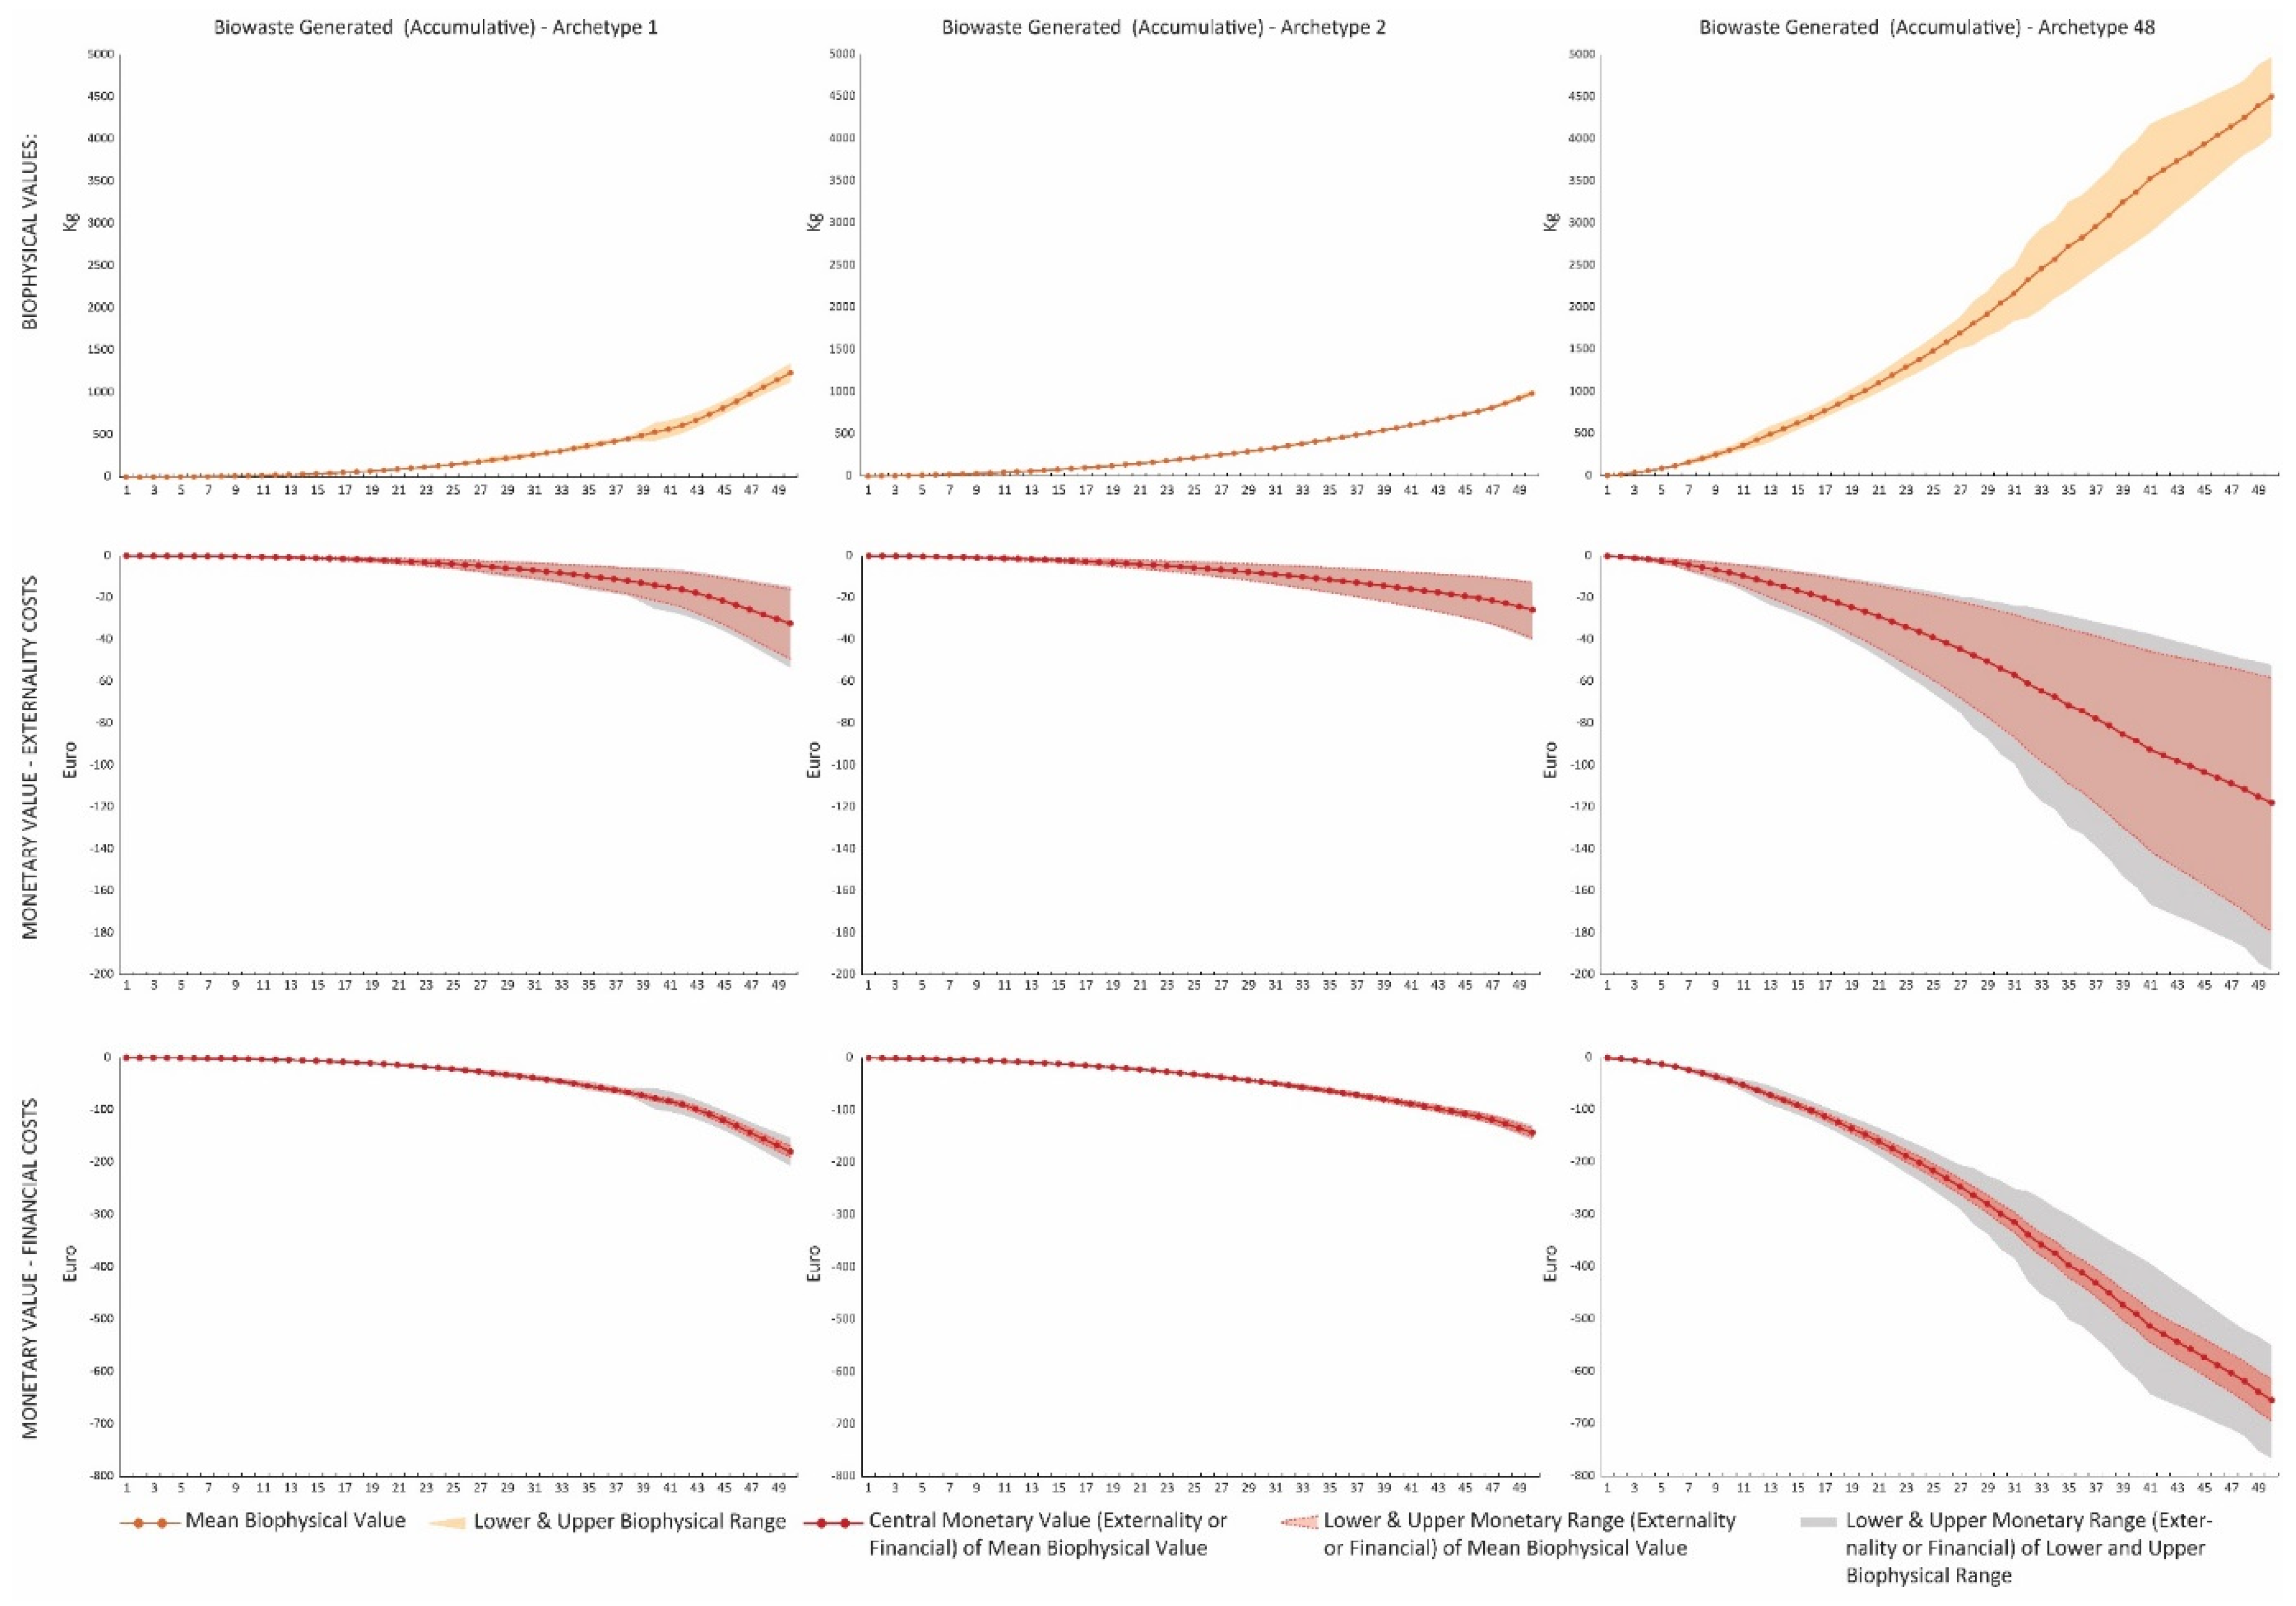
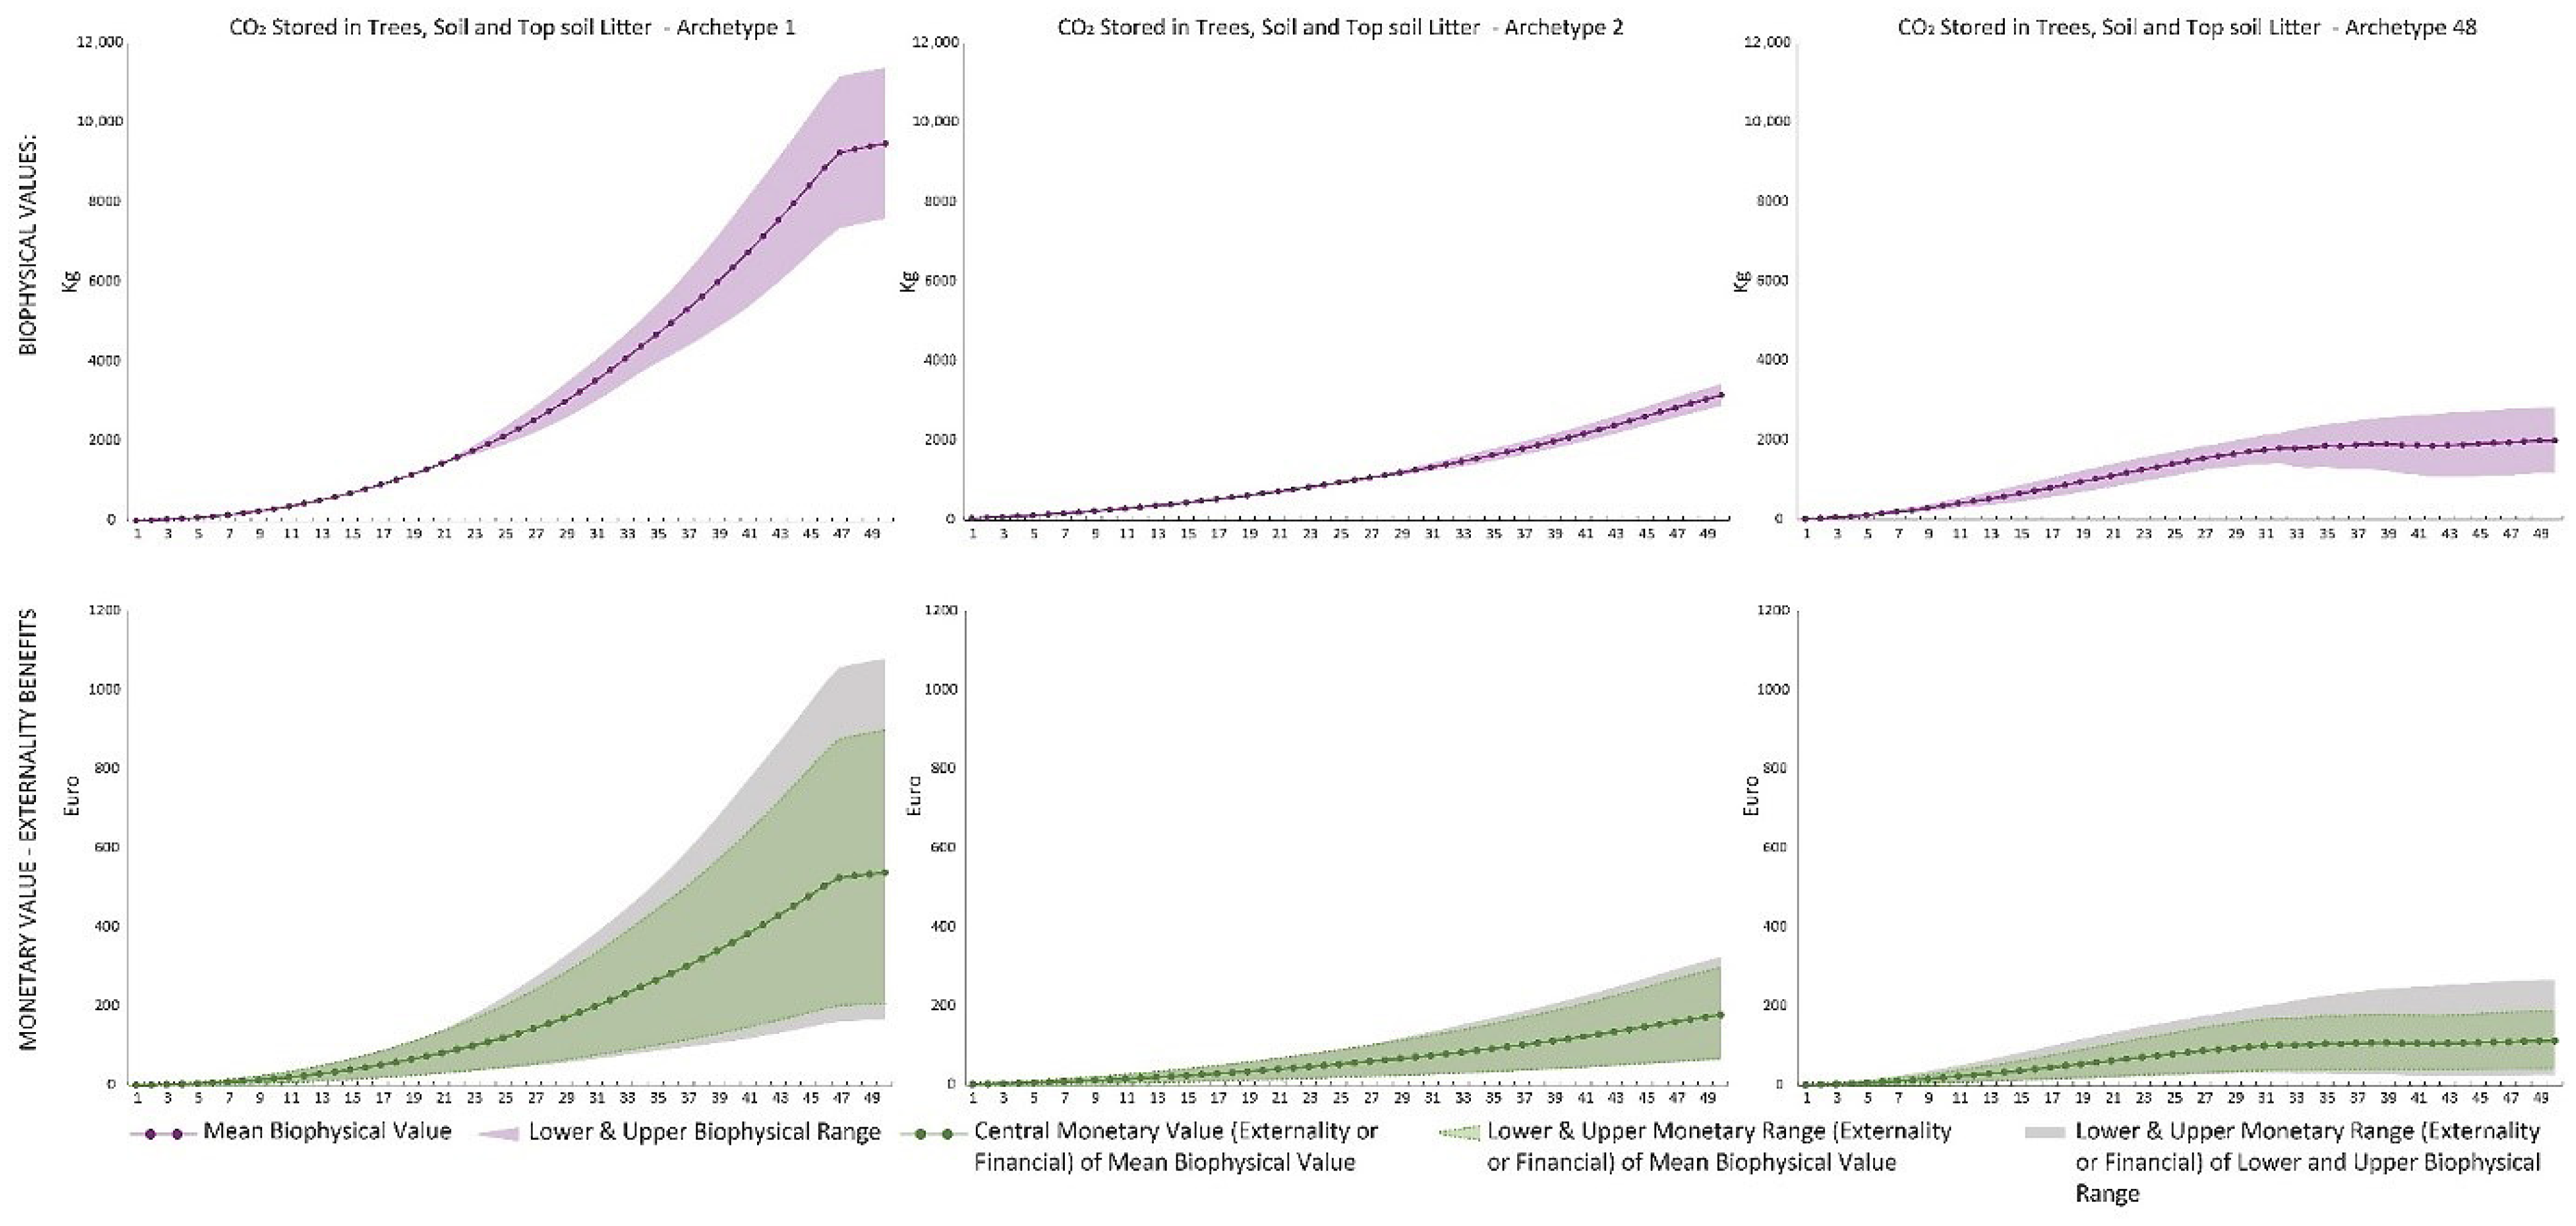
3.1. Biophysical and Monetary Outputs of NBenefit$ for 48 Urban Forest Archetypes

The archetypes are represented in this paper as a grid of cells (Figure 8) such as the ones used in NBenefit$. The overall performance of each archetype in biophysical units as well as in monetary units is illustrated in Figure 9 and Figure 10. Discounting is not applied for this illustrative exercise. Standard deviation values are shown in Figure 11, Figure 12 and Figure 13, which were used to compute the lower and upper monetary values.
As Figure 9 and Figure 10 illustrate, the 48 archetypes performed rather differently in terms of benefits (positive externalities) and costs (negative externalities and financial values).
For example, in the case of archetype 9, the ES Regulation of temperature and humidity is the dominant benefit, and Irrigation and Management of waste from litter are the dominant costs. The dominant benefit is explained by the fact that Platanus acerifolia has a high evapotranspiration rate [63] when it is not constrained by water limitations (e.g., in irrigated conditions such as in this archetype). This high evapotranspiration translates into a higher capacity to regulate temperature and humidity. The two dominant costs can be explained by the fact that irrigation is applied and Platanus acerifolia is a deciduous species that becomes rather large with a high leaf area, hence generating a great amount of leaf litter and dead branches over time.
As another example, the ES Regulation of chemical condition of the atmosphere is the dominant benefit for archetype 19. However, when looking at the results of archetype 19 in biophysical terms, it performed quite well for all the ES Filtration of air pollutants by plants compared to other archetypes. In terms of benefits, the results of archetype 19 are explained by the fact that Quercus ilex has a great long-term supply of carbon storage and it also has a high filtration capacity of common air pollutants. This ES does not spike in monetary terms because monetary values of air filtration are much lower than other types of benefits, at least in this specific application in Barajas. This can clearly be seen across all archetypes in Figure 10. Concerning costs, Management of waste from litter is the dominant negative financial and externality value for archetype 19. The high cost associated with waste management is explained by the fact that this archetype is under paved conditions. NBenefit$ assigns a higher threshold of maintenance to paved conditions, even in cases of low maintenance, compared to non-paved conditions. This is due to security concerns against some NBS ecosystem disservices (e.g., risk of dead branches falling, containment of leaf litter). The tool recognises that paved areas are highly used by people and that a minimum level of security and utility is required. These examples illustrate the relevance of planning and design decisions, which sometimes inherently include (or require) certain levels of utility and security.
The results illustrated in Figure 9 and Figure 10 also help to highlight how the change in one or two attributes could affect the performance of an NBS. For example, archetypes 1 and 13 only differ in one input attribute; the former is non-paved, and the latter is paved. Nevertheless, that difference has a strong impact on the performance of the NBS in terms of benefits and, to a lesser extent, costs. This can be explained by the fact that paved soils impede the infiltration of water, reducing water availability for the tree. Consequently, the probability of water stress increases, and the tree transpiration is limited due to the lack of available water. Additionally, reduced transpiration also limits the dry deposition of pollutants and the growth rate of the tree, therefore diminishing carbon storage. As for archetype 19, the increased utility and security thresholds assigned to paved conditions in NBenefit$ increase waste management costs.
Displaying results disaggregated by year and by category (see Figure 11, Figure 12 and Figure 13) helps to show the performance of an archetype over time and how long it takes to generate a significant benefit or cost.
For example, in the case of Regulation of temperature and humidity (Figure 13), it can be noticed that the yearly benefit is not always increasing, and the change occurs at different rates. Figure 13 shows how variable this benefit can be compared to other ES, because it does not only depend on attributes of the archetype, but it also depends on the variability of the meteorological conditions. Concurrently, the inclusion of standard deviation in the graphs as well as lower, central, and upper values for the monetisation makes the result variability more transparent. It allows us to evaluate whether changes in performance between archetypes are relevant or not in each specific case. For example, archetype 2 provides a higher Regulation of the chemical condition of the atmosphere than archetype 48, but as Figure 12 illustrates, this difference might not be significant in terms of benefits. Instead, when both archetypes are compared against archetype 1, it clearly appears that the latter outperforms them.

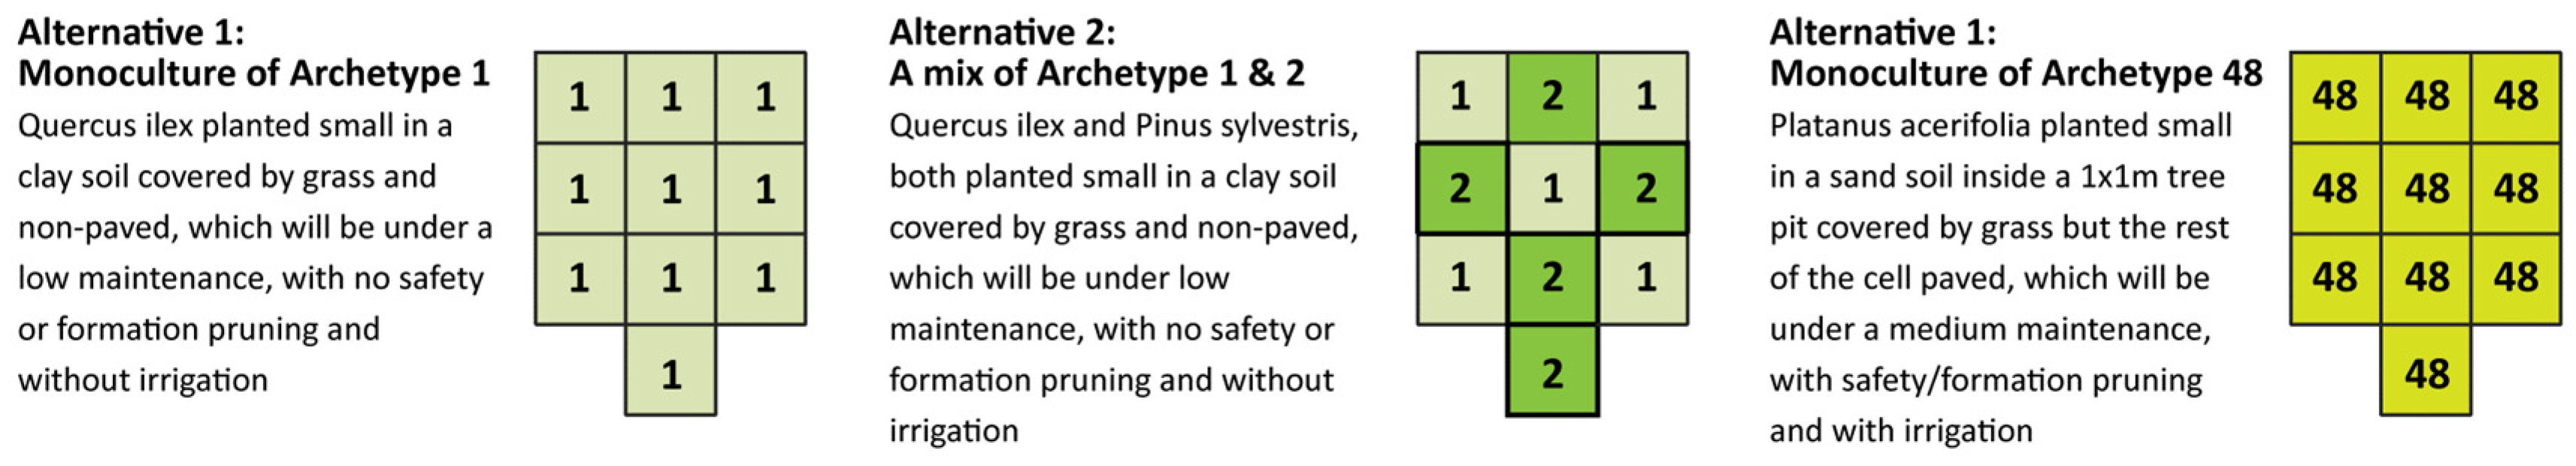
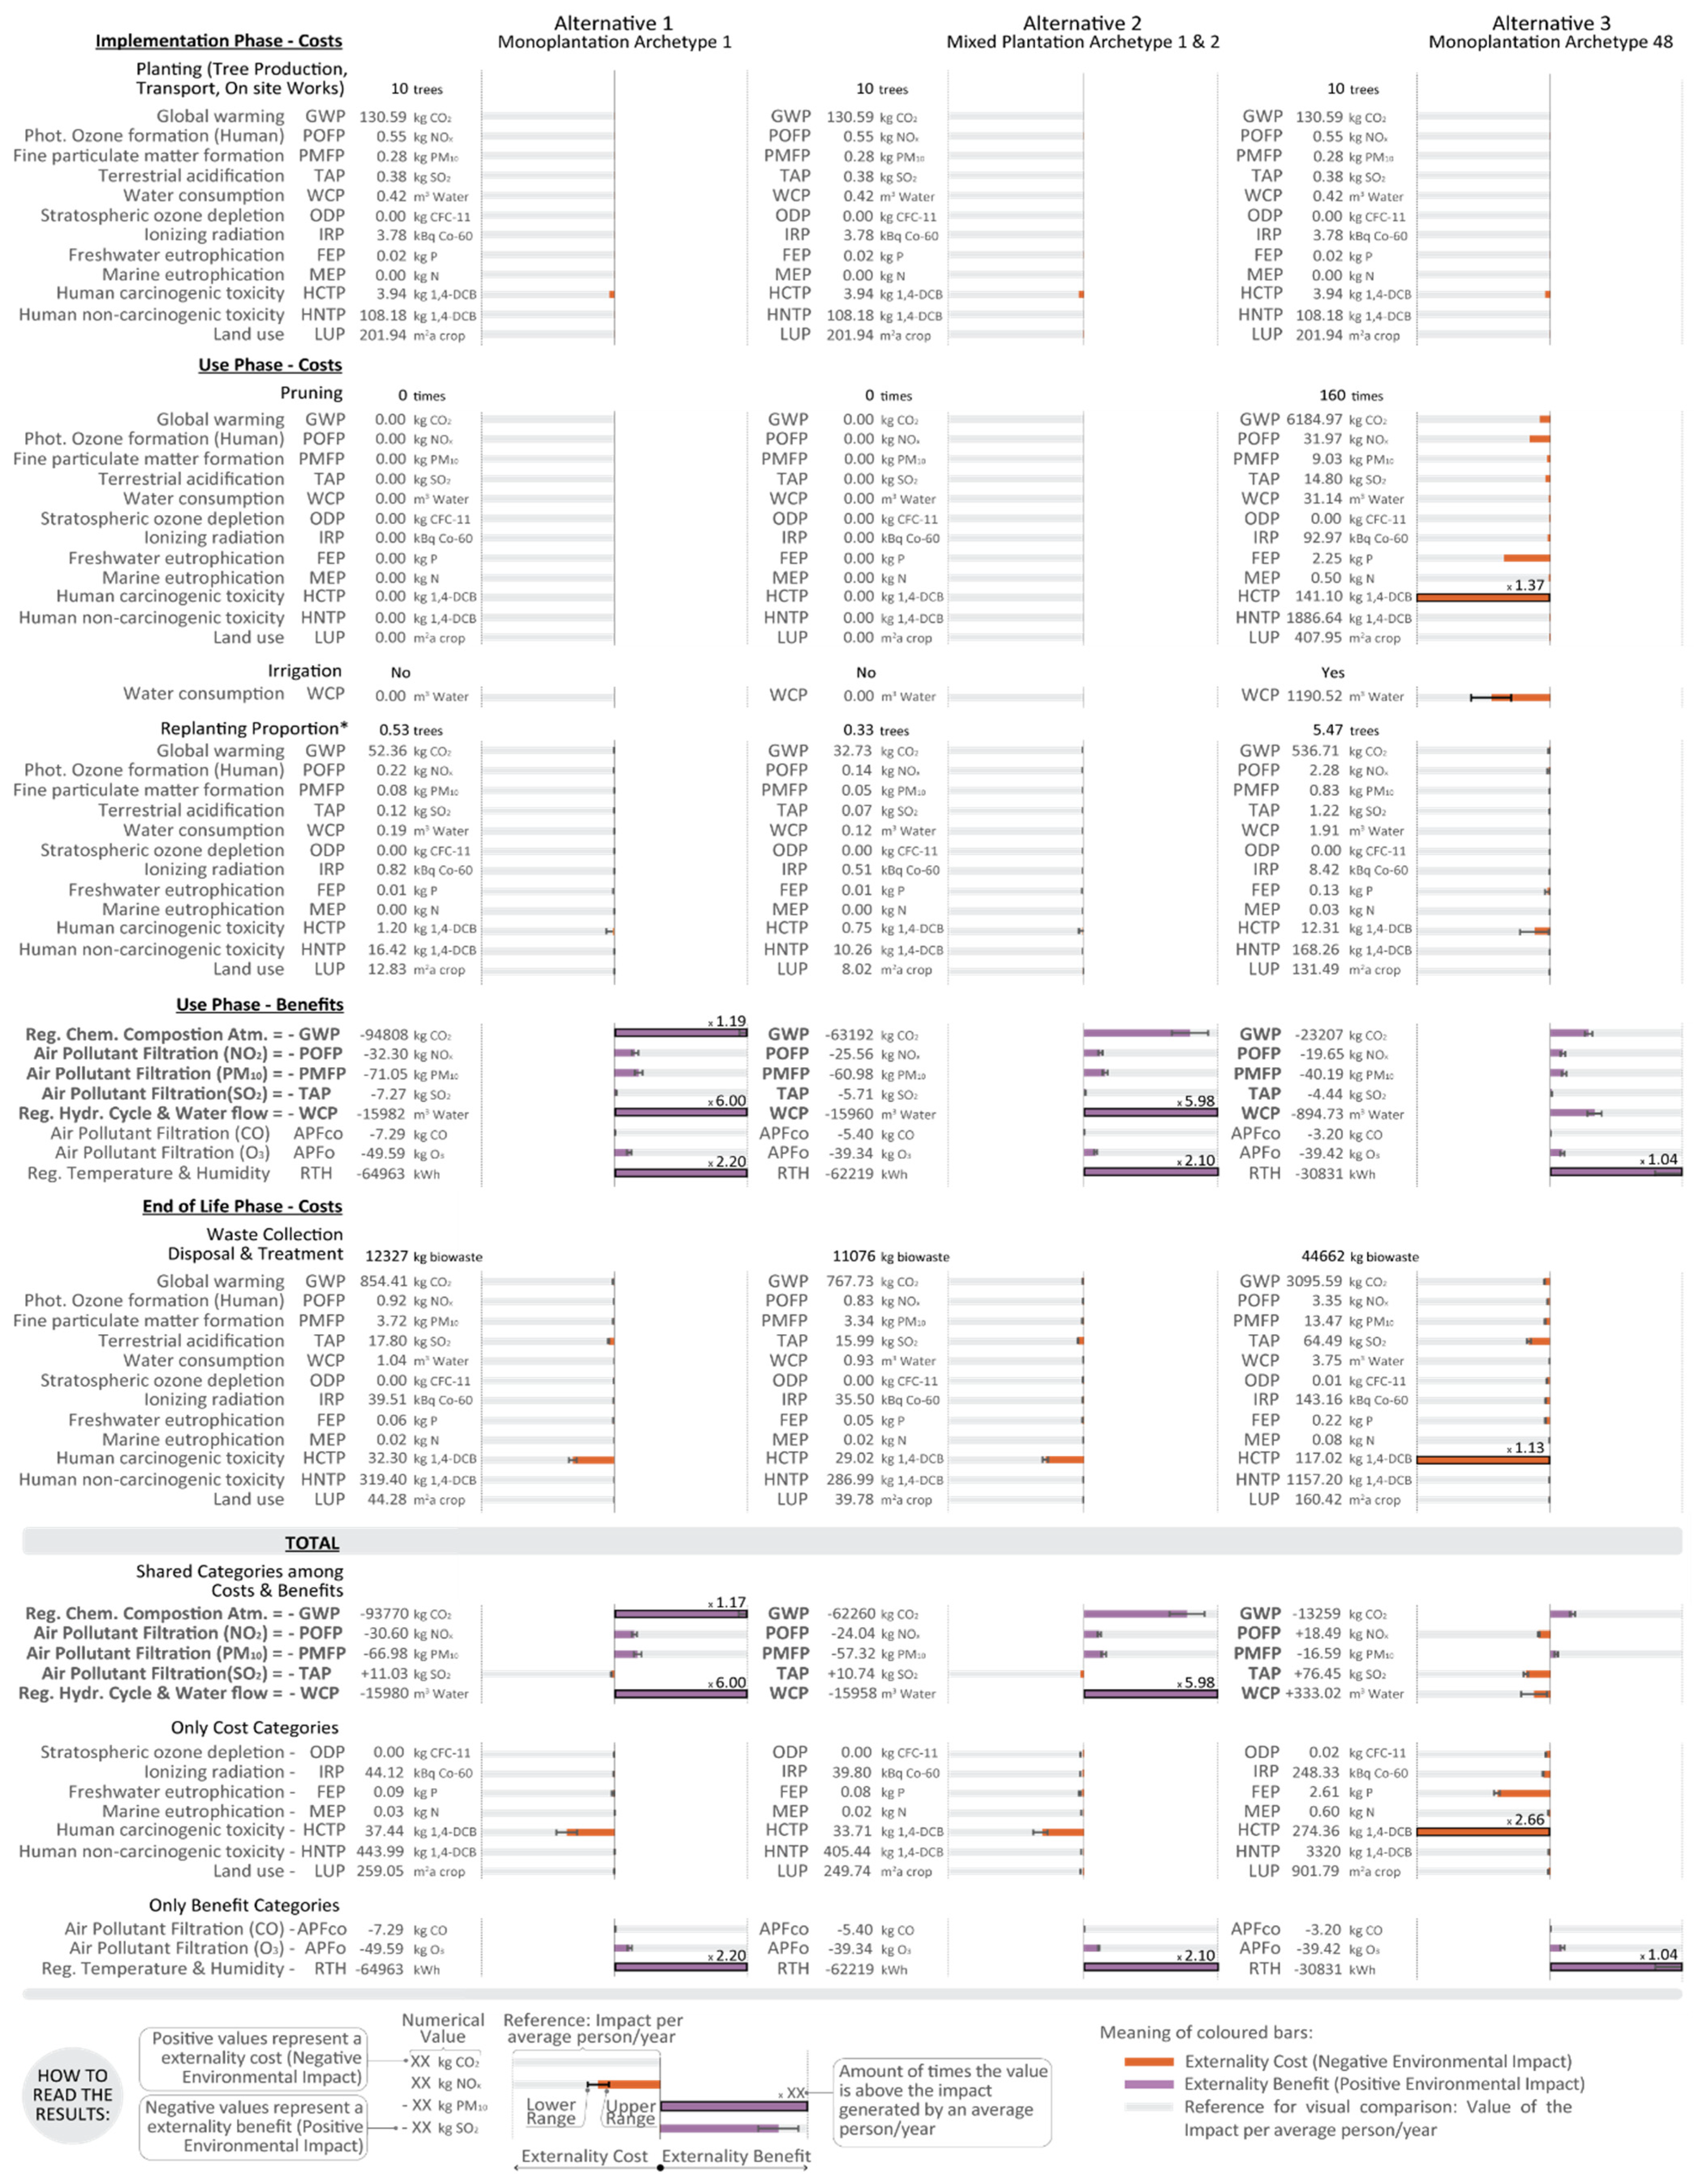
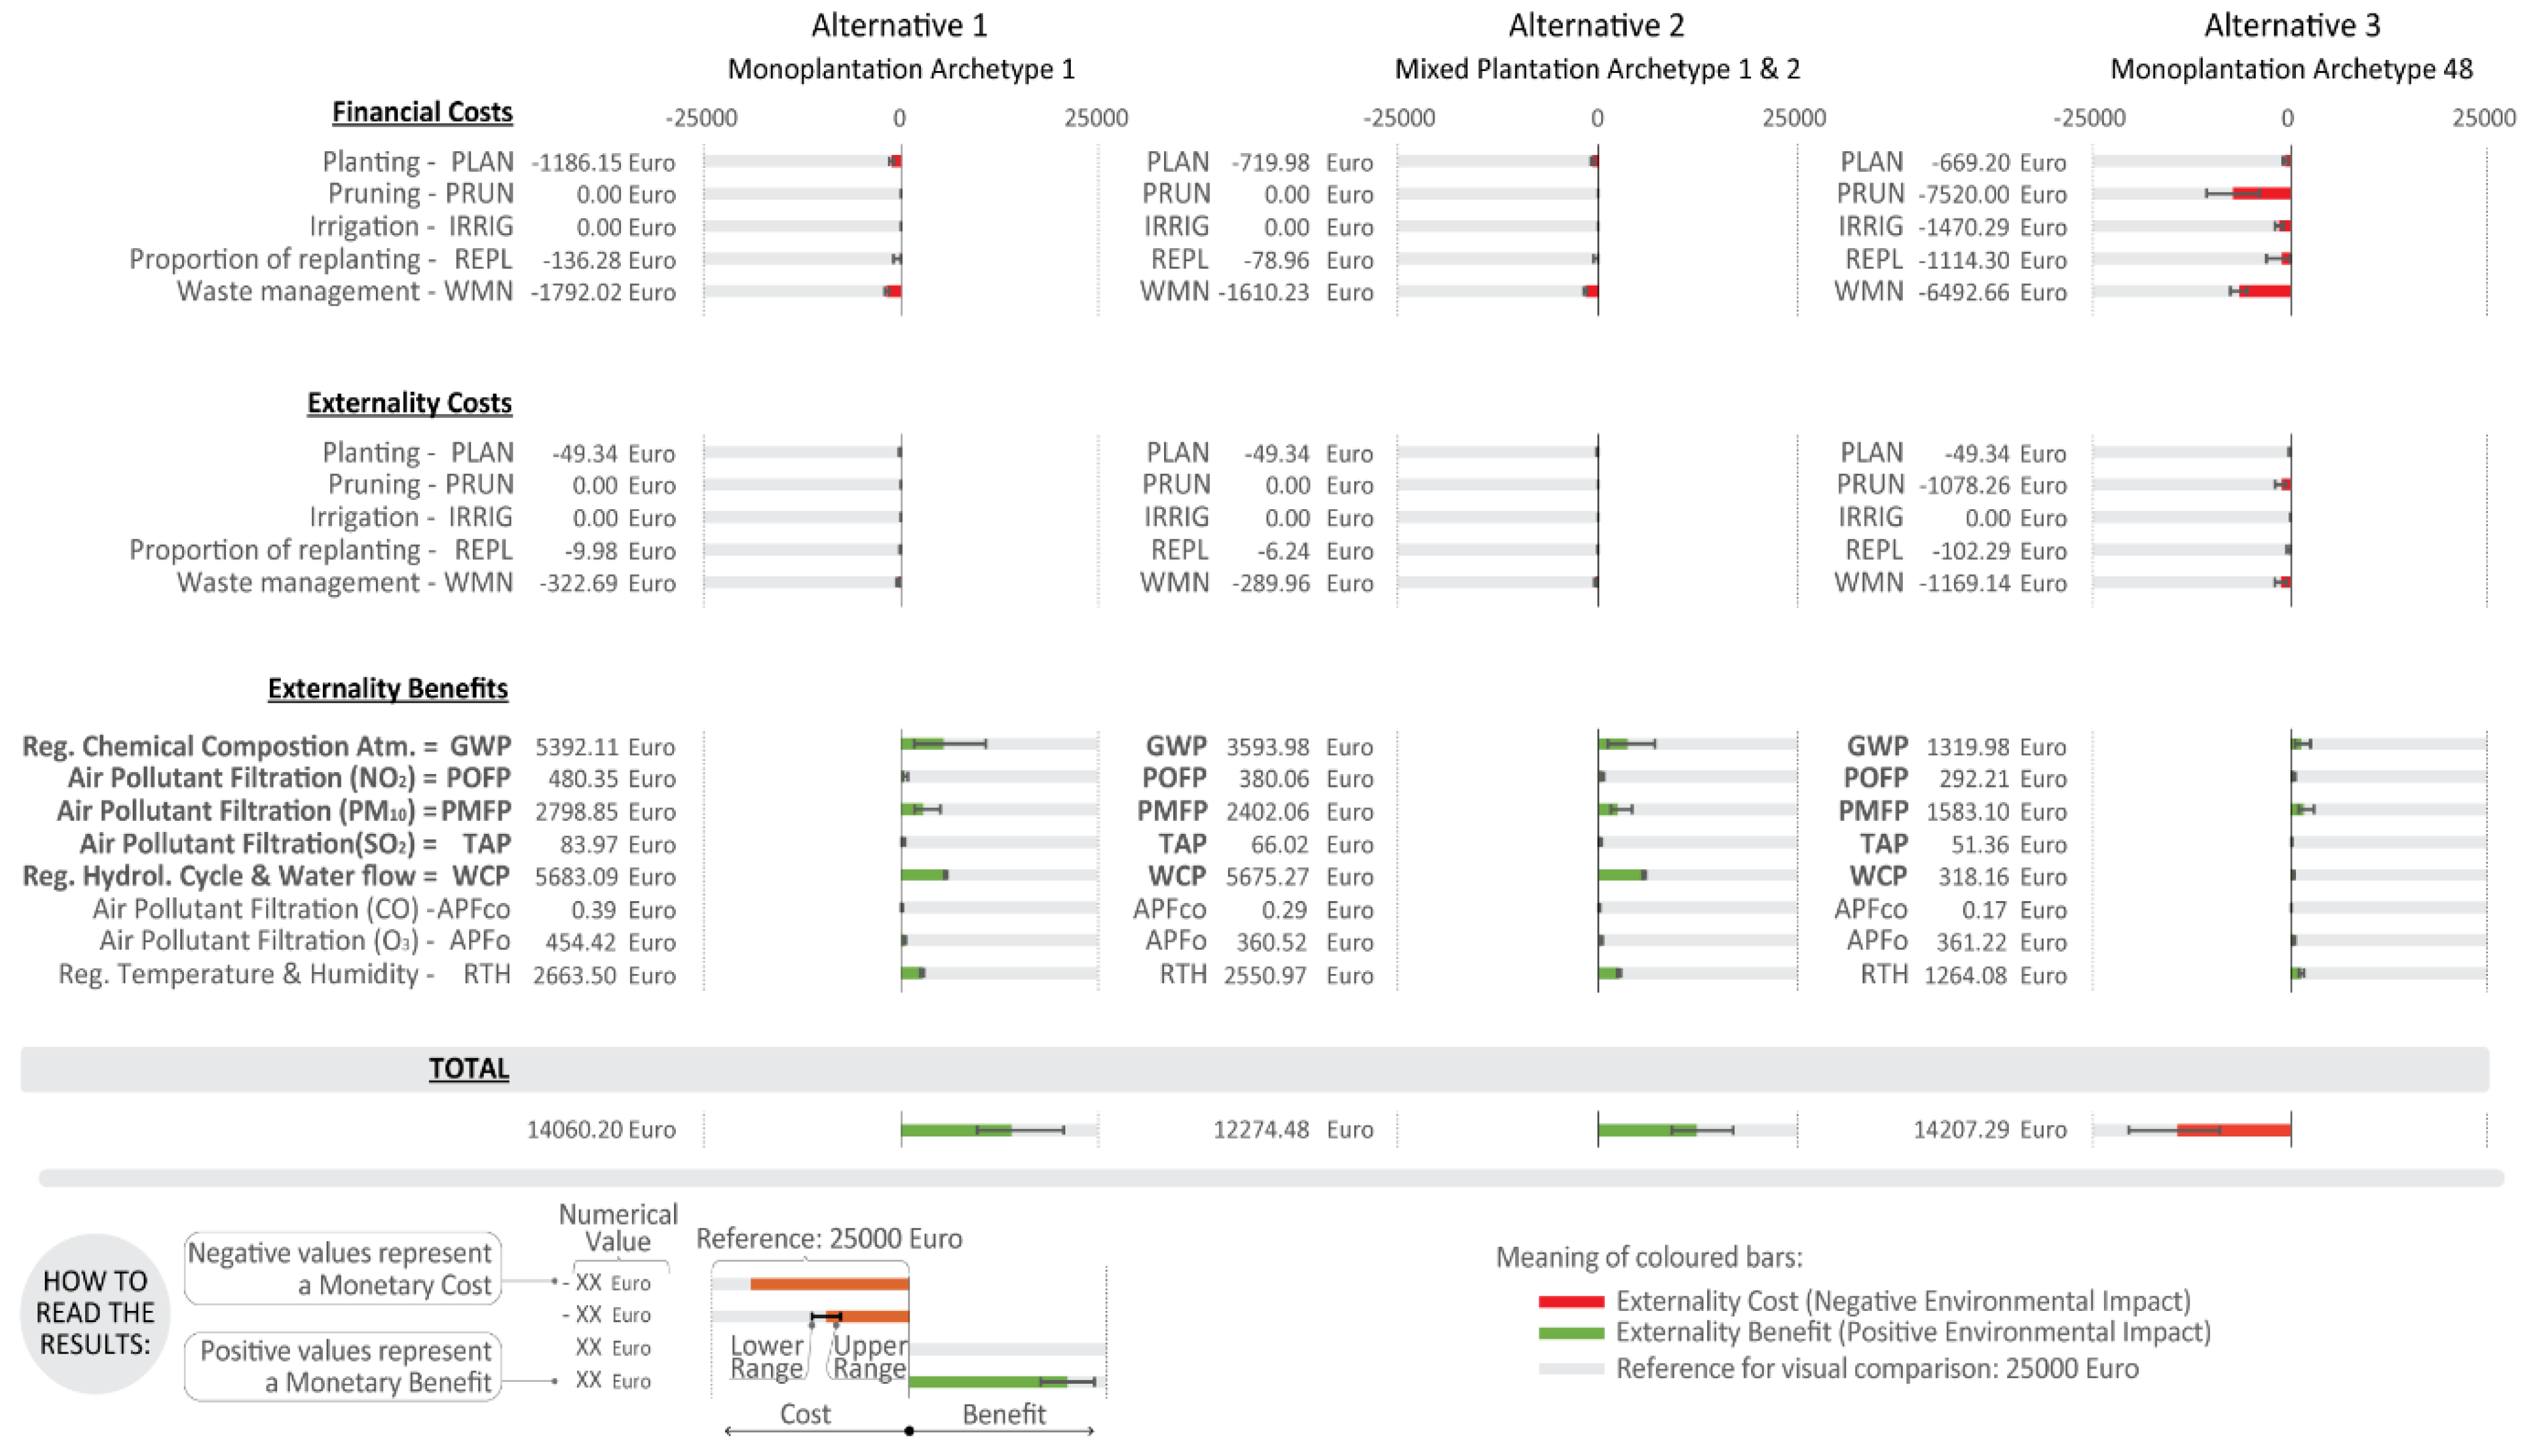
3.2. Evaluation of Three Hypothetical Alternatives for A Small Urban Forest

Three alternatives for a small urban forest were defined and tested to illustrate how a cost and benefit analysis report can be synthetically provided as outputs by NBenefit$. The characteristics of each alternative are summarised in Figure 14, while Figure 15 and Figure 16 summarise the cost-benefit analysis of each alternative in biophysical and monetary units.
For the hypothetical alternatives, archetype 1 (including a broadleaved evergreen species) and archetype 2 (including a coniferous species) were selected because they are among the best performers for most of the benefits derived from ES as well as among the ones that have the least negative financial and externality values (costs). Similarly, archetype 48 (including a broadleaved deciduous species) was selected because it is among the worst performers of the 48 archetypes as well as among the archetypes with higher financial costs.
As illustrated in Figure 15, alternative 3 is clearly the worst option in terms of environmental impacts. In all the stages, it is the one with the highest negative environmental impact and the lowest positive environmental impact. In fact, there is only one action, i.e., planting, in which the three alternatives perform equally. This is because the elements used to characterise impacts are assumed to be the same in the underlying model (i.e., the time trees have spent in the nursery, transport distance and planting techniques). However, when comparing alternative 1 and 2, it was not clear if there was a significant difference in performance. Alternative 1 performed clearly better for Regulation of chemical composition of the atmosphere, but it contributed more to Human carcinogenic toxicity. For the rest of the categories, the numerical differences were minimal, and the graphical comparison of each category against the reference (impact of an average person) reinforced this interpretation. Since the biophysical evaluation does give only one side of the performance picture, this is one of the situations where the monetary valuation provided by NBenefit$ can complement the analysis.
As shown in Figure 16, alternative 1 had a total net benefit 10% higher than alternative 2; alternative 3 remained the worst performer, with a negative total net benefit. However, alternative 2 had slightly lower total financial costs, which means a reduced negative cash flow over the NBS life. Thus, for certain users with a stringent budget constraint, alternative 2 might be preferred, although there is a slightly lower net economic benefit. In this sense, the tool provides disaggregated information and indicators allowing the comparison across alternatives from different perspectives. Concurrently, looking at the whiskers of the net benefits, while the average value of alternative 1 is higher, this is inside a similar range of net benefit to alternative 2. By informing on the variability in outputs, NBenefit$ thus supports robust and informed decision making.
The disaggregation of cost and benefit items in the results reported by NBenefit$ can also help to identify structural differences in the economic performance. For instance, Figure 16 shows that the largest difference between the net benefits in alternative 1 and 2 was due to Regulation of chemical composition of the atmosphere (CO2 storage). In NBS projects, it may occur that certain benefits have higher priority than others and, in these cases, a disaggregation such as the one provided by NBenefit$, is recommended. For example, in certain contexts, local climate regulation might be considered more relevant compared to increased CO2 storage capacity. The tool could help to discriminate between alternative NBS projects with similar cost-benefit ratios, solve trade-offs between ES provision, or rank alternatives via lexicographic orderings. The disaggregation of outputs beyond the overall net benefit value further enhances the decision-making power.
Figure 15. Comparison of benefits (positive externalities) and costs (financial and negative externalities) in biophysical units per life cycle phase and in total. Costs are represented in orange and benefits in purple.
Land 12 00070 g015
Figure 16. Comparison of the benefits (positive externalities) and costs (financial and negative externalities) in monetary units per life cycle phase and as a net total value. Costs are represented in red and benefits in green.
Land 12 00070 g016

4. Discussion and Conclusions

This paper presents the development of NBenefit$ and its application to two illustrative case studies. NBenefit$ was developed as a prototype online decision support tool for the evaluation of urban forest interventions that considers their entire life cycle, i.e., implementation phase, use phase, and end-of-life phase. It describes how archetypes of urban forests for specific environmental conditions can be created, pre-calculated, and stored, as well as which outputs and format can be provided to potential users of the tool, i.e., built environment professionals of different kinds interested in comparing alternatives for a specific urban forest project (as an example of nature-based solution).
Archetypes are at the core of NBenefit$ and are defined by combinations of biotic, abiotic, and management attributes. Archetypes thus provide built environment professionals with a simple but science-based form to demonstrate, over different urban planning/design stages, how attribute variations influence the performance of NBS. Through the concept of archetypes, built environment professionals are released from the tedious task of collecting an excessive amount of data, which in some cases (or at some stages of the project) are unknown, putting that time burden on the side of the NBenefit$ developer. This should facilitate the uptake of NBenefit$ already from early planning/design stages, providing more room to influence functionality and performance, i.e., making future urban forest projects more cost-effective. As a drawback, the pre-calculation of new archetypes is dependent upon the availability of data. For example, in the case of urban forests, tree growth is modelled making use of allometric equations, which need to be already available in published studies or need to be estimated using local (or from similar sites) tree inventories. In addition, the use of a pre-established set of values might not be enough for practitioners who need a high specificity in the archetypes. In those cases, ad hoc assessments can be developed directly in the model underpinning NBenefit$, for which tailor-made archetypes are defined but which require more time and technical expertise.
The balance of environmental and economic impact for all the urban forest life cycle phases and its communication at a yearly basis is useful for design purposes but also for communication with a broad range of stakeholders. Nowadays, there is still a lack of decision support tools for urban NBS that offer both types of output, focus on detailed spatial scales, and provide long-term predictive performance outputs understandable by a broad audience. As anticipated in Section 1, only a few decision support tools currently provide detailed urban ES calculations. This is the case for i-Tree [31], specific for urban forests; ENVI-met [64], specific for local climate regulation; and SWMM [33], capable of modelling natural storm-water management solutions. Compared to NBenefit$, some of these tools (ENVI-met, SWMM) offer a detailed temporal resolution, able to work in hourly time steps and inform about the performance of NBS during specific events such as intense storms. Nevertheless, these tools are not focused on modelling the long-term performance of NBS, they do not explicitly consider negative externalities, and in some cases, they are not easy to use by low-computer-literate users. NBenefit$ and i-Tree are the only tools that offer both biophysical and monetary values in a format easy to communicate to stakeholders. However, NBenefit$ can also inform about the known accumulated uncertainty.
So far, NBenefit$ only relies on an urban forest model, but the tool has been specifically developed to also accommodate models (and archetypes) for many other NBS types (e.g., green roofs, urban wetlands, etc.). Implementing new models will enhance the usefulness of NBenefit$ in planning and designing complex urban green open spaces that integrate more than one NBS type. Additionally, future versions of NBenefit$ may include a more extensive coverage of externalities, financial costs, and ES, since the performance output generated for each alternative is still limited in this regard. For example, the current model and the online decision support tool still do not consider how design, planning, or management decisions might influence pest control or aesthetics and their associated costs and benefits. To the authors’ knowledge, none of the urban NBS modelling tools included in the literature can perform it either. All these advancements would therefore contribute to move NBenefit$ from a prototype decision support tool to a more sophisticated one, capable of being used by professionals in real practice to support urban plans and designs of complex NBS projects.
To gather feedback from a user’s perspective and guide towards further development steps, NBenefit$ was tested by partners of the H2020 project Nature4Cities (https://www.nature4cities.eu/ (accessed on 10 November 2022)), most of which are related to the built environment sector. Among the feedback collected, it appeared that the current way of inputting data by users might be lengthy for large projects. Hence, in future versions, it will be necessary to integrate additional alternatives for inputting data to improve the user experience.
Regarding outputs, improvements to the online spatially explicit visualisation of disaggregated indicators should be conducted to help users gather a better understanding of where specific strengths or weaknesses occur in a project. In this sense, the option to download disaggregated biophysical and monetary values per cell and time step in a spreadsheet and/or shapefile format is handy, allowing for the import of outputs into Geographic Information Systems (GIS). Similarly, the integration of NBenefit$ results into Building Information Modelling (BIM) software would save time for BIM practitioners and improve their workflow. In that case, it might be adequate to provide the long-term benefit and cost outputs of disaggregated archetypes (or groups of them) in the format of BIM template tables. In fact, BIM is used more and more by different built environment professionals, and in some countries (e.g., United Kingdom), a certain level of BIM adoption is required in projects [40].
Besides Nature4Cities partners, authors looked for feedback from professional chambers to understand how professionals perceived the value of the tool. This is why NBenefit$ was submitted to the UK Landscape Institute Awards 2021 (Landscape Institute is the professional chamber of landscape architects in the UK), where it was retained as a finalist in the Landscape Innovation category, which proves that the tool is of interest to landscape architecture professionals (https://awards.landscapeinstitute.org/li-awards-finalists-winners-2021-2/ (accessed on 10 November 2022)). This result reinforced the potential value of the tool for practitioners, encouraging its further development. This submission also represents a first step to establish a pathway of collaboration with groups of built environment professionals from different disciplines (e.g., landscape architecture, civil engineer, architecture), whose input is anticipated necessary to ensure the fit for purpose in the development of NBenefit$.
In future stages, NBenefit$ will continue to be developed with the aim of solving the abovementioned limitations, ensuring an adoption by urban landscape practitioners and its penetration in the market. Efforts will be greatly placed in moving the tool from a TRL (Technology Readiness Level) of 5-6 (prototype tested in intended environments) to a TRL of 7-8 (ready for industry, i.e., real practice purposes). See details about TRLs in [65,66]. This requires testing the tool in multiple urban contexts and projects and that practitioners belonging to targeted end users (e.g., landscape architects, architects) make part of those tests to provide feedback about missing functionalities, user barriers, or relevant costs and benefits gaps. Efforts will also be placed in a dissemination strategy that exploits the use of professional-tailored workshops and iconic testbed cases and looks for the support of (supra)national research funding agencies to reach a wider audience of potential collaborators and future end users.
Despite that further technical work is needed, the current prototype of NBenefit$ demonstrated, compared to existing modelling tools, its added value for assessing urban forest-based NBS projects and providing support to decision-making. It is one of the rare examples of NBS decision support tools developed to inform built environment professionals with low computer-literacy about the overall long-term costs and benefits of new specific urban NBS projects. Ultimately, it anticipates the cost-effectiveness of planned/designed urban forest projects, which further gives the knowledge basis for their informed implementation in urban environments.

Supplementary Materials

The following supporting information can be downloaded at: https://www.mdpi.com/article/10.3390/land12010070/s1: SM1—Summary table of current ES modelling tools; SM2—Basic details about NBenefit$, access and availability; SM3—Additional descriptions about the urban forest model underpinning NBenefit$; SM4—Compressed zip file with xls files for the monetisation of the biophysical indicators on ecosystem services, mid-point life cycle impacts and the average monetary value of management actions; SM5—Illustrative example of successive difference in mean and standard deviation values for three outputs of Archetype 1, 2, and 48; SM6—Compressed zip file with xls files for all the archetypes and variables of the successive difference in mean and standard deviation values. There is a README doc explaining the content of the zip file to understand how to use it; SM7—xls file with reference values for the impact of an average person in the world in 2010 for all the individual categories considered in the assessment with biophysical units; SM8—xls file of the yearly and overall output data in biophysical and monetary units. Version of the results ready to be uploaded in GIS software is also provided. There is a README sheet describing the meaning of the abbreviations of the titles of each spreadsheet

Author Contributions

Conceptualization, J.B.A., C.P. and B.R.; methodology, ALL; software, J.B.A., C.P., L.C. and T.N.G.; validation, J.B.A., C.P. and B.R.; formal analysis, J.B.A.; investigation, J.B.A. and C.P.; resources, J.B.A., L.C. and T.N.G.; data curation, J.B.A., C.P., L.C. and T.N.G.; writing—original draft preparation, J.B.A.; writing—review and editing, J.B.A., C.P. and B.R.; visualization, J.B.A. and B.R.; supervision, C.P. and B.R.; project administration, B.R.; funding acquisition, B.R. All authors have read and agreed to the published version of the manuscript.

Funding

This research received funding from the European Union’s Horizon 2020 research and innovation programme under the Grant No: 730468 (www.nature4cities.eu, accessed on 10 November 2022).

Data Availability Statement

Data are contained within the Supplementary Material of this article.

Acknowledgments

The authors would like to acknowledge funding from the European Union’s Horizon 2020 research and innovation programme under Grant No: 730468 (www.nature4cities.eu, accessed on 10 November 2022).

Conflicts of Interest

The authors declare no conflict of interest. Moreover, the funders had no role in the design of the study; in the collection, analyses, or interpretation of data; in the writing of the manuscript; or in the decision to publish the results.

References

  1. Keeler, B.L.; Hamel, P.; McPhearson, T.; Hamann, M.H.; Donahue, M.L.; Meza Prado, K.A.; Arkema, K.K.; Bratman, G.N.; Brauman, K.A.; Finlay, J.C.; et al. Social-Ecological and Technological Factors Moderate the Value of Urban Nature. Nat. Sustain. 2019, 2, 29–38. [Google Scholar] [CrossRef]
  2. Grace, M.; Balzan, M.; Collier, M.; Geneletti, D.; Tomaskinova, J.; Abela, R.; Borg, D.; Buhagiar, G.; Camilleri, L.; Cardona, M.; et al. Priority Knowledge Needs for Implementing Nature-Based Solutions in the Mediterranean Islands. Environ. Sci. Policy 2021, 116, 56–68. [Google Scholar] [CrossRef]
  3. Frantzeskaki, N.; Vandergert, P.; Connop, S.; Schipper, K.; Zwierzchowska, I.; Collier, M.; Lodder, M. Examining the Policy Needs for Implementing Nature-Based Solutions in Cities: Findings from City-Wide Transdisciplinary Experiences in Glasgow (UK), Genk (Belgium) and Pozna ń (Poland). Land Use Policy 2020, 96, 104688. [Google Scholar] [CrossRef]
  4. MEA. Ecosystems and Human Well-Being: General Synthesis; Island Press: Washington, DC, USA, 2005. [Google Scholar]
  5. European Commission—Directorate-General for Research and Innovation. Evaluating the Impact of Nature-Based Solutions: A Summary for Policy Makers. 2021. Available online: https://data.europa.eu/doi/10.2777/521937 (accessed on 20 November 2021).
  6. Cohen-Sacham, E.; Walters, G.; Janzen, C.; Maginnis, S. Nature-Based Solutions to Address Global Societal Challenges; IUCN: Gland, Switzerland, 2016. [Google Scholar]
  7. Babí Almenar, J.; Elliot, T.; Rugani, B.; Philippe, B.; Navarrete, T.; Sonnemann, G.; Geneletti, D. Nexus between Nature-Based Solutions, Ecosystem Services and Urban Challenges. Land Use Policy 2021, 100, 104898. [Google Scholar] [CrossRef]
  8. FAO. Guidelines on Urban and Peri-Urban Forestry; Salbitano, F., Borelli, S., Conigliaro, M., Chen, Y., Eds.; FAO: Rome, Italy, 2016. [Google Scholar]
  9. Soto, J.R.; Escobedo, F.J.; Khachatryan, H.; Adams, D.C. Consumer Demand for Urban Forest Ecosystem Services and Disservices: Examining Trade-Offs Using Choice Experiments and Best-Worst Scaling. Ecosyst. Serv. 2018, 29, 31–39. [Google Scholar] [CrossRef]
  10. Nesshöver, C.; Assmuth, T.; Irvine, K.N.; Rusch, G.M.; Waylen, K.A.; Delbaere, B.; Haase, D.; Jones-Walters, L.; Keune, H.; Kovacs, E.; et al. The Science, Policy and Practice of Nature-Based Solutions: An Interdisciplinary Perspective. Sci. Total Environ. 2017, 579, 1215–1227. [Google Scholar] [CrossRef]
  11. Artmann, M.; Sartison, K. The Role of Urban Agriculture as a Nature-Based Solution: A Review for Developing a Systemic Assessment Framework. Sustain. 2018, 10, 1937. [Google Scholar] [CrossRef] [Green Version]
  12. Haase, D.; Larondelle, N.; Andersson, E.; Artmann, M.; Borgström, S.; Breuste, J.; Gomez-Baggethun, E.; Gren, Å.; Hamstead, Z.; Hansen, R.; et al. A Quantitative Review of Urban Ecosystem Service Assessments: Concepts, Models, and Implementation. Ambio 2014, 43, 413–433. [Google Scholar] [CrossRef] [Green Version]
  13. Cortinovis, C.; Geneletti, D. A Framework to Explore the Effects of Urban Planning Decisions on Regulating Ecosystem Services in Cities. Ecosyst. Serv. 2019, 38, 100946. [Google Scholar] [CrossRef]
  14. Schaubroeck, T. A Need for Equal Consideration of Ecosystem Disservices and Services When Valuing Nature; Countering Arguments against Disservices. Ecosyst. Serv. 2017, 26, 95–97. [Google Scholar] [CrossRef]
  15. von Döhren, P.; Haase, D. Ecosystem Disservices Research: A Review of the State of the Art with a Focus on Cities. Ecol. Indic. 2015, 52, 490–497. [Google Scholar] [CrossRef]
  16. Lyytimäki, J.; Sipilä, M. Hopping on One Leg—The Challenge of Ecosystem Disservices for Urban Green Management. Urban For. Urban Green. 2009, 8, 309–315. [Google Scholar] [CrossRef]
  17. Perini, K.; Rosasco, P. Cost-Benefit Analysis for Green Façades and Living Wall Systems. Build. Environ. 2013, 70, 110–121. [Google Scholar] [CrossRef]
  18. Bianchini, F.; Hewage, K. Probabilistic Social Cost-Benefit Analysis for Green Roofs: A Lifecycle Approach. Build. Environ. 2012, 58, 152–162. [Google Scholar] [CrossRef]
  19. Mcpherson, E.G.; Kendall, A. A Life Cycle Carbon Dioxide Inventory of the Million Trees Los Angeles Program. Int. J. Life Cycle Assess. 2014, 19, 1653–1665. [Google Scholar] [CrossRef]
  20. Mcpherson, E.G.; Kendall, A.; Albers, S. Life Cycle Assessment of Carbon Dioxide for Different Arboricultural Practices in Los Angeles, CA. Urban For. Urban Green. 2015, 14, 388–397. [Google Scholar] [CrossRef]
  21. Ingram, D.L.; Fernandez, R.T. Life Cycle Assessment: A Tool for Determining the Environmental Impact of Horticultural Crop Production. Horttechnology 2012, 22, 275–279. [Google Scholar] [CrossRef] [Green Version]
  22. Ingram, D.L. Life Cycle Assessment to Study the Carbon Footprint of System Components for Colorado Blue Spruce Field Production and Use. J. Am. Soc. Hortic. Sci. 2013, 138, 3–11. [Google Scholar] [CrossRef] [Green Version]
  23. Petri, A.C.; Koeser, A.K.; Lovell, S.T.; Ingram, D. How Green Are Trees?—Using Life Cycle Assessment Methods to Assess Net Environmental Benefi Ts 1. J. Environ. Hortic. 2016, 34, 101–110. [Google Scholar] [CrossRef]
  24. Cabral, P.; Feger, C.; Levrel, H.; Chambolle, M.; Basque, D. Assessing the Impact of Land-Cover Changes on Ecosystem Services: A First Step toward Integrative Planning in Bordeaux, France. Ecosyst. Serv. 2016, 22, 318–327. [Google Scholar] [CrossRef]
  25. Trodahl, M.I.; Jackson, B.M.; Deslippe, J.R.; Metherell, A.K. Investigating Trade-Offs between Water Quality and Agricultural Productivity Using the Land Utilisation and Capability Indicator (LUCI)—A New Zealand Application. Ecosyst. Serv. 2017, 26, 388–399. [Google Scholar] [CrossRef]
  26. Peh, K.S.H.; Balmford, A.; Bradbury, R.B.; Brown, C.; Butchart, S.H.M.; Hughes, F.M.R.; Stattersfield, A.; Thomas, D.H.L.; Walpole, M.; Bayliss, J.; et al. TESSA: A Toolkit for Rapid Assessment of Ecosystem Services at Sites of Biodiversity Conservation Importance. Ecosyst. Serv. 2013, 5, 51–57. [Google Scholar] [CrossRef] [Green Version]
  27. Martínez-López, J.; Bagstad, K.J.; Balbi, S.; Magrach, A.; Voigt, B.; Athanasiadis, I.; Pascual, M.; Willcock, S.; Villa, F. Towards Globally Customizable Ecosystem Service Models. Sci. Total Environ. 2019, 650, 2325–2336. [Google Scholar] [CrossRef]
  28. Coleman, K.; Jenkinson, D.S. RothC—A Model for the Turnover of Carbon in Soil: Model Description and Users Guide (DOS Version; Updated June 2014). In Evaluation of Soil Organic Matter Models; Springer: Berlin/Heidelberg, Germany, 2014; 26p. [Google Scholar] [CrossRef]
  29. Shekhar, S.; Xiong, H. Soil and Water Assessment Tool “SWAT”. Encycl. GIS 2008, 1068. [Google Scholar] [CrossRef]
  30. Golinkoff, J. Biome BGC Version 4.2: Theoretical Framework of Biome-BGC. 2010. Available online: http://www.ntsg.umt.edu/models/bgc/ (accessed on 20 November 2021).
  31. Hirabayashi, S.; Kroll, C.N.; Nowak, D.J. I-Tree Eco Dry Deposition Model Descriptions. Available online: https://www.itreetools.org/documents/60/i-Tree_Eco_Dry_Deposition_Model_Descriptions_V1.5.pdf (accessed on 20 November 2021).
  32. Zölch, T.; Maderspacher, J.; Wamsler, C.; Pauleit, S. Using Green Infrastructure for Urban Climate-Proofing: An Evaluation of Heat Mitigation Measures at the Micro-Scale. Urban For. Urban Green. 2016, 20, 305–316. [Google Scholar] [CrossRef]
  33. Burszta-Adamiak, E.; Mrowiec, M. Modelling of Green Roofs’ Hydrologic Performance Using EPA’s SWMM. Water Sci. Technol. 2013, 68, 36–42. [Google Scholar] [CrossRef]
  34. Bagstad, K.J.; Semmens, D.J.; Waage, S.; Winthrop, R. A Comparative Assessment of Decision-Support Tools for Ecosystem Services Quantification and Valuation. Ecosyst. Serv. 2013, 5, 27–39. [Google Scholar] [CrossRef]
  35. Grêt-Regamey, A.; Sirén, E.; Brunner, S.H.; Weibel, B. Review of Decision Support Tools to Operationalize the Ecosystem Services Concept. Ecosyst. Serv. 2017, 26, 306–315. [Google Scholar] [CrossRef] [Green Version]
  36. Naboni, E.; Natanian, J.; Brizzi, G.; Florio, P.; Chokhachian, A.; Galanos, T.; Rastogi, P. A Digital Workflow to Quantify Regenerative Urban Design in the Context of a Changing Climate. Renew. Sustain. Energy Rev. 2019, 113, 109255. [Google Scholar] [CrossRef]
  37. Oliver, A.; Pearl, D.S. Rethinking Sustainability Frameworks in Neighbourhood Projects: A Process-Based Approach. Build. Res. Inf. 2018, 46, 513–527. [Google Scholar] [CrossRef]
  38. Badach, J.; Kolasińska, P.; Paciorek, M.; Wojnowski, W.; Dymerski, T.; Gębicki, J.; Dymnicka, M.; Namieśnik, J. A Case Study of Odour Nuisance Evaluation in the Context of Integrated Urban Planning. J. Environ. Manage. 2018, 213, 417–424. [Google Scholar] [CrossRef] [PubMed]
  39. Hollberg, A.; Tschetwertak, J.; Schneider, S.; Habert, G. Designing Sustainable Technologies, Products and Policies; Springer International Publishing: Cham, Switzerland, 2018; ISBN 9783319669816. [Google Scholar]
  40. Landscape Institute. BIM for Landscape; Taylor & Francis: Abingdon, UK, 2016; ISBN 9781317634003. [Google Scholar]
  41. Peluchetti, A.; Elagiry, M.; Perfido, D.; Cortese, M.; Costa, A. Nature4Cities. Tools for Implementation of Nature-Based Solutions in City Context: The Case Study of Milan. In Nature-based Solutions for Sustainable Urban Planning; Springer: Berlin/Heidelberg, Germany, 2022; pp. 147–169. [Google Scholar]
  42. Voskamp, I.M.; de Luca, C.; Polo-Ballinas, M.B.; Hulsman, H.; Brolsma, R. Nature-Based Solutions Tools for Planning Urban Climate Adaptation: State of the Art. Sustainability 2021, 13, 6381. [Google Scholar] [CrossRef]
  43. Egusquiza, A.; Arana-Bollar, M.; Sopelana, A.; Babí Almenar, J. Conceptual and Operational Integration of Governance, Financing, and Business Models for Urban Nature-Based Solutions. Sustainability 2021, 13, 11931. [Google Scholar] [CrossRef]
  44. Davis, D. Modelled on Software Engineering: Flexible Parametric Models in the Practice of Architecture. Ph.D. Thesis, RMIT University, Melbourne, Australia, 2013. [Google Scholar]
  45. Muetzelfeldt, R.I.; Massheder, J. The Simile Visual Modelling Environment. Eur. J. Agron. 2003, 18. [Google Scholar] [CrossRef] [Green Version]
  46. Babi Almenar, J. Characterisation, Biophysical Modelling and Monetary Valuation of Urban Nature-Based Solutions as a Support Tool for Urban Planning and Landscape Design. Ph.D. Thesis, University of Bordeaux, Bordeaux, France, University of Trento, Trento, Italy, 2021. [Google Scholar]
  47. Costanza, R.; de Groot, R.; Sutton, P.; van der Ploeg, S.; Anderson, S.J.; Kubiszewski, I.; Farber, S.; Turner, R.K. Changes in the Global Value of Ecosystem Services. Glob. Environ. Chang. 2014, 26, 152–158. [Google Scholar] [CrossRef]
  48. de Groot, R.; Brander, L.; van der Ploeg, S.; Costanza, R.; Bernard, F.; Braat, L.; Christie, M.; Crossman, N.; Ghermandi, A.; Hein, L.; et al. Global Estimates of the Value of Ecosystems and Their Services in Monetary Units. Ecosyst. Serv. 2012, 1, 50–61. [Google Scholar] [CrossRef]
  49. Troy, A.; Wilson, M.A. Mapping Ecosystem Services: Practical Challenges and Opportunities in Linking GIS and Value Transfer. Ecol. Econ. 2006, 60, 435–449. [Google Scholar] [CrossRef]
  50. De Bruyn, S.; Ahdour, S.; Bijleveld, M.; De Graaff, L.; Schep, E.; Schroten, A.; Vergeer, R. Environmental Prices Handbook 2017-Methods and Numbers for Valuation of Environmental Impacts. Delft CE Delft 2018, 5–2018. [Google Scholar]
  51. ESValues. ESValues Platform: Collaborative Platform on Economic Data from Ecosystem Services Studies. Available online: http://www.esvalues.org/ (accessed on 20 October 2021).
  52. EVRI. The Environmental Valuation Reference Inventory. Available online: https://www.evri.ca/ (accessed on 20 October 2021).
  53. Petucco, C.; Babí Almenar, J.; Rugani, B.; Maider, A.; Usobiaga, E.; Sopelana, A.; Hernando, S.; Egusquiza, A.; Yilmaz, O.; Naneci, S.; et al. Development of a Monetary Value Scale in MIMES: Deliverable 4.2 of Nature Based Solutions for Re-Naturing Cities: Knowledge Diffusion and Decision Support Platform through New Collaborative Models. 2018. Available online: https://www.list.lu/fileadmin/files/projects/Deliverable_4.2_-_Extract___Released_on_15.12.18.pdf (accessed on 10 November 2022).
  54. Plummer, M.L. Assessing Benefit Transfer for the Valuation of Ecosystem Services. Front. Ecol. Environ. 2009, 7, 38–45. [Google Scholar] [CrossRef] [Green Version]
  55. Brouwer, R.; Navrud, S. The Use and Development of Benefit Transfer in Europe. In Benefit Transfer of Environmental and Resource Values: A Guide for Researchers and Practitioners; Johnston, R.J., Rolfe, J., Rosenberger, R.S., Brouwer, R., Eds.; Springer: Dordrecht, The Netherlands, 2015; pp. 71–83. ISBN 978-94-017-9930-0. [Google Scholar]
  56. RIBA. RIBA Plan of Work. 2013. Available online: https://www.architecture.com/knowledge-and-resources/resources-landing-page/riba-plan-of-work (accessed on 20 October 2020).
  57. Gutleben, C.; Goumot, P. Recensement Du Patrimoine Arboré Des Alignements Urbains et de La Répartition Des Essences; Plante & Cité: Angers, France, 2015. [Google Scholar]
  58. R Core Team. R: A Language and Environment for Statistical Computing; R Core Team: Vienna, Austria, 2020. [Google Scholar]
  59. Almeida, A.C.; Sands, P.J. Improving the Ability of 3-PG to Model the Water Balance of Forest Plantations in Contrasting Environments. Ecohydrology 2016, 9, 610–630. [Google Scholar] [CrossRef]
  60. Grandison, A. Determining Confidence Intervals, and Convergence, for Parameters in Stochastic Evacuation Models. Fire Technol. 2020, 56, 2137–2177. [Google Scholar] [CrossRef] [Green Version]
  61. Hauschild, M.Z.; Rosenbaum, R.K.; Olsen, S.I. Life Cycle Assessment, 1st ed.; Hauschild, M.Z., Rosenbaum, R.K., Olsen, S.I., Eds.; Springer International Publishing: Cham, Switzerland, 2018; ISBN 978-3-319-56474-6. [Google Scholar]
  62. Huijbregts, M.A.J.; Steinmann, Z.J.N.; Elshout, P.M.F.; Stam, G.; Verones, F.; Vieira, M.; Zijp, M.; Hollander, A.; van Zelm, R. ReCiPe2016: A Harmonised Life Cycle Impact Assessment Method at Midpoint and Endpoint Level. Int. J. Life Cycle Assess. 2017, 22, 138–147. [Google Scholar] [CrossRef]
  63. Montague, T.; Kjelgren, R.; Allen, R.; Wester, D. Water Loss Estimates for Five Recently Transplanted Landscape Tree Species in a Semi-Arid Climate. J. Environ. Hortic. 2004, 22, 189–196. [Google Scholar] [CrossRef]
  64. Huttner, S.; Bruse, M. Numerical Modeling of the Urban Climate—A Preview on ENVI-Met 4.0. In Proceedings of the 7th international conference on urban climate ICUC-7, Yokohama, Japan, 29 June–3 July 2009; Volume 29. [Google Scholar]
  65. Armstrong, K. Emerging Industrial Applications. In Carbon Dioxide Utilisation; Elsevier: Amsterdam, The Netherlands, 2015; pp. 237–251. [Google Scholar]
  66. Altunok, T.; Cakmak, T. A Technology Readiness Levels (TRLs) Calculator Software for Systems Engineering and Technology Management Tool. Adv. Eng. Softw. 2010, 41, 769–778. [Google Scholar] [CrossRef]
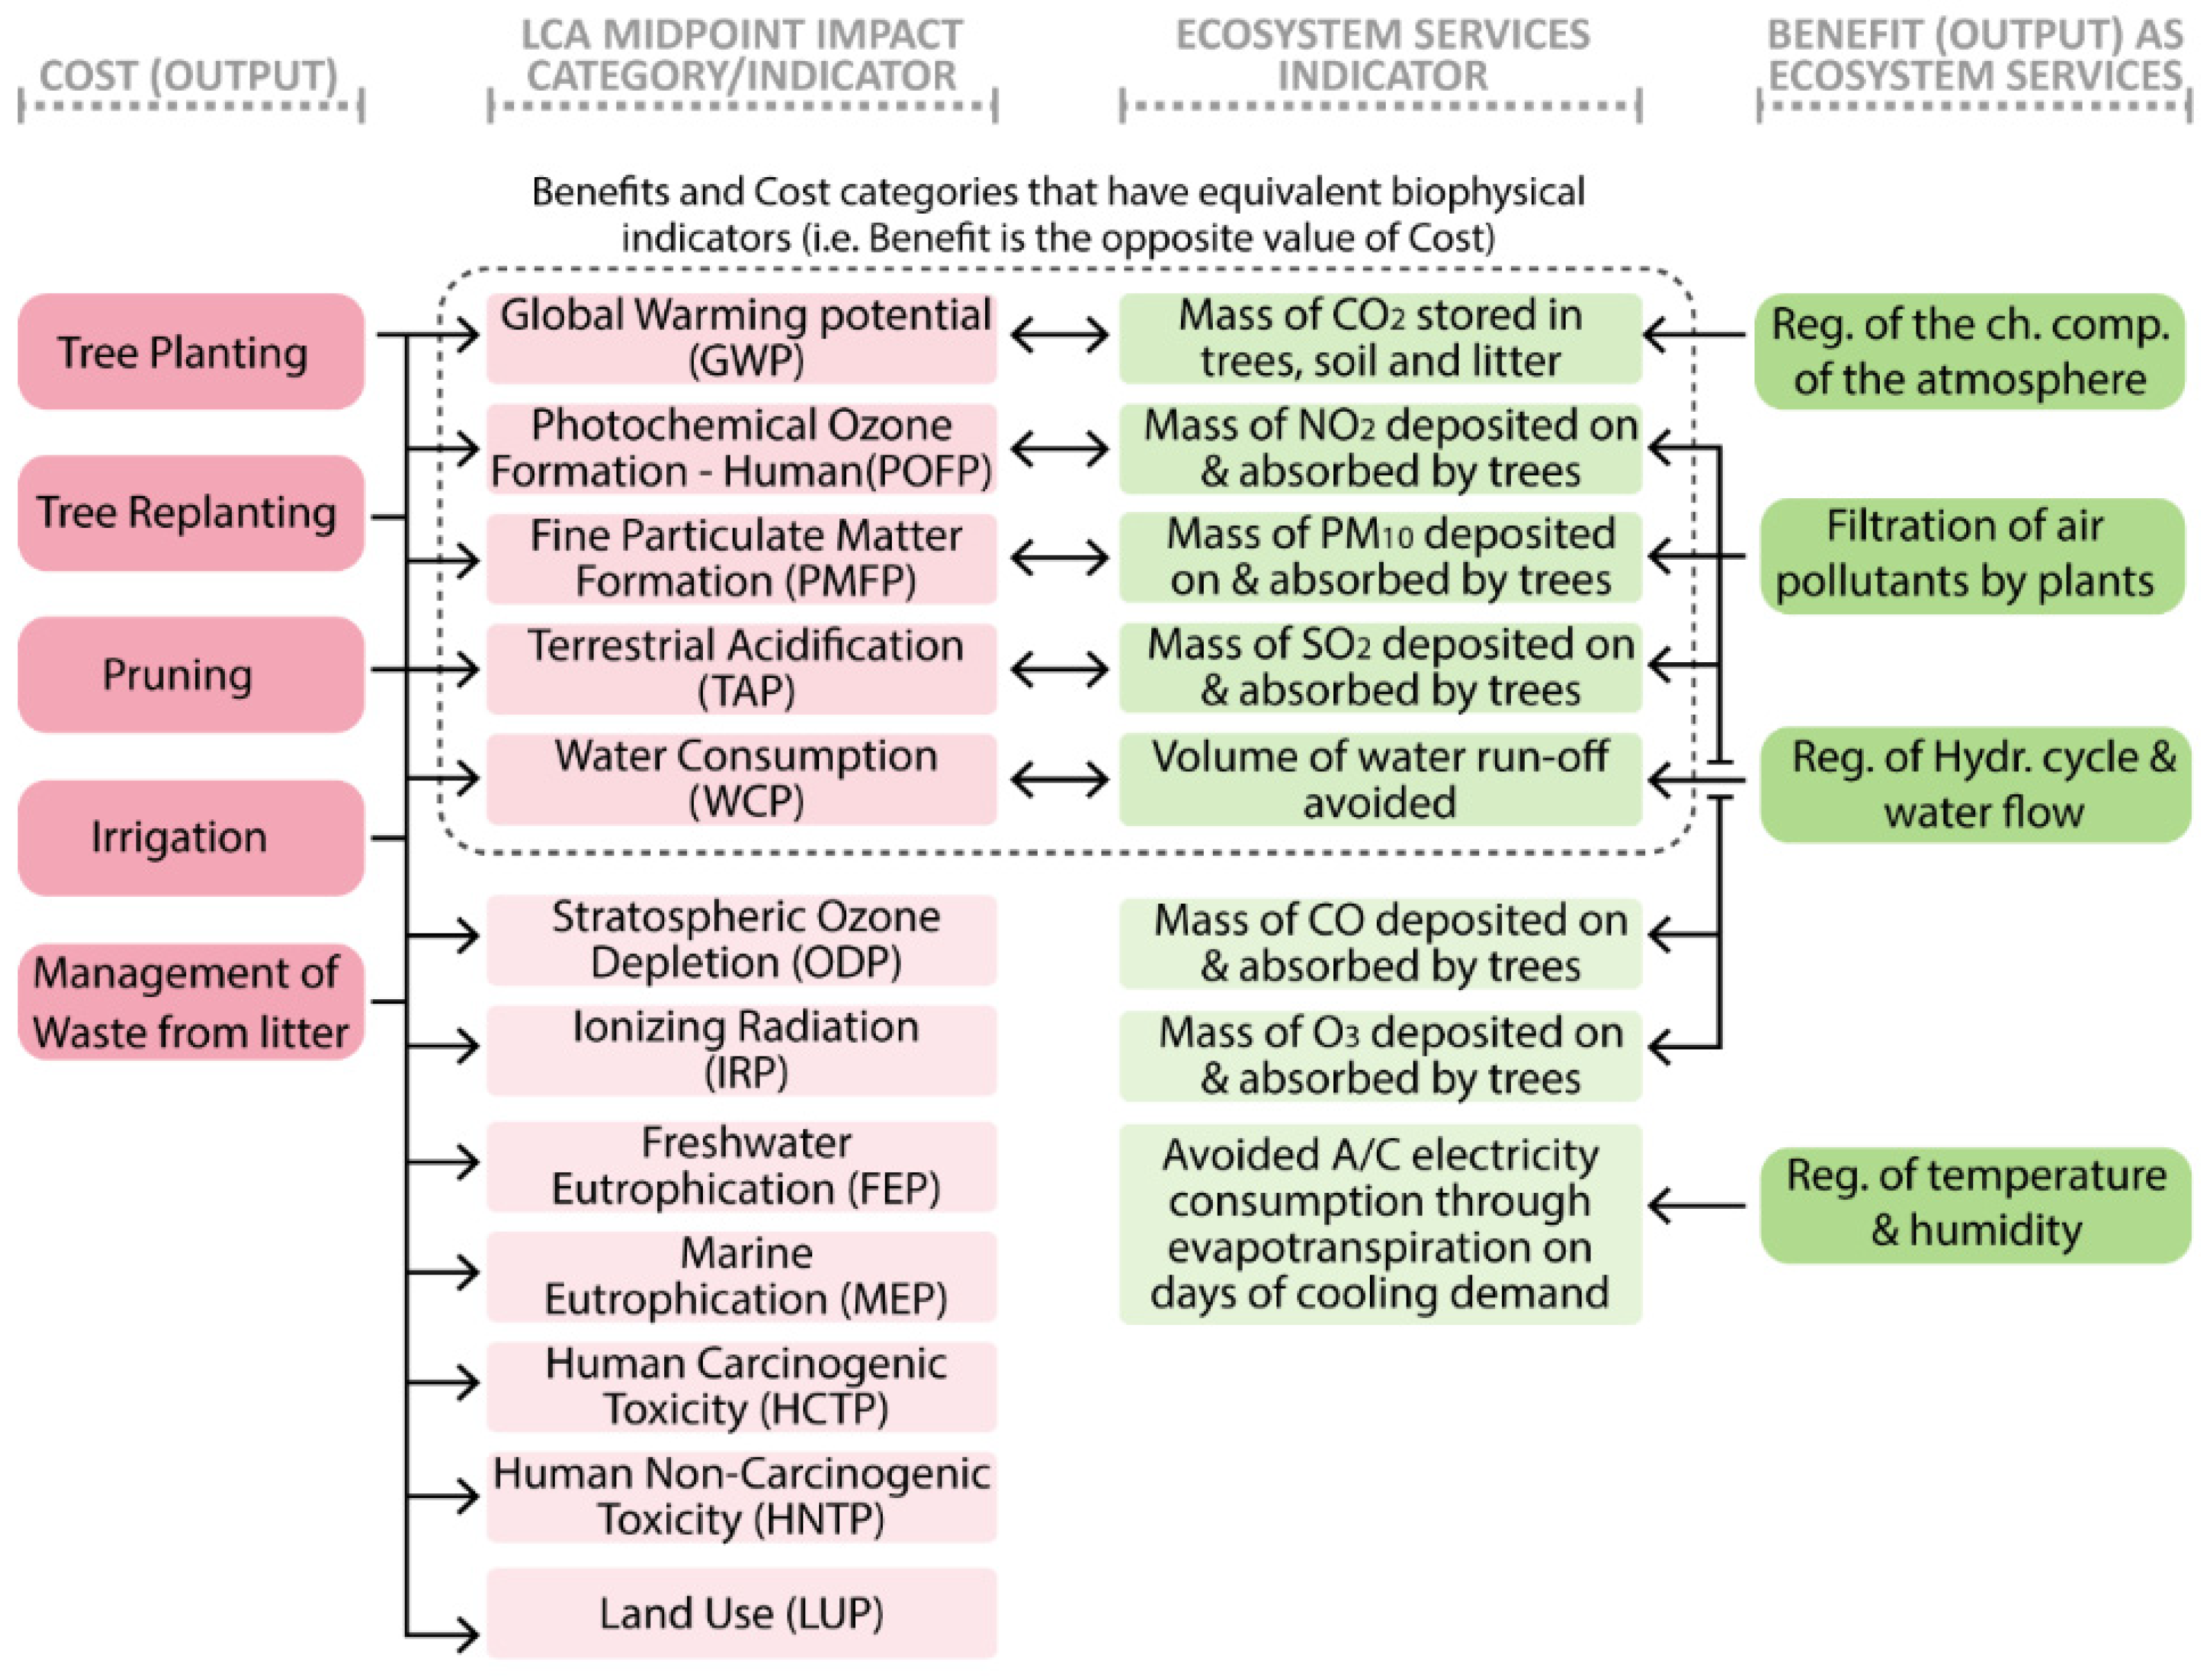
Figure 1. The MacLeamy curve (see [40,44]) for a detailed description). It illustrates the increasing cost of modifications in projects as the design/planning process progresses.
Land 12 00070 g001
Figure 2. Schematic diagram of the design, building, and operation steps characterising NBenefit$.
Land 12 00070 g002
Figure 3. Biophysical indicators that represent cost and benefits in the form of negative and positive environmental impacts. The cost and benefits with equivalent indicators are highlighted. All the costs (outputs) contribute to environmental impacts represented by life cycle assessment (LCA) midpoint impact categories.
Land 12 00070 g003
Figure 4. Biotic, abiotic, and management attributes that define urban forest archetypes in the system dynamics model underneath NBenefit$.
Land 12 00070 g004
Figure 5. Relationship between the main components of NBenefit$ and their outputs; CBA = costs-benefits analysis; ES = ecosystem services; API = application programming interface.
Land 12 00070 g005
Figure 6. NBenefit$ web user interface, components, and description.
Land 12 00070 g006
Figure 7. Online summary of the cost-benefit analysis and graph visualisation generated by the web user interface in NBenefit$.
Land 12 00070 g007
Figure 8. Figure 8. Attributes of 48 illustrative urban forest archetypes modelled for the local conditions of Barajas in the northeast of Madrid (Spain). An example of how to read the attributes of each archetype, and which combination of attributes corresponds to each archetype number, is provided at the bottom.
Land 12 00070 g008
Figure 9. Mean cumulative benefits and costs over the operational stage of the 48 urban forest archetypes in biophysical units.
Land 12 00070 g009
Figure 10. Mean cumulative benefits and costs (externalities and financial) over the operational phase of the 48 urban forest archetypes in monetary units.
Land 12 00070 g010
Figure 11. Comparison of biophysical and monetary performance over time for “Management of waste from litter” in archetypes 1, 2, and 48. Results are shown as cumulative values over time (i.e., value at year 50 is the accumulated value from year 1 to 50).
Land 12 00070 g011
Figure 12. Comparison of biophysical and monetary performance over time for “Regulation of chemical condition of the atmosphere” in archetypes 1, 2, and 48. Results are shown as cumulative values over time (i.e., value at year 50 is the accumulated value from year 1 to 50).
Land 12 00070 g012
Figure 13. Comparison of biophysical and monetary performance over time for “Regulation of temperature and humidity” in archetypes 1, 2, and 48. Results are shown as non-cumulative values (i.e., values represent the ones produced each year) to illustrate more clearly that this ecosystem service is not continuously increasing over time.
Land 12 00070 g013
Figure 14. Characteristics of three hypothetical alternatives for a small urban forest of 0.1 Ha.
Land 12 00070 g014
Table 1. Costs and benefits of urban forests, the main processes influencing outputs, and the main attributes influencing processes.
Costs and Benefits Life Cycle Phase Main Processes Main Biotic, Abiotic, and Management Attributes
Management Actions (COSTS)Tree planting *ImplementationTree management in nurseries, transport to site, plantingSpecies, initial tree size/age at planting, average transport distance, planting techniques and machinery
Amount of tree replanting **
(due to premature death)
OperationalPlants morbidity and plant mortalitySpecies, initial tree size, stress factors (paving, drought, waterlogging), mortality statistics ***
PruningOperationalVegetation growth (branches)Species, initial tree size, percent of branch to be pruned, pruning techniques and machinery
IrrigationOperationalStorage of available soil water, soil evaporation, vegetation transpiration, infiltration, percolationSoil texture, initial available soil water
Management of waste from litter and dead woodEnd-of-lifeLeaf, branch decay, and plant mortalitySpecies, initial tree size, mortality records, branch and leaf decay rate, plant management
Ecosystem Services (BENEFITS)Regulation of the chemical composition of the atmosphereOperationalVegetation growth, drought and waterlogging, deathSpecies, initial tree size, growth rate, decay rate, soil texture, threshold to stress factors
Regulation of temperature and humidityOperationalFree evaporation during rainy days, soil evaporation, vegetation transpirationSpecies, initial tree size, growth rate, ratio tree size to leaf area, daily precipitation, daily temperature, dormant periods (deciduous trees), soil texture, available soil water
Hydrological cycle and water flow regulationOperationalVegetation interception, infiltration, percolation, soil evaporation, vegetation transpirationSpecies, initial tree size, growth rate, ratio tree size to leaf area, daily precipitation, daily temperature, dormant periods (deciduous trees), soil texture, available soil water
Filtration of pollutants by plantsOperationalDry deposition, vegetation transpirationSpecies, initial tree size, tree height, growth rate, ratio tree size to leaf area, precipitation, temperature, air pollutant levels (CO, NO2, SO2, O3, PM10), wind, solar radiation
Notes: * Specific tree-planting schemes are decided by the landscape designer, the client, and in some cases, guided by external consultants as part of the design process. The model only accounts for the differences in cost due to species, size (age = amount of time in the nursery), and planting system. It does not integrate the fees paid to professionals working on a project. ** The model assumes that the same species and initial planting size are used for replanting if the tree dies. It assumes mandatory replanting after one year if the dead tree was planted less than 10 years ago, and after three years, if the dead tree was planted for the first time more than 10 years ago. *** Currently mortality statistics are taken from the existing literature but can be obtained from available local data.
Disclaimer/Publisher’s Note: The statements, opinions and data contained in all publications are solely those of the individual author(s) and contributor(s) and not of MDPI and/or the editor(s). MDPI and/or the editor(s) disclaim responsibility for any injury to people or property resulting from any ideas, methods, instructions or products referred to in the content.

