Article

Pollution Levels and Potential Health Risks of Potentially Toxic Elements in Indoor and Outdoor Dust during the COVID-19 Era in Gómez Palacios City, Mexico

by
Miguel Santoyo-Martínez
1,2,
Anahí Aguilera
1,
Ángeles Gallegos
1,
Cristo Puente
3,
Avto Goguitchaichvili
1,4,* and
Francisco Bautista
1,*
1
Laboratorio Universitario de Geofísica Ambiental, Centro de Investigaciones en Geografía Ambiental, Universidad Nacional Autónoma de México, Morelia 58190, Mexico
2
Laboratorio de Geoquímica Ambiental, Centro de Investigación en Ciencias Agrícolas, Instituto de Ciencias, Benemérita Universidad Autónoma de Puebla, Puebla 72000, Mexico
3
Instituto Nacional de Investigaciones Forestales, Agrícolas y Pecuarias, Durango 35079, Mexico
4
Geophysics, Department of Physics, University of Alberta, Edmonton, AB T6G 2E1, Canada
*
Authors to whom correspondence should be addressed.
Land 2023, 12(1), 29; https://doi.org/10.3390/land12010029
Submission received: 1 December 2022 / Revised: 15 December 2022 / Accepted: 20 December 2022 / Published: 22 December 2022
(This article belongs to the Special Issue The Eco-Environmental Effects of Urban Land Use)

Abstract

:
The COVID-19 pandemic has caused a decrease in outdoor activities, but an increase in indoor ones. This change in the intensity of land use has caused changes in pollution patterns. Urban dust contaminated with heavy metals can be a risk to the human population. Therefore, the objective of this work was to evaluate the pollution caused by heavy metals in urban dust indoors and outdoors due to changes in land use during the pandemic. Sampling was carried out by the Gomez Palacio citizens. The total number of urban dust samples was 330, 50% indoor samples and 50% outdoor sample. The elements studied were Ca, Cu, Fe, K, Mn, Ni, Pb, Rb, Sr, Ti, Y, Zn, and Zr. The heavy metals were measured through a portable XRF; the contamination factor and the load pollution index were used to assess the pollution level. The human health risk was evaluated with the USEPA methodology. Cu, Pb, and Zn presented higher concentrations indoors than outdoors, probably due to domestic factors, such as the age of the houses and the paint on the walls. Zn presented the highest pollution level among all the metals, outdoors and indoors; spatially, the sites sampled in the northwest, close to agricultural areas, presented the highest Zn pollution. Pb had a moderate pollution level in most of the samples (60%), but some samples showed a high Pb pollution. The health risk was considered within the acceptable levels for Cu, Fe, Ni, Pb, Zn. However, Mn deserves attention because the average of the samples slightly exceeded the USEPA safety limits for children. Children are at higher risk compared to adults. Indoor environments need to be better analyzed because they were shown to represent a higher risk to the population than outdoor ones due to heavy metal pollution by Zn, Cu, and Pb. The pandemic impacted land use intensity; this study reports an apparent effect of the pandemic on the amount and type of heavy metals indoors and outdoors.

1. Introduction

The SARS-CoV-2 pandemic, causing COVID-19 [1], has resulted in unprecedented restrictions of mobility, education, and economic activities for a prolonged period in many cities around the world [2,3]. This situation has increased the activity and energy consumption in homes. Therefore, the indoor air quality has become important when considering its effect on health. These unique conditions offer a great opportunity to compare the effects of changes in human activities on urban dust quality [3].
Urban dust is composed of fine and coarse particles. It is a mixture of natural soil, soil from other places, car emissions of particles, particles from car wear, and particles from the wear and tear of roads, houses, and buildings [4,5]. Urban dust contains heavy metals, carbon, magnetic particles, microplastics, and other pollutants.
Heavy metals in urban dust are of great importance because some particles have diameters less than 10 μm and can enter the human body through ingestion and inhalation, adversely affecting health [6,7,8,9]. Elements such as copper (Cu), chromium (Cr), nickel (Ni), lead (Pb), and zinc (Zn) can pose a risk to human health [8,10,11]. These heavy metals can accumulate in the tissues of organisms, affect the central nervous system, be deposited in the circulatory system, and disrupt the normal functioning of internal organs, are cofactors in the development of cardiovascular and respiratory diseases and can cause DNA damage [8,12,13].
In children, oral ingestion is the main route of exposure to pollutants in homes [13,14,15,16]. Ingested urban dust arrives at the gastrointestinal tract, where heavy metals are partially dissolved and enter the circulatory system, finally accumulating in the tissues and organs of the human body [17,18].
Pollution assessments are usually carried out in the air (atmosphere) [3] or by examining street dust (pedosphere), and their results are associated with the type and intensity of land use [5,19]. The COVID-19 pandemic has offered an excellent opportunity to determine the degree of pollution reduction due to less urban land use in external environments.
This study aimed to compare the pollution levels and potential health risks of potentially toxic elements in indoor and outdoor dust during the COVID-19 era in Gómez Palacios City, Mexico.

2. Materials and Methods

Gómez Palacios is a city located in the state of Durango, Mexico, at 25°32′ and 25°54′ north latitude and 103°19′ and 103°42′ west longitude, between 1100 and 1800 m of altitude. It is the tenth most populated metropolitan area in Mexico, with 327,985 inhabitants and a density of 389.03 inhabitants/km2. It has an arid semi-warm climate with rain in summer, an annual precipitation of 225 mm, and an annual average temperature of 22.6 °C (Figure 1). The main soil groups surrounding the city are Calcisol, Regosol, Solonetz, and Solonchak [20].
The samples were collected in May 2020 during the COVID-19 pandemic by citizens interested in the project. Forty-three participants collected the samples in forty-three sites indoors and outdoors, with four repetitions, one per week, with a total of n = 330 samples.
The sampling of urban dust was carried out by sweeping 1 m2 of street surface and total indoor surface. The samples were packaged in plastic bags and geo-referenced. A video was made to train the participating citizens, giving instructions for collecting the urban dust samples indoors and outdoors. The video was distributed through social networks, https://www.youtube.com/watch?v=9w-aDYIbYp0&ab_channel=F.Bautista%2CSuelos%2Cambienteyalgom%C3%A1s (accessed on 1 December 2022). We invited the population to participate in the project through interviews on internet portals, the radio, and the television.
We developed a smartphone app for citizen sampling; the app contains information modules about the participant, the house data, and the urban dust samples. The sampling area was 1 m2 on the sidewalk, and all the dust was collected indoors. Gravel, branches, and leaves were removed manually. The samples were kept for two weeks in a cool and dry place (Figure 1).

2.1. Geochemical Analysis

The dust samples (n = 330) were sieved using a #60 mesh sieve with an aperture of 0.250 mm. Three grams of dry powder sample was placed in a Teflon cup with a 3.6 µm thick Mylar (polyester) film bottom window. The concentrations of 13 elements (Ca, Cu, Fe, K, Mn, Ni, Pb, Rb, Sr, Ti, Y, Zn, and Zr) were determined using a Genius 7000 XRF portable spectrometer from Skyray Instruments: an X-ray tube of −50 kV with a large-area beryllium-window silicon shunt detector. Three repetitions were carried out (with an integration time τ of 60 s each) [21].
An internationally certified reference standard for rocks and soils was used. For this study, the standard with identification code IGLs-1 (a lateritic soil sample with a set of eight geochemical reference materials) was considered as a measurement control [22]. The technique for measuring the concentration of total elements using the mobile X-ray fluorescence equipment was previously calibrated [21].
After the measurements, the monthly mean concentrations were calculated for each house (sampling site), and those means were used to perform the statistical analysis and the assessments.

2.2. Assessment of Pollution

The data did not present a normal distribution according to Shapiro–Wilks; therefore, a non-parametric Kruskal–Wallis test was used to compare the concentrations of the elements indoors and outdoors. Statgraphics Centurion XVI.I software was used.
Principal component analysis (PCA) was used as a qualitative pattern recognition method to determine the sources that enriched the dust with the heavy metals. The PCA analysis extracts a small number of factors to determine the relationships between the observed variables.
Each PC contains information on all the chemical elements present in a single group, while the loads of each element indicate their relative contribution to the group’s formation [5,23].
The degree of pollution was estimated by the contamination factor (CF), defined as (Equation (1)):
CF = Cn/Bn
where Cn is the concentration of the analyzed element in each sample (for example, Pb, Cu, etc.), and Bn is the background value for each element.
A CF less than 1 indicates insignificant pollution, of 1–3 moderate pollution, of 3–6 considerable pollution, and of more than 6 high pollution [24].
We used two background values: the first decile for indoor and outdoor dust and global background values for the soils [25].
A georeferenced data matrix based on the CF was constructed. For the site evaluation, the pollutant load index (PLI) was calculated considering the contamination factors of Cu, Mn, Ni, Pb, Sr, Zn, and Zr. The CF values per element were represented as pie graphs of the locations of the sampling sites. The size of the pie chart refers to the value of the PLI.
To relate the CF of the elements with different land uses to the possible sources of heavy metals, the sampling points were displayed in Google Earth. ArcGIS 10.6 software was used to create the maps.

2.3. Risk to Human Health

The methodology developed by the United States Environmental Protection Agency (USEPA) was used to estimate the health risk from heavy metals in urban dust. First, the estimated daily intake was calculated for the three main routes of exposure: ingestion (EDI), inhalation (EDIinh), and dermal contact (EDIing) (Equations (2)–(4)); we also calculated the lifetime average daily dose (LADD) to estimate the carcinogenic risk (Equation (5)).
EDI ing = (C × IngR × ED × CF)/(BW × AT)
EDI inh = (C × InhR × ED × EF)/(PEF × BW × AT)
EDI dermal = (C × SA × AF × ABS × EF × ED × CF)/(BW × AT)
LADD = (C)/(PEF × AT can) × ((CR child × EF child × ED child)/(BW child) + (CR adult × EF adult × ED adult )/(BW adult))
where CR is the contact rate (or absorption); CR = IngR for ingestion, CR = InhR for inhalation, and CR = SA × AF × ABS for dermal contact. The type of CR used for each carcinogenic metal depends on the route of exposure by which it can cause cancer. All exposure factors used in this study were those established for reference populations and can be found in the Supplementary Material [5].
The risk ratios for ingestion, inhalation, and dermal contact (HQ ing/inh/derm) were obtained by dividing the EDI by the reference dose (RfD), as shown in the following Equation (6):
HQing/inh/derm = (EDIing/inh/derm)/RfD
The hazard index (HI) represents the sum of the HQs for the three exposure routes. If HI is >1, there is the possibility of producing a non-carcinogenic risk in the population’s health, whereas, if it is <1, the opposite is expected [26].
For carcinogens, the Incremental Lifetime Cancer Risk (ILCR) is commonly calculated using the following Equation (7):
ILCR = LADD × CDF
The accepted or tolerable risk ranges from 1 × 10⁻⁶ to 1 × 10⁻⁴ [26]. These values indicate that, in a population of 1,000,000, 1 in every 10,000 people has the probability of contracting some cancer [27].

3. Results

3.1. Elements Indoors and Outdoors

The concentrations of the elements measured showed the following pattern: Ca > Fe > K > Ti > Zn > Mn > Sr > Zr > Rb > Cu > Pb > Y > Ni, both indoors and outdoors. Ca, Fe, K are abundant in the Earth’s crust, and high concentrations are found in urban dust. Ti and Mn were also found in high concentrations [28]. On the other hand, the high concentrations of Zn, Cu, Pb, and Ni and their high values of standard deviation suggested that these elements derived mainly from sources of pollution such as vehicular flow, body materials, wear of automobile parts, brake use, tire wear, among others [5,29].
In indoor urban dust, the Cu, Pb, and Zn concentrations were higher than outdoors. On the contrary, in the urban dust outdoors, the concentration of the elements Ca, Mn, and Rb were higher than indoors. Urban dust contained equal concentrations of Fe, K, Ni, Si, Ti, Y, and Zr indoors and outdoors (Table 1).
The higher concentration of Cu, Pb, and Zn indoors can be attributed to the fact that these elements are found in common household objects, such as paint, ceramic glazes, batteries, and others [30,31,32].
Zn, Pb, Cu, Fe, Ni, and Mn are well known as elements of anthropic origin; in this study, Zn was positively related to Cu, Pb, and Fe, as well as to Mn, Ni, and Ti (Table 2). Fe and Mn can be considered major elements due to the magnitude of their concentrations (Table 1).
In contrast, Rb, K, Ca, Y, Sr, and Zr appeared to come from natural sources. Ca and K appeared as major elements due to the magnitude of their concentrations, which supports the idea of their natural origin.
Sr, Y, and Zr derived from natural sources, but concentrations higher than at least one with respect to the background levels were found for some unknown reason. That is, they behaved as polluting elements. Y and Sr showed a positive correlation, indicating the same origin (Table 2).
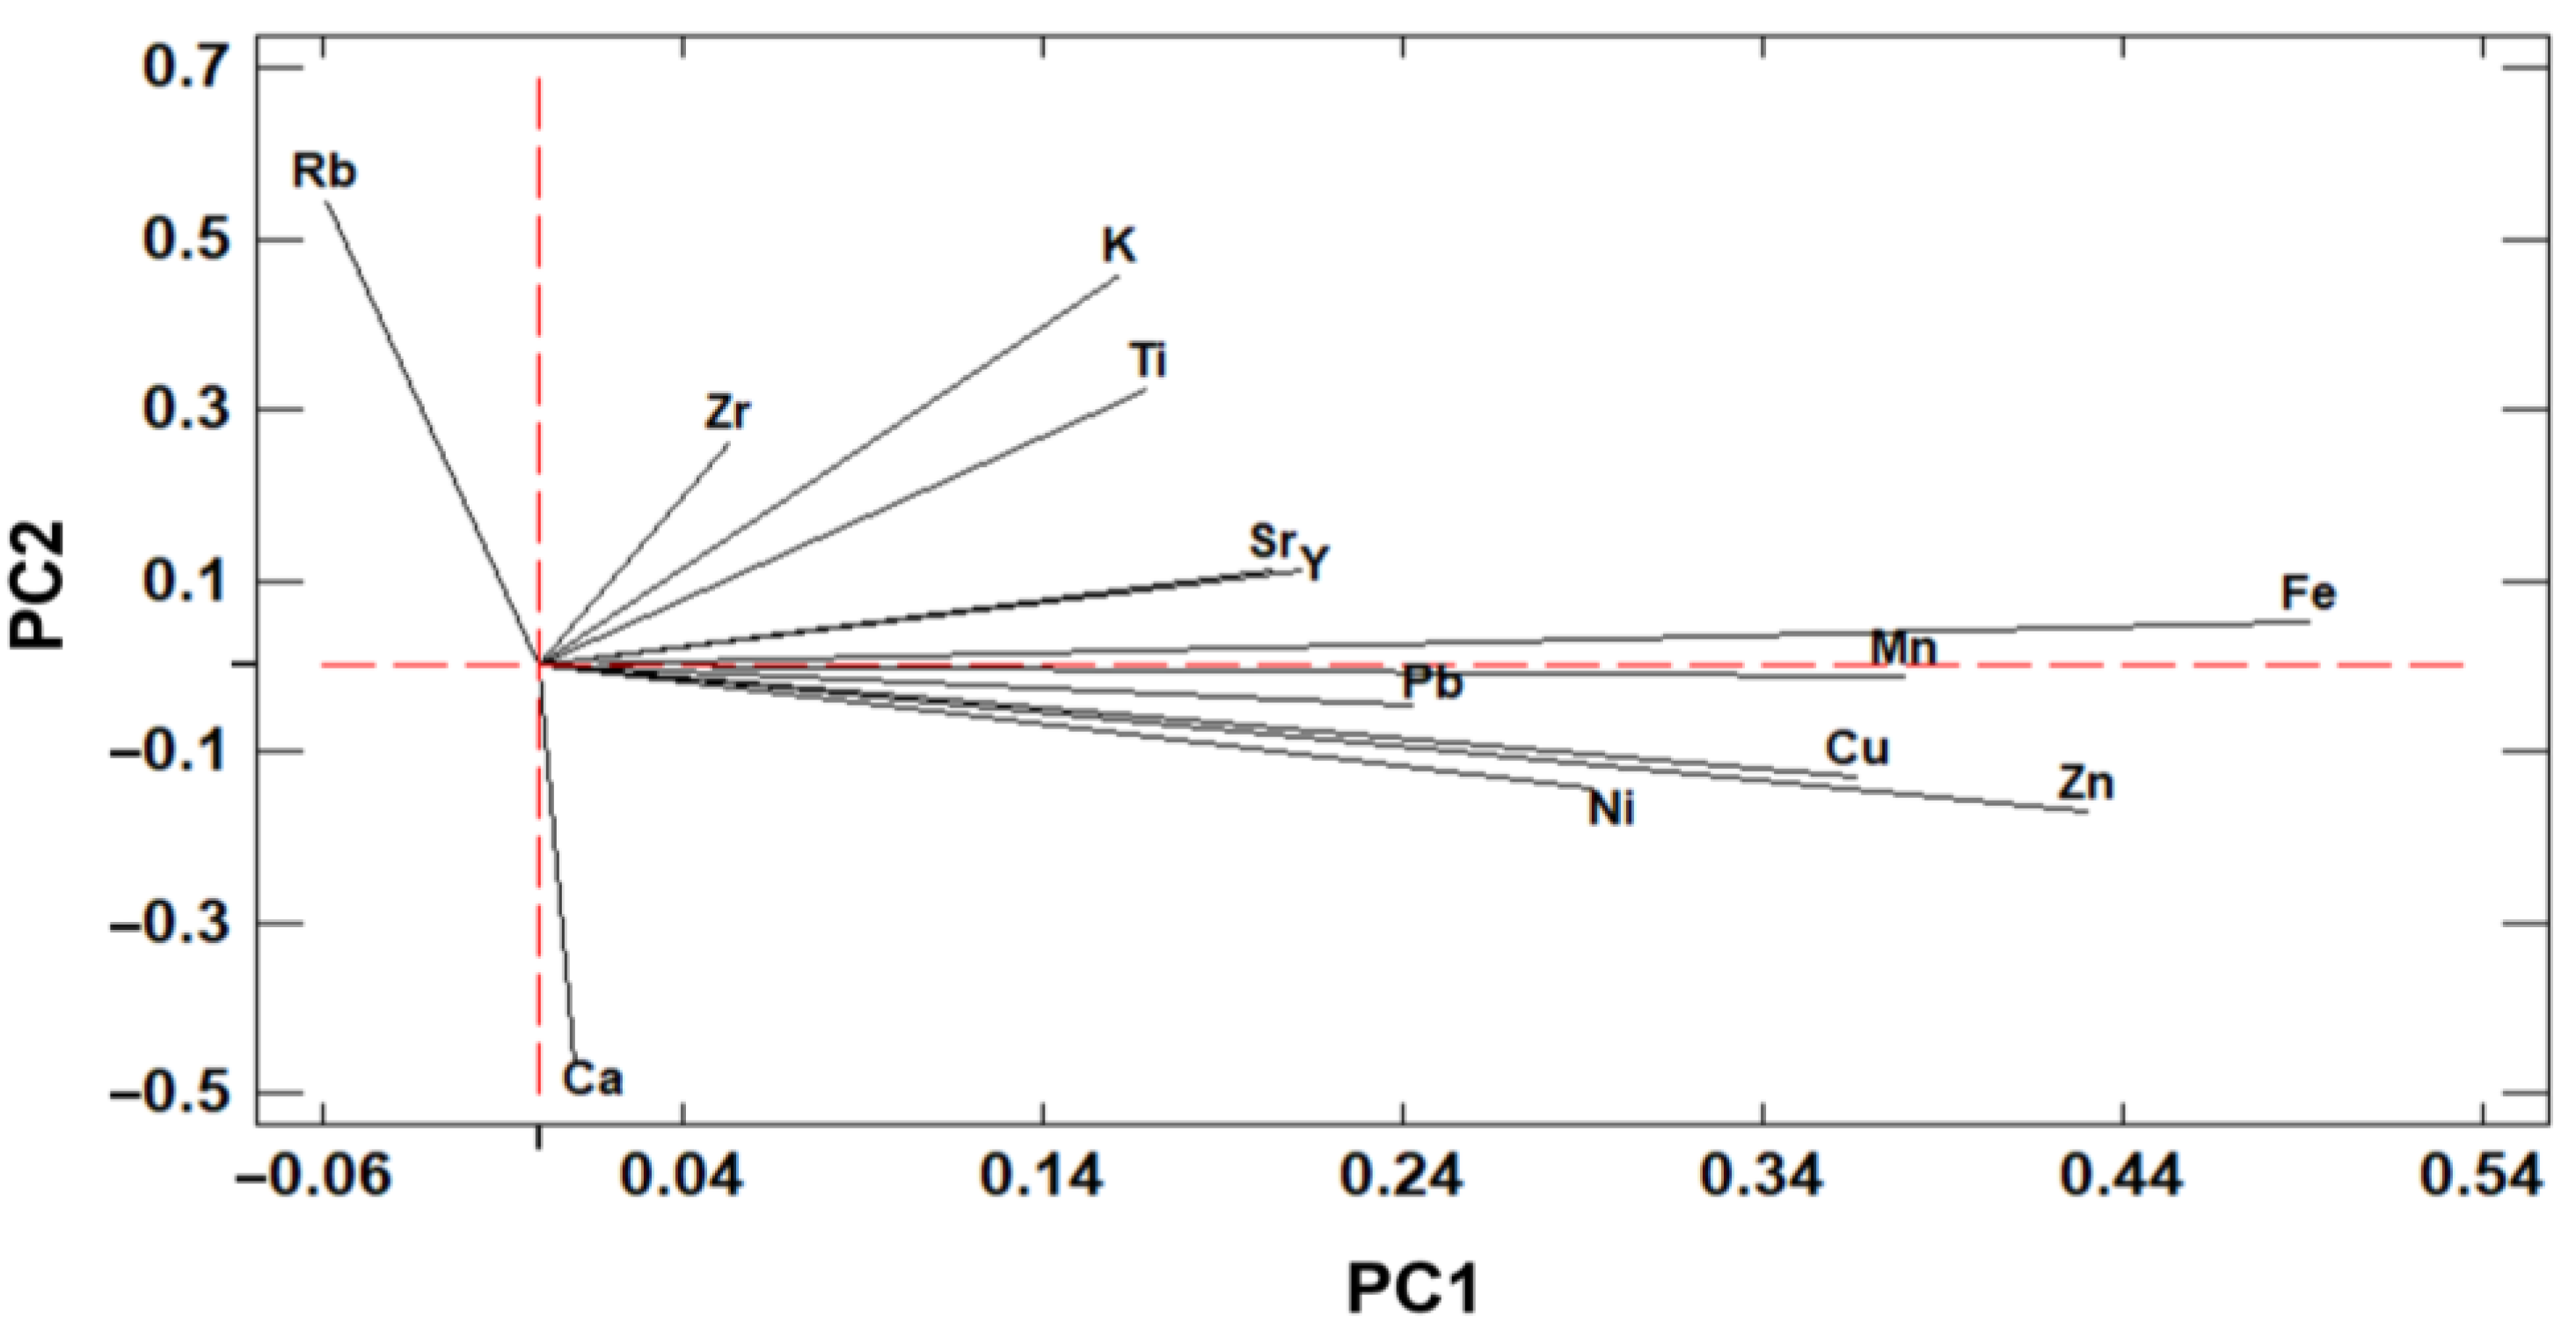
The results of the Principal Component Analysis of the outdoor samples showed that the first two components explained 43% of the total variance, and three main groups were identified: (1) Pb, Ni, Cu, Mn, Zn, and Fe revealed an anthropic source from vehicular traffic, fuel burning, and industrial activities; (2) Zr, K, Ti, Sr, Y presented a mixed source, from the natural soil of the area and from anthropic activities; and (3) Rb and Ca derived from other sources, perhaps of natural origin, in the area (Figure 2).
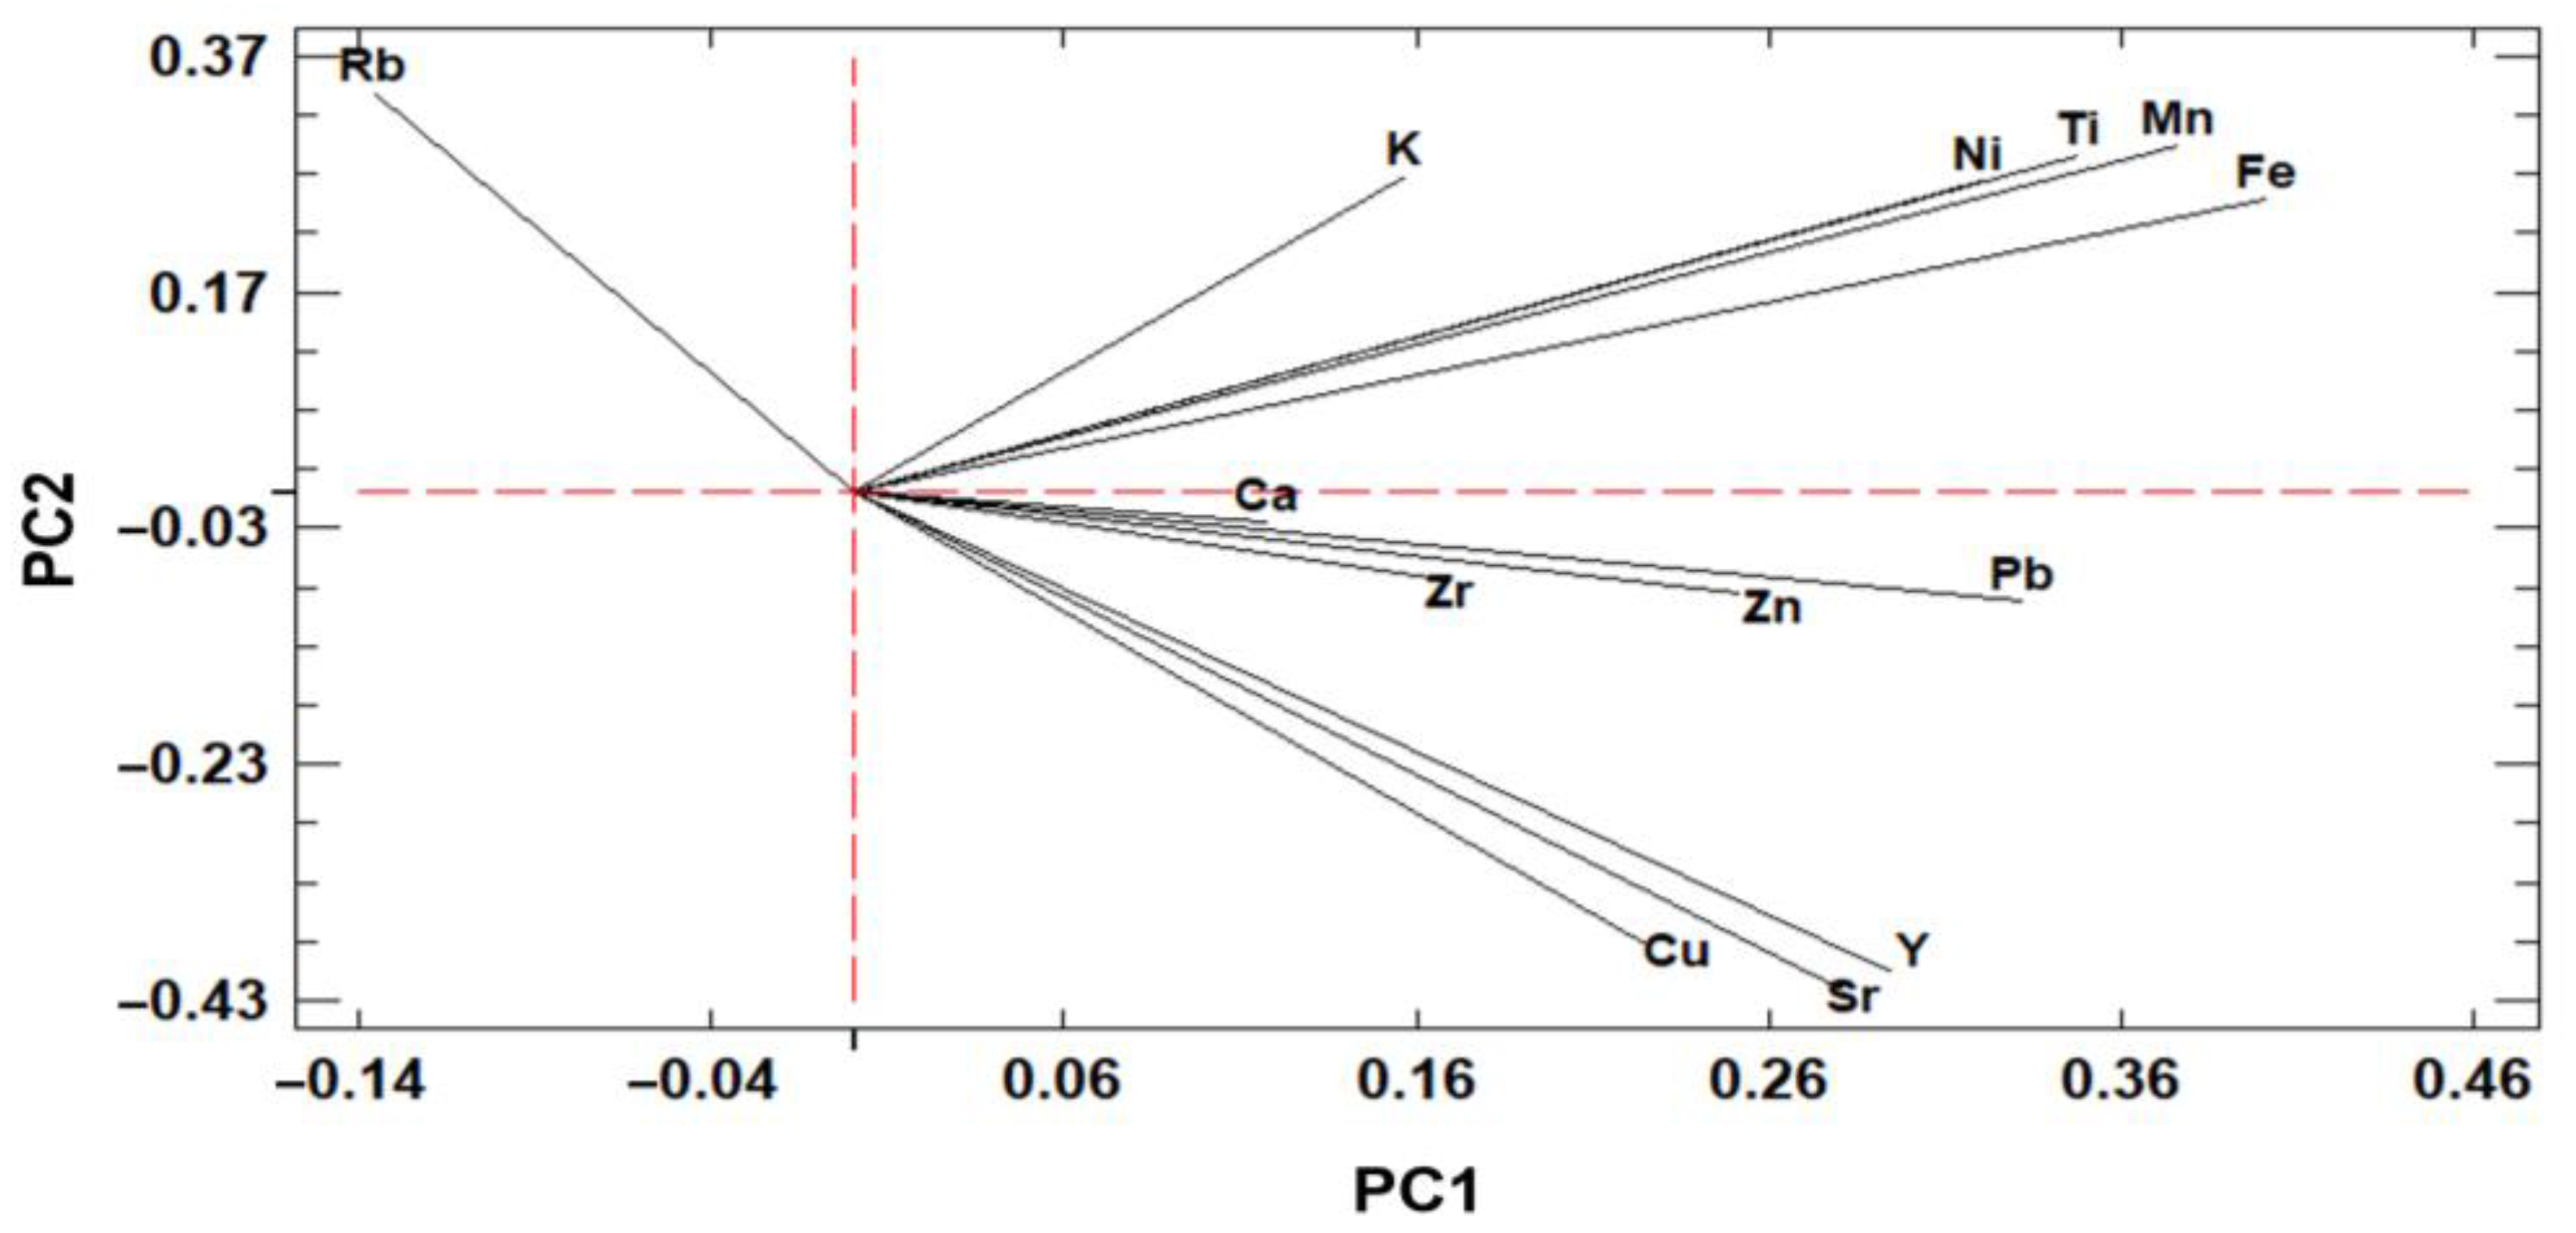
On the other hand, the first two components for the indoor samples explained 51% of the total variance. Three main groups were identified: (1) Pb, Zn, and Zr, and Ca deriving from an anthropogenic source, (2) Ti, Ni, Mn, and Fe from mixed sources, (3) Cu, Sr, Y from natural sources (Figure 3).
It is interesting that two different explanations are possible depending on whether we study the concentrations of the elements in urban dust in a single data set (Table 1 and Table 2) or we separate them into two sets (indoors and outdoors) (Figure 2 and Figure 3). If we study the data set as a whole, we lose the possibility of identifying the different behavioral patterns of the elements; for example, calcium is a natural element in street dust but an anthropic element in indoor dust, because calcium is in talc, in the walls of houses.

3.2. Assessment of Pollution

Cu, Mn, and Zn were the metals with the highest pollution levels; therefore, their CF results are shown separately from those of the other metals (Table 3). Using the first decile as the background value for Cu and Mn, the pollution classes were higher than when the world average in soils was used as the background value. In the case of Zn, the opposite was observed, with 74.5% of the samples reaching CF values greater than 6 (high pollution), and 52.7% of the samples with contamination factor values greater than 10.
The reference Zn concentrations are higher in Gómez Palacio than worldwide (world soil background). It is important to figure out where this metal comes from in the city. For Mn and Cu, there are higher concentrations naturally occurring in the soil worldwide than in the urban dust of Gómez Palacio. Therefore, the pollution level of Mn and Cu is higher using the local background (decile 1) than the global one. The contrary occurs for the Zn pollution level, which is higher with the global background value.
The first decile used as the background level allowed finding that Ni, Pb, Rb, Sr, Ti, Y, and Zr presented moderate pollution, with some extreme values (CF > 6) for Ni, Pb, Sr, Y, and Zr (Figure 4). The values of CF > 6 of Pb, Zr, and Ni indoors must be addressed by identifying their sources and increasing the cleanliness levels, since children could be at risk of poisoning by these metals.
The use of the average concentration in soils in the world as the background level allowed us to determine that: (a) Ni, Pb, Sr, Y, and to a lesser extent Zr, presented CF > 6; (b) Ti and Zr were not pollutants; (c) there was moderate pollution by Ni, Pb, Rb, Sr, and Y; and d) some samples of urban dust indoor reached values of considerable and high Pb pollution (Figure 5).
The high values of the contamination factors of Cu, Pb, Zn, Ni, and Zr indoors could be related to the time of construction of the houses [33,34], cigarette smoking [35], restricted ventilation [36], energy use, and heating [37,38]. Manganese is used to manufacture alloys, batteries, ceramics, paints, and products to preserve wood [33,34].

3.3. Proposal of Pollution Limits

Each city should have indicators to establish regulations on pollution in urban dust, in this case, on heavy metal concentrations; however, this is a difficult task to perform because it is required to define reference values for each element. We think a first reference value can be the background concentration for each element of interest. In this sense, we used two values: (a) one to establish the concentrations of each element and (b) the other for the average concentration of each element contained in the world soils.
The first decile of the concentrations of each element taken as a background value served to identify those elements that derived from anthropic sources and those elements that presented higher concentrations than a local value. On the other hand, using an average concentration of an element in the world soils as a background value allowed identifying elements naturally found in high concentrations and to which attention must be paid.
We propose to use the contamination factor to define four reference values that may serve for decision making by the authorities and the population (Table 4): (a) no contamination when CF < 1, i.e., concentrations of the element in urban dust are below the background concentration; (b) moderate contamination with a value of CF = 1–3, i.e., research is required, and it is recommended to increase street cleaning actions; (c) high contamination (CF = 3–6), indicating possible damage to health, i.e., it is considered mandatory to investigate the sources of pollution, pay special attention to the child population, and increase street and house cleaning measures and the use of face masks; (d) very high pollution (CF > 6), i.e., it is recommended to take immediate and extreme pollution mitigation actions, perhaps decreasing in vehicular traffic, the revision of chimneys in factories, among other actions [5,39].

3.4. Site Evaluation

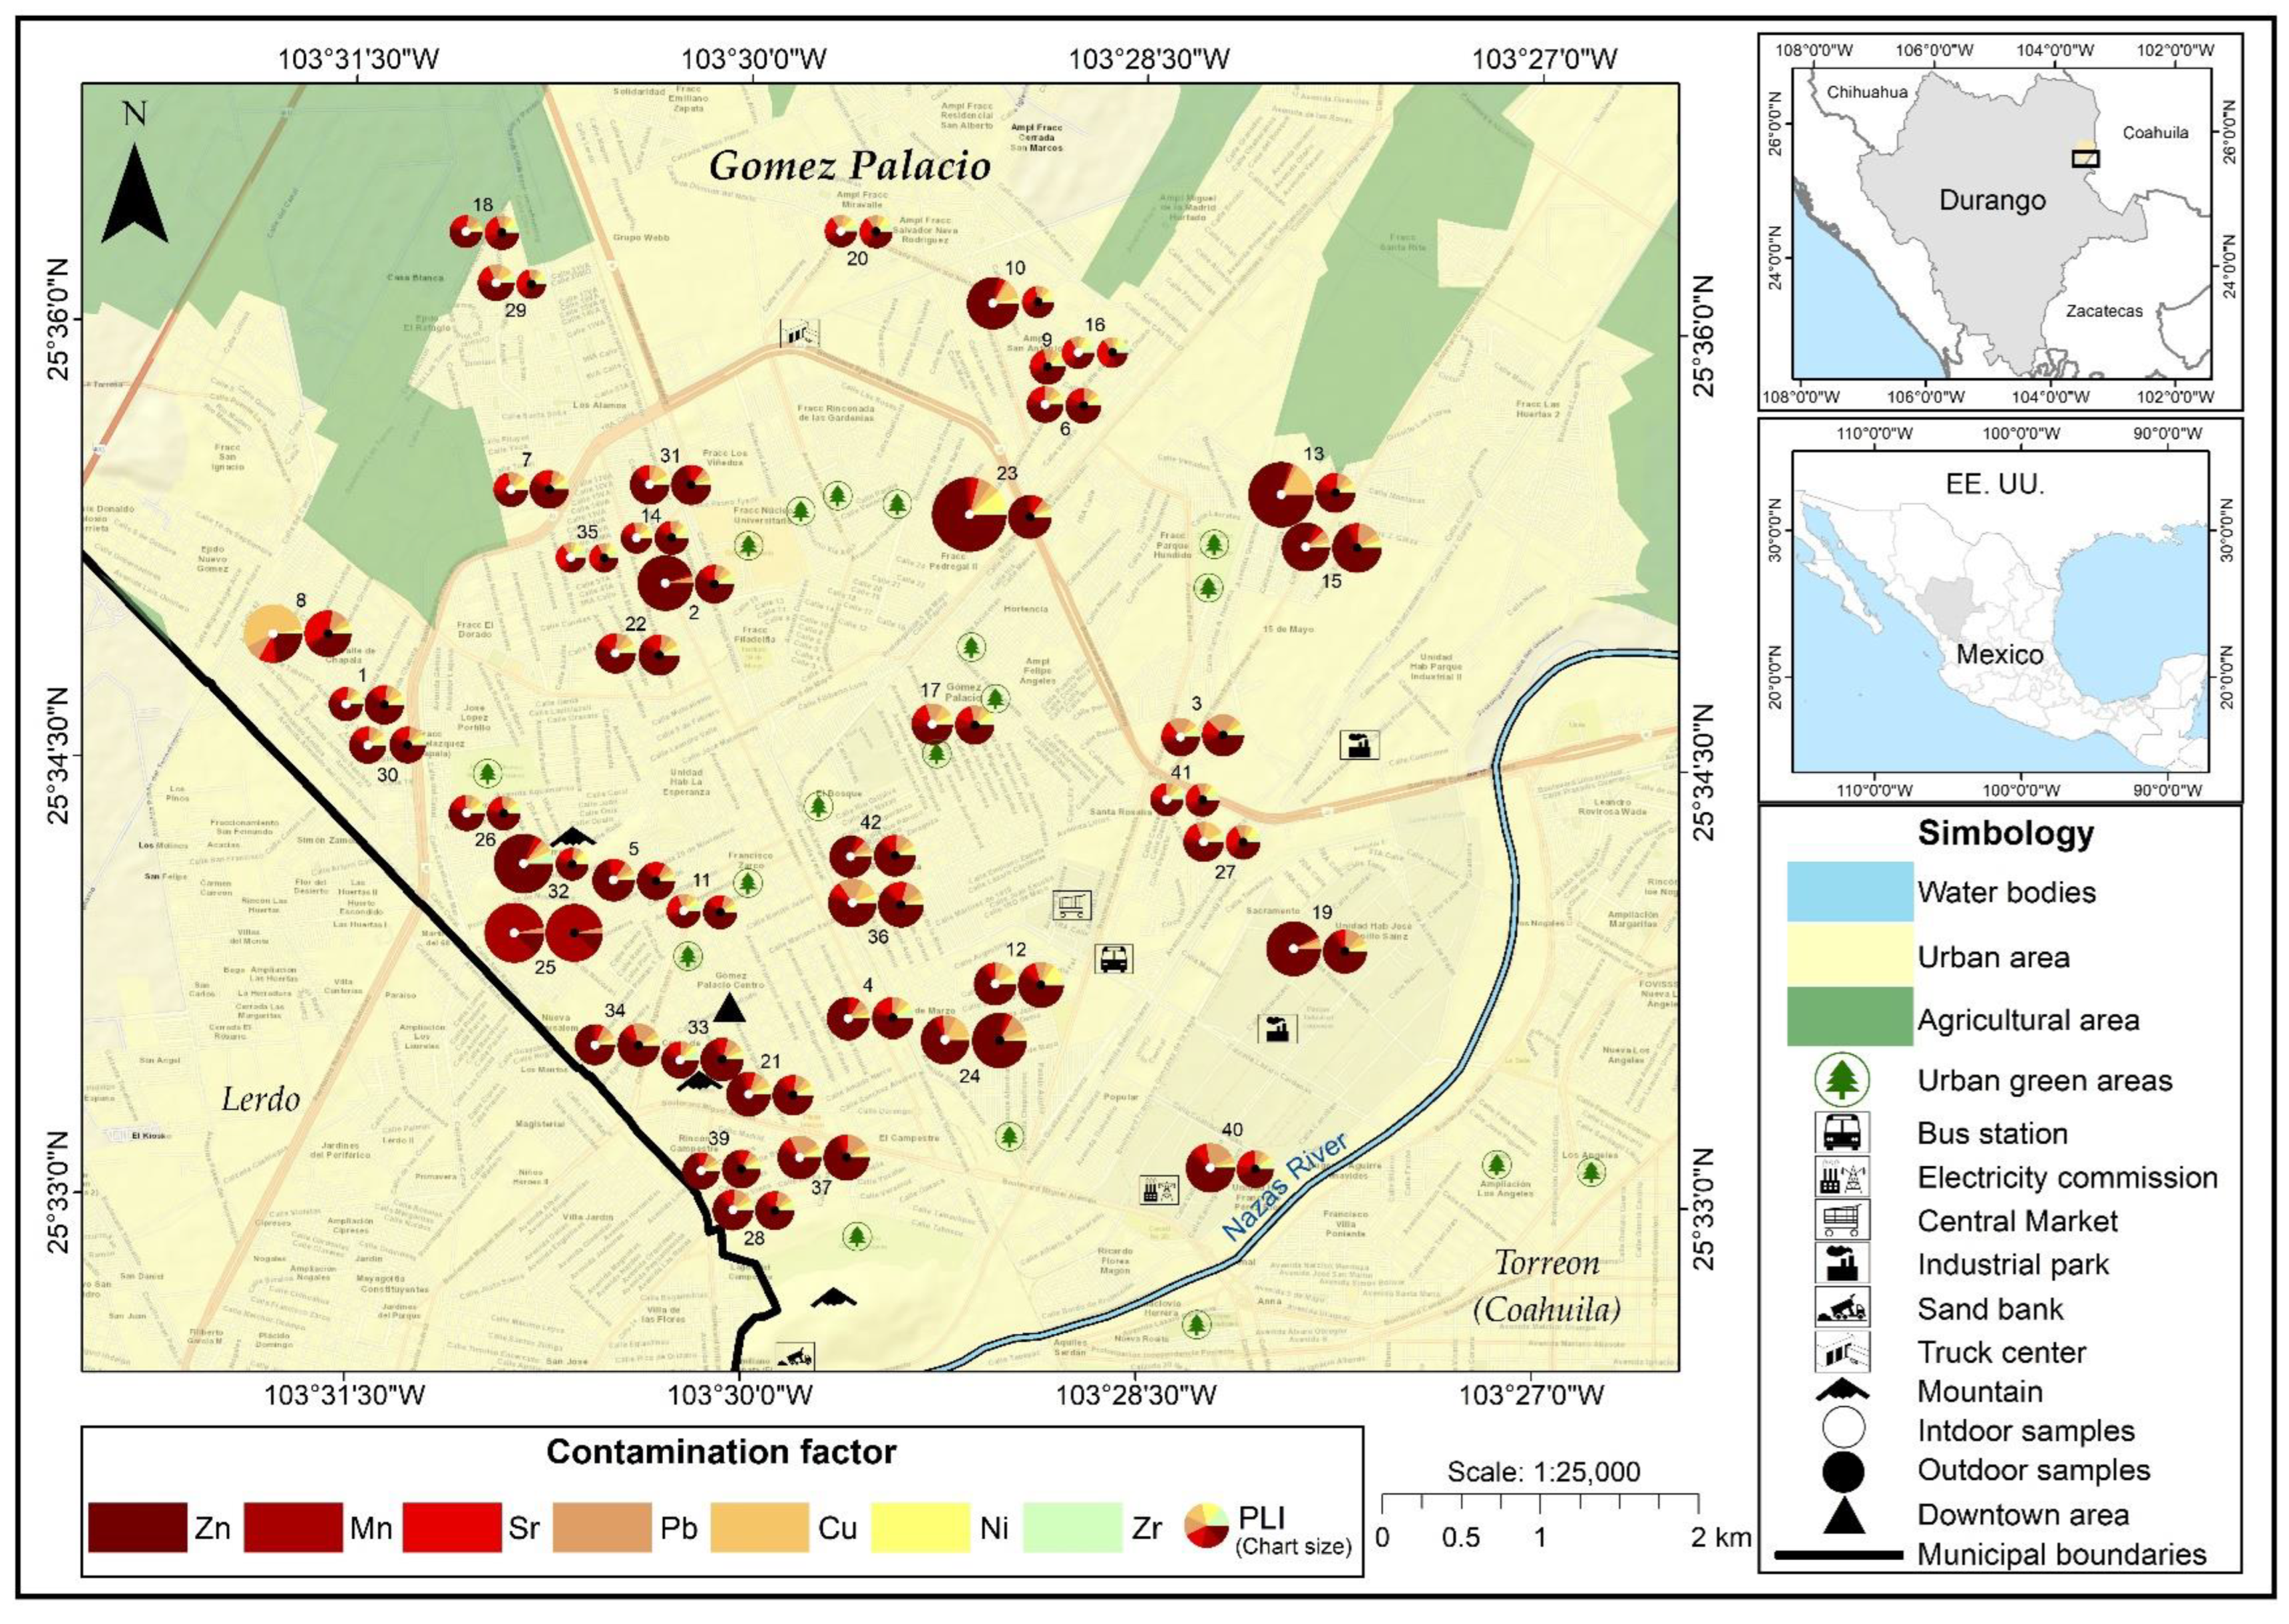
In general, the highest CF were those of Zn, except for site 25, near “Cerro de la Pila”, which showed higher Mn values, and for site 8, located to the west, close to the agricultural zone, in which Cu dominated indoors and Sr outdoors (Figure 6).
The sites sampled in the northwest, close to the agricultural areas, presented the highest CF values of Zn, with higher PLI values indoors than outdoors; the pie charts on the left represent the indoor samples, and those on the right the outside ones. The northeastern sites showed higher CF values for Zn, Sr, Cu, and Pb, with higher indoor PLI values (Figure 6).
The sites with the highest CF Zn values are located in the residential area adjacent to the "Parque industrial Lagunero" (site 19) and near the university nucleus (site 2). The highest PLI values indoors corresponded to the sites (a) 23 (PLI of 5.4), located north of the city, and site 13 (PLI of 4.19), situated in the northeast near the agricultural zone.
The size of the pie chart refers to the value of the PLI. The pie charts on the left represent the indoor samples, and those on the right, the outside ones.
The highest PLI values found outside the homes were for sites 24 and 25, respectively, presenting PLI values of 2.95 and 3.5. However, if they are compared with those found indoors, it can be deduced that, in general, pollution outdoors was less than indoors. Site 23 had the highest PLI value; it is located 0.27 km from a steel, iron, copper, and aluminum smelter.
The urban green areas did not seem to constitute a factor for improving the quality of the sites (based on the PLI calculation) both indoors and outdoors.

3.5. Human Health Risk Assessment

The health risk assessment using the USEPA methodology showed that the mean concentrations of the elements were within the levels considered safe for the health of the population (children and adults), except for the mean HI of Mn for children, because a value of 1.34 × 10 and 1.07 × 10 was found for outdoor and indoor samples, respectively (Figure 7). Therefore, there we found a risk for the child population, since prolonged exposure to Mn triggers neurological effects [40].
On the other hand, there was no risk of developing adverse health effects due to exposure to Cu, Fe, Ni, Pb, and Zn (HI < 1). It should be noted that the average HI of Pb for children and that of Mn for adults presented values close to the unsafe limit, being of the order of E-01 (Figure 7); prolonged exposure to these pollutants can trigger ailments of different types, affecting health [41,42]. Children are more highly exposed to heavy metals than adults through indoor dust ingestion due to frequent hand-to-mouth contact [43].
The RI values for Ni and Pb were found to be in the order of E-8 and E-9, respectively; therefore, they did not exceed the tolerable risk values in the outdoor and indoor samples [27].

4. Discussion

The sources of heavy metals in cities are external, such as forest fires [44], dust from agricultural areas [45], industrial chimneys outside the cities, parks, and others). The sources of heavy metals within cities are automobiles, car braking dust, industrial chimneys, home chimneys, and wear and tear of urban infrastructure [46]. In addition, the type, time, and intensity of land use in and around cities are related to the heavy metals present in urban dust. In the case of the city under study, industrial and agricultural land use, as well as parks predominate, all surrounded by houses [46].
Our results are consistent with global observations of a decrease in respirable particles in the atmosphere attributed to lower land and air transport activities and low industrial activity during the COVID-19 pandemic [47,48]. On the contrary, indoor pollution seemed to have grown according to our results. Consequently, indoor dust quality must be recognized as a critical factor in public health [49]. In the case of heavy metals, this study indicates concentration thresholds that could serve as a basis for creating environmental standards.
Comparing the concentrations of heavy metals in urban dust in this study with those of other Mexican cities using the same analytical technique, we found that Zn was in high concentrations indoors and outdoors.
The city of Gómez Palacio, Durango, has the lowest population (301,742 inhabitants) compared to the other cities reported in Table 5. However, the lead concentration in urban dust was the same as in other cities with two or three times more population, such as Mérida, Ensenada, and Morelia. The largest cities as regards the number of inhabitants, such as Mexico City, or mining (San Luis Potosí) or industrialized (Toluca) cities, presented higher lead concentrations in urban dust (Table 5).
From the results obtained in this study, Mn and Pb appeared the heavy metals to which more attention should be paid (Figure 7). Overexposure to Mn causes manganism, a brain disease similar to Parkinson’s, which causes difficulties in movement control and decreased attention and cognition [50]. Pb poisoning causes headache, irritability, abdominal pain, insomnia, and restlessness. In children, lead causes behavioral disorders and learning and concentration difficulties, but in severe cases, Pb causes acute psychosis, confusion, and loss of consciousness [51].
Table 5. Concentrations of heavy metals in urban dust in Mexico.
CityCuMnPbZnFe
CDMX (n= 89) [5].83107519029174,100
Ensenada (n = 86) [52]375683910137,700
Mérida (n = 101) [53]21234349512,400
Morelia (n = 100) [54]30366399218,050
SLP (n = 100) [55]8742416320726,650
Toluca (n = 89) [5].5193110819454,500
This study Outdoor (n = 43)364573563717,833
This study Indoor (n = 43)513884794817,589
n = number of samples.
Mn and Pb are especially dangerous in children because the pathways for heavy metals introduction involve food and drink, inhalation, and dermal absorption. A recent study revealed that only 26% of the population had normal cognition, which is of great importance because this matter impacts the health, educational, social, economic, and judicial systems [56].
During the COVID-19 pandemic, people stayed indoors, which could explain the higher concentrations of heavy metals in dust, which leads us to think that a decrease in the intensity of land use could lead to a reduction of heavy metal concentrations in urban dust. However, this still needs to be tested with other post-pandemic studies.
Two recommendations emerge from this work: (a) the authorities should use the values of the concentrations of heavy metals in urban dust to generate prevention policies and implement a monitoring system for pollution in urban dust; they should also improve the cleaning of the streets; (b) awareness should be raised in the citizens about the dangers of urban dust; it should be recommended to clean sidewalks and the walls of houses, use distinct shoes for the exterior and the interior, clean curtains, furniture, and walls inside the houses, and use chimneys and air cleaning systems, among others.

5. Conclusions

The COVID-19 pandemic impacted the land use intensity within cities; this study reports an apparent effect on the amount and type of heavy metals indoors and outdoors in Gomez Palacio City, México.
Mn deserves attention because its average concentration in the samples slightly exceeded the USEPA safety limits for children. The results revealed that children are at higher risk compared to adults.
The indoor environments need to be analyzed in depth because they represent a greater risk than the outdoor ones for the population due to contamination by heavy metals such as Zn, Cu, and Pb. It is essential to determine if houses are a source of these metals or a sink that concentrates the outdoor contamination.

Author Contributions

Conceptualization, F.B. and A.G.; methodology, C.P., M.S.-M., Á.G. and A.A.; formal analysis, M.S.-M., A.A. and Á.G.; Resources, F.B. and A.G.; writing—original draft preparation, M.S.-M., A.A. and F.B.; writing—review and editing, F.B. and A.G. All authors have read and agreed to the published version of the manuscript.

Funding

This research was funded by DGAPA Universidad Nacional Autónoma de México, grant number IN208621.

Institutional Review Board Statement

Not applicable.

Informed Consent Statement

Not applicable.

Data Availability Statement

The data from this research will be published in the MDPI Data Journal.

Acknowledgments

A.G. is grateful for the support given by UNAM-DGAPA during his sabbatical stay at the University of Alberta.

Conflicts of Interest

The authors declare no conflict of interest.

References

  1. Coronaviridae Study Group of the International Committee on Taxonomy of Viruses. The species severe acute respiratory syndrome-related coronavirus: Classifying 2019-nCoV and naming it SARS-CoV-2. Nat. Microbiol. 2020, 5, 536–544. [Google Scholar] [CrossRef] [PubMed] [Green Version]
  2. Venter, Z.S.; Aunan, K.; Chowdhury, S.; Lelieveld, J. COVID-19 lockdowns cause global airpollution declines. Proc. Natl. Acad. Sci. USA 2020, 117, 18984–18990. [Google Scholar] [CrossRef] [PubMed]
  3. Sarmadi, M.; Rahimi, S.; Rezaei, M.; Sanaeri, D. Air quality index variation before and after the onset of COVID-19 pandemic: A comprehensive study on 87 capital, industrial and polluted cities of the world. Environ. Sci. Eur. 2021, 33, 134. [Google Scholar] [CrossRef] [PubMed]
  4. Gupta, V. Vehicle-generated heavy metal pollution in an urban environment and its distribution into various environmental components. In Environmental Concerns and Sustainable Development; Springer: Singapore, 2020; pp. 113–127. ISBN 978-981-13-5888-3. [Google Scholar]
  5. Aguilera, A.; Bautista, F.; Gutiérrez-Ruiz, M.; Ceniceros-Gómez, A.E.; Cejudo, R.; Goguitchaichvili, A. Heavy metal pollution of street dust in the largest city of Mexico, sources and health risk assessment. Environ. Monit. Assess. 2021, 193, 193. [Google Scholar] [CrossRef] [PubMed]
  6. Ferreira-Baptista, L.; De Miguel, E. Geochemistry and risk assessment of street dust in Luanda, Angola: A tropical urban environment. Atmos. Environ. 2005, 39, 4501–4512. [Google Scholar] [CrossRef] [Green Version]
  7. Wei, B.; Yang, L. A review of heavy metal contaminations in urban soils, urban road dusts and agricultural soils from China. Microchem. J. 2010, 94, 99–107. [Google Scholar] [CrossRef]
  8. Tchounwou, P.B.; Yedjou, C.G.; Patlolla, A.K.; Sutton, D.J. Heavy Metals Toxicity and the Environment. Exp. Suppl. 2012, 101, 133–164. [Google Scholar]
  9. Jan, A.T.; Azam, M.; Siddiqui, K.; Ali, A.; Choi, I.; Haq, Q.M.R. Heavy Metals and Human Health: Mechanistic Insight into Toxicity and Counter Defense System of Antioxidants. Int. J. Mol. Sci. 2015, 16, 29592–29630. [Google Scholar] [CrossRef] [Green Version]
  10. Hull, R.; Barbu, C.H.; Allen-Gil, S.; Borysova, O. Strategies to Enhance Environmental Security in Transition Countries; Springer: New York, NY, USA, 2007; p. 430. ISBN 978-1-4020-5996-4. [Google Scholar]
  11. Ibanez, Y.; Le Bot, B.; Glorennec, P. House-dust metal content and bioaccessibility: A review. Eur. J. Miner. 2010, 22, 629–637. [Google Scholar] [CrossRef]
  12. Kong, S.; Lu, B.; Bai, Z.; Zhao, X.; Chen, L.; Han, B.; Jiang, H. Potential threat of heavy metals in re-suspended dusts on building surfaces in oilfield city. Atmos. Environ. 2011, 45, 4192–4204. [Google Scholar] [CrossRef]
  13. Mohmand, J.; Eqani, S.A.M.A.S.; Fasola, M.; Alamdar, A.; Mustafa, I.; Ali, N.; Liu, L.; Peng, S.; Shen, H. Human exposure to toxic metals via contaminated dust: Bioaccumulation trends and their potential risk estimation. Chemosphere 2015, 132, 142–151. [Google Scholar] [CrossRef] [PubMed]
  14. Yoshinaga, J.; Yamasaki, K.; Yonemura, A.; Ishibashi, Y.; Kaido, T.; Mizuno, K.; Tanaka, A. Lead and other elements in house dust of Japanese residences–Source of lead and health risks due to metal exposure. Environ. Pollut. 2014, 189, 223–228. [Google Scholar] [CrossRef] [PubMed]
  15. Olujimi, O.; Steiner, O.; Goessler, W. Pollution indexing and health risk assessments of trace elements in indoor dusts from classrooms, living rooms and offices in Ogun State, Nigeria. J. Afr. Earth Sci. 2015, 101, 396–404. [Google Scholar] [CrossRef]
  16. Marcotte, S.; Estel, L.; Minchin, S.; Leboucher, S.; Le Meur, S. Monitoring of lead, arsenic and mercury in the indoor air and settled dust in the Natural History Museum of Rouen (France). Atmos. Pollut. Res. 2017, 8, 483–489. [Google Scholar] [CrossRef]
  17. Butte, W.; Heinzow, B. Pollutants in house dust as indicators of indoor contamination. Rev. Environ. Contam. Toxicol. 2002, 175, 1–46. [Google Scholar]
  18. Chen, G.; Wang, Y.; Li, S.; Cao, W.; Ren, H.; Knibbs, L.D.; Guo, Y. Spatiotemporal patterns of PM10 concentrations over China during 2005–2016: A satellite-based estimation using the random forests approach. Environ. Pollut. 2018, 242, 605–613. [Google Scholar] [CrossRef]
  19. Delgado-Iniesta, M.J.; Marín-Sanleandro, P.; Díaz-Pereira, E.; Bautista, F.; Romero-Muñoz, M.; Sánchez-Navarro, A. Estimation of Ecological and Human Health Risks Posed by Heavy Metals in Street Dust of Madrid City (Spain). Int. J. Environ. Res. Public Health 2022, 19, 5263. [Google Scholar] [CrossRef]
  20. Comisión Nacional para el Conocimiento y Uso de la Biodiversidad (CONABIO) y Secretaría de Recursos Naturales y Medio Ambiente de Durango (SRNYMA). La Biodiversidad en Durango. Estudio de Estado; CONABIO: Durango, México, 2017; pp. 16–30. ISBN 978-607-8328-97-0. [Google Scholar]
  21. Morales, J.; Aguilera, A.; Bautista, F.; Cejudo, R.; Goguitchaichvili, A.; Hernández-Bernal, M.S. Heavy metal content estimation in the Mexico City Street dust: An inter-method comparison and Pb levels assessment during the last decade. SN Appl. Sci. 2020, 2, 1841. [Google Scholar] [CrossRef]
  22. Lozano, R.; Bernal, J.P. Characterization of a new set of eight geochemical reference materials for XRF major and trace element analysis. Rev. Mex. Cien. Geol. 2005, 22, 329–344. [Google Scholar]
  23. Rout, T.K.; Masto, R.E.; Padhy, P.K.; Ram, L.C.; George, J.; Joshi, G. Heavy metals in dusts from commercial and residential areas of Jharia coal mining town. Environ. Earth Sci. 2014, 73, 347–359. [Google Scholar] [CrossRef]
  24. Ihl, T.; Bautista, F.; Ruíz, F.R.C.; Delgado, M.D.C.; Owen, P.Q.; Aguilar, D.; Goguitchaichvili, A. Concentration of toxic elements in topsoils of the metropolitan area of Mexico City: A spatial analysis using ordinary kriging and indicator kriging. Rev. Int. Contam. Ambie. 2015, 31, 47–62. [Google Scholar]
  25. Kabata-Pendias, A. Trace Elements in Plants. In Trace Elements in Soils and Plants Fourth Edition; Kabata-Pendias, A., Ed.; CRC Press (Taylor and Francis Group): Boca Raton, FL, USA, 2010; pp. 93–122. ISBN 9781420093704. [Google Scholar]
  26. USEPA. Risk Assessment Guidance for Superfund (RAGS) Volume III-Part A: Process for Conducting Probabilistic Risk Assessment, Appendix B (Vol. III). U.S. Environmental Protection Agency, EPA 540-R02-002. United States 2001. Available online: http://www.epa.gov/sites/production/iles/2015-09/documents/rags3adt_complete.pdf (accessed on 3 September 2021).
  27. Lu, X.; Wu, X.; Wang, Y.; Chen, H.; Gao, P.; Fu, Y. Risk assessment of toxic metals in street dust from a medium-sized industrial city of China. Ecotoxicol. Environ. Saf. 2014, 106, 154–163. [Google Scholar] [CrossRef] [PubMed]
  28. Al-Madanat, O.; Jiries, A.; Batarseh, M.; Al-Nasir, F. Indoor and outdoor pollution with heavy metals in Al-Karak City. J. Int. J. Environ. Appl. Sci. 2017, 12, 131–139. [Google Scholar]
  29. Grigoratos, T.; Martini, G. Brake wear particle emissions: A review. Environ. Sci. Pollut. Res. 2015, 22, 2491–2504. [Google Scholar] [CrossRef] [Green Version]
  30. Li, X.; Poon, C.S.; Liu, P.S. Heavy metal contamination of urban soils and street dusts in Hong Kong. Appl. Geochem. 2001, 16, 1361–1368. [Google Scholar] [CrossRef]
  31. Yadav, I.C.; Devi, N.L.; Singh, V.K.; Li, J.; Zhang, G. Spatial distribution, source analysis, and health risk assessment of heavy metals contamination in house dust and surface soil from four major cities of Nepal. Chemosphere 2019, 218, 1100–1113. [Google Scholar] [CrossRef]
  32. Zhao, X.; Li, Z.; Tao, Y.; Wang, D.; Huang, J.; Qiao, F.; Lei, L.; Xing, Q. Distribution characteristics, source appointment, and health risk assessment of Cd exposure via household dust in six cities of China. Build. Environ. 2020, 172, 106728. [Google Scholar] [CrossRef]
  33. Lin, Y.S.; Fang, F.M.; Wang, F.; Xu, M.L. Pollution distribution and health risk assessment of heavy metals in indoor dust in Anhui rural, China. Environ. Monit. Assess. 2015, 187, 565. [Google Scholar] [CrossRef]
  34. Zhou, L.; Liu, G.J.; Shen, M.C.; Hu, R.Y.; Sun, M.; Liu, Y. Characteristics and health risk assessment of heavy metals in indoor dust from different functional areas in Hefei, China. Environ. Pollut. 2019, 251, 839–849. [Google Scholar] [CrossRef]
  35. Latif, M.T.; Othman, M.R.; Kim, C.L.; Murayadi, S.A.; Sahaimi, K.N.A. Composition of household dust in semi-urban areas in Malaysia. Indoor Built Environ. 2009, 18, 155–161. [Google Scholar] [CrossRef]
  36. Praveena, S.M.; Abdul Mutalib, N.S.; Aris, A.Z. Determination of heavy metals in indoor dust from primary school (Sri Serdang, Malaysia): Estimation of the health risks. Environ. Forensics 2015, 16, 257–263. [Google Scholar] [CrossRef]
  37. Rasmussen, P.E.; Subramanian, K.S.; Jessiman, B.J. A multi-element profile of housedust in relation to exterior dust and soils in the city of Ottawa, Canada. Sci. Total Environ. 2001, 267, 125–140. [Google Scholar] [CrossRef]
  38. Lin, Y.; Fang, F.; Wu, J.; Zhu, Z.; Zhang, D.; Xu, M. Indoor and outdoor levels, sources and health risk assessment of mercury in dusts from a coal-industry city of China. Hum. Ecol. Risk Assess. 2017, 25, 1028–1040. [Google Scholar] [CrossRef]
  39. Galán, E.; Romero, A. Contaminación de suelos por metales pesados. Macla Rev. Soc. Esp. Mineral. 2008, 10, 48–60. [Google Scholar]
  40. Rodríguez-Agudelo, Y.; Riojas-Rodríguez, H.; Ríos, C.; Rosas, I.; Sabido Pedraza, E.; Miranda, J.; Siebe, C.; Texcalac, J.L.; Santos-Burgoa, C. Motor alterations associated with exposure to manganese in the environment in Mexico. Sci. Total Environ. 2006, 368, 542–556. [Google Scholar] [CrossRef]
  41. Kong, S.; Lu, B.; Ji, Y.; Zhao, X.; Bai, Z.; Xu, Y.; Liu, Y.; Jiang, H. Risk assessment of heavy metals in road and soil dusts within PM2.5, PM10 and PM100 fractions in Dongying city, Shandong province, China. J. Environ. Monit. 2012, 14, 791–803. [Google Scholar] [CrossRef]
  42. Jadoon, W.; Khpalwak, W.; Chidya, R.C.G.; Abdel-Dayem, S.M.M.A.; Takeda, K.; Makhdoom, M.A.; Sakugawa, H. Evaluation of Levels, Sources and Health Hazards of Road-Dust Associated Toxic Metals in Jalalabad and Kabul Cities, Afghanistan. Arch. Environ. Contam. Toxicol. 2018, 74, 32–45. [Google Scholar] [CrossRef]
  43. Ali, M.U.; Liu, G.; Yousaf, B.; Abbas, Q.; Ullah, H.; Munir, M.A.M.; Fu, B. Pollution characteristics and human health risks of potentially (eco) toxic elements (PTEs) in road dust from metropolitan area of Hefei, China. Chemosphere 2017, 181, 111–121. [Google Scholar] [CrossRef]
  44. Ayala-Carrillo, M.; Farfán, M.; Cárdenas-Nielsen, A.; Lemoine-Rodríguez, R. Are Wildfires in the Wildland-Urban Interface Increasing Temperatures? A Land Surface Temperature Assessment in a Semi-Arid Mexican City. Land 2022, 11, 2105. [Google Scholar] [CrossRef]
  45. Sarim, M.; Jan, T.; Khattak, S.A.; Mihoub, A.; Jamal, A.; Saeed, M.F.; Soltani-Gerdefaramarzi, S.; Tariq, S.R.; Fernández, M.P.; Mancinelli, R.; et al. Assessment of the Ecological and Health Risks of Potentially Toxic Metals in Agricultural Soils from the Drosh-Shishi Valley, Pakistan. Land 2022, 11, 1663. [Google Scholar] [CrossRef]
  46. Aguilera, A.; Bautista-Hernández, D.; Bautista, F.; Goguitchaichvili, A.; Cejudo, R. Is the Urban Form a Driver of Heavy Metal Pollution in Road Dust? Evidence from Mexico City. Atmosphere 2021, 12, 266. [Google Scholar] [CrossRef]
  47. Hammer, M.S.A.; Van Donkelaar, R.V.; Martin, E.E.; McDuffie, A.; Lyapustin, A.M.; Sayer, N.; Hsu, N.C.; Levy, R.C.; Garay, M.J.; Kalashnikova, O.V.; et al. Effects of COVID-19 lockdowns on fine particulate matter concentrations. Sci. Adv. 2021, 7, 7670. [Google Scholar] [CrossRef] [PubMed]
  48. Martinho, V.J.P.D. Impacts of the COVID-19 Pandemic and the Russia–Ukraine Conflict on Land Use across the World. Land 2022, 11, 1614. [Google Scholar] [CrossRef]
  49. Gul, H.K.; Gullu, G.; Babaei, P.; Nikravan, A.; Kurt-Karakus, P.B.; Salihoglu, G. Assessment of house dust trace elements and human exposure in Ankara, Turkey. Environ. Sci. Pollut. Res. Int. 2022, 31, 1–18. [Google Scholar] [CrossRef]
  50. Kim, G.; Lee, H.S.; Seok Bang, J.; Kim, B.; Ko, D.; Yang, M.A. Current review for biological monitoring of manganese with exposure, susceptibility, and response biomarkers. J. Environ. Sci. Health part C 2015, 33, 229–254. [Google Scholar] [CrossRef] [PubMed]
  51. Järup, L. Hazards of heavy metal contamination. Br. Med. Bull. 2003, 68, 167–182. [Google Scholar] [CrossRef]
  52. Cortés, J.L.; Bautista, F.; Quintana, P.; Aguilar, D.; Goguichaishvili, A. The color of urban dust as an indicator of contamination by potentially toxic elements: The case of Ensenada, Baja California, Mexico. Rev. Chapingo Serie Cienc. Forest. Ambien. 2015, 21, 255–266. [Google Scholar] [CrossRef] [Green Version]
  53. Aguilar, Y.; Bautista, F.; Quintana, P.; Aguilar, D.; Trejo-Tzab, R.; Goguitchaichvili, A.; Chan-Te, R. Color as a New Proxy Technique for the Identification of Road Dust Samples Contaminated with Potentially Toxic Elements: The Case of Mérida, Yucatán, México. Atmosphere 2021, 12, 483. [Google Scholar] [CrossRef]
  54. Delgado, C.; Israde, I.; Bautista, F.; Gogichaishvili, A.; Márquez, C.; Cejudo, R.; Morales, J.; González, I. Metales pesados en suelos urbanos de Morelia, Michoacán: Influencia de los usos de suelo y tipos de vialidad. Cienc. Nicolaita 2015, 65, 120–138. [Google Scholar] [CrossRef]
  55. Aguilera, A.; Morales, J.J.; Goguitchaichvili, A.; García-Oliva, F.; Armendariz-Arnez, C.; Quintana, P.; Bautista, F. Spatial distribution of magnetic material in urban road dust classified by land use and type of road in San Luis Potosí, Mexico. Air Qual. Atmos. Health 2020, 13, 951–963. [Google Scholar] [CrossRef]
  56. Calderón-Garcidueñas, L.; Chávez-Franco, D.A.; Luévano-Castro, S.C.; Macías-Escobedo, E.; Hernández-Castillo, A.; Carlos-Hernández, E.; Franco-Ortíz, A.; Castro-Romero, S.P.; Cortés-Flores, M.; Crespo-Cortés, C.N.; et al. Metals, Nanoparticles, Particulate Matter, and Cognitive Decline. Front. Neurol. 2022, 12, 794071. [Google Scholar] [CrossRef] [PubMed]
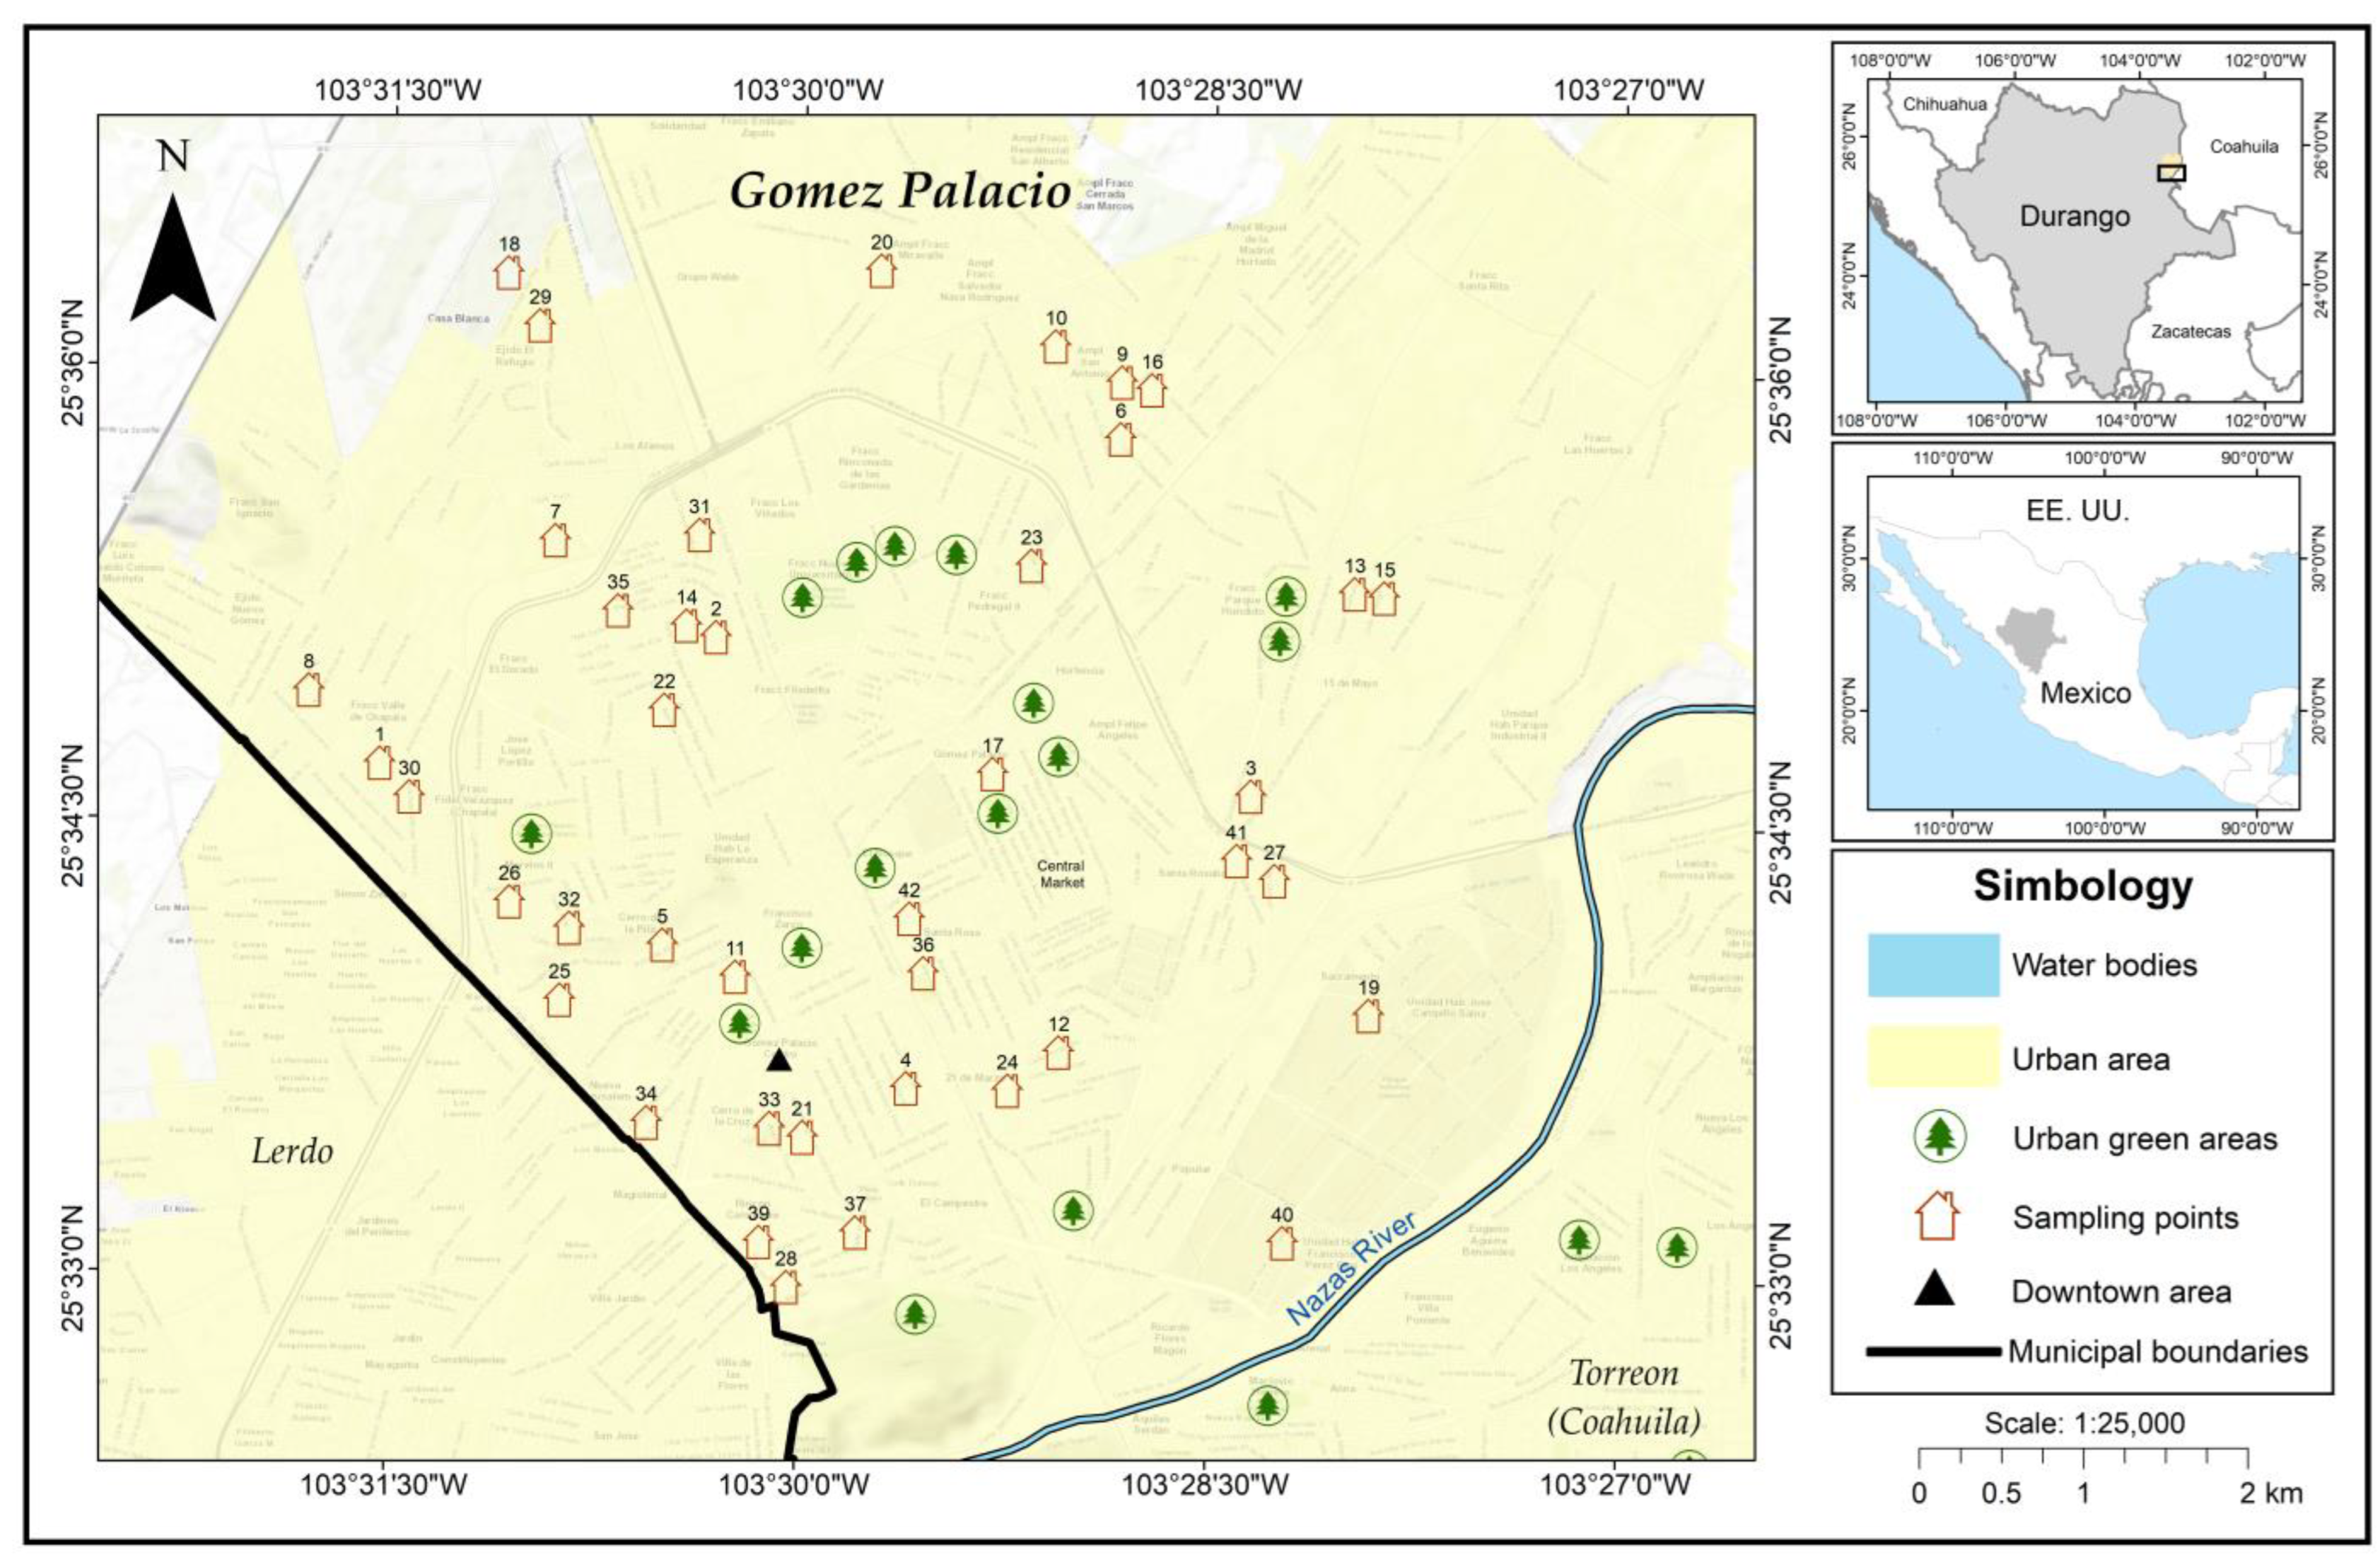
Figure 1. Sampling sites’ location.
Land 12 00029 g001
Figure 2. First two components of the principal component analysis of the outdoor samples.
Land 12 00029 g002
Figure 3. First two components of the principal component analysis of the indoors sample.
Land 12 00029 g003
Figure 4. Boxplots for heavy metal contamination factors using the global background value for soils [25].
Land 12 00029 g004
Figure 5. Boxplots for heavy metal contamination factors using the first decile as the background value.
Land 12 00029 g005
Figure 6. Pollution factor and PLI by sampling site indoors and outdoors.
Land 12 00029 g006
Figure 7. Mean values of the non-carcinogenic index (HI) for children and adults indoors (In) and outdoors (Out).
Land 12 00029 g007
Table 1. Statistical summary of the concentrations of heavy metals outdoors and indoors in the city of Gómez Palacio, Durango.
SitionMinMaxMedianCV (%)SDTBD1BWS
mg/kg
CaOut4310,673233,944123,71828*71,332
In4210,530275,658115,95337
CuOut430.72893674*18.239
In420.5293151248
MnOut43138225,339457588*295488
In42120185,347388637
PbOut431546435106*22.627
In42143544786
RbOut43401509715*65.768
In42191608927
ZnOut438237,945637268*204.470
In426640,532948192
FeOut4311,40367,20917,83328ns14,419
In42761682,91117,58944
KOut4327823,36311,81523ns10,163
In4234531,31611,76232
NiOut4331642462ns17.329
In42862124169
SrOut4379227237554ns301.0175
In4283144237938
TiOut4345236272631ns2063.97038
In420.611,904264545
YOut43201943069ns25.123
In42142183057
ZrOut430.539118147ns67.6263
In420.21608185102
Min = minimum, Max = maximum, CV = coefficient of variation, SDT = statistical differences between sites, * = statistically significant, ns = not significant, BD1 = background decile 1, BWS = world soils background.
Table 2. Spearman correlation coefficients between elements (upper triangle) and p value (lower triangle). Coefficients greater than 0.4 are in bold, and significant p-values are in red.
Ca0.120.01−0.180.220.120.09−0.380.140.100.150.09−0.13
Cu0.41−0.090.190.330.71−0.480.250.090.280.780.11
0.04Fe0.400.550.260.440.070.210.580.220.410.25
0.810.00K0.38−0.080.090.560.050.340.06−0.050.15
0.000.110.00Mn0.230.320.150.300.340.280.210.14
0.000.000.000.00Ni0.29−0.260.100.010.070.330.04
0.040.000.000.150.00Pb−0.320.130.160.150.760.14
0.120.000.000.120.000.00Rb−0.100.22−0.11−0.430.09
0.000.000.200.000.010.000.00Sr0.140.990.140.03
0.010.000.000.390.000.080.020.08Ti0.160.130.22
0.070.120.000.000.000.910.000.000.02Y0.160.05
0.010.000.000.290.000.200.010.050.000.01Zn0.11
0.130.000.000.340.000.000.000.000.010.030.01Zr
0.020.050.000.010.020.500.010.120.560.000.420.05
Table 3. Percentage of urban dust samples according to the contamination factor.
CuMnZnTotal
World soil background
<14570.60330/100%
1 a 341.527.010.3330/100%
3–67.00.315.2330/100%
6 a 102.4021.8330/100%
Mayor a103.62.152.7330/100%
Background decile 1
<1101010330/100%
1 a 353.986.432.7330/100%
3–621.81.230.3330/100%
6 a 107.00.312.1330/100%
Mayor a 107.32.114.9330/100%
Table 4. Proposed pollution limits, reference concentrations (mg/kg), for heavy metals in urban dust in Gómez Palacio City.
ElementBackground
Value
Recommended
Investigation Level
Mandatory
Investigation Level
Intervention
Level
Mn295.0295–816816–1324>1324
Zn204204–611611–1207>1207
Cu1818–4848–95>95
Ni1717–5050–98>98
Pb2323–6767–131>131
Fe14,41914,992–36,00336,003–82,342>82,348
Ti20082008–57595759–7852>7852
Sr297297–863863–1434>1434
Rb6262–144144–153>153
Y2626–7070–146>146
Zr6060–140140–355>355
Disclaimer/Publisher’s Note: The statements, opinions and data contained in all publications are solely those of the individual author(s) and contributor(s) and not of MDPI and/or the editor(s). MDPI and/or the editor(s) disclaim responsibility for any injury to people or property resulting from any ideas, methods, instructions or products referred to in the content.