Article

Impact of Industrial Synergy on the Efficiency of Innovation Resource Allocation: Evidence from Chinese Metropolitan Areas

College of Economics and Management, Nanjing University of Aeronautics and Astronautics, Nanjing 211106, China
*
Author to whom correspondence should be addressed.
Land 2023, 12(1), 177; https://doi.org/10.3390/land12010177
Submission received: 5 December 2022 / Revised: 31 December 2022 / Accepted: 31 December 2022 / Published: 5 January 2023

Abstract

:
Chinese metropolitan areas suffer from isolated industrial development, obstructed factor flows, and imperfect cooperation mechanisms. Promoting inter-city industrial complementarity and the rational allocation of regional innovation factors is necessary for sustainable regional development. First, this paper uses a network data envelopment analysis model based on resource sharing and two-stage additional input to measure the efficiency of innovation resource allocation in 31 metropolitan areas in China between 2010 and 2019. Second, the Tobit model is used to explore the impact of industrial synergy in metropolitan areas on the efficiency of innovation resource allocation at different stages and to analyze regional heterogeneity. The results indicate that the efficiency of innovation resource allocation in China’s metropolitan areas shows a slowly increasing trend. The efficiency of the innovation resource development stage is lower than that of the economic transformation stage. Disparity in the efficiency of innovation resource allocation among metropolitan areas is significant, with those on the southeast coast being the most efficient. Industrial synergy in metropolitan areas has a significantly positive impact on the efficiency of innovation resource allocation. The positive impact is greater in the economic transformation phase than in the innovation resource development phase and has significant regional heterogeneity.

1. Introduction

With the gradual weakening of the contribution of traditional resources and capital accumulation to economic growth, innovation has become the most dynamic factor of production in the new economic form. However, the global pandemic has made development more isolated across regions. Local protectionism and closed development models cannot meet the requirements of modern innovation. In order to support the generation of new knowledge and increase the efficiency of innovation, it is crucial to strengthen industrial linkages and cooperation between cities. Industrial synergy among cities not only helps each city develop its own strengths, but also promotes knowledge diffusion and spillover, which in turn improves the region’s overall innovation strength. In 2019, China’s National Development and Reform Commission emphasized the need to break down barriers to the free flow of factors and the construction of a mechanism for the synergistic development of metropolitan areas. Therefore, exploring the impact of industrial synergy in metropolitan areas on the efficiency of innovation resource allocation is of great practical significance for promoting both industrial complementarity between cities and the sustainable development of regional economies.
Research on regional innovation efficiency has mainly focused on measuring innovation efficiency, analyzing influencing factors, and discussing optimization paths [1,2]. The main methods used to measure regional innovation efficiency include data envelopment analysis (DEA) and stochastic frontier analysis (SFA). The SFA method requires a known production function and can only deal with the efficiency of a single output [3]. In comparison, the DEA method does not need to set up a function model in advance. Therefore, the DEA method is more suitable for complex systems with multiple inputs and outputs, such as innovation resource allocation [4]. Governmental factors, market factors, and geographical location are the main factors affecting the efficiency of regional innovation [5,6]. Government factors include the degree of regional openness, regional administrative levels, and industrial subsidy policies [7,8,9]. Market factors are mainly reflected in the degree of industrial agglomeration, knowledge overflow of talents, and the development level of modern service industries [10,11]. Geographical location primarily includes resource endowment, transportation accessibility, and regional culture [12,13]. With regional connectivity, innovation is no longer a closed and isolated system [14]. Participants can establish a reasonable industrial chain and a relationship network through various collaborative activities, reducing inherent risks and stimulating more innovation [15,16,17]. Regional collaborative development, especially industrial collaboration, has an increasingly prominent impact on innovation efficiency. Fan et al. [18] noted that industrial synergy can promote the mutual supply and effective integration of production factors, products, and technologies. de Abreu and de Andrade [19] argued that in regional competition and cooperation, the formation of an integrated industrial division system can effectively alleviate and eliminate vicious conflicts in development. Huang and Wang [20] also pointed out that industrial synergistic agglomerations help heterogeneous innovation elements to circulate and be shared in a specific space, thereby promoting regional innovation. Collectively, most existing studies have focused on measuring the degree of synergistic agglomeration between industries using the industrial co-agglomeration index. Finally, studies on optimization paths have mostly used fuzzy-set qualitative comparative analysis to explore which combinations of factors can improve regional innovation efficiency from a configuration perspective [21].
In general, the existing literature has the following shortcomings. First, most studies have ignored the complex network characteristics of innovation resource allocation and failed to consider the sharing of innovation resources at different stages, as well as the input of additional resources. Second, previous studies have mostly explored the degree of synergistic agglomeration between industries, while few scholars have focused on the industrial synergy among cities within a metropolitan area [18,22]. Finally, most scholars have measured innovation efficiency at the city and provincial level or explored how industries within cities contribute to urban development without considering the metropolitan area as a unit of study. This paper makes the following three contributions. First, by considering the internal structure of inputs and outputs at different stages, it uses a network DEA model based on resource sharing and two-stage additional input to measure the efficiency of innovation resource allocation in metropolitan areas in China. Second, it measures the level of industrial synergy of 31 metropolitan areas in China in terms of their inter-city industrial connectivity and convergence. Third, it explores the impact of industrial synergy in metropolitan areas on the efficiency of innovation resource allocation and conducts a regional heterogeneity analysis.
The structure of this paper is as follows: The Section 2 describes the theoretical basis of the study and presents the hypotheses. The Section 3 introduces the research model, variables, and data sources. The Section 4 presents the results and analysis of empirical research. The fifth part is comprised of the discussion. The sixth part is the conclusion.

2. Theoretical Analysis and Research Hypotheses

The global pandemic has severely hampered interregional cooperation and openness; since the pandemic, the development of regions has tended to be more conservative and segregated. Furthermore, because economic performance is the most important indicator used in the appraisal and promotion of local officials in China, the local government’s first consideration is local industrial development and fiscal revenue. Each city can only prepare industrial plans within its administrative boundaries [23]. The lack of coordination between them exacerbates the regional homogenization of industries and wasted resources [24].
Therefore, there is an urgent need to breakthrough the original administrative boundary restrictions and promote industrial synergy between central cities and surrounding cities to enhance the efficiency of innovation resource allocation in a broader spatial context. Central cities are large cities with strong radiation-driven functions in the metropolitan area. First, based on the consumer city theory and the industrial division of labor theory, at the mature stage of metropolitan area development, the function of central cities as manufacturing centers gradually decreases and their function as consumption and service centers grows [25]. Industrial collaboration among cities can improve innovation efficiency by increasing regional specialization, for example, by promoting the agglomeration of services industries to central cities and the relocation of manufacturing or agriculture to surrounding cities [22]. Second, the development of inter-city rail transport has increased the frequency of people moving between cities. Surrounding cities can provide a broader range of product and labor markets for the central city, in this way contributing to the innovative development of the central city. Finally, the geographical proximity and similar regional culture contribute to knowledge exchange and industrial cooperation. Surrounding cities can take advantage of the spatial spillover of knowledge and industries from the central city to improve their innovation resource allocation efficiency. Therefore, we propose the following hypothesis:
Hypothesis 1.
Industrial synergy in metropolitan areas has a positive impact on the efficiency of innovation resource allocation.
A metropolitan area is essentially a close-knit economic region [26]. However, the connections that characterize a metropolitan area involve a long-term development process. There are significant spatial differences between China’s regions in terms of their resource endowments, urbanization processes, and cultural development, causing the impact of industrial synergy on the efficiency of innovation resource allocation in China’s metropolitan areas to exhibit a differentiated pattern [27]. Therefore, we propose the following hypothesis:
Hypothesis 2.
There is regional heterogeneity in the impact of metropolitan area industrial synergy on the efficiency of innovation resource allocation.

3. Data Description and Research Methods

3.1. Measurements and Model Construction

3.1.1. Network DEA Model Based on Resource Sharing and Two-Stage Additional Input

The traditional DEA model generally assumes that there is only one stage in the production process, wherein initial inputs are directly transformed into final outputs [28]. As a result, traditional DEA is unable to analyze the internal structure of the decision-making units (DMU). Compared with the traditional DEA model, the network DEA model has the following advantages. First, the model considers the multi-stage nature of the production process and decomposes the whole process. Each sub-process has corresponding input and output variables. The intermediate variables are the output variables of the previous sub-process and the input variables of the next sub-process. The sub-processes are closely related by the intermediate variables [29,30]. Second, the model establishes a better mathematical relationship between each sub-process and the overall efficiency, which helps explain the impact of each sub-process on the overall efficiency and provides more insight into the causes of system inefficiencies [31,32]. Third, considering the complexity of the internal structure, the model is helpful for exploring the nonlinear flow of internal resources, which is more in line with reality [4].
Innovation resource allocation is a complex systems process consisting of different interdependent stages demonstrating networking characteristics [33]. This study considers the allocation structure of the initial input variables between the two sub-systems and considers the inclusion of new input variables in the second stage to construct a network DEA model based on resource sharing and two-stage additional input. Figure 1 shows the internal structure of this network DEA.
Suppose there are n DMUs, each with an initial input X i j , an intermediate product Z p j , and a final output Y r j . The following points need to be considered when constructing a network DEA model based on resource sharing and two-stage additional input. First, the initial input X i j is not fully exhausted in the first stage, but is allocated between the two sub-processes, according to a certain proportion that varies depending on the DMU. Assume that αi is the proportion of the initial input X i j consumed in the first stage and 1-αi is the proportion of the initial input consumed in the second stage. Decision variables v i 1 and v i 2 denote the weight structure of the initial inputs in the two-stage sub-process, respectively.
Second, throughout the process, the intermediate product Zpj is both a stage output of the first sub-process and an input variable of the second sub-process. w p 1 denotes the weight of the output of Zpj in the first stage, and w p 2  denotes the weight of the input of Zpj in the second stage. In addition, Hhj is the additional input in the second stage, and fh is the weight of Hhj. Finally, ur denotes the weight of the final output Yrj. The network DEA model, based on resource sharing and two-stage additional input, is shown in Equation (1).
E k = max p = 1 q w p 1 Z p k + r = 1 s u r Y r k μ k 1 μ k 2 i = 1 m v i 1 a i X i k + i = 1 m v i 2 ( 1 a i ) X i k + p = 1 q w p 2 Z p k + h = 1 g f h H h k
s . t . { p = 1 q w p 1 Z p j + r = 1 s u r Y r j u k 1 u k 2 i = 1 m v i 1 a i X i j + i = 1 m v i 2 ( 1 a i ) X i j + p = 1 q w p 2 Z p j + h = 1 g f h H h j 1 p = 1 q w p 1 Z p j u k 1 i = 1 m v i 1 a i X i j 1 r = 1 s u r Y r u k 2 i = 1 m v i 2 ( 1 a i ) X i j + p = 1 q w p 2 Z p j + h = 1 g f h H h j 1 0 a i 1 ; v i 1 , v i 2 , w p 1 , w p 2 , f h , u r 0 ; i = 1 , 2 , , m ; j = 1 , 2 , n
If we let t = 1 / i = 1 m v i 1 a i X i k + i = 1 m v i 2 1 a i X i k + p = 1 q w p 2 Z p k + h = 1 g f h H h k , using the Charnes–Cooper transformation, we can obtain the equivalent mathematical planning model. For computational purposes, we transformed the non-linear programming into linear programming, as shown in Formula (2).
E k = max ( p = 1 q W p 1 Z p k + r = 1 s U r Y r k μ k A μ k B )
  s . t .   { i = 1 m V i 1 a i X i j p = 1 q W p 1 Z p j + u k A 0 i = 1 m V i 2 ( 1 a i ) X i j + p = 1 q W p 2 Z p j + h = 1 g F h H h j r = 1 s U r Y r j + u k B 0 i = 1 m V i 1 a i X i k + i = 1 m V i 2 ( 1 a i ) X i k + p = 1 q W p 2 Z p k + h = 1 g F h H h k = 1 0 a i 1 ; V i 1 , V i 2 , W p 1 , W p 2 , F h , U r ε ; i = 1 , 2 , , m ; j = 1 , 2 , n
In Formula (2), V i 1 = t v i 1 , V i 2 = t v i 2 , W p 1 = t w p 1 , W p 2 = t w p 2 , F h = t f h , U r = t u r . To avoid the optimal solution of the decision variable being zero, we restrict the lower bound of the decision variable to ε, where ε represents a non-Archimedean infinitesimal. Let π i 1 = V i 1 a i , π i 2 = V i 2 a i ; we can transform Formula (2) into an equivalent linear programming formula:
E k = max ( p = 1 q W p 1 Z p k + r = 1 s U r Y r k μ k A μ k B )
  s . t . { i = 1 m π i 1 X i j p = 1 q W p 1 Z p j + u k A 0 i = 1 m V i 2 X i j i = 1 m π i 2 X i j + p = 1 q W p 2 Z p j + h = 1 g F h H h j r = 1 s U r Y r j + u k B 0 i = 1 m π i 1 X i k + i = 1 m V i 2 X i k i = 1 m π i 2 X i k + p = 1 q W p 2 Z p k + h = 1 g F h H h k = 1 V i 2 π i 2 ε ; π i 1 , W p 1 , W p 2 , F h , U r ε ; i = 1 , 2 , , m ; j = 1 , 2 , n
The optimum solution of V i 1 , V i 2 , W p 1 , W p 2 , F h , U r can be obtained by Formula (3). Finally, we obtain the efficiency values of the innovation resources development stage and the economic transformation stage using Formulas (4) and (5).
E k 1 = p = 1 q w p 1 Z p k μ k 1 i = 1 m v i 1 a i X i k = p = 1 q W p 1 Z p k μ k A i = 1 m V i 1 a i X i k
E k 2 = r = 1 s u r Y r k μ k 2 i = 1 m v i 2 ( 1 a i ) X i k + p = 1 q w p 2 Z p k + h = 1 g f h H h k = r = 1 s U r Y r k μ k B i = 1 m V i 2 ( 1 a i ) X i k + p = 1 q W p 2 Z p k + h = 1 g F H h k
On this basis, let A = i = 1 m v i 1 a i X i k + i = 1 m v i 2 ( 1 a i ) X i k + p = 1 q w p 2 Z p k + h = 1 g f h H h k . We can obtain the relationship between the total efficiency and the efficiency of each sub-process, as shown in Equation (6).
E k = p = 1 q w p 1 Z p k + r = 1 s u r Y r k μ k 1 μ k 2 A = i = 1 m v i 1 a i X i k A p = 1 q w p 1 Z p k μ k 1 i = 1 m v i 1 a i X i k + i = 1 m v i 2 ( 1 a i ) X i k + p = 1 q w p 2 Z p k + h = 1 g f h H h k A r = 1 s u r Y r k u k 2 i = 1 m v i 2 ( 1 a i ) X i k + p = 1 q w p 2 Z p k + h = 1 g f h H h k = ϕ K 1 E K 1 + ϕ K 2 E K 2
where ϕ k 1 and ϕ k 2 are the weights of the innovation resource development phase and the economic transformation phase, respectively: ϕ k 1 = i = 1 m v i 1 a i X i k / A , ϕ k 2 = i = 1 m v i 2 ( 1 a i ) X i k + p = 1 q w p 2 Z p k + h = 1 g f h H h k / A .

3.1.2. Tobit Model

As the efficiency value obtained by network DEA is between 0 and 1, which has truncation characteristics, the estimation results obtained by the ordinary least squares regression method are often biased and inconsistent. Therefore, a random-effect panel Tobit model is used for the regression analysis. The basic form of the model is shown in Formula (7):
I E i t = β 0 + β 1 c o o r d i n a t e i t + β 2 g d p i t + β 3 f d i i t + β 4 m a r k i t + β 5 e d u c a t i o n i t + μ i t
where IE represents the efficiency of innovation resource allocation in metropolitan areas; coordinate is the core explanatory variable, representing the level of industrial synergy; gdp is the gross domestic product, indicating the overall economic situation; fdi is foreign direct investment, representing the level of opening; mark is the population size of the metropolitan area, representing the market potential of the metropolitan area; education is the number of higher education institutions; β is the regression coefficient; and μ is the error term.

3.2. Variables

3.2.1. Explained Variable

Reflecting on the relevant literature and considering the obvious stage characteristics of innovation resources in scientific and technological output and economic output, this paper divides the innovation resource allocation process into two stages.
The first stage is the development of innovative resources, which is when innovation inputs are transformed into scientific and technological achievements. Research and development (R&D) personnel and funds are essential inputs during this stage, thus science and technology expenditures and scientific research and technical services personnel in metropolitan areas are chosen as input indicators. As for the output of this stage, knowledge and technological innovation achievements are the focus of consideration. Therefore, the number of high-level papers and the number of patents granted are selected as output indicators for this stage.
The second stage is economic transformation, that is, the stage where scientific and technological achievements generate economic benefits. The input indicators for this stage include science and technology expenditures and personnel in the first phase, which also have an impact on the economic transformation phase. The second stage’s input indicators also include the number of high-level papers and patents granted, which are the output indicators in the first stage. In addition, fixed asset investment is selected as an additional input indicator in this stage to reflect non-R&D investment. The output indicators for the second stage are gross industrial product and total retail sales of consumer goods, representing the overall economic performance of the metropolitan area.

3.2.2. Core Explanatory Variable

Industrial synergy in the metropolitan area not only emphasizes industrial connection and cooperation among cities within the metropolitan area to create a reasonable division of labor, but also emphasizes that the central city drives the surrounding cities to develop their industries together to achieve common prosperity. Compared with urban agglomerations, cities within metropolitan areas have closer industrial ties, a stronger desire for joint development, and more consistent goals. Therefore, we use the metropolitan area as the spatial unit for the empirical measurement.
First, the gravity model is used to calculate the industrial linkages between the central city and the surrounding cities within the metropolitan area. The gravity model is a vital function to describe the spatial role of cities and the intensity of economic radiation outward from the central city [34]. The model assumes that the trade flows between two economies are proportional to the size of their economies and inversely proportional to the distance between them.
Unlike the traditional gravity model that uses only the city GDP and population, in order to understand the level of coordinated development between the central city and the surrounding cities in terms of industries, this paper calculates the weighted comprehensive gravity values of the three major industries of the central city and the surrounding cities. The three major industries are agriculture, manufacturing, and services. The weighted comprehensive gravity values are calculated as shown in Formulas (8)–(10):
F i c j k = P i k V i k P c j V c j d i c 2
F i c j = k = 1 3 s i k F i c j k
F i c = j = 1 3 s c j F i c j
where F i c j k is the gravity value of industry j in central city c and industry k in surrounding city i, P denotes the employed population, V is the industry scale, and d is the shortest road traffic distance between the two cities; F i c j is the weighted gravity value of industry j in central city c and surrounding city i, and s i k is the share of industry k in the surrounding city i; Fic denotes the combined gravity value of central city c and surrounding city i, and s c j is the share of industry j in central city c.
In the statistical year, Fc, which is the total industrial linkages, intensity of central cities and surrounding cities in metropolitan areas can be obtained by Formula (11):
F c = i = 1 n F i c
where n is the number of surrounding cities in the metropolitan area.
Second, in order to achieve the shared prosperity of industries within the metropolitan area, the per capita wage gap between cities must not be too large. The Thiel index T is used to measure the wage gap within metropolitan areas in Formula (12),
T = i = 1 n ( I i I ) l o g ( I i / I P i / P )
where T is the Thiel index, Ii is the total wages of employees in city i, I is the total wages of all employees in the metropolitan area, Pi is the number of employees in city i, and P is the number of all employees in the metropolitan area.
Finally, the Technique for Order Preference by Similarity to Ideal Solution (TOPSIS) method is used to combine the positive indicator (industrial linkage intensity) and the negative indicator (wage gap) to obtain the overall industrial synergy level of the metropolitan area.

3.2.3. Control Variables

The control variables in this paper include the level of regional economic development, level of foreign openness, market size, and education level. Among them, the level of economic development is expressed by regional GDP, which is treated with a one-period lag in order to mitigate the endogeneity problem caused by reverse causality; the level of foreign openness is expressed as foreign direct investment (FDI); the market size is expressed as the number of the permanent population in the metropolitan area; and the level of education is expressed as the number of colleges and universities in the metropolitan area.

3.3. Research Sample and Data Sources

This paper identifies 31 important metropolitan areas in China from 2010 to 2019 for analysis based on the Report on the Development of China’s Metropolitan Areas published by Tsinghua University and the development plans of provincial capitals. The research data are panel data. The number of high-level papers is calculated based on the sum of the retrieved core literature written in English and Chinese. Chinese-language literature was obtained from the China National Knowledge Infrastructure, while the English-language literature was obtained from the Web of Science database. Other data came from the China City Statistical Yearbook and the statistical yearbooks of each city. We perform descriptive statistics and multicollinearity tests on the data. The test results show that the variance inflation factor (VIF) values of each variable are less than 10, implying that there is no multicollinearity. In addition, we perform a unit root test to identify the stationarity of the data. As the sample is a short panel, we use the Harris–Tzavalis (HT) test. Table 1 shows that the p values of all variables are less than 0.05, indicating that the null hypothesis that there is a unit root in the sample can be rejected and all variables are considered stable.
Because there is a time lag between innovation resource inputs and technological outcomes, there is also a time lag in the economic transformation of technological outcomes. Therefore, the input data for the innovation resource development phase are from 2008 to 2017, the data for intermediate outputs and additional inputs are from 2009 to 2018, and the final output data are from 2010 to 2019. At the same time, because science and technology expenditures have a cumulative effect, and their previous inputs will still have an impact in the current period, the perpetual inventory method was adopted to estimate the stock of science and technology expenditures [35]. We set 2008 as the base period. The calculation formula for the science and technology expenditure stock in the base period is ST0 = I0/(g + δ), where I0 is the science and technology expenditure in 2008, g is the average growth rate of science and technology expenditure from 2008 to 2017, and δ is the depreciation rate, which takes the value of 0.15; 0.15 is the empirical value, which is consistent with the convention in the literature [4,36]. The calculation formula for annual science and technology expenditure stock is Kij = Ki(t−1)(1 − δ) + Iit, where Iit is the annual science and technology expenditure flow of each region.

4. Results

4.1. Measurement Results

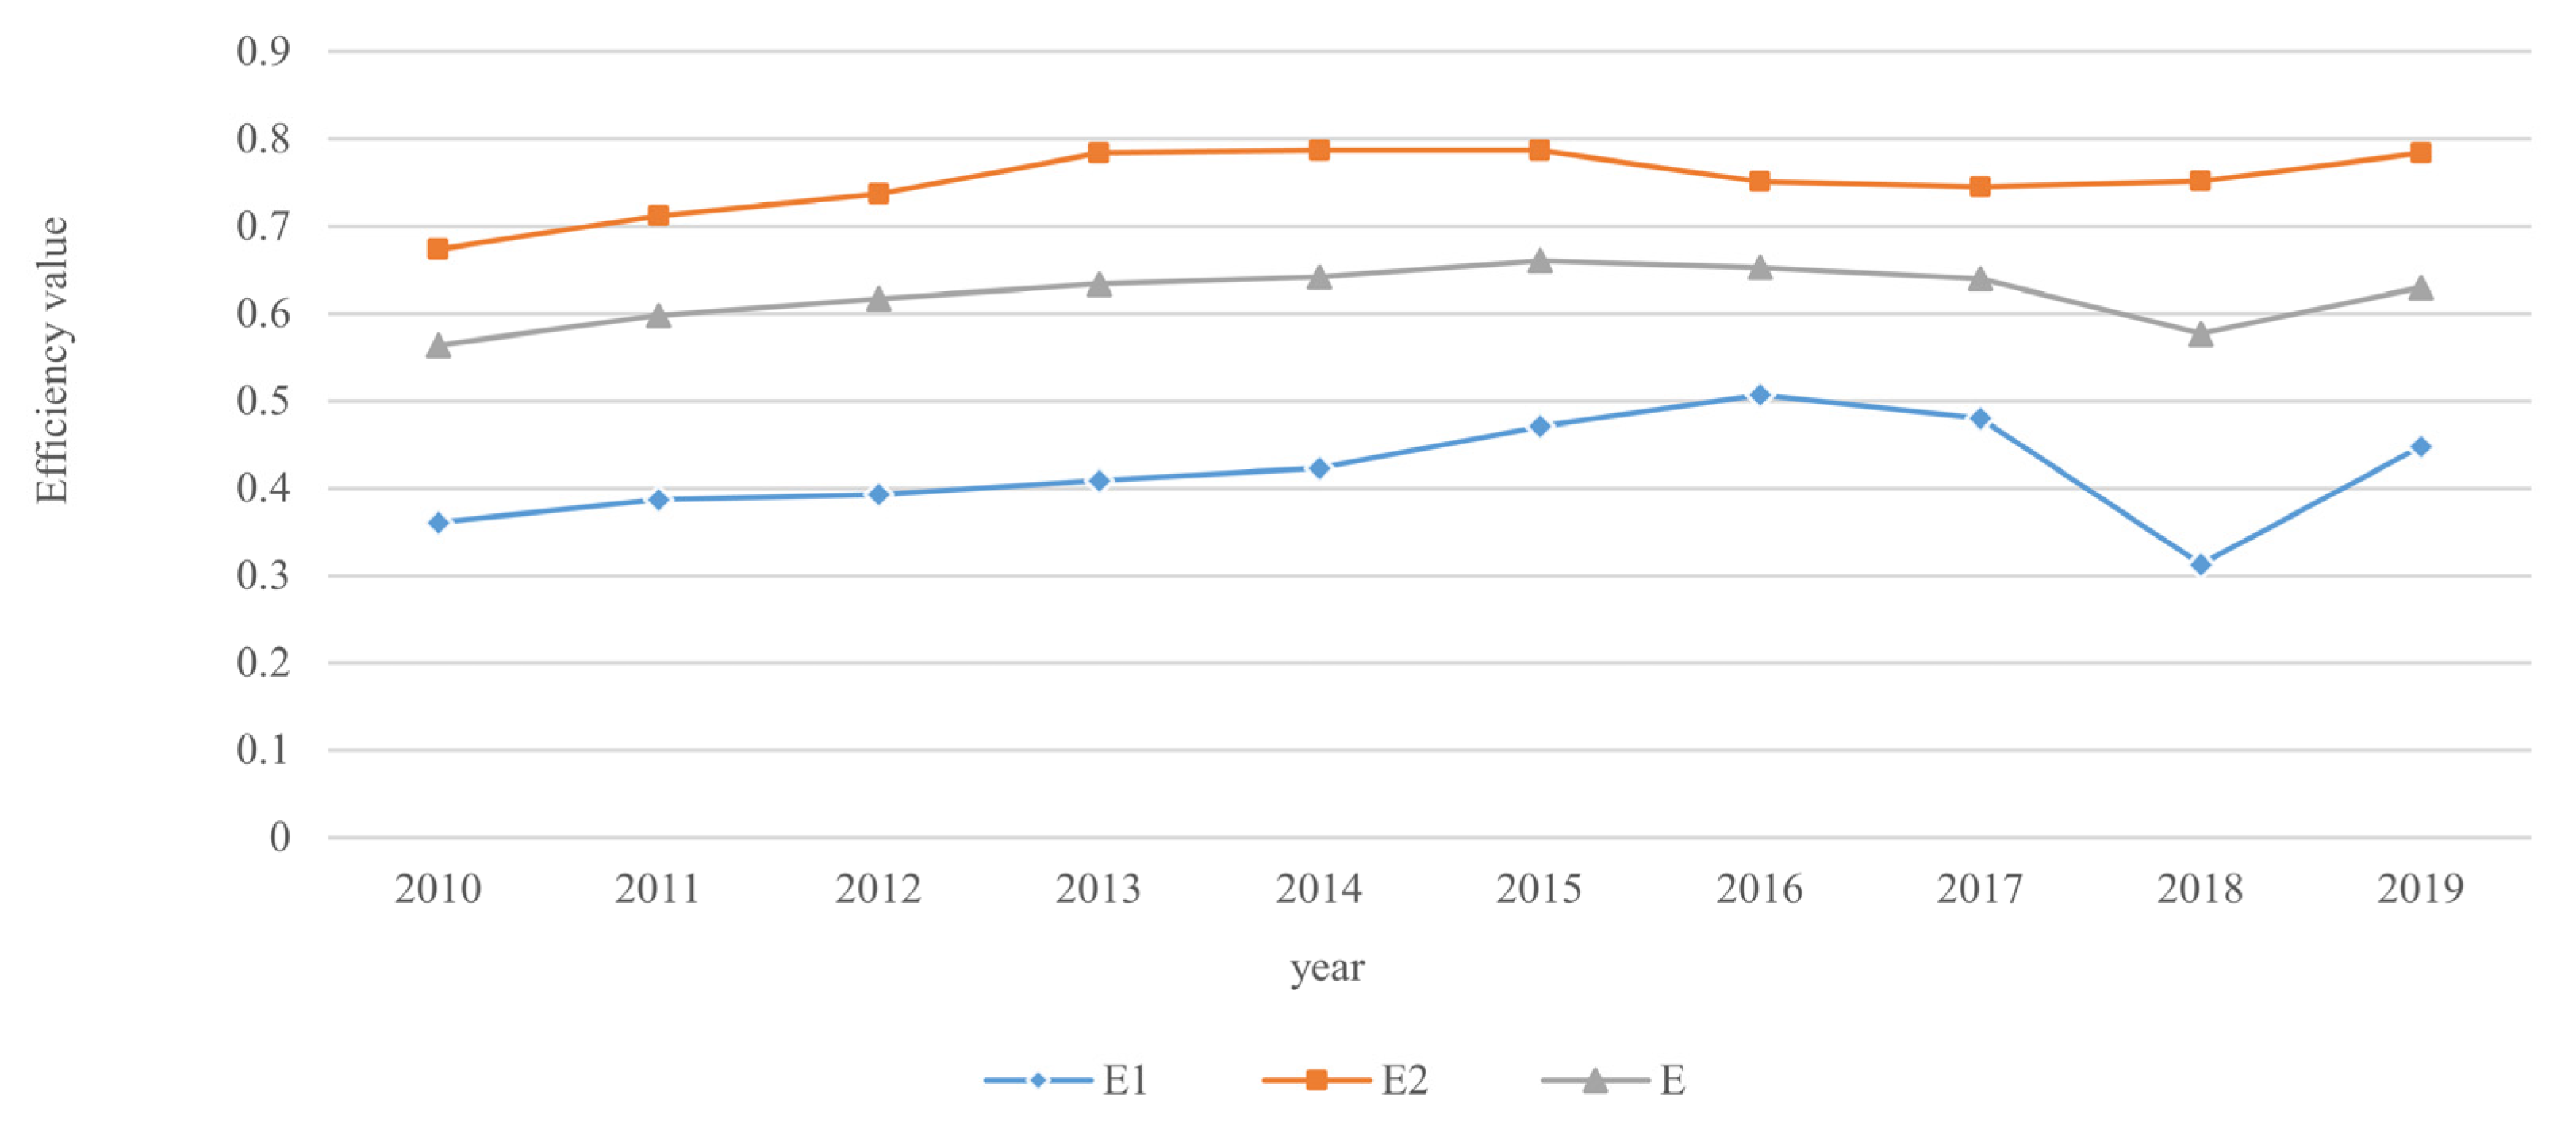
We estimated the results using MATLAB 2018b (see Table 2). Nationally, there is a slow upward trend in the efficiency of both the innovation resource development phase and the economic transformation phase (see Figure 2). The innovation resource development phase is less efficient and more volatile than the economic transformation phase. For a long time, China’s development model has followed the theory of comparative advantage. Although China has achieved rapid economic growth in the international division of labor, it has also formed technological dependence, resulting in a weak independent innovation capacity. In 2018, China’s efficiency in the innovation resource development phase declined due to the outbreak of the trade war between China and the United States and the increased technology lockdowns in developed countries
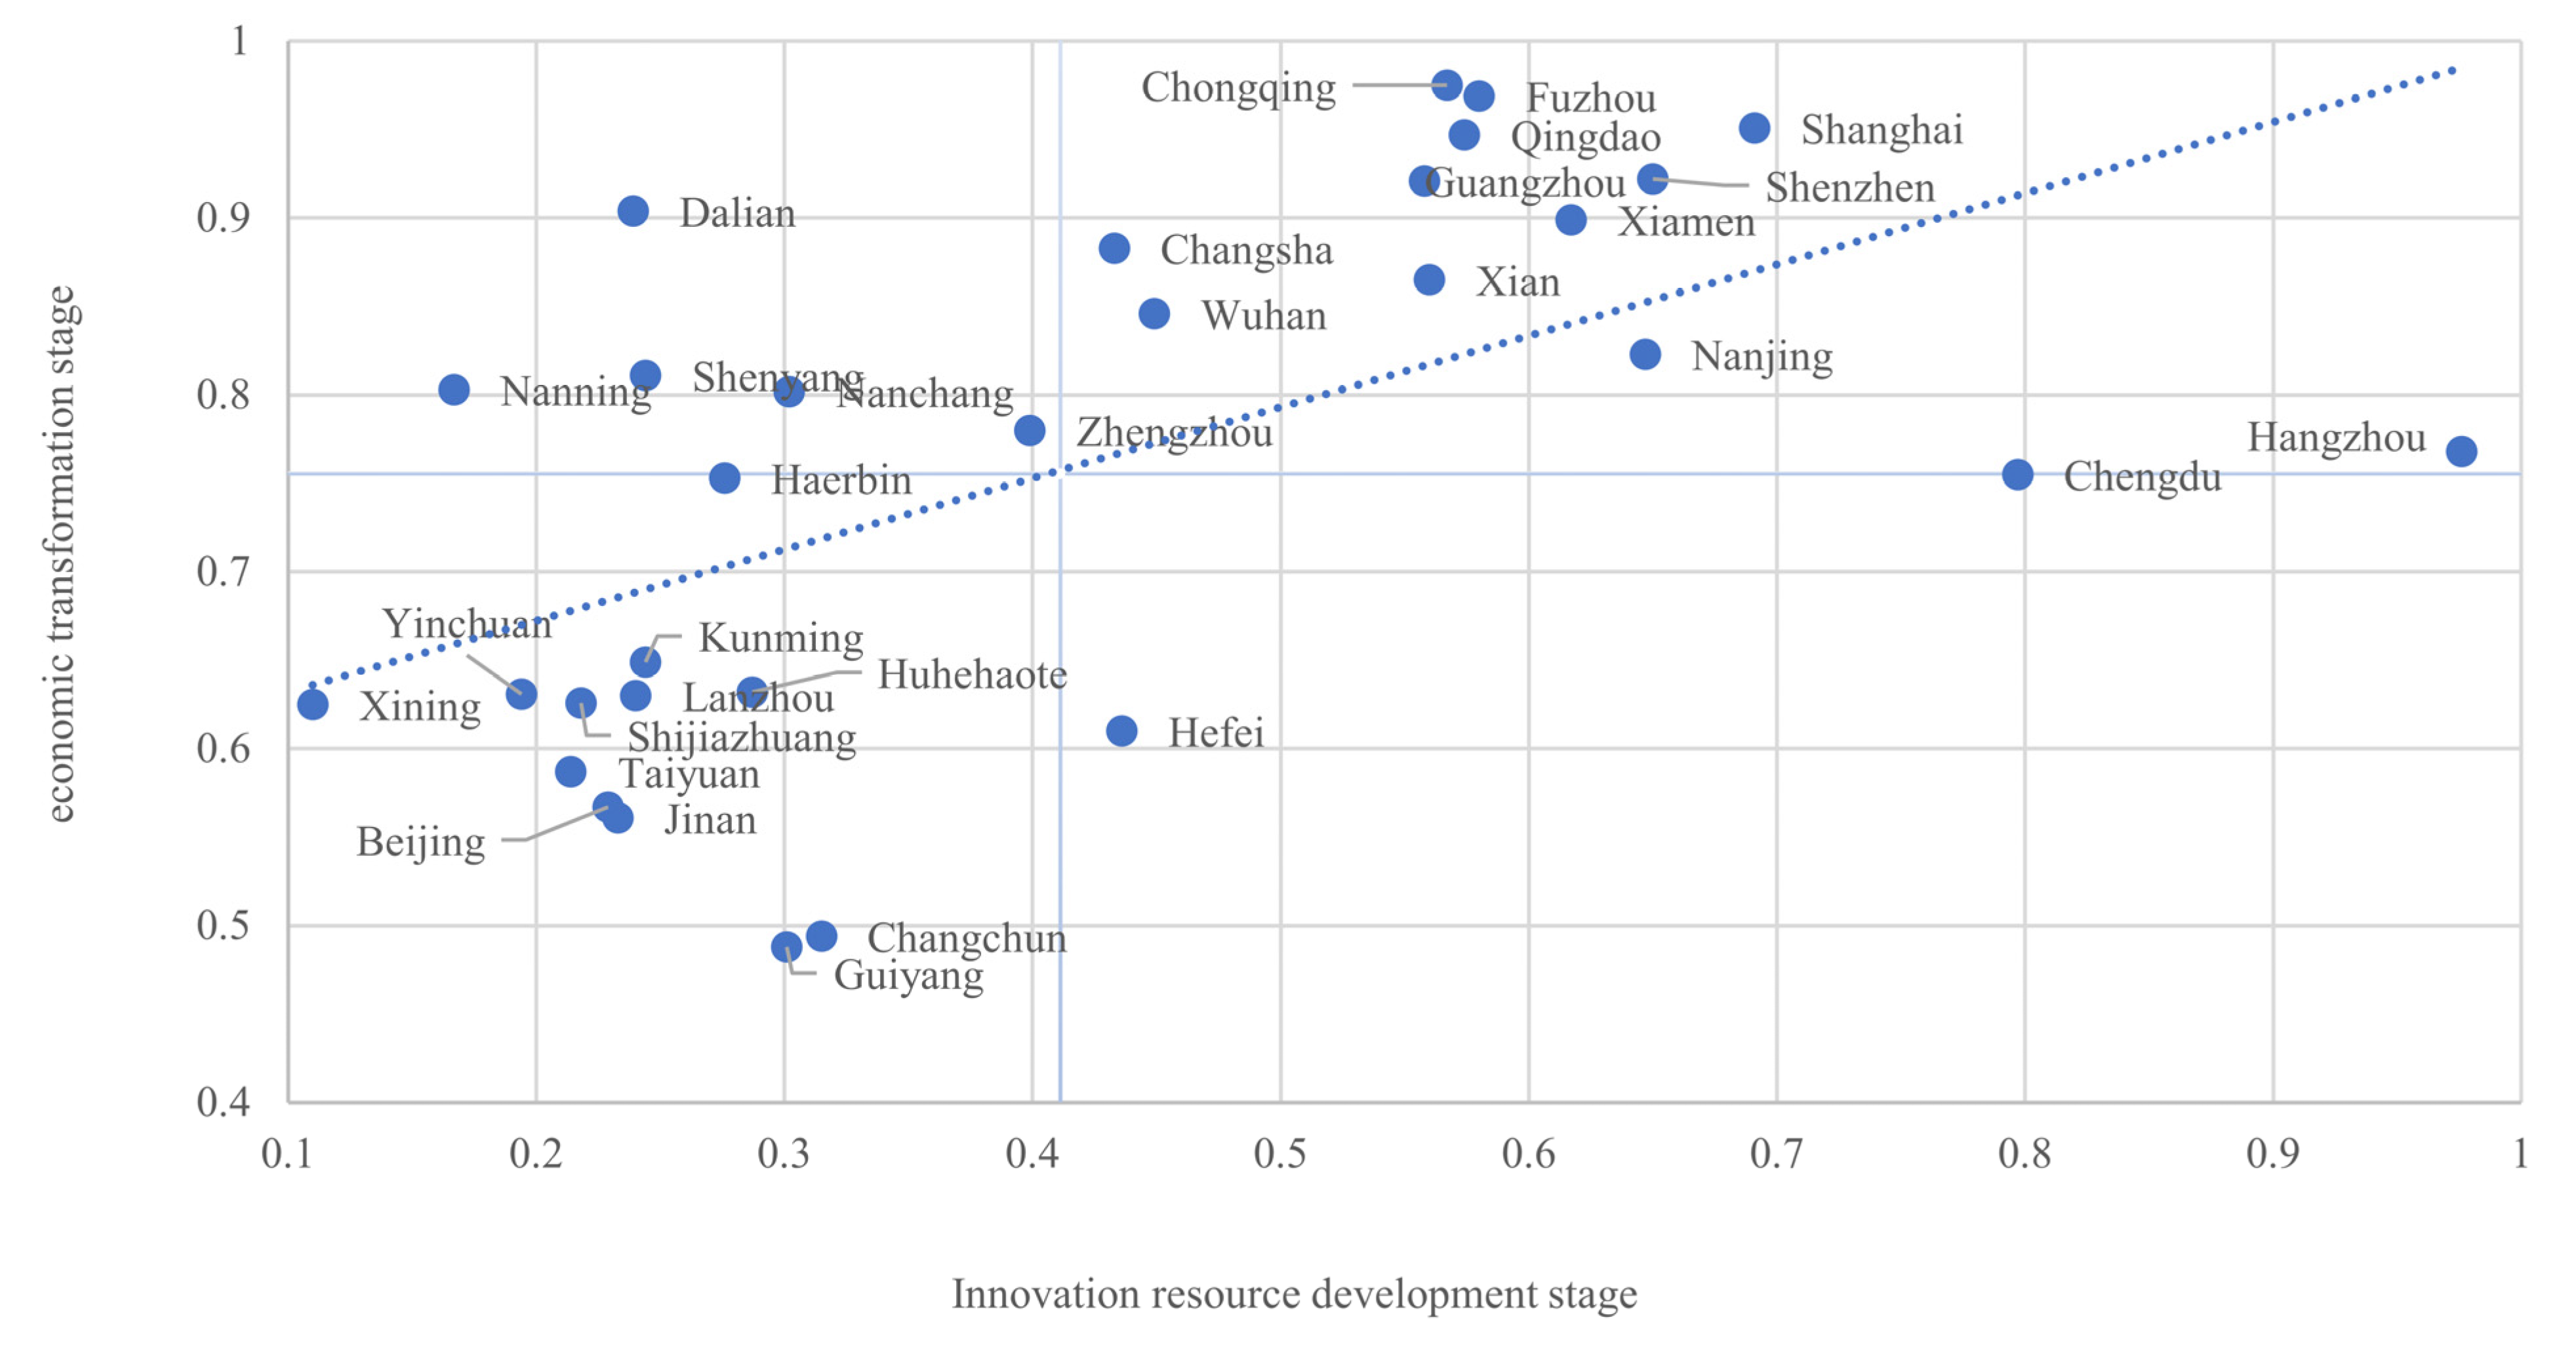
In terms of metropolitan areas, the Hangzhou, Chengdu, Shanghai, Shenzhen, and Nanjing metropolitan areas are more efficient, and the Yinchuan, Nanning, and Xining metropolitan areas are less efficient during the innovation resource development phase (see Table 2). On one hand, cities such as Hangzhou, Shanghai, Shenzhen, and Nanjing are among the top cities in China in terms of their investment in science and technology and the number of patent applications. On the other hand, these cities have attracted many young talents and emerging industries, forming industrial clusters with neighboring cities to achieve coordinated development. In the economic transformation stage, the Shanghai, Shenzhen, Fuzhou, Chongqing, and Qingdao metropolitan areas are more efficient, while the Guiyang, Changchun, and Jinan metropolitan areas are less efficient. On one hand, metropolitan areas such as Shanghai, Hangzhou, Fuzhou, and Shenzhen have a high degree of marketization, which is conductive to the economic transformation of scientific achievements. On the other hand, the industrial systems in these regions are more developed, which is conductive to achieving regional industrial cooperation. For example, Shanghai has well-developed modern service industries, such as finance and trade, while neighboring cities have well-developed manufacturing industries, which creates complementarity.
In terms of overall efficiency, the efficiency of innovative resource allocation in the Shanghai, Hangzhou, Fuzhou, and Shenzhen metropolitan areas is higher, while that of the Guiyang, Xining, Changchun, and Beijing metropolitan areas is lower. Cities such as Guiyang, Xining, and Changchun experience more severe brain drain, limited investment in science and technology, and more pronounced difficulties in industrial transformation and overhaul. Moreover, these cities have failed to have a radiating effect on their neighboring cities, resulting in a lack of innovation vitality in the metropolitan area. It is worth noting that although Beijing is home to many high-tech industries and modern service industries and has the most significant number of universities and research institutes in China, the economic gap between Beijing and its neighboring cities is wide. Neighboring cities cannot effectively undertake industrial transfer from Beijing, resulting in the low efficiency of innovative resource allocation in the Beijing metropolitan area.
A scatterplot was mapped out by integrating the two stages of innovation resource development and economic transformation (see Figure 3). The horizontal axis represents the efficiency of the innovation resource development stage, and the vertical axis represents the efficiency of the economic transformation stage. The mean value of the innovation resource development stage is 0.41, and the mean value of the economic transformation stage is 0.76; accordingly, the efficiency of innovation resource allocation in different metropolitan areas is classified into four types, using 0.41 and 0.76 as the boundaries. The bottom left corner shows the metropolitan areas with low efficiency in both phases, located mainly in the north and southwest parts of the country. The upper left corner shows metropolitan areas that are less efficient in the innovation resource development phase, but more efficient in the economic transformation phase; these areas are mainly located in the central region of the country. In recent years, central China has witnessed rapid economic growth, but it has mainly been driven by investment. The upper right corner shows the metropolitan areas with high efficiency in both phases, such as Shanghai, Shenzhen, Guangzhou, and Hangzhou. These metropolitan centers are rich in innovative resources and have a vibrant market economy, which has a positive impact on the surrounding areas. The lower right corner shows areas that are more efficient in the resource development phase, but less efficient in the economic transformation phase.

4.2. Aggregate Analysis

We used Stata 15.0 for Tobit regression analysis. The results in Table 3 show that the influence coefficient of industrial synergy on overall efficiency is 0.289 and is significant at the 5% level, indicating that industrial synergy in metropolitan areas has a significantly positive impact on the efficiency of innovation resource allocation. The coefficients of industrial synergy in the innovation resource development stage and economic transformation stage are 0.245 and 0.276, respectively. The latter exceeding the former indicates that the impact of industrial synergy is greater in the economic transformation phase than in the innovation resource development phase. Industrial synergy can improve the efficiency of innovative resource allocation by improving regional specialization, and it can also overcome the constraints of the original administrative divisions to promote industrial cooperation between cities.
The economic level of the metropolitan area has a significantly positive impact on the efficiency of innovation resource allocation in all stages. Economically developed regions can provide a good financing environment for innovative activities and good public service facilities for technological innovation.
FDI in metropolitan areas has a significantly positive effect on the innovation resource development stage and no significant effect on the economic transformation stage. In the development stage, FDI can provide domestic enterprises with advanced technology and management experience, reducing the R&D costs of domestic enterprises. In the economic transformation stage, the entry of highly efficient foreign enterprises reduces the market share and economic efficiency of domestic enterprises due to China’s late industrialization and low level of market development.
The number of higher education institutions in the metropolitan area has a significantly positive effect on the innovation resource development stage and an insignificant effect on the economic transformation stage. Universities have access to many researchers and considerable research funds to produce large volumes of research outputs. However, colleges and universities have little experience in applying the results of those outputs, thus their impact on the economic transformation phase is not significant.
The population size of the metropolitan area has a positive effect on the efficiency of the allocation of innovation resources at each stage; however, this effect is not significant.

4.3. Regional Heterogeneity Analysis

The results in Table 4 show that the effect of industrial synergy on innovation resource allocation efficiency is significantly positive in the eastern metropolitan areas, but not significant in the central and western metropolitan areas. First, the market economy in the eastern region is more active and traffic is more accessible, which is conductive to the circulation of product and factor markets and industrial cooperation between cities. Second, the industrial division of labor in the eastern metropolitan area is more efficient and the degree of specialization is higher, which is conductive to improving the efficiency of innovative resource allocation.
As shown in Table 4, the impact of industrial synergy on the efficiency of innovation resource allocation is significantly positive in the southern metropolitan areas, but not significant in the northern ones. First, industries in northern China are mostly resource-dependent heavy industries that achieved relatively rapid development in the early stages of industrialization. However, the resource and investment-driven industrial model is not sustainable and is prone to a range of problems, such as overcapacity and environmental pollution. Second, there are more state-owned enterprises in northern China, and government control over and intervention in resources is more entrenched, which is not conductive to the development of industrial synergy and the cultivation of talents with innovative abilities.

5. Discussion

This paper constructs a network DEA model based on resource sharing and two-stage additional input to measure efficiency. The results show that the efficiency of innovation resource allocation in China’s metropolitan area is slowly increasing, although the efficiency of the economic transformation stage is lower than that of the development stage. Li et al. [37] and Feng et al. [35] have also reached similar conclusions, but Li et al. [37] studied a single city and used a common two-stage chain network DEA. Feng et al. [35] measured the innovation efficiency of 57 countries based on a two-stage meta-frontier dynamic network DEA. The research method in this paper fully considers the multi-stage and internal structural complexity of innovation resources in the allocation process, which is beneficial for further analyzing the causes of inefficiency and seeking solutions. Local governments can improve the efficiency of innovation resource allocation in metropolitan areas based on the results for different stages. For metropolitan areas with high efficiency in the innovation resources development phase, but low efficiency in the economic transformation phase, local governments need to accelerate market-based reforms to enhance the transformation of technological achievements and break down local protectionism to strengthen regional industrial linkages. For metropolitan areas with high efficiency in the economic transformation phase, but low efficiency in the innovation resource development phase, local governments should strengthen the creation of innovation culture and the construction of creative space to better attract and cultivate talent.
The results of this paper show that there are significant regional differences in the efficiency of innovation resource allocation in China. Innovation resource allocation efficiency is highest in the southeast coastal metropolitan areas. Although this finding partly echoes Liu et al.’s [38] conclusions, there are also differences. Liu et al. [38] studied 30 Chinese provinces and found that the overall innovation efficiency was higher in the eastern coastal region and the middle Yangtze River region, while the middle Yellow River region was the least efficient. Chen et al. [13] also measured the innovation efficiency of Chinese provinces, using a two-stage network DEA model. Their results showed that the technological development efficiency, economic transformation efficiency, and overall innovation efficiency of the eastern coastal provinces were generally higher than those of the central and western provinces. This paper extends the literature on the efficiency of innovation resource allocation by using the Chinese metropolitan area as a unit of study. These findings can provide theoretical guidance for local governments to allocate innovation resources more efficiently.
Finally, this study empirically demonstrates that industrial synergy in metropolitan areas has a facilitating effect on the efficiency of innovation resource allocation, and this effect shows regional heterogeneity. Chen et al. [22] also observed that regional industrial synergy can unlock economic growth potential in a larger space, using a single metropolitan area as an example. However, for a long time, the industrial isomorphism in China’s metropolitan areas has been obvious. Cross-regional synergy is often constrained by issues such as unequal administrative levels, inconsistent local development intentions, and imperfect cost-sharing and benefit-sharing mechanisms. This paper’s research results provide a basis for relevant government departments to formulate cross-regional industrial cooperation policies and achieve sustainable regional development.

6. Conclusions

Using a network DEA model based on resource sharing and two-stage additional input, this paper explored the impact of industrial synergy in metropolitan areas on the efficiency of innovation resource allocation and conducted a regional heterogeneity analysis. The main findings are as follows. First, the efficiency of innovation resource allocation in metropolitan areas shows a slow upward trend. The innovation resource development phase is less efficient and more volatile than the economic transformation phase. Second, there are also significant differences in the efficiency of innovation resource allocation in Chinese metropolitan areas. Metropolitan areas located on the southeast coast of China, such as Shanghai, Shenzhen, and Guangzhou, have higher innovative resource allocation efficiency in both stages. Metropolitan areas located in the north and southwest of China have lower innovative resource allocation efficiency in both stages. Metropolitan areas located in central China are less efficient in the innovation resource development stage, but more efficient in the economic transformation stage. Third, industrial synergy in metropolitan areas has a significantly positive impact on the efficiency of innovation resource allocation in China. The positive impact is greater in the economic transformation phase than in the innovation resource development phase. Moreover, there is regional heterogeneity in the impact of metropolitan area industrial synergy on the efficiency of innovation resource allocation. The impact is significantly positive in the eastern metropolitan areas, but not significant in the central and western metropolitan areas. There is a more significantly positive impact in the southern metropolitan areas than in the northern metropolitan areas.
Finally, this paper has some limitations that can provide directions for future research. First, the combination of the gravity model and the Thiel index is a simulated measure of industrial synergy in metropolitan areas and cannot fully represent the effect of industrial synergy between cities. Future studies can consider using multi-source big data, such as traffic flow, information flow, and capital flow, to reflect the industrial connections between cities more practically. Second, the mechanism analysis in this paper is relatively weak due to the lack of micro-level data. Future studies could further analyze the impact mechanisms and causal effects. Third, innovation activities among cities may have spatial correlation or spillover effects. Future studies can establish a spatial econometric model to further analyze the impact of industrial synergy on regional innovation resource allocation efficiency.

Author Contributions

Conceptualization, Y.J.; Data curation, H.C.; Methodology, Y.J.; Software, H.C.; Validation, H.C.; Writing—original draft, Y.J.; Writing—review & editing, Z.W. All authors have read and agreed to the published version of the manuscript.

Funding

This research was supported by Major Program of National Fund of Philosophy and Social Science of China (Grant number: 20ZDA092).

Data Availability Statement

The datasets used in this study are available from the corresponding author on reasonable request.

Conflicts of Interest

The authors declare no conflict of interest.

References

  1. Jiao, H.; Zhou, J.; Gao, T.; Liu, X. The more interactions the better? The moderating effect of the interaction between local producers and users of knowledge on the relationship between R&D investment and regional innovation systems. Technol. Forecast. Soc. Change 2016, 110, 13–20. [Google Scholar] [CrossRef]
  2. Zeng, J.; Ribeiro-Soriano, D.; Ren, J. Innovation efficiency: A bibliometric review and future research agenda. Asia Pac. Bus. Rev. 2021, 27, 209–228. [Google Scholar] [CrossRef]
  3. Tsionas, M.G. Optimal combinations of stochastic frontier and data envelopment analysis models. Eur. J. Oper. Res. 2021, 294, 790–800. [Google Scholar] [CrossRef]
  4. Zhu, L.; Luo, J.; Dong, Q.; Zhao, Y.; Wang, Y.; Wang, Y. Green technology innovation efficiency of energy-intensive industries in China from the perspective of shared resources: Dynamic change and improvement path. Technol. Forecast. Soc. Change 2021, 170, 120890. [Google Scholar] [CrossRef]
  5. Wang, S.; Fan, J.; Zhao, D.; Wang, S. Regional innovation environment and innovation efficiency: The Chinese case. Technol. Anal. Strat. Manag. 2016, 28, 396–410. [Google Scholar] [CrossRef]
  6. Moaniba, I.M.; Su, H.-N.; Lee, P.-C. On the drivers of innovation: Does the co-evolution of technological diversification and international collaboration matter? Technol. Forecast. Soc. Change 2019, 148, 127–136. [Google Scholar] [CrossRef]
  7. D’Ambrosio, A.; Gabriele, R.; Schiavone, F.; Villasalero, M. The role of openness in explaining innovation performance in a regional context. J. Technol. Transf. 2017, 42, 389–408. [Google Scholar] [CrossRef] [Green Version]
  8. Hong, J.; Feng, B.; Wu, Y.; Wang, L. Do government grants promote innovation efficiency in China’s high-tech industries? Technovation 2016, 57–58, 4–13. [Google Scholar] [CrossRef]
  9. Krammer, S.M.; Jiménez, A. Do political connections matter for firm innovation? Evidence from emerging markets in Central Asia and Eastern Europe. Technol. Forecast. Soc. Change 2020, 151, 119669. [Google Scholar] [CrossRef] [Green Version]
  10. Ning, L.; Wang, F.; Li, J. Urban innovation, regional externalities of foreign direct investment and industrial agglomeration: Evidence from Chinese cities. Res. Policy 2016, 45, 830–843. [Google Scholar] [CrossRef]
  11. Anokhin, S.; Wincent, J.; Parida, V.; Chistyakova, N.; Oghazi, P. Industrial clusters, flagship enterprises and regional innovation. Entrep. Reg. Dev. 2019, 31, 104–118. [Google Scholar] [CrossRef] [Green Version]
  12. Shao, S.; Yang, L. Natural resource dependence, human capital accumulation, and economic growth: A combined explanation for the resource curse and the resource blessing. Energy Policy 2014, 74, 632–642. [Google Scholar] [CrossRef]
  13. Chen, H.; Lin, H.; Zou, W. Research on the Regional Differences and Influencing Factors of the Innovation Efficiency of China’s High-Tech Industries: Based on a Shared Inputs Two-Stage Network DEA. Sustainability 2020, 12, 3284. [Google Scholar] [CrossRef] [Green Version]
  14. Jucu, I.S. Recent issues of spatial restructuring in Romanian medium-sized towns: Spatial conversion and local urban regeneration. In Proceedings of the 16th International Multidisciplinary Scientific Geoconference (SGEM 2016), Albena, Bulgaria, 30 June–6 July 2016; Volume 3, pp. 493–500. [Google Scholar]
  15. Jucu, I.S. The spatial polarization of small-sized towns in Timis County of Romania. In Proceedings of the 15th International Multidisciplinary Scientific Geoconference (SGEM), Albena, Bulgaria, 18–24 June 2015; pp. 729–736. [Google Scholar]
  16. Jucu, I.S. From State-Socialist Ambitions of Romanian Rural Indutrialisation to Post-Socialist Rural Deindutrialisation: Two Case Studies from Romania. East. Eur. Countrys. 2016, 22, 165–195. [Google Scholar] [CrossRef] [Green Version]
  17. Pan, X.; Pan, X.; Ai, B.; Guo, S. Structural heterogeneity and proximity mechanism of China’s inter-regional innovation cooperation network. Technol. Anal. Strat. Manag. 2020, 32, 1066–1081. [Google Scholar] [CrossRef]
  18. Fan, F.; Lian, H.; Wang, S. Can regional collaborative innovation improve innovation efficiency? An empirical study of Chinese cities. Growth Change 2019, 51, 440–463. [Google Scholar] [CrossRef]
  19. de Abreu, M.C.S.; de Andrade, R.D.C. Dealing with wicked problems in socio-ecological systems affected by industrial disasters: A framework for collaborative and adaptive governance. Sci. Total Environ. 2019, 694, 133700. [Google Scholar] [CrossRef]
  20. Huang, Y.; Wang, Y. How does high-speed railway affect green innovation efficiency? A perspective of innovation factor mobility. J. Clean. Prod. 2020, 265, 121623. [Google Scholar] [CrossRef]
  21. Zhang, M.; Li, B.; Yin, S. Configurational paths to regional innovation performance: The interplay of innovation elements based on a fuzzy-set qualitative comparative analysis approach. Technol. Anal. Strat. Manag. 2020, 32, 1422–1435. [Google Scholar] [CrossRef]
  22. Chen, Y.; Nie, H.; Chen, J.; Peng, L. Regional industrial synergy: Potential and path crossing the “environmental mountain”. Sci. Total. Environ. 2021, 765, 142714. [Google Scholar] [CrossRef]
  23. Hao, Y.; Gai, Z.; Yan, G.; Wu, H.; Irfan, M. The spatial spillover effect and nonlinear relationship analysis between environmental decentralization, government corruption and air pollution: Evidence from China. Sci. Total. Environ. 2021, 763, 144183. [Google Scholar] [CrossRef] [PubMed]
  24. Gan, L.; Shi, H.; Hu, Y.; Lev, B.; Lan, H. Coupling coordination degree for urbanization city-industry integration level: Sichuan case. Sustain. Cities Soc. 2020, 58, 102136. [Google Scholar] [CrossRef]
  25. Glaeser, E.L.; Kolko, J.; Saiz, A. Consumer city. J. Econ. Geogr. 2001, 1, 27–50. [Google Scholar] [CrossRef]
  26. Gómez-Antonio, M.; Sweeney, S. Testing the role of intra-metropolitan local factors on knowledge-intensive industries’ location choices. Ann. Reg. Sci. 2021, 66, 699–728. [Google Scholar] [CrossRef]
  27. Li, J.; Xing, J. Why Is Collaborative Agglomeration of Innovation so Important for Improving Regional Innovation Capabilities? A Perspective Based on Collaborative Agglomeration of Industry-University-Research Institution. Complexity 2020, 2020, 7049606–7049621. [Google Scholar] [CrossRef]
  28. Wang, Z.; Zhang, Z.; Jhony, N.C.Y. Measurement of innovation resource allocation efficiency in civil–military integration enterprises. Kybernetes 2020, 49, 835–851. [Google Scholar] [CrossRef]
  29. Cook, W.D.; Liang, L.; Zhu, J. Measuring performance of two-stage network structures by DEA: A review and future perspective. Omega 2010, 38, 423–430. [Google Scholar] [CrossRef]
  30. Kao, C. Network data envelopment analysis: A review. Eur. J. Oper. Res. 2014, 239, 1–16. [Google Scholar] [CrossRef]
  31. Kao, C. Efficiency measurement and frontier projection identification for general two-stage systems in data envelopment analysis. Eur. J. Oper. Res. 2017, 261, 679–689. [Google Scholar] [CrossRef]
  32. Kao, C. Multiplicative aggregation of division efficiencies in network data envelopment analysis. Eur. J. Oper. Res. 2018, 270, 328–336. [Google Scholar] [CrossRef]
  33. Chen, X.; Liu, Z.; Zhu, Q. Performance evaluation of China’s high-tech innovation process: Analysis based on the innovation value chain. Technovation 2018, 74–75, 42–53. [Google Scholar] [CrossRef]
  34. Sheng, Y.; Zhao, J.; Zhang, X.; Song, J.; Miao, Y. Innovation efficiency and spatial spillover in urban agglomerations: A case of the Beijing-Tianjin-Hebei, the Yangtze River Delta, and the Pearl River Delta. Growth Change 2019, 50, 1280–1310. [Google Scholar] [CrossRef]
  35. Feng, Y.; Zhang, H.; Chiu, Y.-H.; Chang, T.-H. Innovation efficiency and the impact of the institutional quality: A cross-country analysis using the two-stage meta-frontier dynamic network DEA model. Scientometrics 2021, 126, 3091–3129. [Google Scholar] [CrossRef]
  36. Griliches, Z. R&D and the productivity slowdown. Am. Econ. Rev. 1980, 70, 343–348. [Google Scholar]
  37. Li, H.; Zhang, J.; Wang, C.; Wang, Y.; Coffey, V. An evaluation of the impact of environmental regulation on the efficiency of technology innovation using the combined DEA model: A case study of Xi’an, China. Sustain. Cities Soc. 2018, 42, 355–369. [Google Scholar] [CrossRef]
  38. Liu, H.-H.; Yang, G.-L.; Liu, X.-X.; Song, Y.-Y. R&D performance assessment of industrial enterprises in China: A two-stage DEA approach. Socio-Econ. Plan. Sci. 2020, 71, 100753. [Google Scholar] [CrossRef]
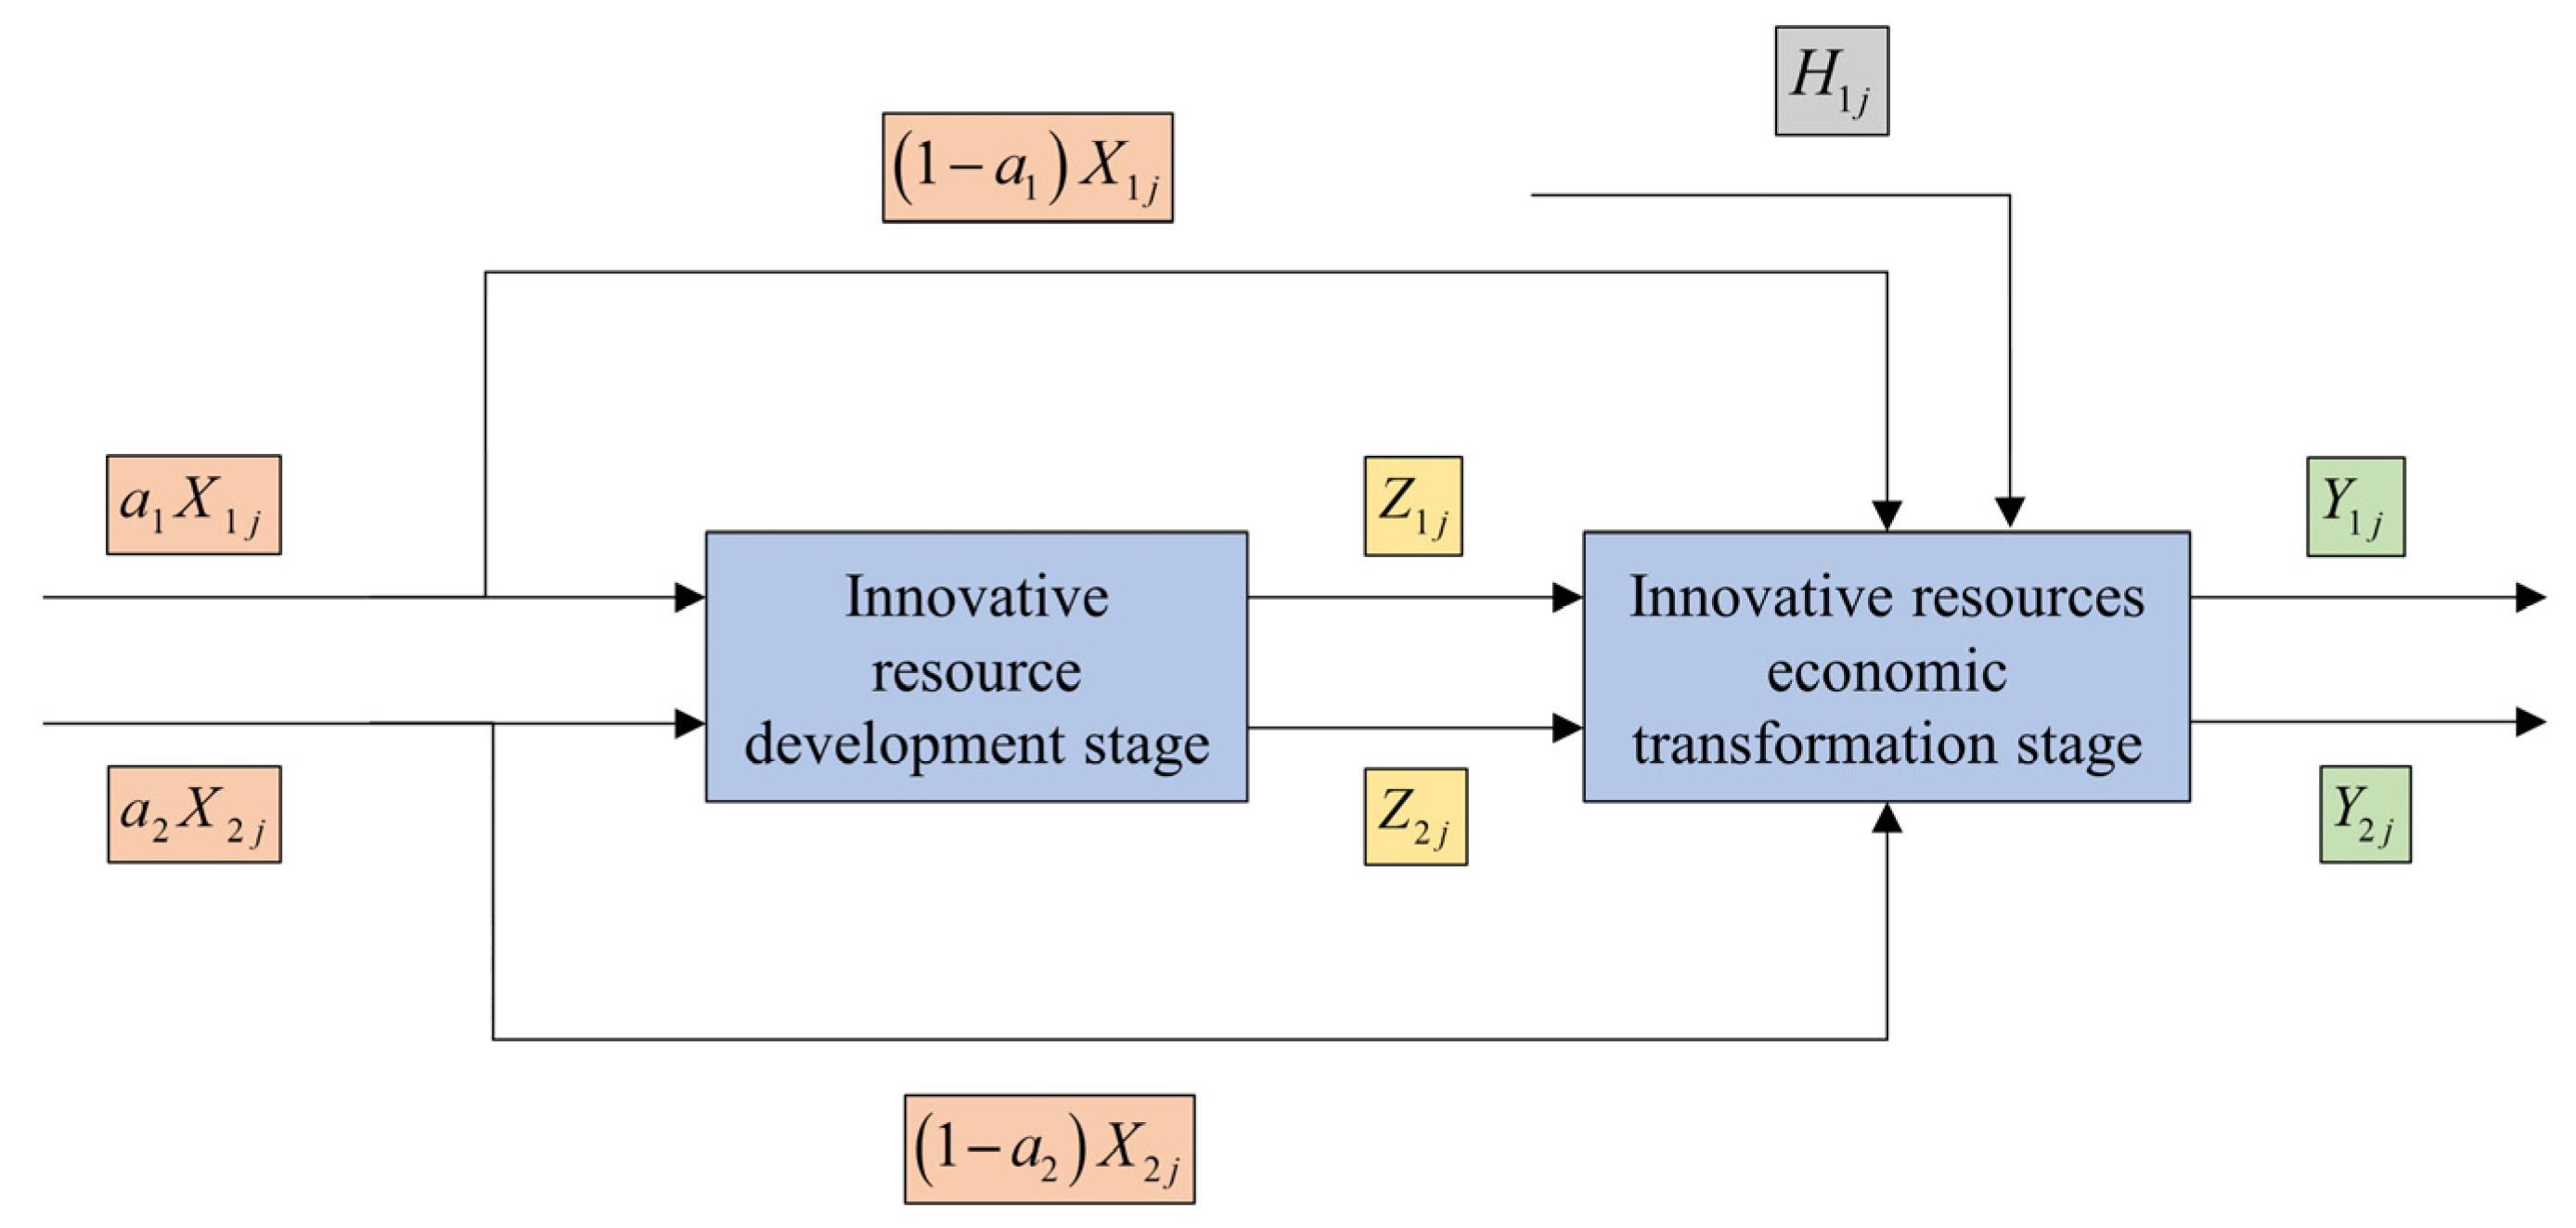
Figure 1. Network DEA model based on resource sharing and two-stage additional input.
Land 12 00177 g001
Figure 2. Line chart of innovation resource allocation efficiency.
Land 12 00177 g002
Figure 3. Scatterplot of innovative resource allocation efficiency in metropolitan areas.
Land 12 00177 g003
Table 1. Descriptive statistics and testing of data.
VariableDefinitionMeanStd.Min.Max.VIFHT
IEInnovation resource allocation efficiency0.7010.1710.33111.22−0.013 ***
(0.000)
synergyLevel of industrial synergy0.0630.1180.00111.39−0.252 ***
(0.000)
gdpGross domestic product (trillion yuan)1.1681.1120.0587.0022.91−0.011 **
(0.033)
fdiForeign direct investment (billion dollars)60.33074.9470.109416.0888.62−0.261 ***
(0.000)
markPopulation size
(million people)
5.91820.8090.222179.2051.06−0.190 ***
(0.000)
educationNumber of higher education institutions (institutions)61.56636.33821912.43−0.284 ***
(0.000)
Note: *** p < 0.01, ** p < 0.05; p values in parentheses.
Table 2. Measurement results of innovation resource allocation efficiency.
Metropolitan AreasE1E2E
MeanSDMeanSDMeanSD
Shanghai0.6920.2210.9480.0780.8450.075
Hangzhou0.9680.0430.7680.0690.8150.057
Fuzhou0.5720.1410.9660.0010.8130.029
Shenzhen0.6540.1240.9180.0590.8110.073
Chongqing0.5620.1390.9680.0010.8090.029
Qingdao0.5710.0630.9430.0020.7960.015
Xiamen0.6140.1780.8980.0010.7860.036
Guangzhou0.5560.1650.9180.1420.7730.093
Chengdu0.7960.2210.7520.2330.7710.187
Nanjing0.6450.0640.8210.1060.7520.083
Xian0.5640.2310.8610.1170.7410.117
Changsha0.4310.1320.8790.0810.7020.072
Wuhan0.4480.1290.8430.0860.6870.079
Dalian0.2360.0780.9020.0510.6360.048
Zhengzhou0.3980.1690.7830.0620.6280.061
Nanchang0.3010.1110.8010.0850.6010.064
Shenyang0.2420.0580.8090.1510.5840.121
Haerbin0.2750.1340.7520.1690.5620.149
Nanning0.1660.0580.8020.1160.5480.097
Hefei0.4350.1250.6110.0910.5410.054
Huhehaote0.2860.0910.6330.0350.4950.038
Kunming0.2430.0860.6470.0270.4860.025
Lanzhou0.2410.1030.6320.6460.4730.061
Shijiazhuang0.2160.0460.6250.0640.4620.054
Yinchuan0.1920.1280.6290.1260.4560.107
Taiyuan0.2120.0570.5860.0330.4370.031
Jinan0.2320.0420.5580.1190.4320.107
Beijing0.2280.4460.5650.1050.4280.081
Changchun0.3130.0790.4920.0430.4220.045
Xining0.1130.1350.6240.0110.4170.013
Guiyang0.3030.1170.4910.0180.4130.031
Table 3. Overall analysis.
VariableE1E2E
coordinate0.245 ***
(0.003)
0.276 **
(0.021)
0.289 **
(0.048)
gdp0.891 ***
(0.005)
0.677 **
(0.032)
0.678 **
(0.023)
fdi0.682 ***
(0.003)
0.002
(0.927)
0.578 ***
(0.002)
mark0.072
(0.589)
0.085
(0.472)
0.059
(0.689)
education0.567 **
(0.035)
0.218
(0.497)
0.541 **
(0.025)
cons0.337 ***
(0.000)
0.657 ***
(0.000)
0.489 ***
(0.000)
R20.9210.9240.923
Obs310310310
Note: *** p < 0.01, ** p < 0.05; Robust standard errors in parentheses.
Table 4. Analysis of regional heterogeneity.
VariableEasternCentral and WesternSouthernNorth
coordinate0.318 *
(0.076)
0.642
(0.114)
0.264 ***
(0.004)
0.467
(0.278)
gdp0.534 **
(0.033)
0.718 *
(0.062)
0.879 ***
(0.000)
0.589
(0.573)
fdi0.704 *
(0.052)
0.412
(0.121)
0.632 ***
(0.000)
0.302
(0.413)
mark0.221
(0.793)
0.018
(0.747)
0.012 ***
(0.004)
0.089
(0.884)
education0.554 **
(0.016)
0.213
(0.873)
0.551 ***
(0.006)
0.401*
(0.093)
cons0.392 ***
(0.004)
0.198 ***
(0.000)
0.313 ***
(0.000)
0.242 ***
(0.000)
R20.9280.9150.9310.912
Obs110200160150
Note: *** p < 0.01, ** p < 0.05, * p < 0.1; Robust standard errors in parentheses.
Disclaimer/Publisher’s Note: The statements, opinions and data contained in all publications are solely those of the individual author(s) and contributor(s) and not of MDPI and/or the editor(s). MDPI and/or the editor(s) disclaim responsibility for any injury to people or property resulting from any ideas, methods, instructions or products referred to in the content.