Article

The Spatial and Temporal Evolution of Coordination Degree Concerning China’s Cultivated Land Green Utilization Efficiency and High-Quality Agricultural Development

1
School of Public Management, Liaoning University, Shenyang 110036, China
2
College of Public Administration, Huazhong University of Science and Technology, Wuhan 430079, China
*
Author to whom correspondence should be addressed.
Land 2023, 12(1), 127; https://doi.org/10.3390/land12010127
Submission received: 30 October 2022 / Revised: 24 December 2022 / Accepted: 26 December 2022 / Published: 31 December 2022

Abstract

:
The cultivated land green utilization efficiency (CLGUE) is closely related to high-quality agricultural development (HAD), but the evolutionary characteristics of the relationship between HAD and CLGUE have received little study. In the context of the rural revitalization strategy and high-quality development in China, it is important to ensure food security and cultivated land system security through coordinating HAD and CLGUE. In this study, 31 Chinese provinces were used as the research object, and the entropy weight TOPSIS model and SBM-Undesirable model were used to measure HAD and CLGUE, respectively. In addition, the coupling coordination degree model and the geographical analysis model were used to investigate the development of coordination degree concerning HAD and CLGUE from both geographical and temporal perspectives. The following findings are the result of this study. Firstly, both China’s overall HAD and CLGUE exhibited an upward tendency, with average annual growth rates of 4.35% and 4.08%, respectively. Secondly, there was a volatility upward trend shown by the level of coordination degree regarding HAD and CLGUE in China. Additionally, the coordination degree showed significant spatial-temporal disparities across the 31 provinces due to the variance in the natural endowment of agricultural development resources. Lastly, the coordination degree concerning HAD and CLGUE throughout China showed obvious patterns of spatial agglomeration at the provincial level. However, the geographical aggregation and dispersion of the provinces with high or low coordination levels have diminished somewhat. Furthermore, there was a conversion from hot spot aggregation regions in MGPAs to cold spot aggregation regions in GPMBAs. The conclusions of the present study enrich the theoretical literature on the relationship between HAD and CLGUE, and provide an empirical reference for the policy maker of the developing pathway of “high HAD and high CLGUE”.

1. Introduction

Agriculture is essential in providing people with food, fiber, fuel, and shelter [1], contributes to economic development and sustainability, and is a significant factor in environmental sustainability [2]. The COVID-19 epidemic and the escalation of violent conflicts in certain regions, in particular, have brought more attention to the significance of agricultural growth for human civilization. China is a country with a large population and relatively little cultivated land. The FAO [3] reports that China’s typical cultivated area per family is just 0.38 ha, much less than the world average. China must feed 20% of the world’s population while using less than 10% of the world’s cultivated land [4]. According to statistics from the China Rural Statistical Yearbook (2021), China’s grain output increased from 318.7 kg per person in 1978 to 474.4 kg per person in 2020 [5]. However, high yields could be a symptom of unsustainable agricultural methods [6], which have caused ecological and environmental issues such as agricultural carbon emissions [7] and soil erosion [8].
The traditional method of shallow development and extensive low yield consume significant agricultural resources and causes a large amount of environmental problems [9]. In October of 2017, the People’s Republic of China (PRC) proclaimed high-quality development, ushering in a new era for the Chinese economy. For China’s social and economic growth, high-quality development has become a new requirement [10]. Scholars nonetheless share a lot of helpful concepts for high-quality growth even though various nations have a range of social systems and unique national situations. The essence of high-quality development is generally supposed to the transformation from quantity focusing to efficiency improvement, scale expansion to structural optimization, input and investment-driven to innovation-driven, and treatment after pollution to green development [11,12,13,14,15]. High-quality agricultural development (HAD) was suggested as the present agricultural transformation in China’s development transition and resource limitations. According to the Central Rural Work Conference of the PRC, to implement the rural revitalization strategy, we should resolutely pursue the route of increasing agriculture via quality and policy. [16]. The “Year of Agricultural Quality” was declared by the PRC’s Ministry of Agriculture and Rural Affairs in 2018 [17]. Since the COVID-19 outbreak, HAD has developed into a crucial engine for “dual international and domestic circulation” in China, and further emphasis has been placed on its utility [18].
The three main areas of HAD’s present research may be loosely split into three categories: the analysis of HAD’s scientific meaning, the development of index systems, and the empirical assessment. (1) Regarding the concept of HAD, there is still no consensus in academia. Scholars have explained ideas from different perspectives. According to Lu et al. [19], HAD may be broken down into four subfields: new driving factors, industrial system integration, sustainable development, and efficient growth. Qin et al. [20] hold that HAD should be an innovative, coordinated, green, open, and shared dynamic development. Xia et al. [21] regard HAD as an organic which includes industrial system, production system, and management system. Additionally, Bender et al. [22] stressed that the protection of biodiversity and ecological protection should be encouraged by governments and policymakers. (2) How do we evaluate HAD? Total factor productivity, defined as the ratio of a system’s output to the sum of all inputs, is a key indicator of economic growth [23]. Thus, some scholars held that agricultural green total factor productivity was a core index to represent HAD [24,25,26]. However, some academics said that because HAD has multiple dimensions, adopting just one indicator to characterize it will cause the empirical findings to diverge. Hence, scholars have constructed comprehensive evaluation indicators according to different research purposes. To evaluate HAD from the perspectives of a new driving factor, industrial system integration, sustainable development, and efficient growth, Lu et al. [19] developed a measurement index system. From five perspectives—green level, innovation level, openness level, coordination level, and sharing level, Qin et al. [20] evaluated the HAD. For HAD, Cui et al. [18] developed an evaluation methodology based on “innovation-coordination-green-openness-sharing.” The entropy technique [20,27,28], the entropy TOPSIS approach [9,18], the projection pursuit model [19], and the SBM-ML index method [25] are the most commonly used methods. (3) With regard to the influence factors of HAD, it is generally acknowledged that urbanization rate, GDP per capita, per capita fixed asset investment in rural areas, the industrial structure [28], the new type of urbanization [25], and the construction of a “digital village” based on digital technology [21] were the influence factors of HAD. Furthermore, Lu et al. [19] analyzed the impact mechanism of farmland recessive morphology transition on HAD. The findings showed that the recessive morphological transition of the farmland had a favorable impact on HAD, and that this impact strongly spatially spilled over. Qin et al. [20] evaluated the correlation between factor mismatch and HAD. They found that factor mismatch significantly inhibited the enhancement of HAD, and the influence of inhibition was spatially and temporally heterogeneous. Wang et al. [24] found that agricultural FDI had a significant promoting effect on HAD and various sub-items. However, it has an inverted U-shaped feature in the long term.
The most important factor in agricultural development is cultivated land [29]. Cultivated land utilization is closely linked to national food security and long-term socioeconomic development [30,31]. It is crucially important for China to make rational use of cultivated land and ensure food security, especially in a country with a large population [32,33]. In recent years, academics have become increasingly interested in how China’s agricultural progress is impacted by the utilization of cultivated land. The majority of the current literature features the following elements: (1) The effect of converted cultivated land on potential agricultural productivity. To analyze changes in the amount of cultivated land and its potential agricultural output in China, Deng et al. [34] employed satellite photographs. The findings indicated that China had seen a net increase in cultivated land (+1.9%), nearly offsetting the decline in average potential productivity, or bio productivity (−2.2%), between 1986 and 2000. (2) The impact of abandoned cultivated land on grain production. Empirical studies showed that cultivated land abandonment had a significant negative impact on the grain yield of the main grain-producing areas [35]. (3) The relationship between cultivated land management scale and agricultural production efficiency. In the early empirical studies, an inverse correlation between agricultural land management scale and agricultural production efficiency was confirmed in developing countries [36,37]. In West central Brazil, Helfand and Levine investigated the factors that affect technical efficiency and the connection between farm size and efficiency, and the findings revealed a nonlinear connection between farm size and efficiency, with efficiency initially declining and then increasing with growth [38].
The conversion of cultivated land utilization to green and efficient is currently encouraged in China under ecological environmental friendliness and sustainable resource usage [39]. As a result, the PRC’s central and local governments have gradually released various pertinent regulations to encourage the transformation of cultivated land utilization to green and efficient. Numerous studies have been conducted recently on the idea, assessment, and influencing aspects of cultivated land green utilization efficiency (CLGUE). According to Xie et al. [40], the least costly cost of using cultivated land is combined with the largest economic and ecological impacts by CLGUE. The majority of recent studies evaluate CLGUE in-depth, and the evaluation indices were selected from “input”, “desirable output”, and “undesirable outputs” [41,42,43]. The majority of the methodologies used incorporate the highly efficient EBM model [44] and the super-efficient SBM model [41,42,43]. To measure CLGUE, the concepts of green and low-carbon were integrated by Ke et al. (2021). In China, the average CLGUE grew by 3.419% from 0.482 in 2000 to 0.913 in 2019. The findings also indicated that the investment level of science and technology, the living standard of farmers, the multiple crop index, and the financial support for agriculture, industrialization, and agricultural mechanization impacted CLGUE [41].
In order to adapt to the situation and requirements of agricultural development, a country or region should adjust land resource management policies and measures according to current land use patterns and existing problems [19]. As a result, when implementing HAD, cultivated land utilization has to receive more attention. Improving farming households’ CLGUE is essential for promoting agricultural green development in China [44]. The degree of coordination reveals how closely coordinated the growth of subsystems is. HAD and CLGUE are closely related but have individual areas of emphasis. There is a strong interaction between HAD and CLGUE. Both HAD and CLGUE are regarded as the subsystems of an implemented policy of the agricultural sector. Coordination degree concerning HAD and CLGUE is essential for the sustainable growth of the agricultural sectors in the context of the rural rehabilitation strategy undertaken in China. However, previously published studies have mostly focused on the influence of cultivated land utilization on agricultural development, particularly the overall impact of several factors, including grain output, cultivated land usage pollution, and material inputs, on the effectiveness of agricultural production. This results in disregarding the synchronization between HAD and CLGUE. This issue was solved by using the entropy weight TOPSIS model and the SBM-Undesirable approach to measure HAD and CLGUE in the 31 provinces of mainland China. To reveal its spatiotemporal characteristics, the coordination degree in regard to HAD and CLGUE was also examined.
The three components of our study’s contributions are as follows. Firstly, the entropy weight TOPSIS method and the SBM-Undesirable approach were used to estimate HAD and CLGUE in the 31 provinces of the Chinese mainland. This study revealed the regional differences of HAD and CLGUE in China. Secondly, to fully assess the coordination degree concerning HAD and CLGUE at spatiotemporal dimensions in China, the coupling coordination degree model and geographical analysis model were carried out. Thirdly, the empirical findings pointed to several policy implications for obtaining a perfect coordination degree concerning HAD and CLGUE.

2. Material and Methods

2.1. HAD Accounting Method

As the evaluation index system of HAD in this study is a multidimensional comprehensive evaluation system, a comprehensive evaluation method for measurement should be used. According to the operability and objectivity, the entropy weight Technique for Order Preference by Similarity to an Ideal Solution (TOPSIS) method is chosen to measure HAD in this study. The entropy weight TOPSIS method is composed of the entropy weight and TOPSIS. The entropy weight is used to determine the weights of evaluation indexes according to the variation degree of the evaluation indexes objectively, which can avoid the bias caused by subjective assignment [45]. The TOPSIS classifies the separation between the evaluation items and the best solution and evaluates the relative benefits and drawbacks of the evaluation objects. With objectivity, accuracy, and scientific analysis, the entropy weight TOPSIS technique integrates the entropy weight method with TOPSIS to provide a thorough evaluation method [9]. The calculation steps are expressed as follows [46]:
(1)
Construction of an original evaluation matrix. Supposing the existence of n evaluation objects and m evaluation indexes, the original evaluation matrix X for HAD is set as follows:
X = x 11 x 12 x 1 n x 21 x 22 x 2 n x m 1 x m 2 x m n
(2)
Data standardization.
Positive indexes : z i j = x i j min x i j max x i j min x i j
Negative indexes : z i j = max x i j x i j max x i j min x i j
Z = z 11 z 12 z 1 n z 21 z 22 z 2 n z m 1 z m 2 z m n
where Z is the standardized matrix;
(3)
Calculation of index weights. Determining the weights of the evaluation indexes by using the entropy weight method, the concrete formula is as follows:
e i = 1 n p i j · ln p i j ln n
w i = 1 e i 1 m 1 e i
where e i is the entropy value of the i - t h index i = 1 , 2 , , m . w i is the weight of the i - t h index i = 1 , 2 , , m . p i j = z i j 1 n z i j is the calculation of the weight of the i - t h index i = 1 , 2 , , m in year j   j = 1 , 2 , , n .
(4)
Establishment of weighted normalized evaluation matrix. The weighted normalized evaluation matrix Y is established by combining the standardized matrix Z with the index weights w i .
Y = z 11 w 1 z 12 w 1 z 1 n w 1 z 21 w 2 z 22 w 2 z 2 n w 2 z m 1 w m z m 2 w m x m n w m = y 11 y 12 y 1 n y 21 y 22 y 2 n y m 1 y m 2 y m n
(5)
Determination of positive and negative ideal solutions.
Y + = max 1 i m y i j | i = 1 , 2 , , m = y 1 + , y 2 + , , y m +
Y = min 1 i m y i j | i = 1 , 2 , , m = y 1 , y 2 , , y m
where Y + represents the positive ideal solution, and Y represents the negative ideal solution.
(6)
Calculation of Euclidean distance.
D j + = i = 1 m y i + y i j 2
D j = i = 1 m y i y i j 2
where D j + is the Euclidean distance between the positive ideal solution and per evaluation object. D j is the Euclidean distance between the negative ideal solution and per evaluation object.
(7)
Calculation of closeness.
C j = C j C j + + C j
where C j ranges from [0,1]. The larger the C j is, the closer HAD is to the optimal level. C j = 1 represents that HAD been the highest, and C j = 0 represents that HAD been the lowest.
The data accessibility and pertinent literature about China’s new development idea (which includes innovation, coordination, green, openness, and sharing) [9,19,27,28], following the definition of HAD, allowed for the construction of a measurement system for HAD (Figure 1).

2.2. CLGUE Accounting Method

The data envelopment analysis (DEA) model is a comprehensive means of assessing the relative efficacy of decision-making units (DMUs) with varied inputs and outputs. The measurement of production efficiency by the DEA model is usually biased due to different choices of radial and angle [25]. To solve this problem and eliminate the variation, Tone developed a non-radial, non-angular slack-based measure (SBM) model [47]. The traditional DEA model’s issue with input and output slack is resolved by the SBM model, as is the issue with productivity evaluation when undesirable output is present. The SBM model is also dimensionless and non-angular, which might reduce or eliminate the deviation and effect brought on by the choice of different dimensions and angles. In conclusion, compared to other models, the SBM model may more accurately capture the essence of productivity evaluation [48]. The unexpected result is contained in the SBM-Undesirable model, which is represented as follows [49]:
ρ * = min 1 1 m i = 1 m s i x i 0 1 + 1 s 1 + s 2 r = 1 s 1 s r δ y r 0 δ + r = 1 s 2 s r b y r 0 b
s . t . x 0 = X λ + s y 0 δ = Y δ λ S δ y 0 b = Y b λ + s b λ 0 , s 0 , s δ 0 , s b 0
where s , s δ , and s b correspond to the vectors of relaxation for the inputs, desired and undesired, respectively. λ represents the weight vector, and the objective function. ρ * is the index of CLGUE, which objective value ranges from (0,1].
Given the view of CLGUE [29], the data availability and the relevant literature [29,41], in this study, 12 variables were chosen to create the CLGUE evaluation index system, with three categories of input, desired output, and undesirable output all being included (Table 1).
The carbon and contamination emissions were considered the undesired output during cultivated land utilization. Chemical fertilizers, pesticides, agriculture films, agriculture machinery, agriculture irrigation, agriculture tilling, and agriculture machinery are some of the carbon emissions associated with cultivated land utilization. The total carbon emissions from cultivated land utilization were calculated by multiplying the indices above by the appropriate carbon emission factors. The calculation formula is [4,7]:
C E C L U i = C i = T i · δ i
where C E C L U i represents the whole amount of carbon emissions from cultivated land utilization, T i represents the amount of the i - t h carbon source, and δ i refers to the i - t h carbon source’s coefficient. Based on the literature [4,7,50], the carbon sources and coefficients include pesticides (4.394 1, kg C/kg), chemical fertilizers (0.895 6, kg C/kg), agriculture films (5.180, kg C/kg), agricultural irrigation (5, kg/hm2), agricultural machinery (25 kg C/hm2), the total power of agricultural machinery (312.6 kg, C/kW), and agricultural tilling (312.6, kg C/km2).
Most of the pollution resulting from cultivated land utilization is non-point source pollution. Environmental degradation brought on by toxins via surface runoff and subsurface penetration is known as non-point source pollution, and it is characterized by dispersion and concealment [51]. Insecticide loss (10,000 tons), phosphorus and nitrogen loss in manure (10,000 tons), and residue from the agricultural film are the results of this (10,000 tons). Nitrogen (phosphorus) fertilizer, pesticides, and agricultural film loss were cited in the literature [29,41] as being utilized to indicate the pollutant emission from cultivated land utilization. With the geographical difference considered for the estimation, the pertinent loss coefficient was derived using the National Pollution Source Survey’s agricultural pollution source coefficient manual.

2.3. Coupling Coordination Degree Model

The degree of coupling reflects the degree of mutual dependence and mutual restriction of multiple systems [52]. The quality of coordination is reflected in the degree of coordination, which assesses the level of benign coupling among numerous systems’ coupling relationships. The degree of mutual influence between systems using the coupling degree and coordination degree can be thoroughly evaluated using the coupling coordination degree model [53]. The relative product coefficient is called the coupling coordination degree [54]. Through the use of the equation, the coupling level and coordination level are each individually quantified [55]:
C = U 1 U 2 / [ U 1 + U 2 / 2 ] 2 1 / 2
D = C × T     ,   where   T = a U 1 + b U 1
Where C depicts the coupling degree between the two components, 0 C 1 ; D indicates the coordination degree concerning HAD and CLGUE, 0 D 1 ; U 1 and U 2 indicate HAD and CLGUE, respectively; a and b represent undetermined coefficients. In this paper, the value of each unidentified coefficient is set to 1/2, and HAD and CLGUE are given equal weights. Based on the literature [56], ten types received the coordination degree (Table 2).

2.4. Global Spatial Autocorrelation

Each phenomenon in the spatial unit is not independent but connected, as stated by the first law of geography. The relationship between nearby entities or phenomena is stronger, and the agricultural production operations in nearby areas can have a greater impact on one another [57]. In addition to influencing an area’s degree of coordination concerning HAD and CLGUE, a region’s physical location also influences the degree of coordination concerning its neighbors. To identify the concentration of coordination degree in regard to HAD and CLGUE at a province level in China, this study used global spatial autocorrelation and local spatial autocorrelation analytic techniques. Global spatial autocorrelation shows the spatial correlation between study objects [58]. Global spatial autocorrelation often uses the Global Moran’s I coefficient to reflect the aggregation and dispersion effect of regional units [59]. The equation is written as follows [56]:
G l o b a l   M o r a n s   I = n i = 1 n j = 1 n w i j x i x ¯ x j x ¯ i = 1 n j = 1 n w i j i = 1 n x i x ¯ 2
where n reflects the number of evaluation items, the x ¯ shows the average sample values across all assessment objects. x i and x j indicate i - t h and j - t h assessment item individual specimen values, while w i j utilizes the spatial weight matrix. 1     G l o b a l   M o r a n s   I     1 . The clustering zone in space will be more apparent if the G l o b a l   M o r a n s   I value is closer to 1 ; conversely, if it is closer, there are more patterns of discontinuous distribution in space.

2.5. Analysis of Hot Spot (Partial Getis-Ord G* Index)

The local space dependence and space heterogeneity concerning the coordination level of HAD and CLGUE was determined using the hot spot analysis approach, and the characteristics and rules of the local space auto-correlation were studied [56]. The computation equation is expressed as follows [60]:
G i * = j = 1 n w i j x j j = 1 n x j j i
where x j is a sample value for the j - t h assessment object, n shows the number of assessment objects, and w i j stands for the space weight matrix. If the value of G i * is noticeably positive, it indicates that the value in the vicinity of area i is relatively greater, with this region serving as a hotspot. If not, it indicates a chilly spot.

2.6. Area of Study and Data Source

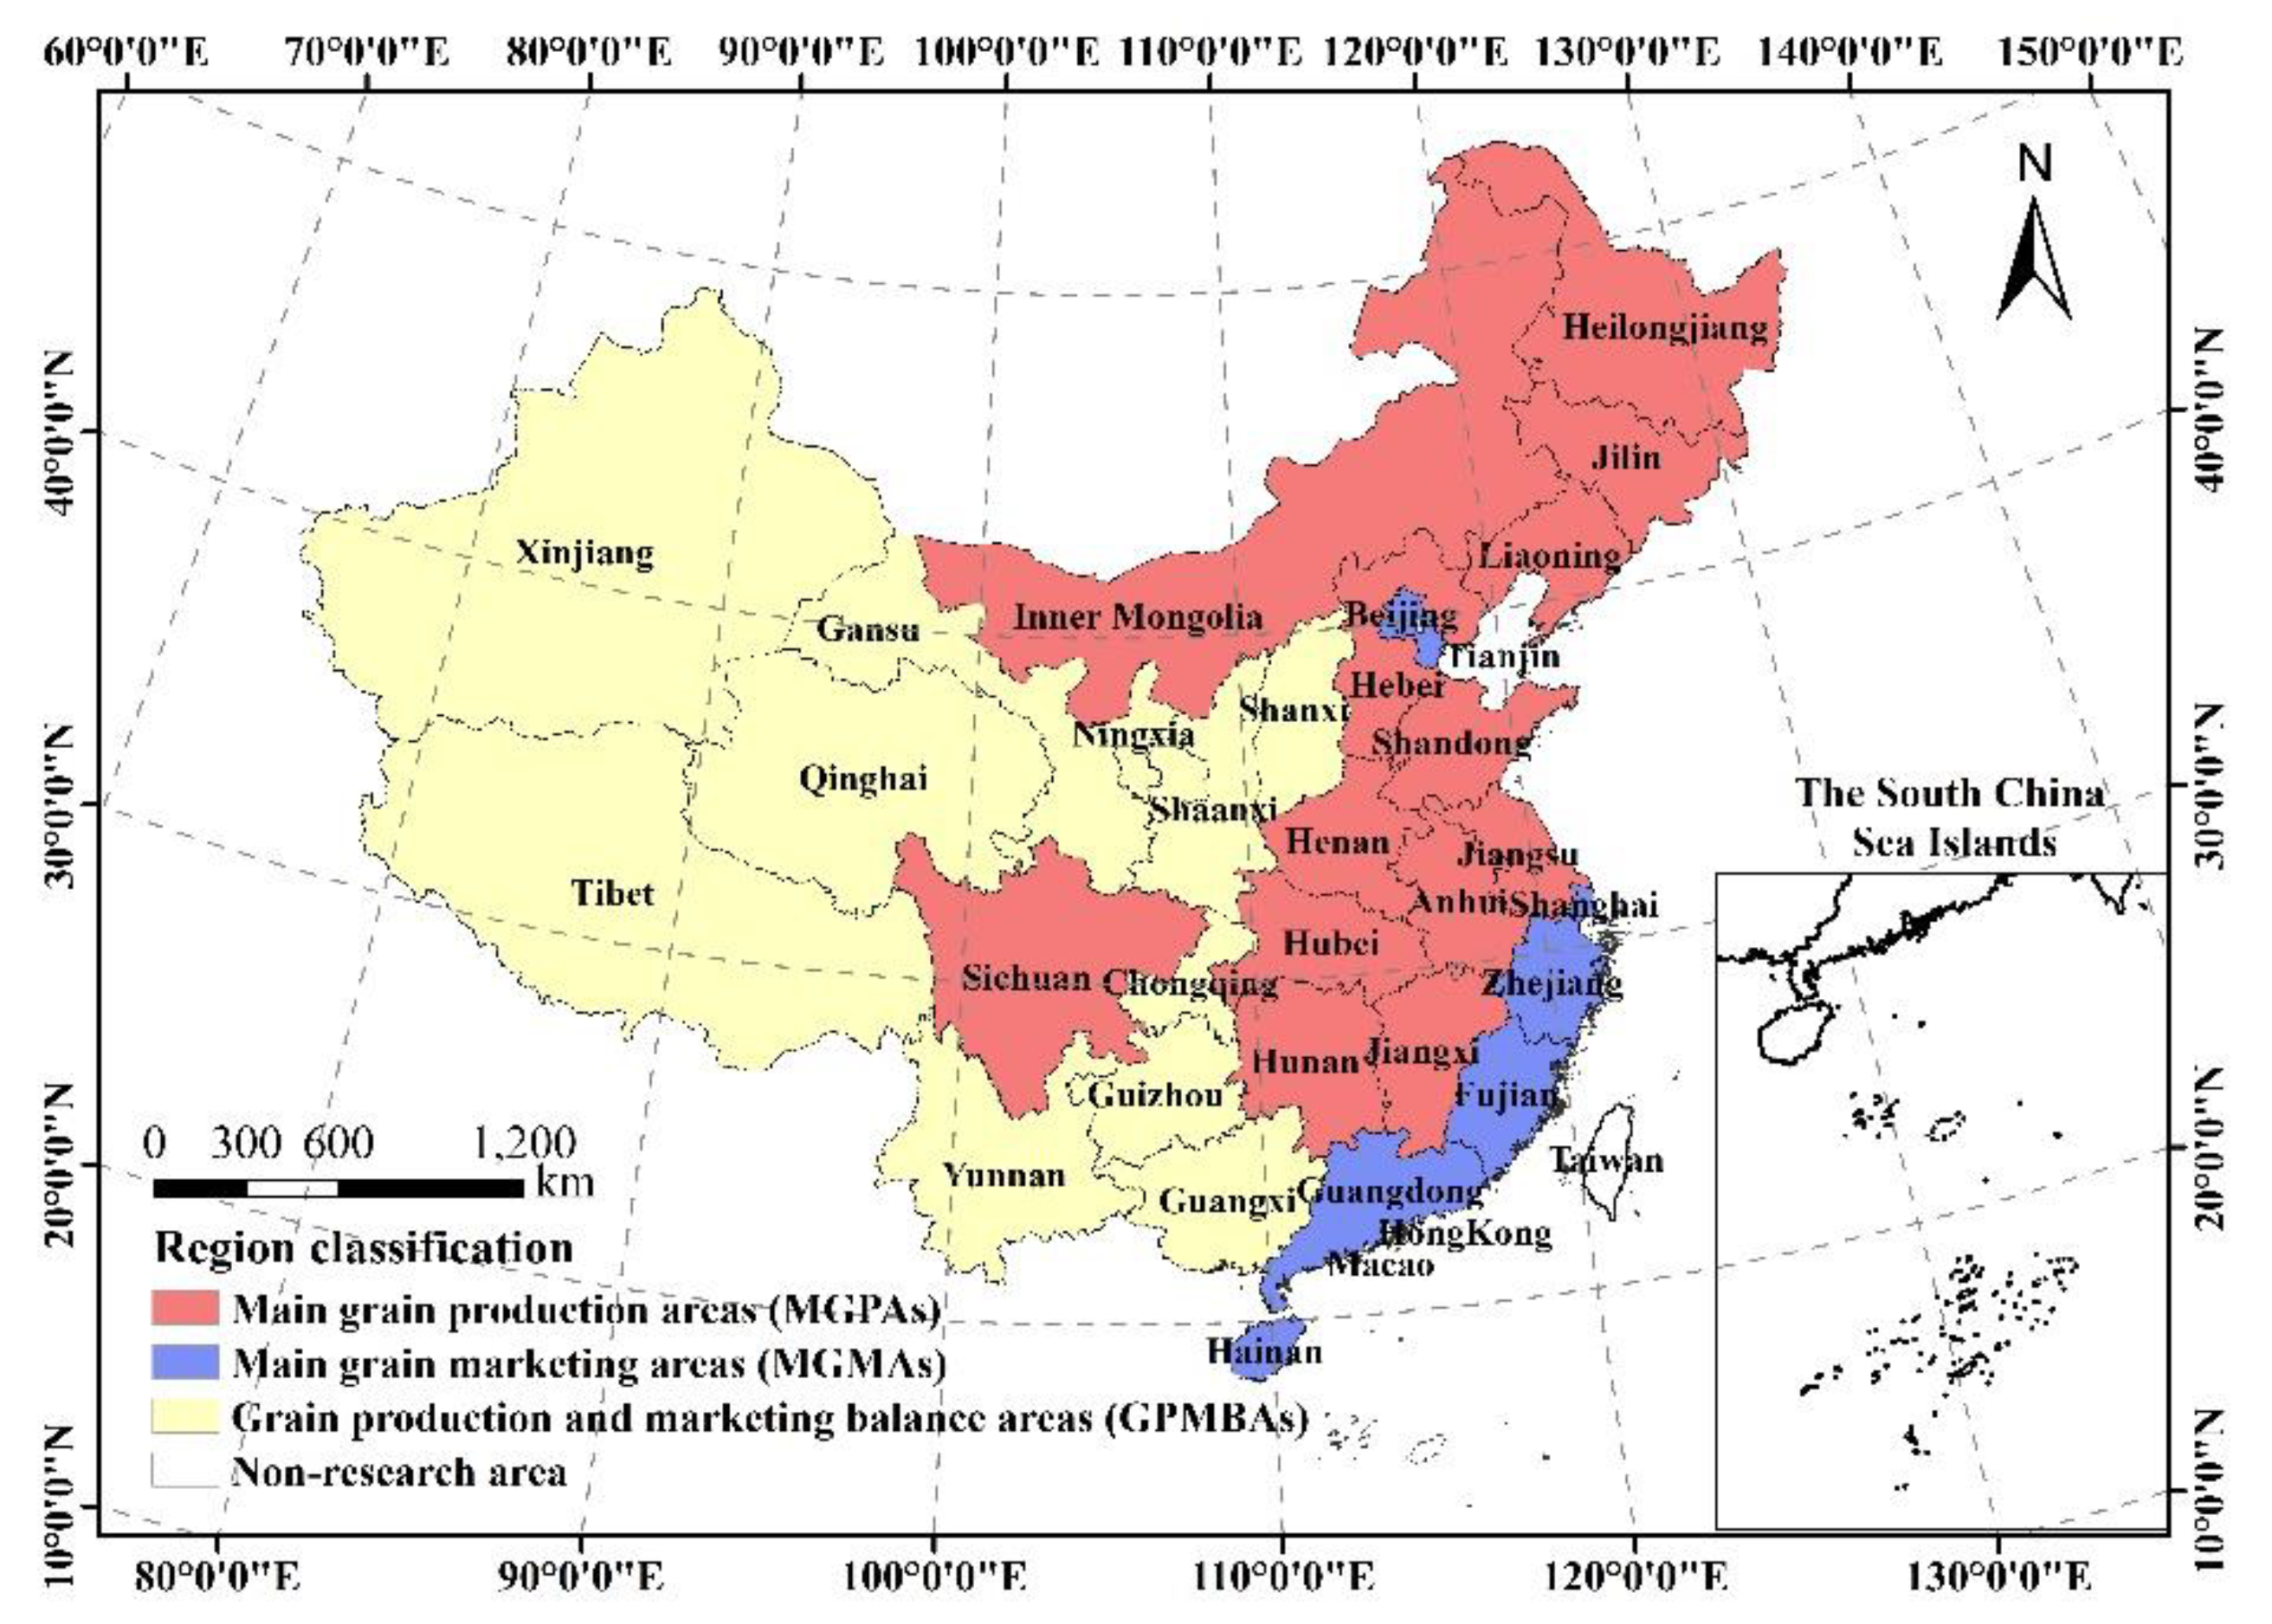
34 provincial administrative groups exist in China, and the conditions, degrees, and development methods vary greatly throughout the various provinces [61]. Hong Kong, Macao, and Taiwan were excluded from the empirical research due to the availability of the data. A total of 31 provinces on the Chinese mainland were chosen as the study’s research subjects. Major grain-producing areas (MGPAs), main grain marketing areas (MGMAs), and grain-producing and marketing balance areas (GPMBAs) may be used to categorize the 31 provinces into three food function sectors, according to Chinese government documents titled “Opinions on Reforming and Improving Policies and Measures for Comprehensive Agricultural Development" and “the Outline of the Medium and Long-Term Program for National Food Security (2008–2020)”. This classification is adopted in the current work (Figure 2).
All data used in this paper to measure CLGUE were collected from China Statistical Yearbook (2007–2021) and China Rural Statistical Yearbook (2007–2021). The majority of the information that used to measure HAD in the present study was gathered from China Statistical Yearbook (2007–2021), China Rural Statistical Yearbook (2007–2021) and provincial Statistical Yearbook (2007–2021). In addition, we have used raw data provided by the reference for the manuscript [20]. The interpolation method was adopted to make up the missing data of the individual years.

3. Results and Analysis

3.1. HAD Measurement Analysis

Equations (1)–(12) were used to compute the HAD in China. China’s total HAD showed a trend toward progressive improvement, with an annual growth rate of 4.35%. It will increase from 0.109 in 2006 to 0.198 in 2020 (Figure 3). This finding was similar to the conclusions of current research on the evaluation of HAD in China [20]. To be more precise, the changes in HAD span three time periods, referred to as "rapid growth", "stabilization", and "slow growth", respectively, and corresponding to the years 2006–2008, 2010–2017, and 2018–2020. The HAD’s three periods of average yearly increase were 7.23%, 4.51%, and 3.69%, respectively. This data points to a downtrend in the annual growth rate of HAD over the study. With the support of various national agricultural policies, such as farmland building with high standards, special rectification of agricultural product quality and safety, zero growth in fertilizer and pesticide use, etc., the HAD in China has been greatly improved [28].
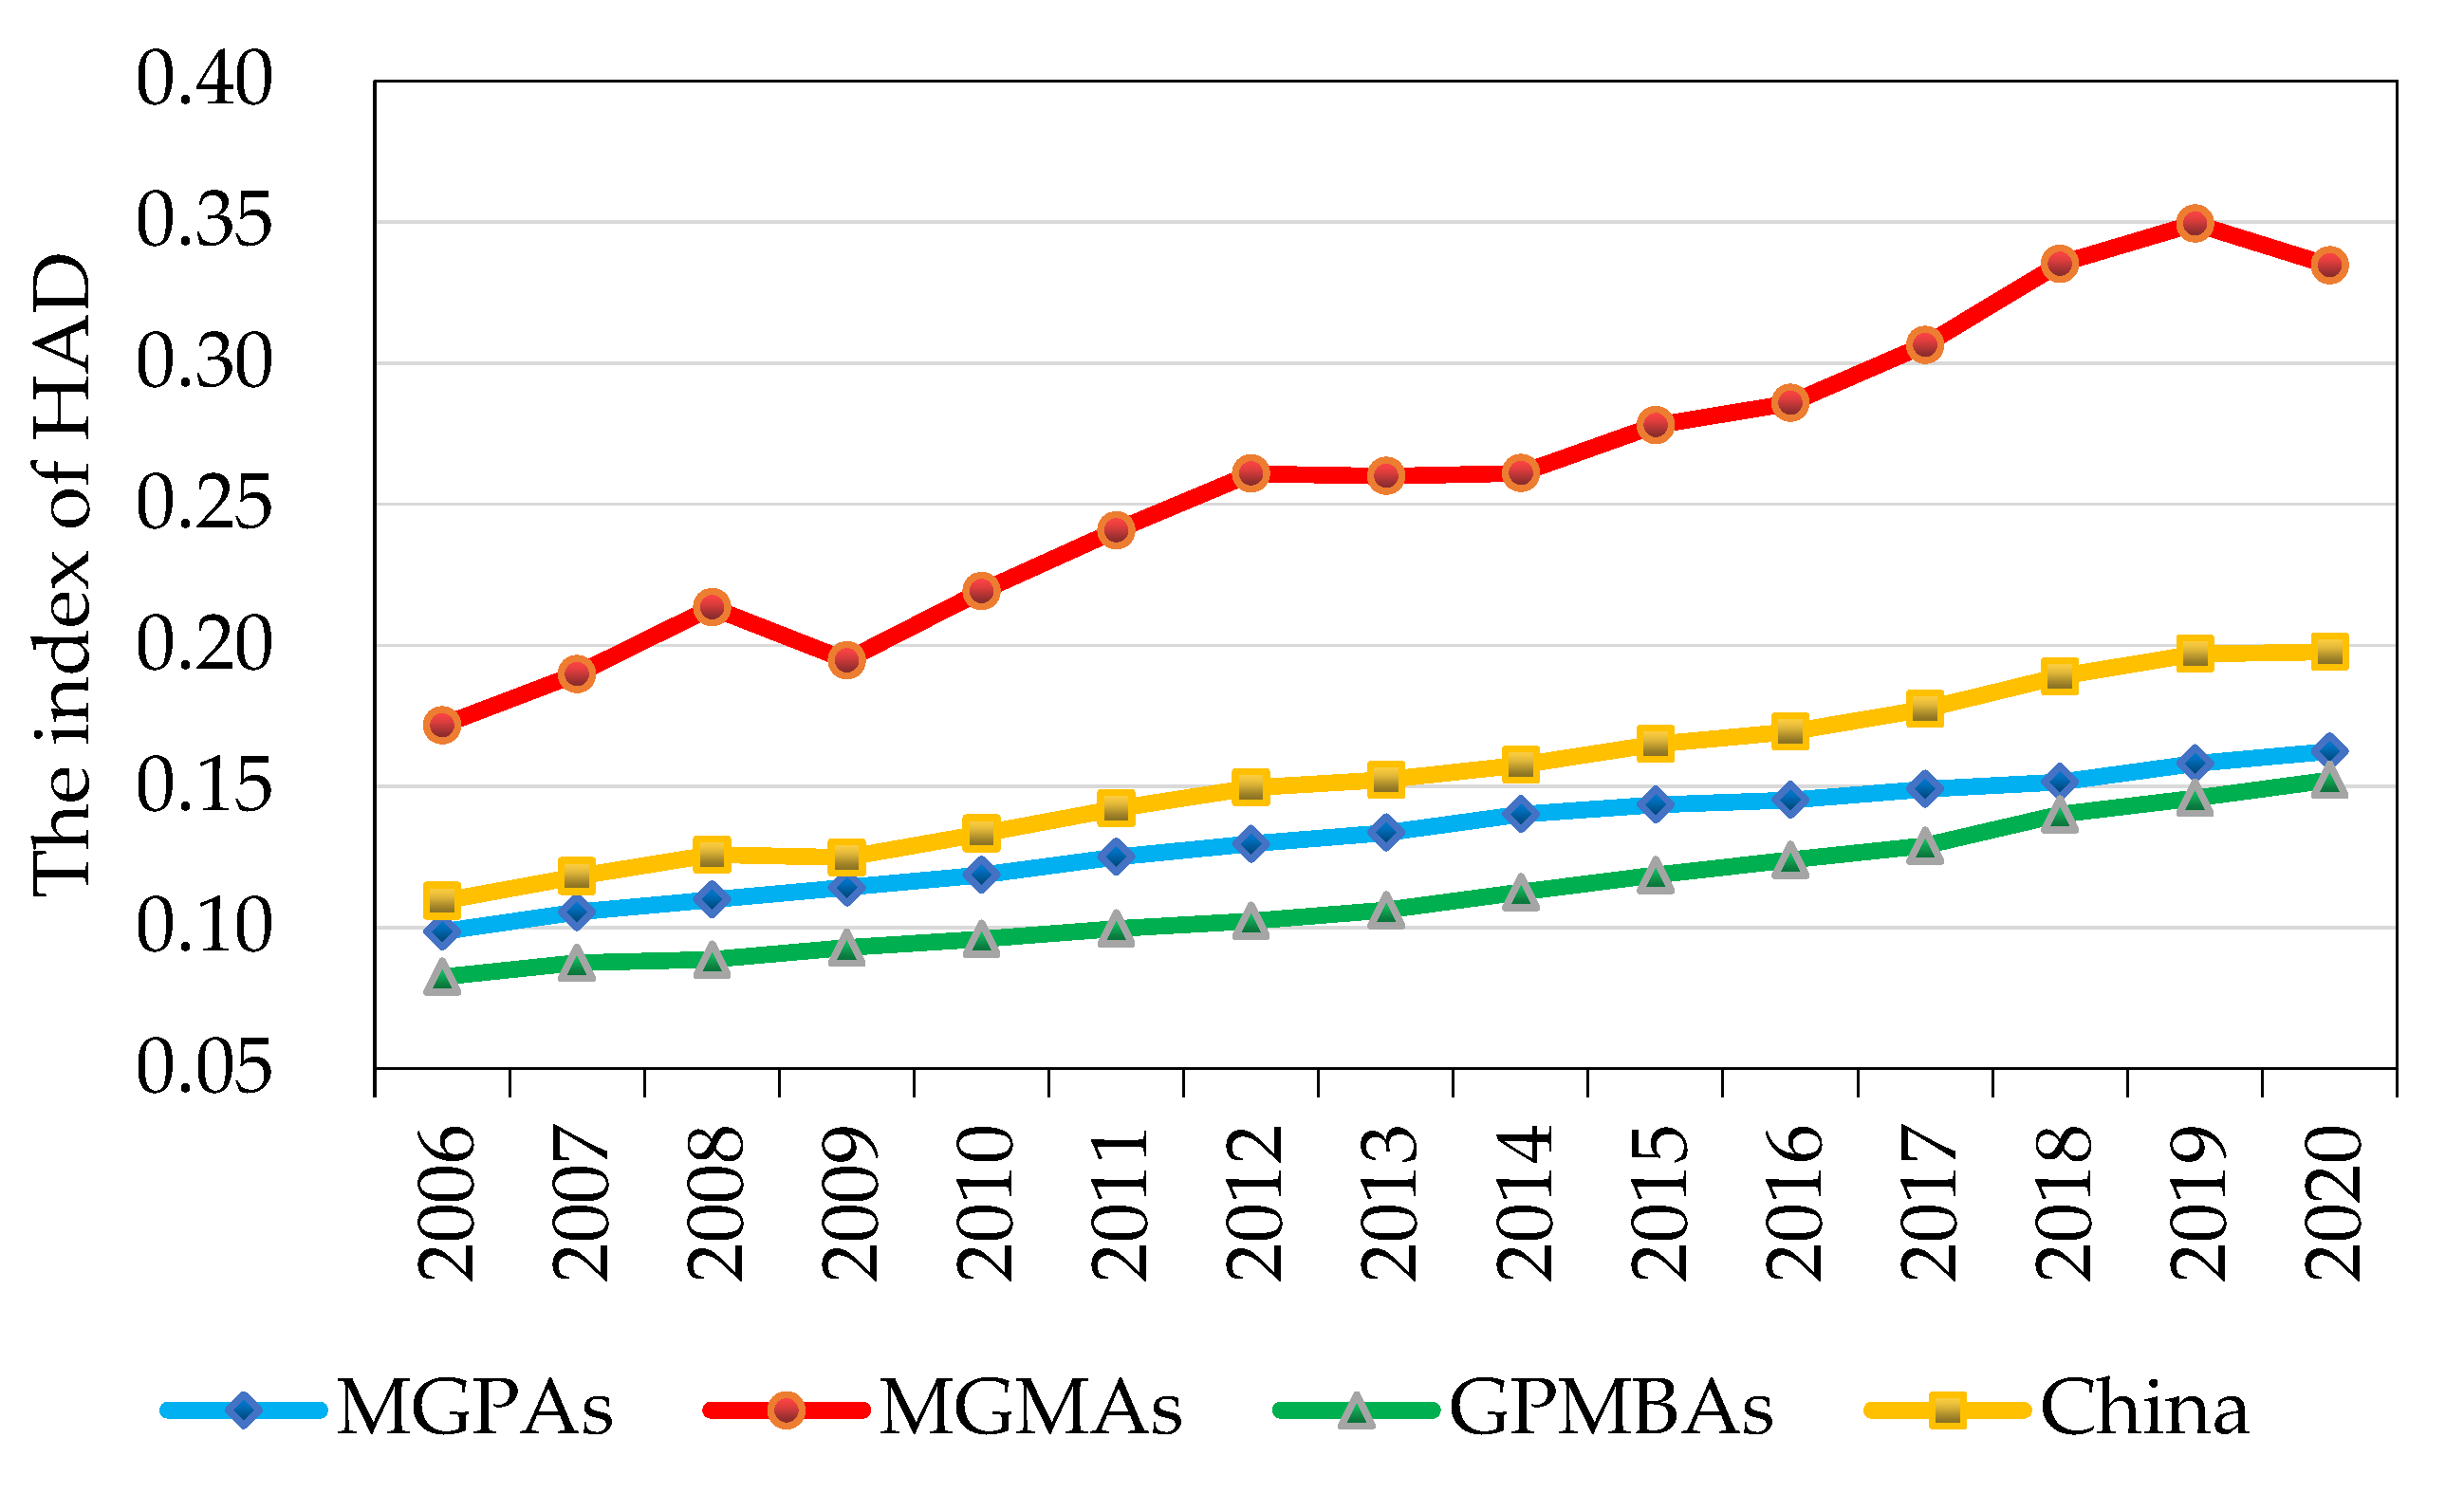
It can be seen that HAD of the three regions’ data all displayed a generally rising trend (Figure 4). However, there was still a sizable disparity in the mean annual growth rate. The average annual growth rate of HAD for MGPAs, MGMAs, and GPMBAs was 3.64%, 5.07%, and 4.48%, respectively. The fact that MGMAs are the areas with a very robust economy or that they benefit from their eastern coastal location may explain this pattern. The GPMBAs distribute in the central and western regions. During agricultural development, the eastern provinces gave greater consideration to the preservation of resources and the environment, and the pattern of agricultural development was more sustainable. However, the process of agricultural development has resulted in significant resource consumption and environmental pollution in the central and western regions, and the method of agricultural development is relatively extensive [48]. It has been demonstrated that factors favorable to HAD include the rate of urbanization, per capita GDP, and the proportion of secondary and tertiary industries’ production values [28].The variation in HAD among the three food function categories is also caused by the disparity in socioeconomic development.
Based on the natural fracture method of ArcGIS software, the spatial visualization maps of HAD were drawn in 2006, 2013, and 2020, as shown in Figure 5. Only Beijing and Shanghai were classified as having high-value in 2006, while Tianjin, Liaoning, Hebei, Shandong, Zhejiang, Jiangxi, and Fujian were classified as having relatively high-value or medium-value. A total of 22 provinces, however, belonged to groups with low-value or relatively low-value, and the HAD of those values was less than 0.101. In 2013, the distribution of high-value and relatively high-value groups remained constant. However, when the medium-value groups’ spatial reach grew, the number of relevant provinces increased significantly, including Heilongjiang, Inner Mongolia, Jiangsu, and Guangdong. The spatial reach of relatively low-value and low-value groups showed a significant shrinking as the number of relevant provinces declined. Jiangxi also dropped into the relatively low-value groups from the medium-value groups. In 2020, Guangdong evolved into the relatively high-value groups, while Inner Mongolia, Liaoning, Hebei, and Shandong were removed from the list of medium-value groups. The spatial scope of the medium-value groups was extended to the central region.. Hunan, Shaanxi, and Hainan were eliminated from the relatively low-value groups. The remaining provinces, on the other hand, continued to be included in low-value or relatively low-value groups.
Overall, HAD in China showed the characteristics of spatial imbalance. In other words, there was a certain regional gap in the level of China’s HAD. The results were similar to the conclusions of the current research on the evaluation of HAD [9,20,27,28]. This is due to regional differences in economic development, resource utilization, ecological environment, social science, and technology [27]. The HAD in southeast coastal and southwest areas was relatively stable; however, HAD in the northwest and northeast regions was of a high-variability during the study period in China. Moreover, at the beginning of the study period, the provinces that reached the middle-value groups of HAD showed two point-like distributions (centered on Beijing and Shanghai, respectively), surrounded by areas with low-efficiency values. However, the provinces that reached the middle-value groups of HAD did conform to random distribution at the end of the study period. The number of relevant provinces increased significantly over time as the spatial scope of low-value groups was further expanded, but the number of provinces that belonged to the high-value and relatively high-value groups remained constant. In other words, HAD has become more polarized. Additionally, during the study period, Gansu, Yunnan, and Guizhou continued to have low HAD values. Due to relatively backward socio-economic development and the poor natural conditions of the agricultural resources in China, these provinces face greater resistance during the transition of agricultural to high-quality development. For the above provinces, it is necessary to learn the agricultural development models of regions with high levels of development and combine the actual conditions of regional agricultural development to summarize a specific model for the high-quality development of local agriculture [20], after which the improvement in HAD should be promoted.

3.2. CLGUE Measurement Analysis

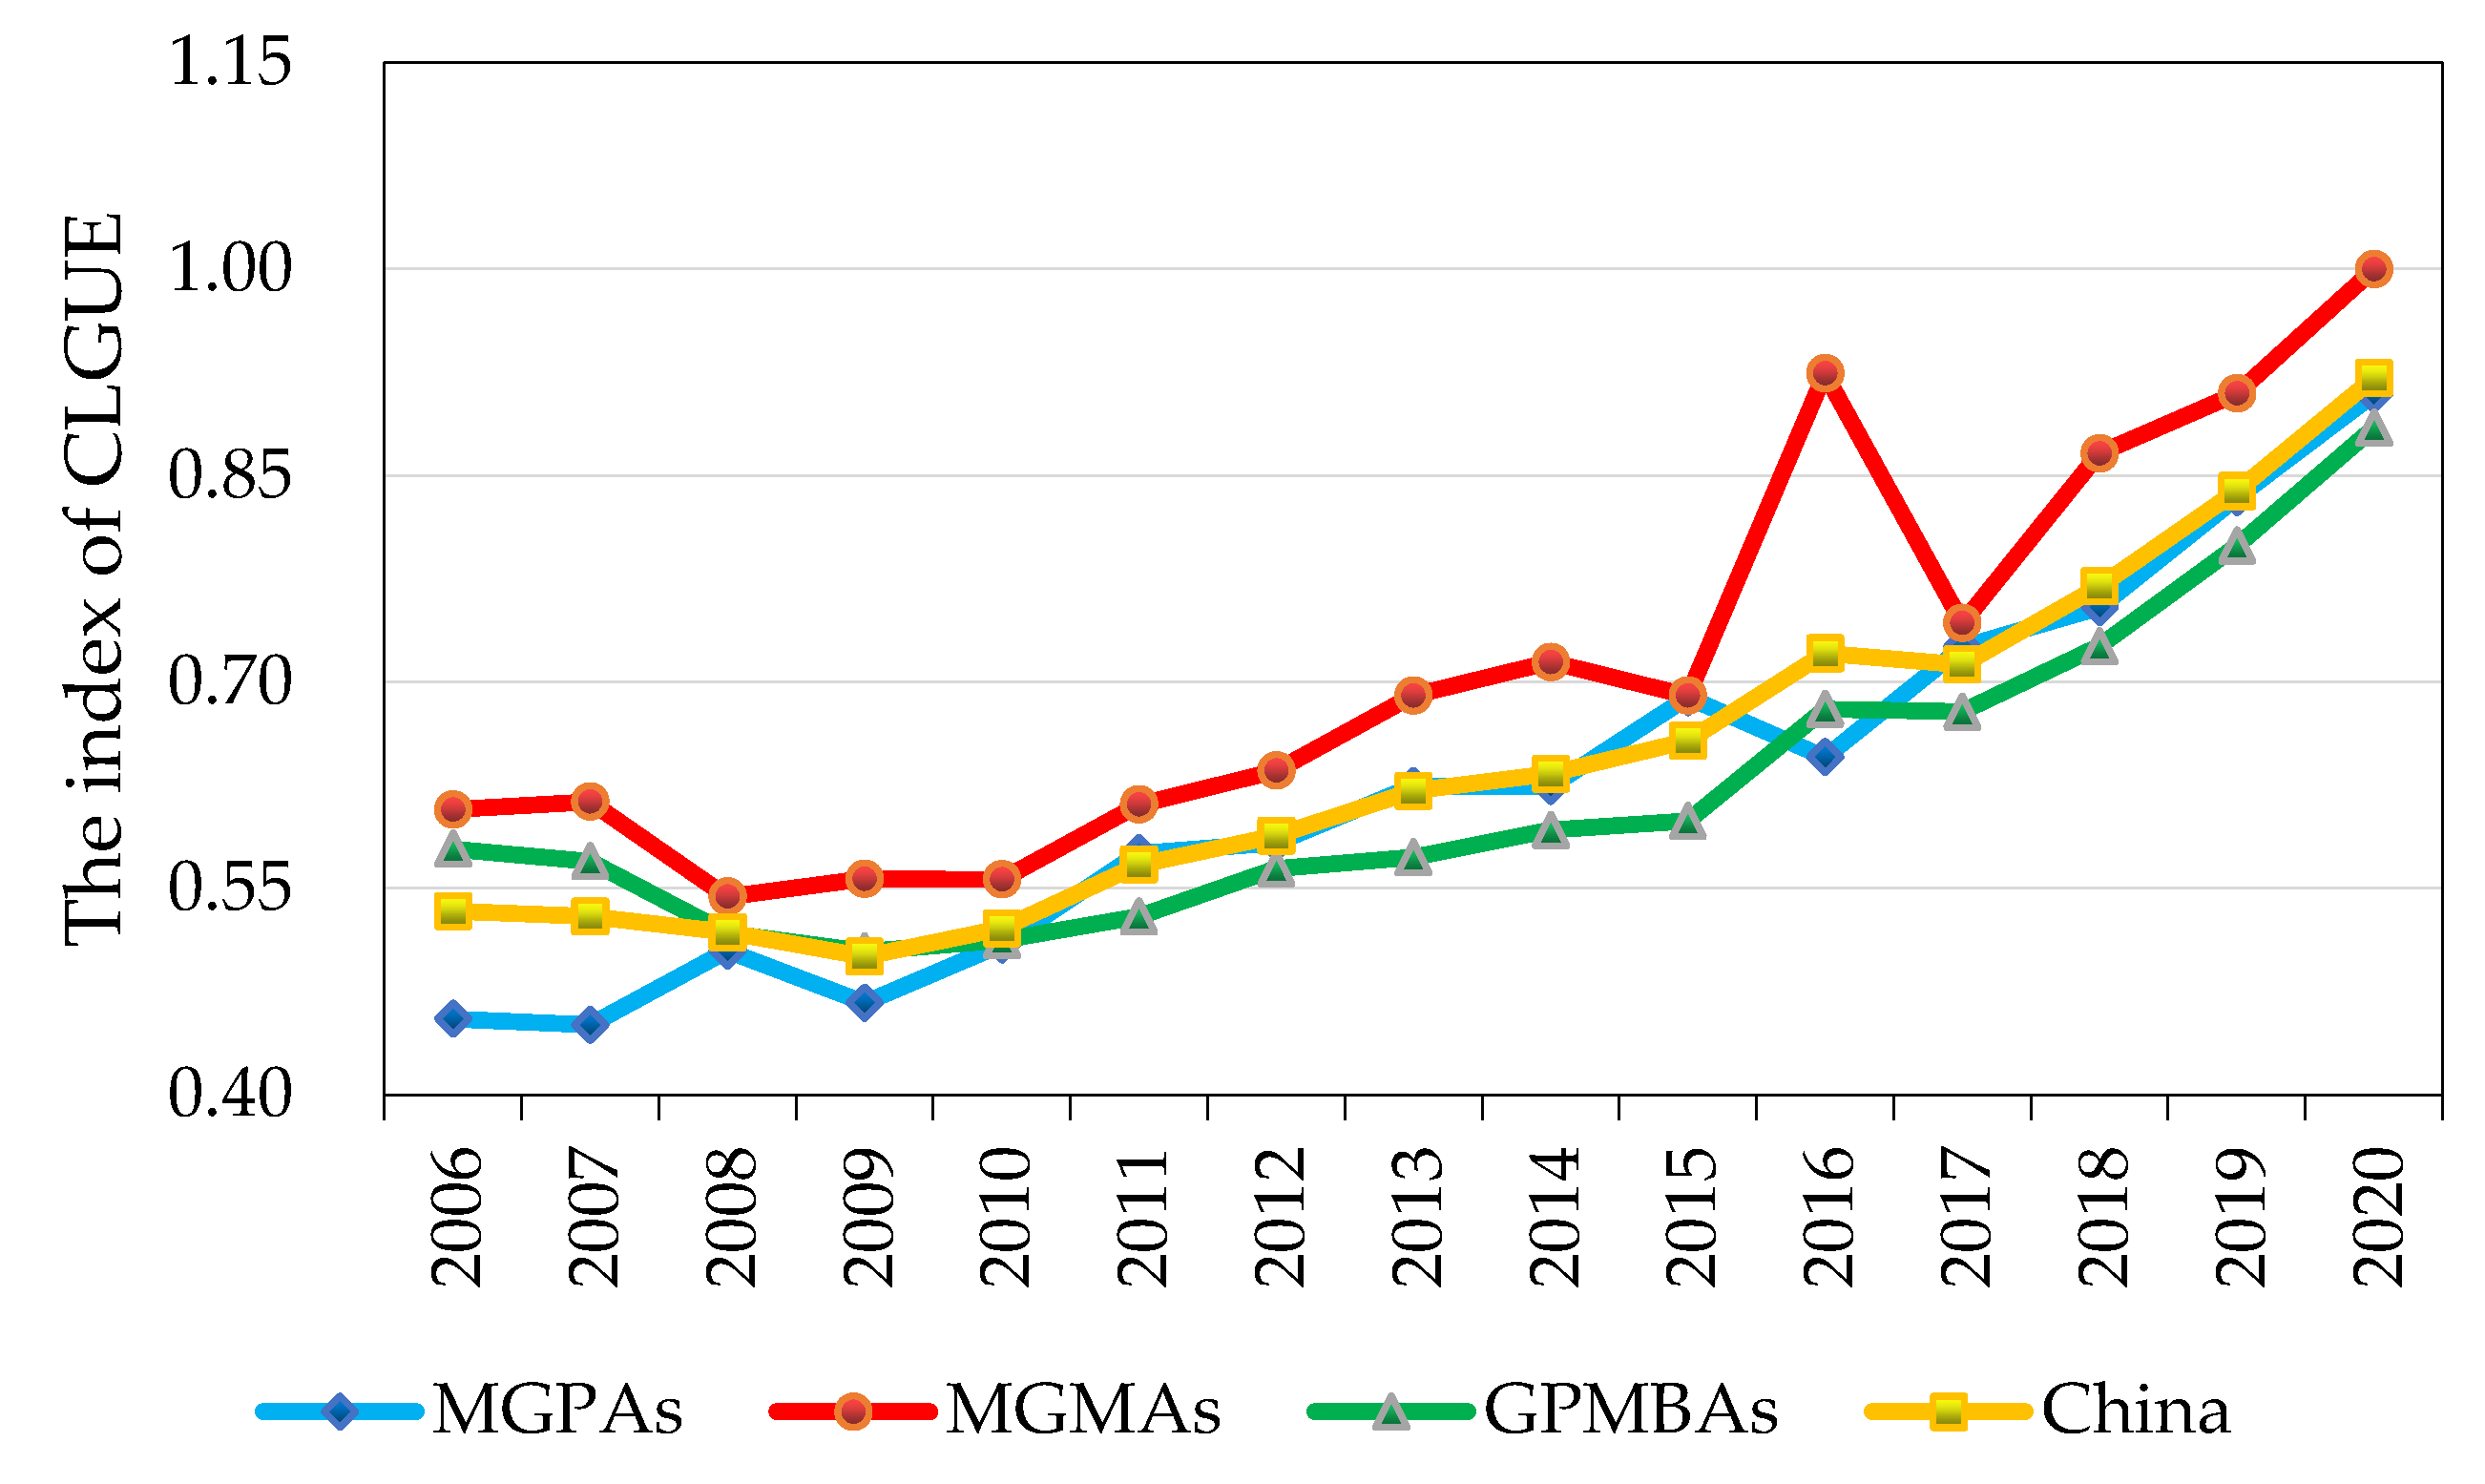
Equation (13) was used to determine the CLGUE in China in this section. Figure 6 depicts the overall pattern of the average CLGUE in China and regions from 2006 to 2020. From 0.533 in 2006 to 0.921 in 2020, the Chinese CLGUE demonstrated a rising trend with an average yearly growth rate of 4.08%. CLGUE demonstrated a general rising tendency across all grain functional domains. However, there were still substantial differences in the average yearly growth rate. In the MGPAs, MGMAs, and GPMBAs, respectively, the average annual growth rates of CLGUE were 5.28%, 4.31%, and 3.24%. The fact that agricultural production activities are more concentrated in MGPAs than other areas could explain this tendency. There is a property of increasing scale returns in MGPAs because of the higher agglomeration degree [62]. Additionally, the data supports that the regulation in major grain-producing regions had a considerable lowering effect on chemical fertilizer non-point source pollution, particularly for nitrogen pollution emissions [63].
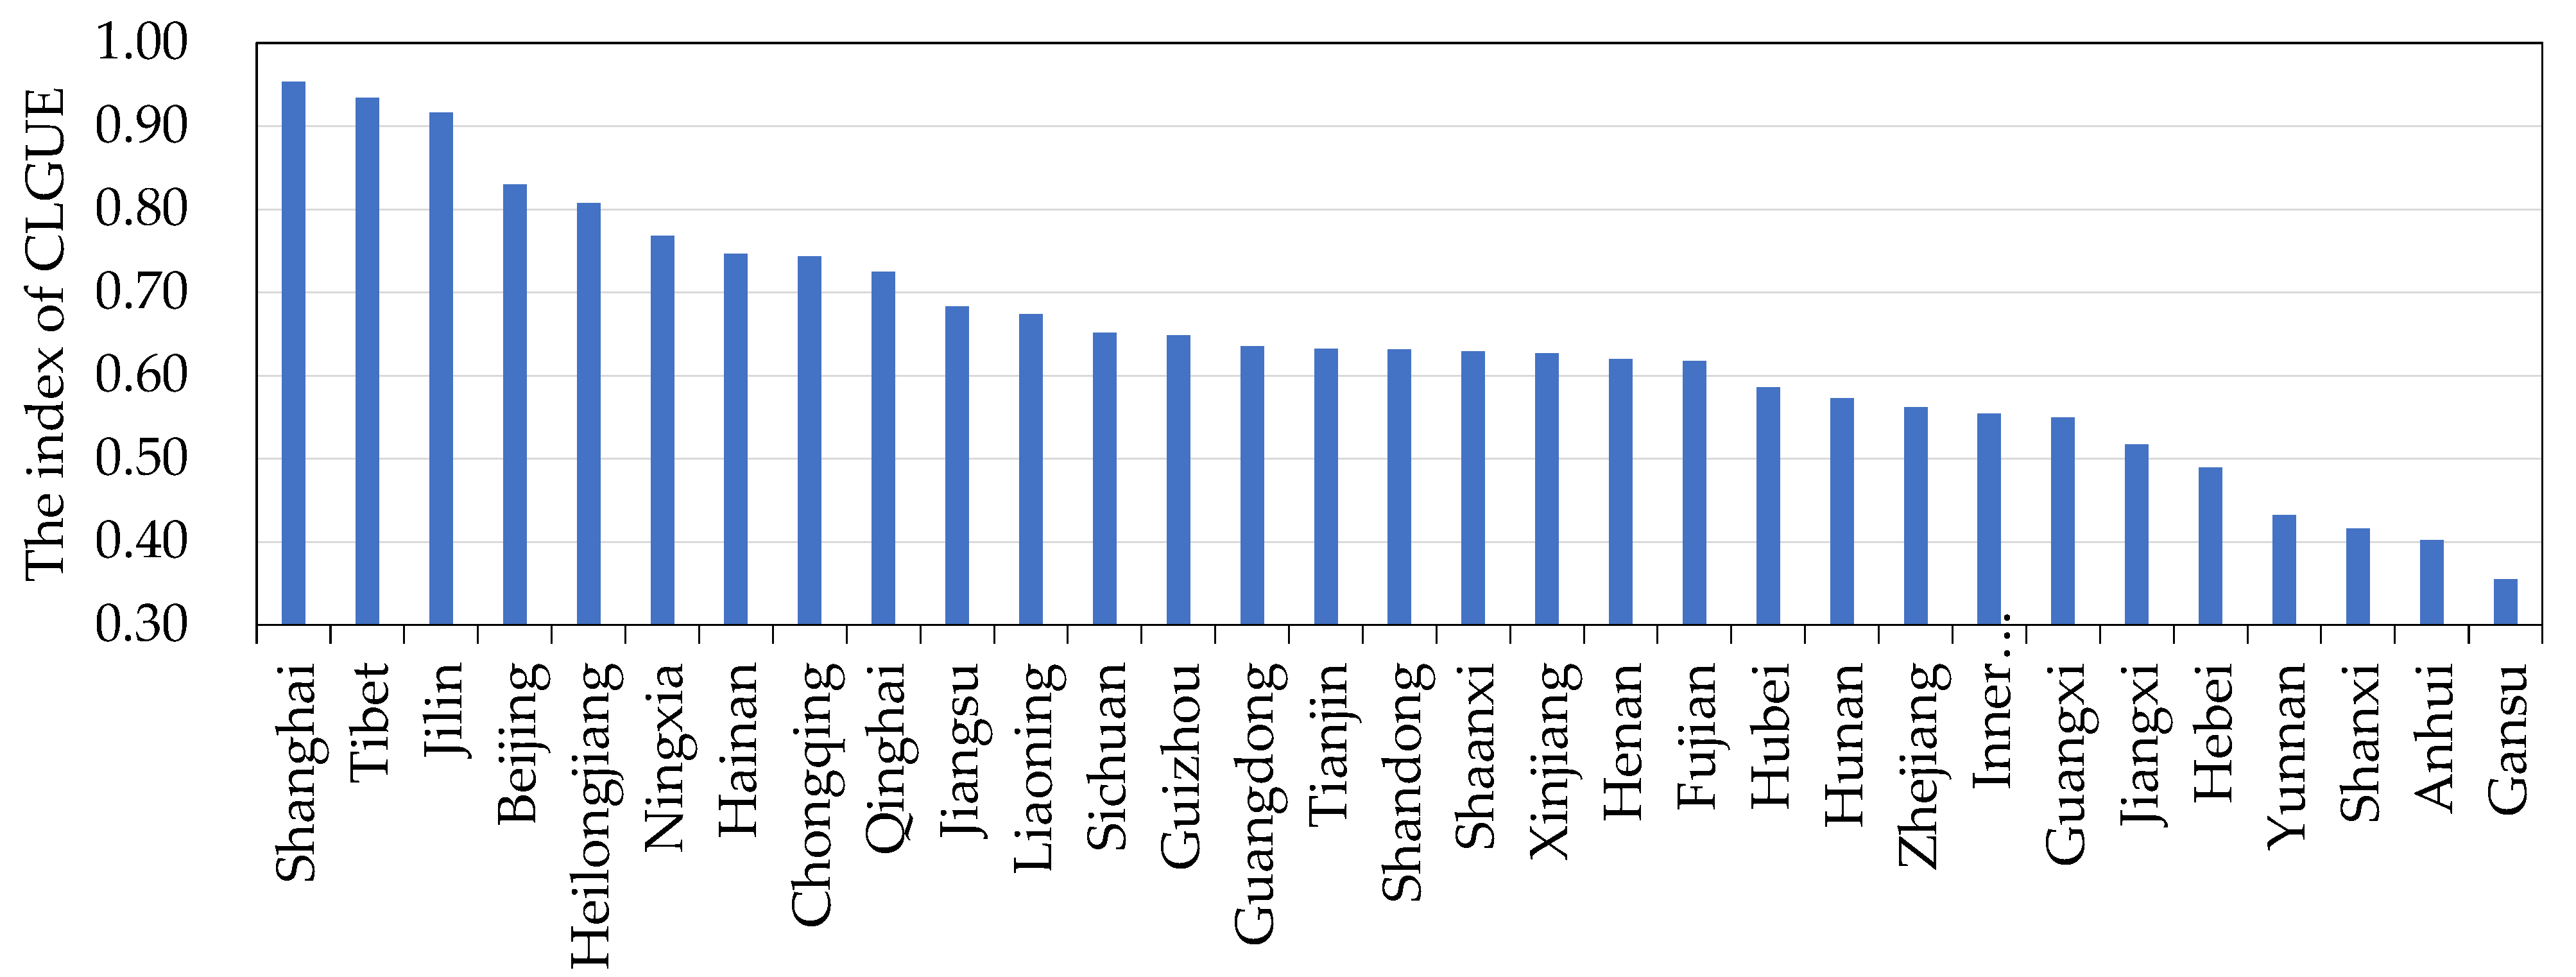
According to the literature [64], the efficient group, the relatively high-efficient group, the relatively medium-efficient group, and the relatively low-efficient group, respectively, were given to the provinces based on their efficiency values between [1], [0.8,1), [0.6,0.8), and [0,0.6). The CLGUE of each province in China was calculated, and the average CLGUE during the study period was obtained. The results are shown in Figure 7. Five provinces slipped into the category of relatively high efficiency, including Shanghai (0.953), Tibet (0.934), Jilin (0.916), Beijing (0.830), and Heilongjiang (0.808). The somewhat medium-efficiency group included Ningxia (0.768), Hainan (0.747), Chongqing (0.744), Qinghai (0.725), Jiangsu (0.683), Liaoning (0.674), Sichuan (0.651), Guizhou (0.648), Guangdong (0.635), Tianjin (0.632), Shandong (0.631), Shaanxi (0.629), Xinjiang (0.627), Henan (0.619), and Fujian (0.617). A total of 11 provinces had CLGUE values below 0.6, placing them in the relatively low-efficiency category.

3.3. Analysis of Coordination Degree Measurement

The coordination degree concerning HAD and CLGUE in China demonstrated a consistent upward trend, with the annual value rising from 0.48 in 2006 to 0.64 in 2020. (Table 3). As seen by the coordination degree’s increasing volatility trend and its 133.33% increase between 2006 and 2020, the increase in coordination degree was comparatively considerable. In China, agriculture has effectively moved from high-speed expansion to high-quality growth [19], encouraging the development of the agricultural economy in a low-carbon and environmentally friendly manner and increasing the effectiveness of cultivated land utilization [25]. In addition, there is a drastic change in the macroeconomic environment, such as the increase in urbanization rate and GDP per capita, as well as the optimization of the industrial structure, which will greatly promote the HAD [28].
Figure 8 depicts the geographic distribution corresponding to the coordination degree to better understand the spatial-temporal evolution of coordination degree concerning HAD and CLGUE. The results indicate large regional differences in the coordination degree concerning HAD and CLGUE at the province level. Only Shanghai and Beijing, respectively, attained the intermediate and primary coordination degrees in 2006. In addition, six provinces, including Jilin, Tianjin, Hainan, Guizhou, Tibet, and Ningxia, are at a very low coordination degree, and the others are at the primitive level of coordination level. Shanghai and Beijing attained a good coordination level in 2013, whereas Tianjin attained an intermediate coordination degree. In 2020, 4 provinces, including Anhui, Jiangxi, Shanxi, and Yunnan, remained at the very low level of coordination degree, while Gansu remained at the primitive end of the coordination level. Beijing and Shanghai achieved at the high and good coordination degree, respectively, bringing the total number of provinces meeting or above the primary coordination degree to 26. In general, the provinces with higher coordination degrees in terms of HAD and CLGUE tended to cluster around regions that were more economically developed. In contrast, the provinces with lower coordination degrees tended to cluster in less developed regions. This phenomenon may be caused, in part, by the agricultural industry’s evidence of economic reproduction [43]. A development route with high HAD and high CLGUE is simple to construct given the increased degrees of service socialization and economic growth.

3.4. Analysis of Spatial Patterns for Coordination

3.4.1. Analysis of Global Spatial Autocorrelation

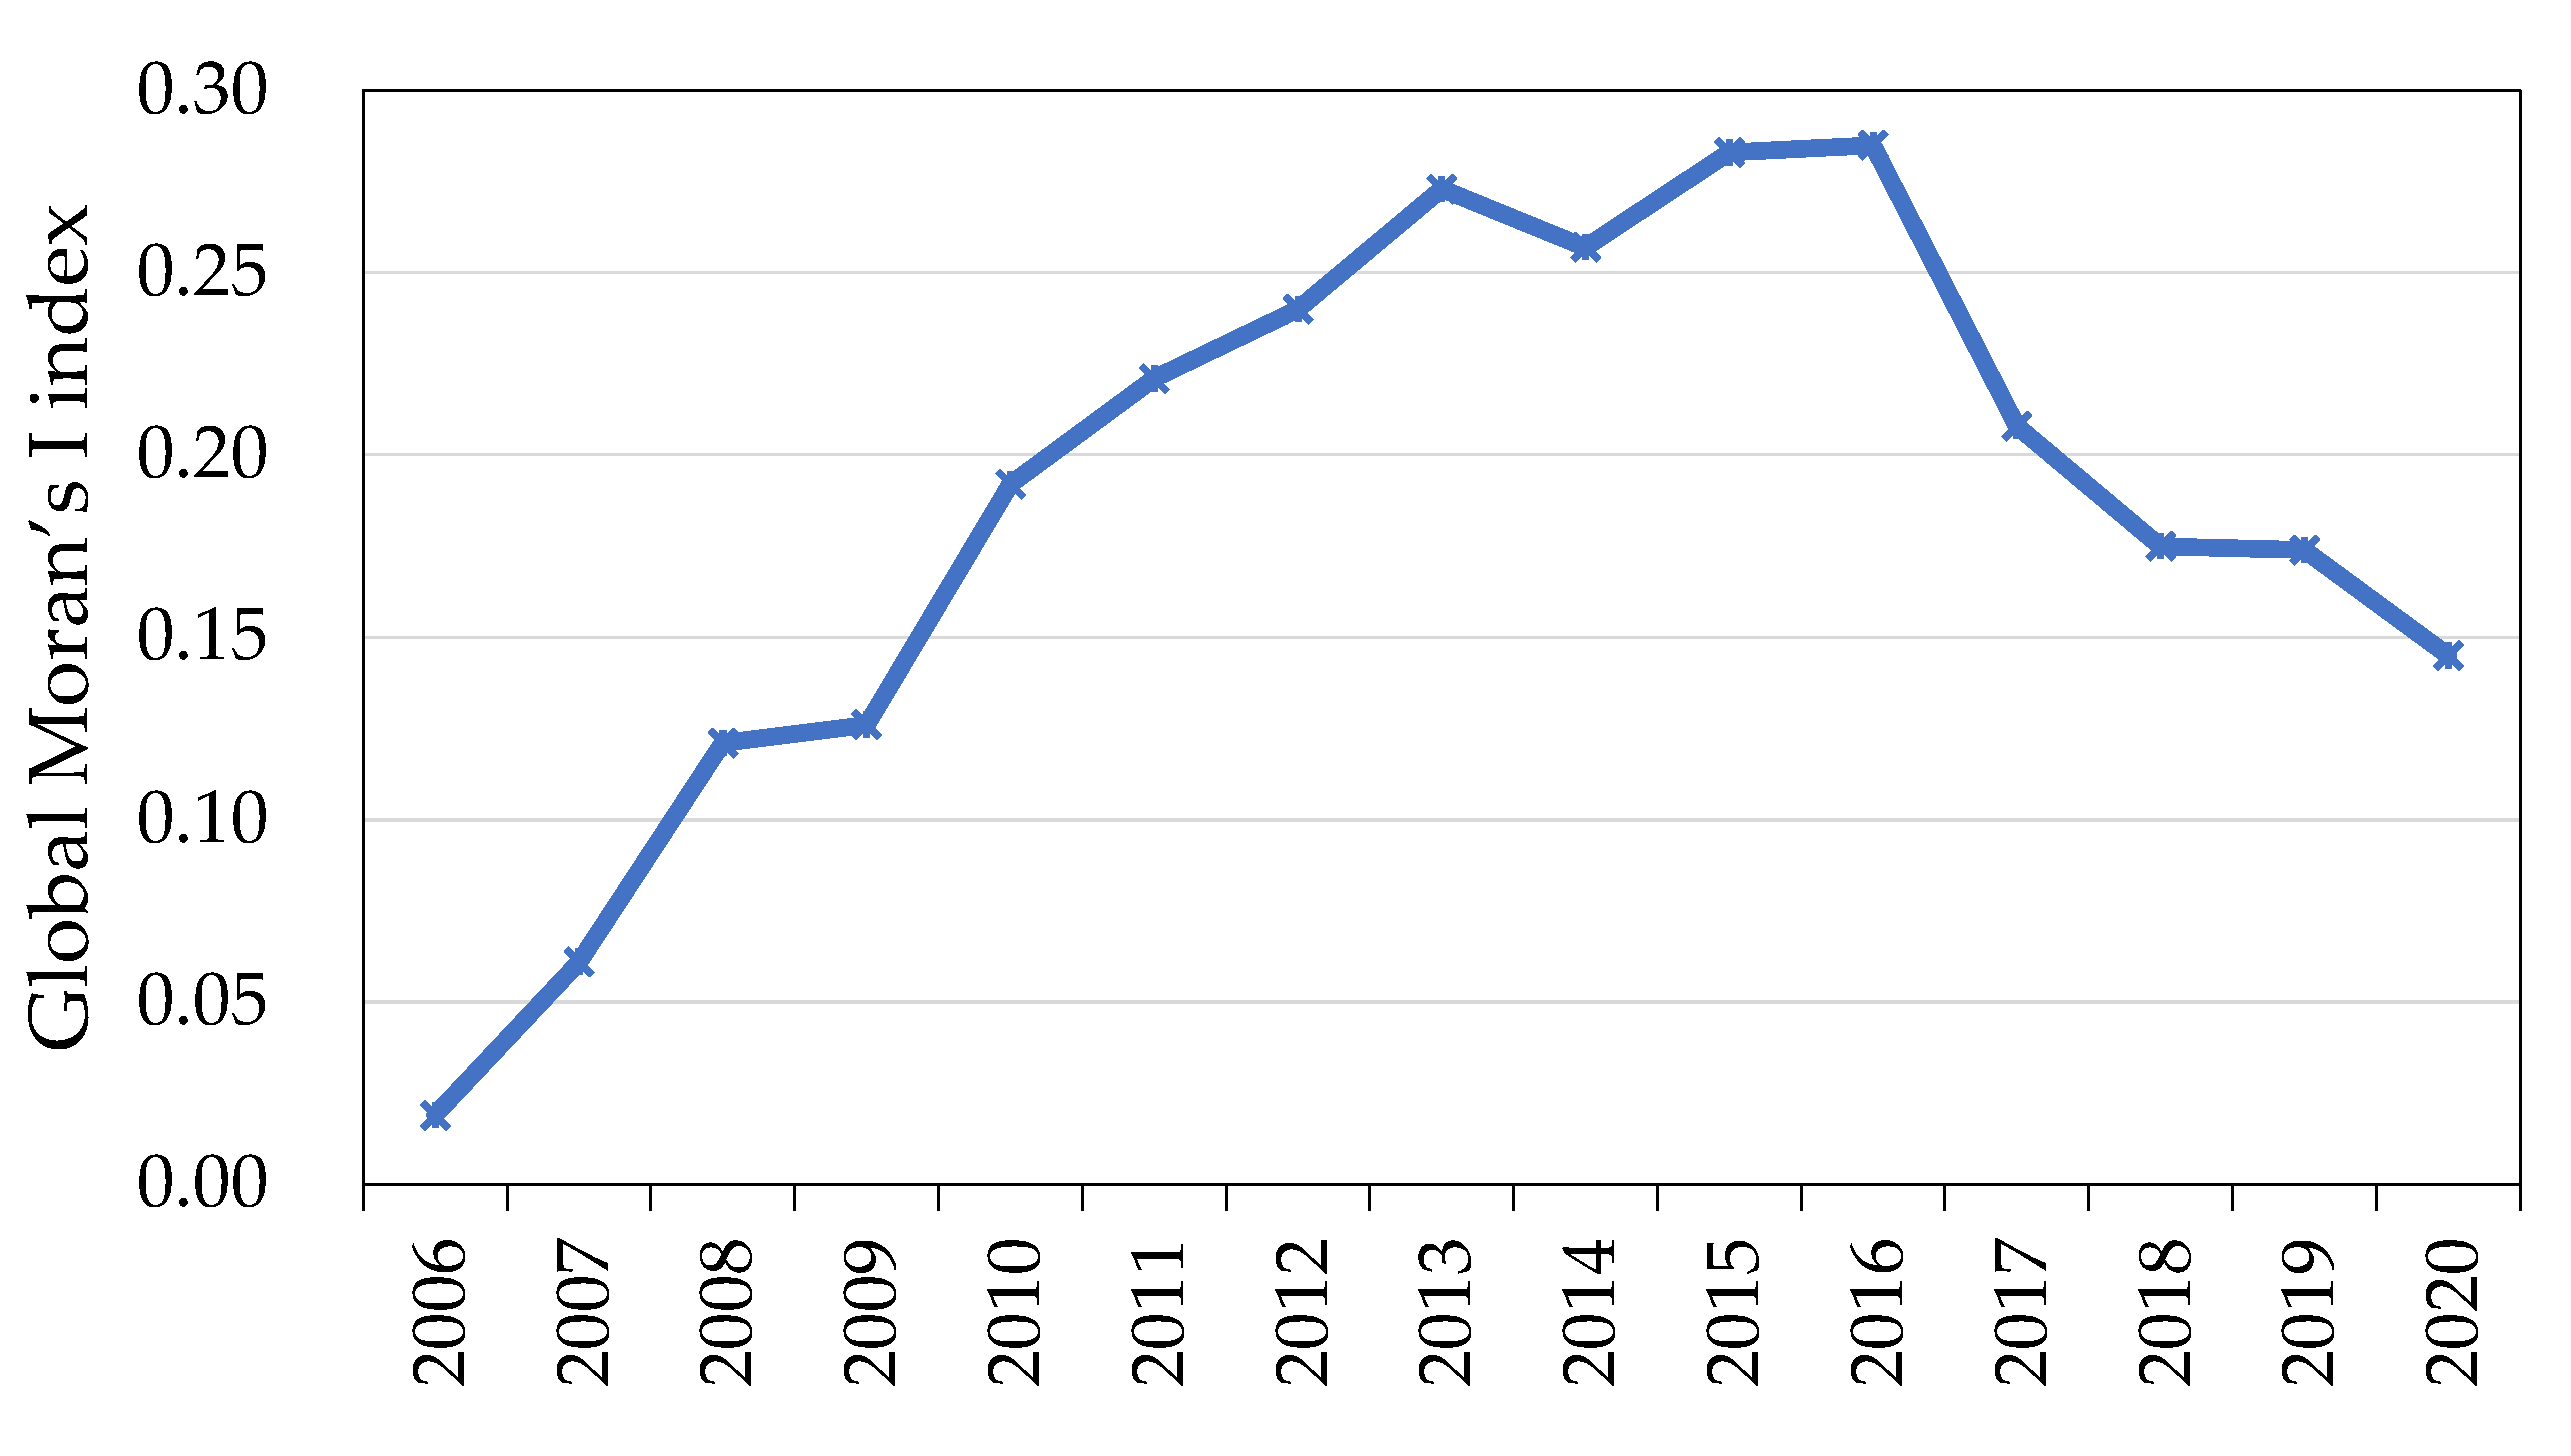
From 2006 to 2020, China’s HAD and CLGUE coordination level had a global Moran’s I value greater than zero. Nevertheless, the z-test results climbed to a level above the significant test value between 2010 and 2019 (Figure 9). The global Moran’s I value decreased from 0.192 in 2010 to 0.174 in 2019, showing a weakening of spatial autocorrelation. Additionally, the worldwide Moran’s I value overall trend revealed an M-shaped pattern. There were two surges, in 2013 and 2016. They were 0.273 and 0.285, respectively. The geographical aggregation and dispersion of the provinces with high or low coordination levels have somewhat diminished.

3.4.2. Analysis of Local Spatial Autocorrelation

To assess the level of China’s coordination degree concerning HAD and CLGUE, further local space autocorrelation studies were carried out in 2006, 2013, and 2020. To quantify the coordination degree, the local Getis-Ord G* index was constructed (Figure 10). 31 Chinese provinces were split into seven groups in this study, including non-significant regions, 99% hot spot aggregation areas, 95% hot spot aggregation areas, 90% hot spot aggregation areas, 99% cold spot aggregation areas, 95% cold spot aggregation areas, and 90% cold spot aggregation areas.
In 2006, only Shaanxi was designated as a 95% cold spot aggregation area, while Chongqing and Hunan fell into 90% cold spot aggregation areas, with no provinces in the classification of hot spot aggregation areas. The remaining provinces fell into the category of non-significant regions. 4 provinces mostly found in MGPAs—Inner Mongolia, Shandong, Jiangsu, and Anhui—developed into the classification of 90% hot spot aggregation areas in 2013, and Liaoning evolved into the classification of 95% hot spot aggregation areas. The number of relevant provinces considerably increased as the cold spot aggregation zones’ geographical range grew. Sichuan and Hunan are classified as 95% cold spot aggregation areas, whereas Chongqing has developed into a 99% cold spot aggregation area. Additionally, Yunnan, Guizhou, and Guangxi have evolved into 90% cold spot aggregation areas. The hot spot aggregation areas vanished in 2020. The number of pertinent provinces has substantially decreased, and as a result, the geographic range of the cold spot aggregation zones has shown a trend of significant decline. Ningxia fell into the classification of 90% cold spot aggregation areas, and Chongqing developed into the classification of 95% cold spot aggregation areas. Shaanxi, in contrast, remained in the category of 95% cold spot aggregation areas.
Overall, the cooperation degree in regard to HAD and CLGUE showed geographical aggregation patterns in all of China’s provinces, with a clear spatial reliance and heterogeneity. Although the hot spot aggregation areas significantly increased in size in the middle of the study period, they did not exist at the beginning or end of the study period, indicating that the space aggregations and distributions of high-value provinces had weakened concerning the coordination level. First expanding and then contracting, the cold spot aggregation areas showed that low-value provincial distributions and spatial aggregations often maintained the same coordination level. The research period saw a concentration of hot spot aggregation areas in MGPAs and cold spot aggregation areas in Shaanxi and Chongqing. These cold spot aggregation regions showed the transition from hot spot aggregation areas in MGPAs to cold spot aggregation areas in GPMBAs.

4. Discussion

4.1. Policy Implications

It is crucial to make sure the coordination of HAD and CLGUE under the context of transformation in agricultural development and land utilization. This study explored the evolution of coordination degree in regard to HAD and CLGUE in China from both spatial and temporal perspectives. In China, the coordination degree concerning HAD and CLGUE exhibited a consistent upward trend. At the same time that China has met with such success, however, five provinces have not reached primary coordination, and there is still a great potential to upgrade the coordination degree concerning HAD and CLGUE.
According to the empirical results obtained in the present study, the development pathway of high HAD and high CLGUE should be built in the following ways. Without a systematic design and the integration of relevant policies, the farm household’s behavior of agricultural production and cultivated land utilization linked to HAD and CLGUE might be greatly impeded. However, not all farmers would be able to benefit equally from a green revolution. With access to sufficient financial resources needed to buy inputs and equipment, large and medium-sized farms saw the greatest increases in productivity and income [65]. Therefore, the guiding role of fiscal and tax subsidies should be paid more to the owners of large and medium farms under the background of large-scale cultivated land transfer and encourage them to give priority to the utilization of green biological pesticides and pesticides, and to reduce pollution from the non-point agricultural source. The application of new technologies is made possible by the availability of current technical resources, which may also help to reduce adverse environmental effects and decide how effectively other industrial resources are used [66].
In addition, the long-term evolution trends of China’s HAD showed that HAD exhibited a gradual upward tendency. However, there were significant regional differences at both food function areas and at the provincial level. The HAD of about one-third of provinces in China was between 0.119 and 0.146. Therefore, provinces with low HAD had much room for improvement. Improving HAD is an effective way to achieve high HAD and high CLGUE. The provinces’ development conditions, levels, and models are quite different in China [61]. Therefore, following the principle of adapting measures to local conditions and implementing and promoting policies in different regions at different levels, policymakers should confirm the way of HAD and the priorities of policy support and avoid “one size fits all” solutions [57].

4.2. Limitations and Future Recommendations

Though our findings make contributions to extant literature and provide some practical insights, the present study also has some limitations. Though a regional and chronological analysis of China’s growth of coordination concerning HAD and CLGUE was undertaken, the numerous influencing elements that contributed to the country’s coordination degree concerning HAD and CLGUE were not covered. Additionally, due to the lack of statistical data, the study unit for this paper was the Chinese provincial panel data from 2006 to 2020. However, there were significant differences in the level of HAD among different units inside province [28], the same as CLGUE [67]. Therefore, it is challenging to accurately describe the spatial-temporal pattern of the degree of coordination in regard to HAD and CLGUE in China. On the other hand, it is a new challenge for generalizing our findings to other national or regional contexts.
In order to address the limitations above, the future recommendations are as follows. First, future research can consider new urbanization [25], natural conditions, the level of industrialization, the mechanization of agriculture, agricultural science and technology [41], policy changes, and the in depth exploration of the influences on the degree of coordination in regard to HAD and CLGUE, as well as other aspects. Second, so as to more accurately analyze the spatial-temporal pattern of the degree of coordination in regard to HAD and CLGUE in China, future studies should use smaller units, such as counties and cities, as their research units. Therefore, obtaining research data through fieldwork should be considered, narrowing the study scope to the typical and representative regions in China, such as the MGPAs and the Yangtse River downstream area. Lastly, more theoretical and practical inspirations should be obtained through comparative study. Therefore, we may collect data from other countries or regions in future studies, especially from the countries experiencing the transformation of agricultural development and cultivated land utilization.

5. Conclusions

The HAD and CLGUE of China’s 31 provinces were measured in this study between the years 2006 and 2020 using the entropy weight TOPSIS model and the SBM-Undesirable model. To analyze the development of coordination degrees concerning HAD and CLGUE in China from both temporal and spatial perspectives, the geographical analysis model and coupling coordination degree model are also combined. Based on the empirical data, the main findings of this research are enumerated below.
(1)
The present study revealed a true picture of the HAD and CLGUE at the national, regional, and provincial levels. The total HAD for China increased from 0.109 in 2006 to 0.198 in 2020, growing at an average yearly growth rate of 4.35%. Furthermore, China’s total CLGUE also showed a good trend, increasing from 0.533 in 2006 to 0.921 in 2020, with an average annual growth rate of 4.08%. However, the spatial disparities of HAD and CLGUE were significant from the food function areas and provincial angles during the study period. The HAD displayed an overall increasing trend from the perspective of the three food function areas, with the MGMAs having the fastest mean annual growth rates. Similar trends were observed in CLGUE, where CLGUE in three food function areas all displayed a general increasing tendency. However, the mean yearly growth rate of CLGUE was in the order MGPAs > MGMAs > GPMBAs.
(2)
The coordination degree concerning HAD and CLGUE in China has improved, with the annual value rising from 0.48 in 2006 to 0.64 in 2020. According to the three food function areas, the level of coordination degree concerning HAD and CLGUE exhibited an order of MGMAs > MGPAs > GPMBAs.. The level of coordination degree also varied significantly throughout the 31 provinces in terms of space and time due to the various environmental and economic factors. Throughout the study period, the level of coordination degree maintained an upward trend for all provinces. The provinces with higher coordination degree in regard to HAD and CLGUE tended to cluster around economically developed areas. In contrast, the provinces with lower coordination degree tended to cluster in underdeveloped areas or places with insufficient natural resources for agricultural development.
(3)
In terms of HAD and CLGUE, at the provincial level, the level of coordination degree in China had a significant positive spatial autocorrelation, clearly indicating space dependence and heterogeneity. There is a reduction to a certain extent in the coordination level of space aggregation and distribution of provinces with high or low degrees of coordination. Additionally, hot spot aggregation areas were concentrated in MGPAs. In contrast, cold spot aggregation areas were concentrated in Shaanxi and Chongqing, demonstrating the transition from hot spot aggregation areas in MGPAs to cold spot aggregation areas in GPMBAs. The conclusions provide an empirical reference for the policy maker of developing a pathway of high HAD and high CLGUE.

Author Contributions

Conceptualization, M.Z., H.S. and N.K.; methodology, M.Z. and H.S.; software, H.S.; validation, H.S.; data curation, H.S. and N.K.; writing—Original draft preparation, M.Z. and H.S.; writing—review and editing, M.Z. All authors have read and agreed to the published version of the manuscript.

Funding

This research was funded by the National Social Science Foundation of China (No. 21BGL287).

Data Availability Statement

Data are available on request from the corresponding author.

Acknowledgments

The authors would like to thank the reviewers and the editor whose suggestions greatly improved the manuscript.

Conflicts of Interest

The authors declare that they have no conflict of interest.

Notation list

CLGUE—cultivated land green utilization efficiency
HAD—high-quality agricultural development
MGPAs—major grain-producing areas
MGMAs—main grain marketing areas
GPMBAs—grain-producing and marketing balance areas

References

  1. Kamali, F.P.; Borges, J.A.R.; Meuwissen, M.P.M.; de Boer, I.J.M. Sustainability assessment of agricultural systems: The validity of expert opinion and robustness of a multi-criteria analysis. Agric. Syst. 2017, 157, 118–128. [Google Scholar] [CrossRef]
  2. Blandford, D.; Braden, J.B.; Shortle, J.S. Economics of Natural Resources and Environment in Agriculture. In Encyclopedia of Agriculture and Food Systems; Academic Press: Cambridge, MA, USA, 2014; pp. 18–34. [Google Scholar] [CrossRef]
  3. FAO. The State of Food and Agriculture; Food & Agriculture Organization of the U.N.: Washington, DC, USA, 2016. [Google Scholar]
  4. Lu, X.H.; Kuang, B.; LI, J.; Han, J.; Zhang, Z. Dynamic evolution of regional discrepancies in carbon emissions from agricultural land utilization: Evidence from Chinese provincial data. Sustainability 2018, 10, 552. [Google Scholar] [CrossRef] [Green Version]
  5. Rural Social Economic Investigation Division, National Bureau of Statistics. China Rural Statistical Yearbook.2021. Available online: https://data.cnki.net/Yearbook/Single/N2021120010 (accessed on 25 October 2022).
  6. Lin, H.C.; Hülsbergen, K.J. A new method for analyzing agricultural land-use efficiency, and its application in organic and conventional farming systems in southern Germany. Europ. J. Agron. 2017, 83, 15–27. [Google Scholar] [CrossRef]
  7. Zhou, M.; Hu, B.X. Decoupling of carbon emissions from agricultural land utilisation from economic growth in China. Agric. Econ. 2020, 11, 510–518. [Google Scholar] [CrossRef]
  8. Alam, A. Soil Degradation: A Challenge to Sustainable Agriculture. Int. J. Sci. Res. Agric. Sci. 2014, 1, 50–55. [Google Scholar] [CrossRef]
  9. Zhang, F.M.; Ding, F.; Wang, P. Evalution of high-quality agricultural development level in major garin producing areas in China and its spatial and temporal evolution. Acta Agric. Zhejiangensis 2021, 33, 150–160. [Google Scholar]
  10. Wang, G.; Mi, L.; Hu, J.; Qian, Z. Spatial Analysis of Agricultural Eco-Efficiency and High-Quality Development in China. Front. Environ. Sci. 2022, 10, 847719. [Google Scholar] [CrossRef]
  11. Mohanty, A.K.; Vivekanandhan, S.; Pin, J.M.; Misra, M. Composites from renewable and sustainable resources Challenges and innovations. Science 2018, 362, 536–542. [Google Scholar] [CrossRef] [PubMed] [Green Version]
  12. Bain, P.G.; Kroonenberg, P.M.; Johansson, L.O.; Milfont, T.L.; Crimston, C.; Kurz, T.; Bushina, E.; Calligaro, C.; Demarque, C.; Guan, Y.J. Public views of the Sustainable Development Goals across countries. Nat. Sustain. Springer Nat. 2019, 2, 819–825. [Google Scholar] [CrossRef] [Green Version]
  13. Geng, Y.; Sarkis, J.; Ulgiati, S.; Zhang, P. Measuring China’s circular economy. Science 2013, 339, 1526–1527. [Google Scholar] [CrossRef]
  14. Schiller, D.; Reid, N.; Tamásy, C. Sustainable economies: Challenges, transitions and trajectories in spatial perspective. Appl. Geogr. 2018, 90, 293–295. [Google Scholar] [CrossRef]
  15. Pan, W.; Wang, J.; Lu, Z.; Liu, Y.S.; Li, Y.R. High-quality development in China: Measurement system, spatial pattern, and improvement paths. Habitat Int. 2021, 118, 102458. [Google Scholar] [CrossRef]
  16. The Central Conference on Rural Work was held in Beijing, published by Ministry of Agriculture and Rural Affairs of the People’s Republic of China. Available online: http://www.moa.gov.cn/ztzl/ncgzhy2017/zxdt/201801/t20180103_6133744.htm (accessed on 11 October 2022).
  17. Notice of the Ministry of Agriculture on starting the Work of 2018 Agricultural Quality Year, published by Ministry of Agriculture and Rural Affairs of the People’s Republic of China. Available online: http://www.moa.gov.cn/nybgb/2018/201803/201805/t20180528_6143195.htm (accessed on 11 October 2022).
  18. Cui, X.F.; Cai, T.; Deng, W.; Zheng, R.; Jiang, Y.H.; Bao, H.J. Indicators for Evaluating High-Quality Agricultural Development: Empirical Study from Yangtze River Economic Belt, China. Soc. Indic. Res. 2022, 14, 1–27. [Google Scholar] [CrossRef] [PubMed]
  19. Lu, X.; Li, Z.; Wang, H.; Tang, Y.; Hu, B.; Gong, M.; Li, Y. Evaluating Impact of Farmland Recessive Morphology Transition on High-Quality Agricultural Development in China. Land 2022, 11, 435. [Google Scholar] [CrossRef]
  20. Qin, S.; Han, Z.Y.; Chen, H.; Wang, H.K.; Guo, C. High-Quality Development of Chinese Agriculture under Factor Misallocation. Int. J. Environ. Res. Public Health 2022, 19, 9804. [Google Scholar] [CrossRef] [PubMed]
  21. Xia, X.L.; Chen, Z.; Zhang, H.L.; Zhao, M.J. Agricultural High-quality Development: Digital Empowerment and Implementation Path. Chin. Rural. Econ. 2019, 12, 2–15. [Google Scholar]
  22. Bender, S.F.; Wagg, C.; van der Heijden, M.G.A. An Underground Revolution: Bio-diversity and Soil Ecological Engineering for Agricultural Sustainability. Trends Ecol. Evol. 2016, 31, 440–452. [Google Scholar] [CrossRef]
  23. Zeng, S.; Shu, X.; Ye, W. Total Factor Productivity and High-Quality Economic Development: A Theoretical and Empirical Analysis of the Yangtze River Economic Belt, China. Int. J. Environ. Res. Public Health 2022, 19, 2783. [Google Scholar] [CrossRef]
  24. Wang, Y.F.; Xie, L.; Zhang, Y.; Wang, C.Y.; Yu, K. Does FDI Promote or Inhibit the High-Quality Development of Agriculture in China? An Agricultural GTFP Perspective. Sustainability 2019, 11, 4620. [Google Scholar] [CrossRef] [Green Version]
  25. Gong, R.; Xie, L.; Wang, Y.F. Interactive Mechanism and Empirical Test of Agricultural High-quality Development and New Urbanization. Reform 2020, 317, 145–159. [Google Scholar]
  26. Long, S.B.; Zhang, M.X. Re-measurement and influence factors of agricultural total factor Productivity in China—From tradition to high-quality development. Res. Financ. Econ. Issues 2021, 8, 40–51. [Google Scholar]
  27. Liu, Z.Y.; Wakasi, R. A Research of the Regional Disparities and Distributional Dynamic Evolution of High-quality Agricultural Development in China. Quant. Tech. Econ. 2021, 6, 28–44. [Google Scholar]
  28. Liu, T.; Li, J.X.; Huo, J.J. Spatial-temporal pattern and influencing factors of high-quality agricultural development in China. J. Arid. Land Resour. Environ. 2020, 34, 1–8. [Google Scholar]
  29. Chen, Q.R.; Xie, H.L. Temporal-Spatial Differentiation and Optimization Analysis of Cultivated Land Green Utilization Efficiency in China. Land 2019, 8, 158. [Google Scholar] [CrossRef] [Green Version]
  30. Deng, X.Z.; Huang, J.K.; Rozelle, S.; Zhang, J.P.; Li, Z.H. Impact of urbanization on cultivated land changes in China. Land Use Policy 2015, 45, 1–7. [Google Scholar] [CrossRef]
  31. Yang, B.; Wang, Z.Q.; Zou, L.; Zhang, H.W. Exploring the eco-efficiency of cultivated land utilization and its influencing factors in China’s Yangtze River Economic Belt, 2001–2018. J. Environ. Manag. 2021, 294, 112939. [Google Scholar] [CrossRef]
  32. Brauw, A.D.; Huang, K.K.; Rozelle, S. The sequencing of reform policies in China’s agricultural transition. Econ. Transit. Inst. Change 2004, 12, 427–465. [Google Scholar] [CrossRef]
  33. Lai, Z.H.; Chen, M.Q.; Liu, T.J. Changes in and prospects for cultivated land use since the reform and opening up in China. Land Use Policy 2020, 97, 104781. [Google Scholar] [CrossRef]
  34. Deng, X.Z.; Huang, K.K.; Rozelle, S.; Uchida, E. Cultivated land conversion and potential agricultural productivity in China. Land use policy 2006, 23, 372–384. [Google Scholar] [CrossRef]
  35. Li, Y.L.; Ma, W.Q.; Jiang, G.H.; Li, G.Y.; Zhou, D.Y. The degree of cultivated land abandonment and its influence on grain yield in main grain producing areas of China. J. Nat. Resour. 2021, 36, 1439–1454. [Google Scholar] [CrossRef]
  36. Berry, R.A.; Cline, W.R. Agrarian Structure and Productivity in Developing Countries. Land Econ. 1980, 56, 495–502. [Google Scholar] [CrossRef]
  37. Sen, A.K. Peasants and Dualism with or without Surplus Labor. J. Political Econ. 1966, 74, 425–450. Available online: http://www.jstor.org/stable/1829592 (accessed on 9 October 2022).
  38. Helfand, S.M.; Levine, E.S. Farm size and the determinants of productive efficiency in the Brazilian Center-West. Agric. Econ. 2004, 31, 241–249. [Google Scholar] [CrossRef]
  39. Lu, X.; Qu, Y.; Sun, P.L.; Yu, W.; Peng, W.L. Green transition of cultivated land use in the Yellow River Basin: A perspective of green utilization efficiency evaluation. Land 2020, 9, 475. [Google Scholar] [CrossRef]
  40. Xie, H.L.; Chen, Q.R.; Wang, W.; He, Y.F. Analyzing the green efficiency of arable land use in China. Technol. Forecast. Soc. Chang. 2018, 133, 15–28. [Google Scholar] [CrossRef]
  41. Ke, N.; Lu, X.H.; Kuang, B.; Han, J. Regional Differences and Influencing Factors of Green and Low-carbon Utilization of Cultivated Land under the Carbon Neutrality Target in China. China Land Sci. 2021, 35, 67–76. [Google Scholar]
  42. Zhou, M.; Zhang, H.; Ke, N. Cultivated Land Transfer, Management Scale, and Cultivated Land Green Utilization Efficiency in China: Based on Intermediary and Threshold Models. Int. J. Environ. Res. Public Health 2022, 19, 12786. [Google Scholar] [CrossRef] [PubMed]
  43. Zhou, M.; Kuang, B.; Zhou, M.; Ke, N. The Spatial and Temporal Evolution of the Coordination Degree in Regard to Farmland Transfer and Cultivated Land Green Utilization Efficiency in China. Int. J. Environ. Res. Public Health 2022, 19, 10208. [Google Scholar] [CrossRef]
  44. Qu, Y.; Lyu, X.; Peng, W.; Xin, Z. How to Evaluate the Green Utilization Efficiency of Cultivated Land in a Farming Household? A Case Study of Shandong Province, China. Land 2021, 10, 789. [Google Scholar] [CrossRef]
  45. Yang, M.; Jiao, M.Y.; Zhang, J.Y. Spatio-Temporal Analysis and Influencing Factors of Rural Resilience from the Perspective of Sustainable Rural Development. Int. J. Environ. Res. Public Health 2022, 19, 12294. [Google Scholar] [CrossRef]
  46. Li, X.F. TOPSIS model with entropy weight for eco geological environmental carrying capacity assessment. Microprocess. Microsyst. 2021, 82, 103805. [Google Scholar] [CrossRef]
  47. Tone, K. A slacks-based measure of efficiency in data envelopment analysis. Eur. J. Oper. Res 2001, 130, 498–509. [Google Scholar] [CrossRef] [Green Version]
  48. Pan, D.; Ying, R.Y. Agricultural eco-efficiency evaluation in China based on SBM model. Acta Ecol. Sin. 2013, 33, 3837–3845. [Google Scholar] [CrossRef] [Green Version]
  49. Ma, D.D.; Li, G.F.; He, F. Exploring PM2.5 Environmental Efficiency and Its Influencing Factors in China. Int. J. Environ. Res. Public Health 2021, 18, 12218. [Google Scholar] [CrossRef] [PubMed]
  50. West, T.O.; Marland, G.A. Synthesis of carbon sequestration, carbon emissions, and net carbon flux in agriculture: Comparing tillage practices in the United States. Agric. Ecosyst. Environ 2002, 91, 217–232. [Google Scholar] [CrossRef]
  51. Ke, N.; Zhang, X.; Lu, X.; Kuang, B.; Jiang, B. Regional Disparities and Influencing Factors of Eco-Efficiency of Arable Land Utilization in China. Land 2022, 11, 257. [Google Scholar] [CrossRef]
  52. Liang, L.; Zhang, F.; Wu, F.; Chen, Y.X.; Qin, K.Y. Coupling coordination degree spatial analysis and driving factor between socio-economic and eco-environment in northern China. Ecol. Indic. 2022, 135, 108555. [Google Scholar] [CrossRef]
  53. Li, D.; Fan, K.; Lu, J.; Wu, S.; Xie, X. Research on Spatio-Temporal Pattern Evolution and the Coupling Coordination Relationship of Land-Use Benefit from a Low-Carbon Perspective: A Case Study of Fujian Province. Land 2022, 11, 1498. [Google Scholar] [CrossRef]
  54. Shi, T.; Yang, S.Y.; Zhang, W.; Zhou, Q. Coupling coordination degree measurement and spatiotemporal heterogeneity between economic development and ecological environment—Empirical evidence from tropical and subtropical regions of China. J. Clean. Prod. 2020, 244, 118739. [Google Scholar] [CrossRef]
  55. Wang, S.J.; Kong, W.; Ren, L.; Zhi, D.D.; Dai, B.T. Research on misuses and modification of coupling coordination degree model in China. J. Nat. Resour. 2021, 36, 793–810. [Google Scholar] [CrossRef]
  56. Lu, C.Y.; Wang, D.; Li, H.J.; Cheng, W.; Tang, X.L.; Liu, W. Measurement of the Degree of Coordination in Regard to Carbon Emissions, Economic Development, and Environmental Protection in China. Appl. Sci 2021, 11, 1750. [Google Scholar] [CrossRef]
  57. Chi, M.J.; Guo, Q.Y.; Mi, L.C.; Wang, G.F.; Song, W.M. Spatial Distribution of Agricultural Eco-Efficiency and Agriculture High-Quality Development in China. Land 2022, 11, 722. [Google Scholar] [CrossRef]
  58. Li, D.L.; Cao, L.J.; Zhou, Z.H.; Zhou, K.K.; Du, Z.N.; Han, K.Q. Coupling coordination degree and driving factors of new-type urbanization and low-carbon development in the Yangtze River Delta: Based on nighttime light data. Environ. Sci. Pollut. Res. 2022, 29, 81636–81657. [Google Scholar] [CrossRef] [PubMed]
  59. Anselin, L.; Getis, A. Spatial statistical analysis and geographic information systems. Ann. Reg. Sci. 1992, 26, 19–33. Available online: https://EconPapers.repec.org/RePEc:spr:anresc:v:26:y:1992:i:1:p:19-33 (accessed on 10 October 2022).
  60. Qi, Y.J.; Yang, Y.; Jin, F.J. China’s economic development stage and its patio-temporal evolution: A prefectural-level analysis. Acta Geogr. Sin. 2013, 68, 517–531. [Google Scholar]
  61. Liu, X.Y.; Xin, Y. Exploring the characteristics and driving factors of coupling coordination of regional sustainable development: Evidence from China’s 31 provinces. Environ. Sci. Pollut. Res. 2022, 29, 71075–71099. [Google Scholar] [CrossRef] [PubMed]
  62. Lin, J.; Li, D.X. Non-agricultural employment and grain production: Substitute or complement—Analysis based on the perspective of farmers in major grain producing areas. Chin. Rural. Econ. 2013, 9, 54–62. [Google Scholar]
  63. Luo, S.X.; He, K.; Zhang, J.B. The More Grain Production, the More Fertilizers Pollution? Empirical Evidence from Major Grain-producing Areas in China. Chin. Rural. Econ. 2013, 9, 108–131. [Google Scholar]
  64. Huang, H.P.; Wang, Z.P. Spatial-temporal Differences and Influencing Factors of Agricultural Land Eco-efficiency in Jiangxi Province: Based on the Dual Perspective of Non-point Source Pollution and Carbon Emission. Resour. Environ. Yangtze Basin 2022, 29, 412–423. [Google Scholar]
  65. Zulfiqar, F.; Thapa, G.B. Agricultural sustainability assessment at provincial level in Pakistan. Land Use Policy 2017, 68, 492–502. [Google Scholar] [CrossRef]
  66. Bartkowiak, A.; Bartkowiak, P. Technical and Technological Progress in the Context of Sustainable Development of Agriculture in Poland. Procedia Eng. 2017, 182, 66–75. [Google Scholar] [CrossRef]
  67. Ke, S.G.; Cui, H.Y.; Lu, X.H.; Hou, J.; Wu, Y.Q. Research on the Spatial-Temporal Pattern and Mechanisms of Green Transition of Farmland Use: A Case of Hubei Province. China Land Sci. 2021, 35, 64–74. [Google Scholar]
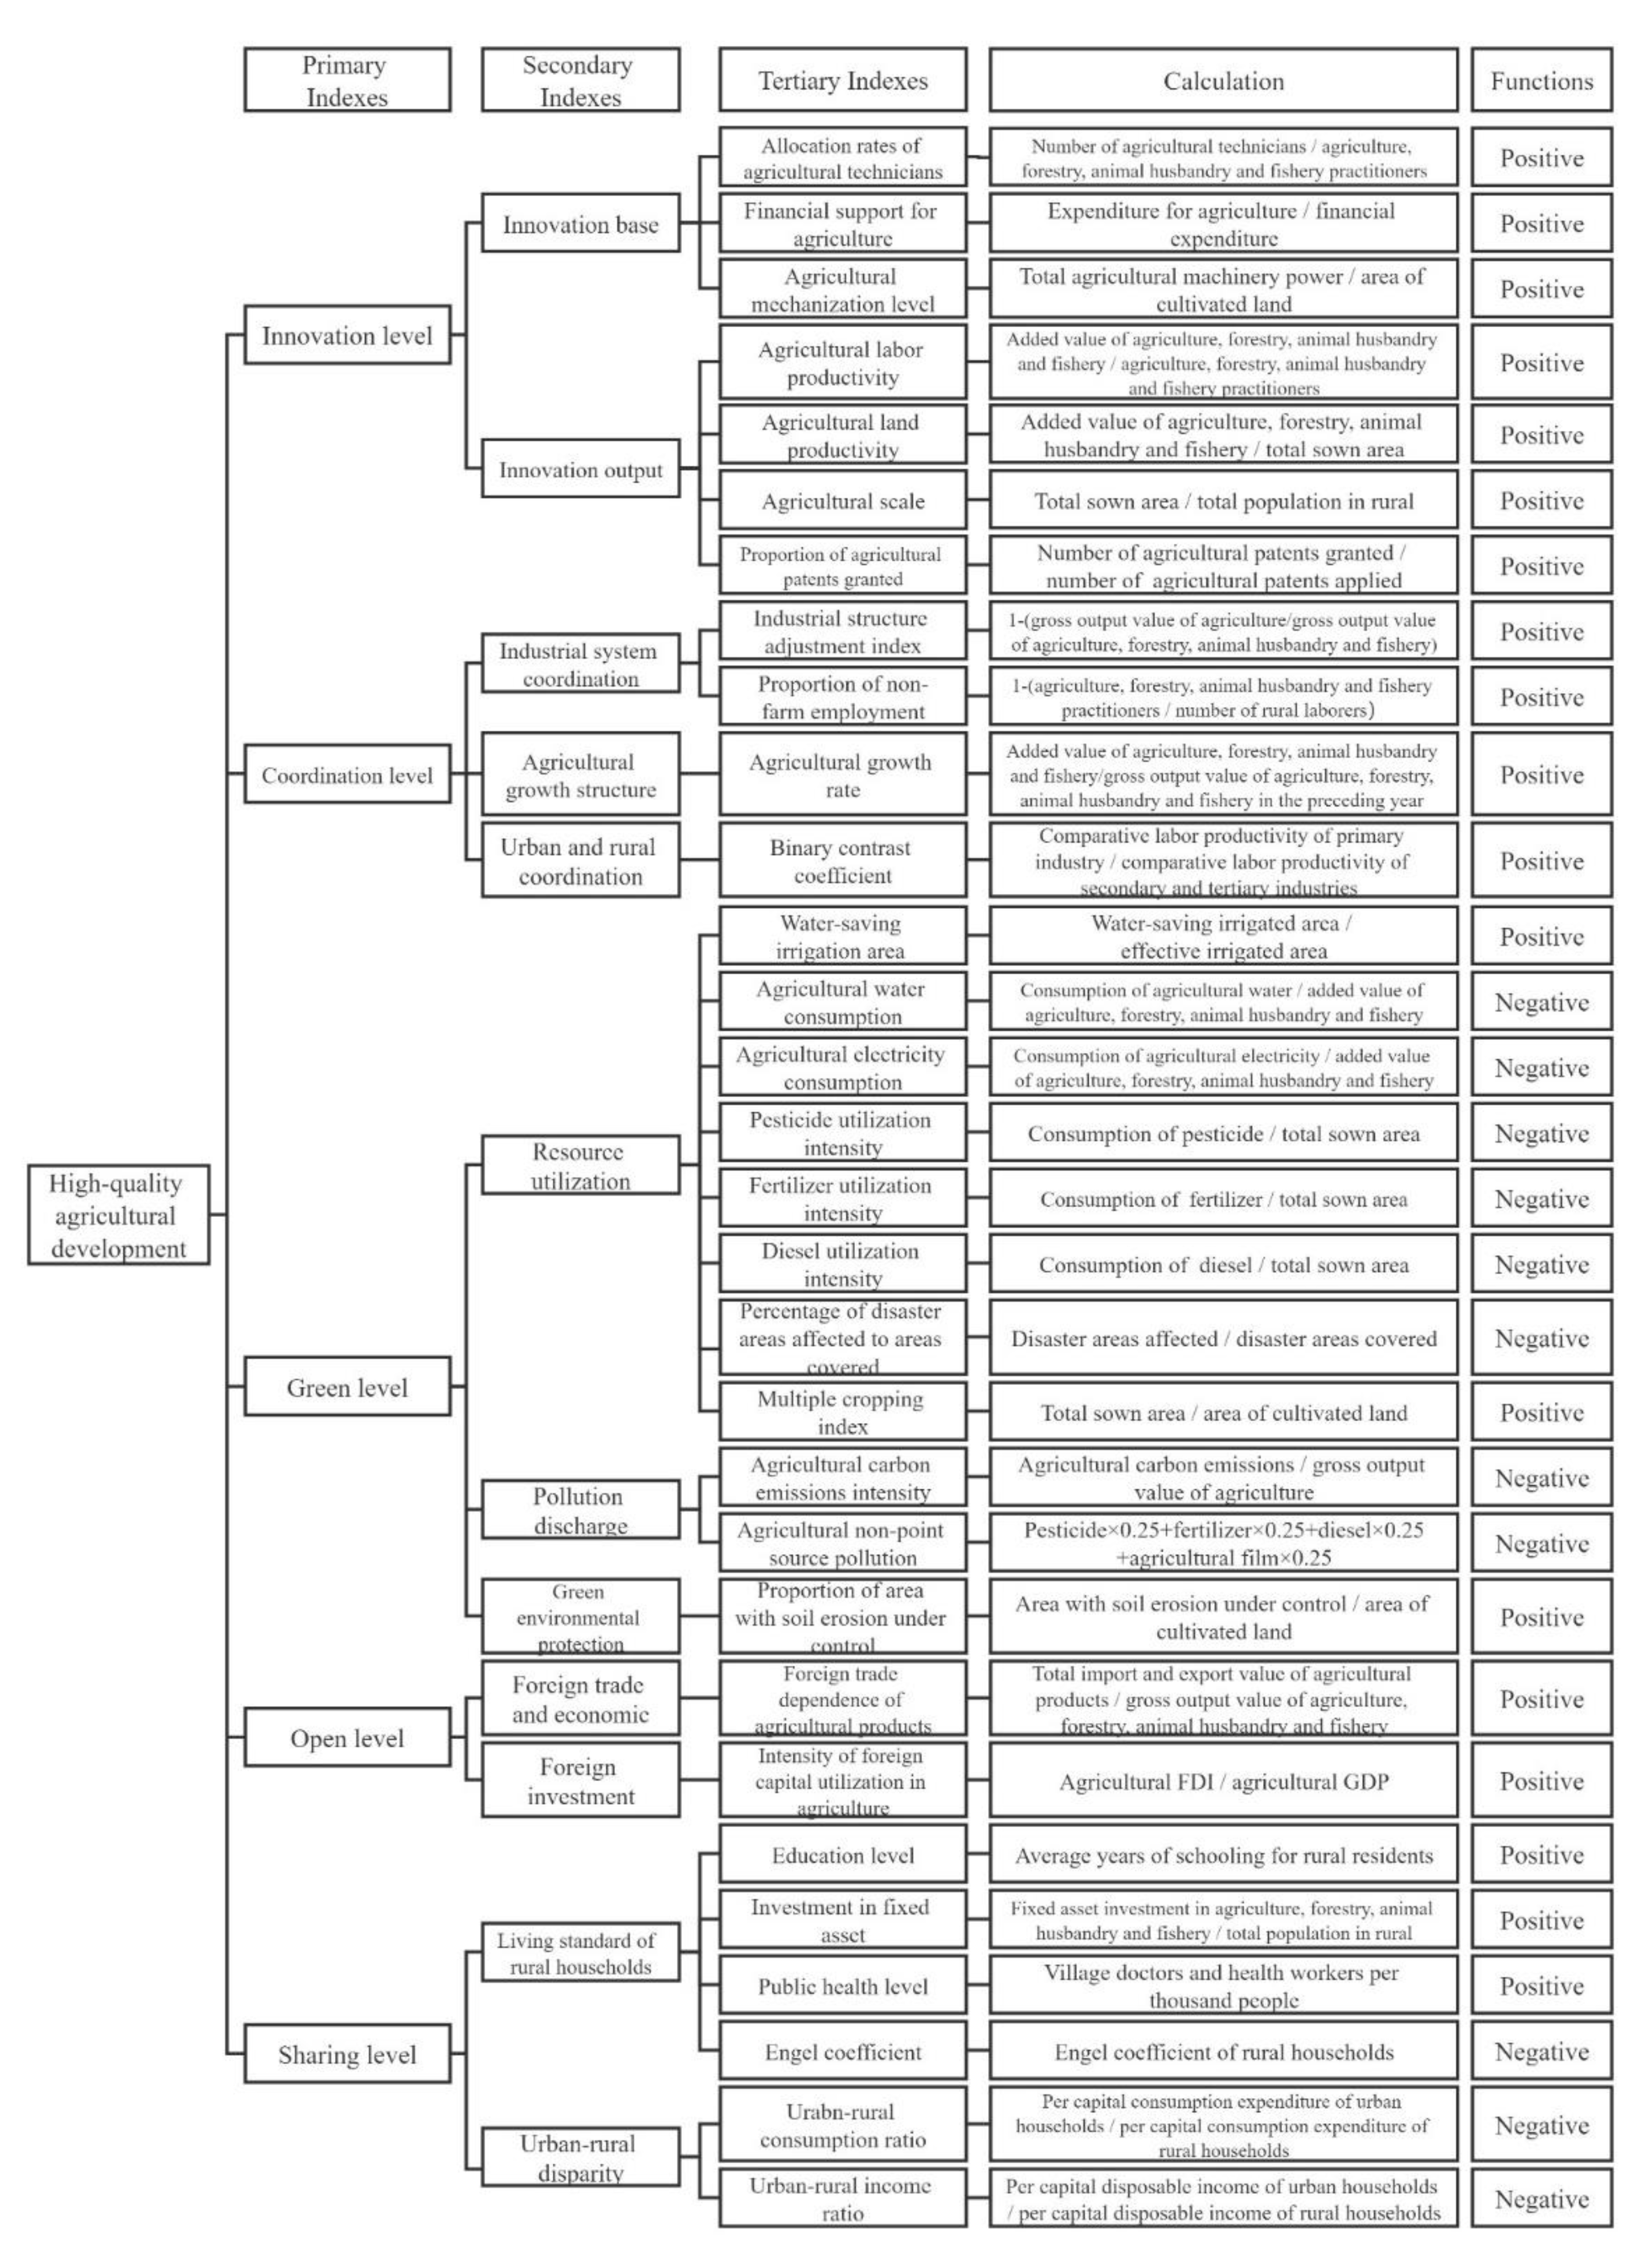
Figure 1. The index system used to measure HAD.
Land 12 00127 g001
Figure 2. The research area and regional classification.
Land 12 00127 g002
Figure 3. China’s HAD average index and annual growth rate.
Land 12 00127 g003
Figure 4. Average value of HAD in China, MGPAs, MGMAs, and GPMBAs.
Land 12 00127 g004
Figure 5. The spatial-temporal evolution of HAD in China.
Land 12 00127 g005
Figure 6. Average value of CLGUE in China, MGPAs, MGMAs, and GPMBAs.
Land 12 00127 g006
Figure 7. The average GUECL in 31 provinces in China.
Land 12 00127 g007
Figure 8. The degree of collaboration between HAD and CLGUE in China has changed over time and space.
Land 12 00127 g008
Figure 9. Coupling coordination degree according to Moran’s I.
Land 12 00127 g009
Figure 10. The coordination degree between HAD and CLGUE in China: the emergence of cold versus hot spots.
Land 12 00127 g010
Table 1. The metrics used to assess CLGUE.
Primary IndexesSecondary IndexesVariates and Descriptions
InputsLabor inputAFAHF × (Total agriculture output/TO) (104 people)
Land inputThe total area of crops sowed (103 hectares)
Capital inputConsumption of chemical manures (104 tons)
Consumption of pesticide (104 tons)
Consumption of agriculture film (104 tons)
Total agriculture machinery power (104 kw · h)
Valid irrigation area (103 hm2)
Desirable OutputsEconomic output Total agricultural output (104 Yuan)
Social outputTotal grain production (104 tons)
Environmental outputThe total carbon sink (104 tons)
Undesirable OutputsPollution emissionThe total loss of manure nitrogen (phosphorus), insecticides and agriculture films (104 tons)
Carbon emissionThe carbon emissions from cultivated land utilization (104 tons)
Note: AFAHF stands for individuals involved in agriculture, forestry, animal husbandry, and fisheries; TO stands for total output value in the fields of agriculture, forestry, animal husbandry and fisheries.
Table 2. Types of coupling coordination degrees in regard to HAD and CLGUE.
Coupling Coordination DegreeTypeCoupling Coordination DegreeType
(0,0.1]Extreme imbalance(0.5,0.6]Reluctant coordination
(0.1,0.2]Serious imbalance(0.6,0.7]Primary coordination
(0.2,0.3]Moderate imbalance(0.7,0.8]Intermediate coordination
(0.3,0.4]Mid imbalance(0.8,0.9]Good coordination
(0.4,0.5]Near imbalance(0.9,1.0]High coordination
Table 3. The degree of coupling coordination between HAD and CLGUE in the primary years.
RegionProvince200620092012201520182020Average
Main grain production areas (MGPAs)Hebei0.420.460.510.540.560.600.51
Inner Mongolia0.450.460.500.530.570.640.52
Liaoning0.470.480.540.570.560.600.54
Jilin0.550.510.560.600.600.610.57
Heilongjiang0.490.530.570.590.640.670.58
Jiangsu0.460.500.560.620.640.670.57
Anhui0.410.440.460.480.500.520.46
Jiangxi0.450.470.490.510.550.570.50
Shandong0.440.490.540.640.600.640.55
Henan0.450.480.510.550.600.630.53
Hubei0.430.450.500.530.560.630.51
Hunan0.450.480.520.550.560.620.53
Sichuan0.450.470.490.520.590.630.52
Main grain marketing areas (MGMAs)Beijing0.670.670.780.820.890.900.79
Tianjin0.530.570.630.670.690.720.63
Shanghai0.710.760.810.790.800.820.79
Zhejiang0.460.490.540.560.610.680.56
Fujian0.450.480.540.580.650.700.56
Guangdong0.460.480.530.560.760.750.57
Hainan0.550.490.530.560.640.660.56
Grain production and marketing balance areas (GPMBAs)Shanxi0.410.420.450.480.500.520.46
Guangxi0.430.440.470.500.550.610.49
Chongqing0.460.490.520.550.580.620.54
Guizhou0.520.430.430.510.580.630.50
Yunnan0.400.410.430.460.500.570.45
Tibet0.550.570.580.560.620.630.58
Shaanxi0.440.460.500.550.630.690.53
Gansu0.390.400.420.450.460.490.43
Qinghai0.480.490.510.540.570.630.54
Ningxia0.540.500.510.550.600.620.54
Xinjiang0.420.450.510.520.560.620.51
Average0.480.490.530.560.600.640.55
Disclaimer/Publisher’s Note: The statements, opinions and data contained in all publications are solely those of the individual author(s) and contributor(s) and not of MDPI and/or the editor(s). MDPI and/or the editor(s) disclaim responsibility for any injury to people or property resulting from any ideas, methods, instructions or products referred to in the content.