Article

The Impact of Farming Households’ Livelihood Vulnerability on the Intention of Homestead Agglomeration: The Case of Zhongyi Township, China

1
School of Geographical Sciences, Southwest University, Chongqing 400715, China
2
Key Laboratory of Monitoring, Evaluation and Early Warning of Territorial Spatial Planning Implementation, Ministry of Natural Resources, Chongqing 400715, China
3
Western Rural Sustainable Development Laboratory, Chongqing 400715, China
4
College of State Governance, Southwest University, Chongqing 400715, China
*
Author to whom correspondence should be addressed.
Land 2022, 11(8), 1322; https://doi.org/10.3390/land11081322
Submission received: 17 July 2022 / Revised: 6 August 2022 / Accepted: 13 August 2022 / Published: 16 August 2022
(This article belongs to the Special Issue Land Use and Livelihood Change)

Abstract

:
It is important to clarify the impact of livelihood vulnerability level on farmers’ willingness to cluster their homesteads in order to promote the intensive use of homesteads and rural revitalization. This paper constructs a framework for the influence of farmers’ livelihood vulnerability on their intention of homestead agglomeration, then assesses the livelihood vulnerability of farmers based on 211 questionnaire data points, and analyzes the influence of farmers’ livelihood vulnerability on their intention of homestead agglomeration through binary logistic regression. The results showed that the vulnerability of farmers’ livelihoods had a significant negative effect on the intention of homestead agglomeration, and the more vulnerable farmers’ livelihoods were, the more significant their tendency to gather residential land. In addition, from the three-dimensional perspective of “exposure-sensitivity-adaptability”, exposure and sensitivity have a negative effect on farmers’ intention to agglomerate, while adaptability has a significant positive effect. Therefore, this paper argues that the vulnerability of farmers’ livelihoods can be improved by reducing exposure and sensitivity and increasing adaptive capacity to enhance farmers’ willingness to cluster their homesteads, thus providing some theoretical support for the preliminary work of homestead layout optimization in rural spatial governance.

1. Introduction

With the rapid development of urbanization and industrialization worldwide, urban and rural population and economic factors have been reorganized, and the “urban progress, rural retreat” has become a global problem [1]. As one of the most frequent human activities among rural land types, homesteads present fragmented distribution, lack of planning and inefficient utilization, which seriously hinder the sustainable development of rural areas [2]. In this context, countries have started to carry out spatial governance of rural territories by means of spatial planning [3,4]. The moderate agglomeration of homesteads refers to the centralized layout of scattered, inefficiently utilized or geologically disaster-prone homesteads [5], which can improve the level of economical and intensive utilization, the spatial structure of rural settlements and the human living environment [6], and is an important way to optimize and reconstruct the rural settlement space [7,8], as well as one of the effective means to alleviate the contradiction between the inefficient utilization of rural land and urban and rural land supply [9,10,11]. Some scholars have proposed that it is appropriate to gather homesteads in extremely scattered poor mountainous areas [12]. According to the American scholar Gonzalez [13], habitat fragmentation is highest when home sites are dispersed, and agglomeration development has ecological advantages. Many countries have also taken this measure to avoid the decline of rural areas and to deal with rural homestead fragmentation. Key settlement construction or settlement rationalization projects have been implemented in countries such as Norway, Japan, Thailand, Tanzania, and the United States [14,15,16,17]. The Dutch government has also adopted corresponding means to avoid the sporadic distribution of rural house sites [18]. In order to promote the rural revitalization strategy, the Chinese government has extensively carried out comprehensive rural land improvement projects [19], repeatedly emphasizing and actively guiding and promoting the agglomeration of rural homesteads, requiring rural settlement sites to be categorized and promoted according to four types: clustering and upgrading, suburban integration, characteristic protection and relocation and withdrawal, and encouraging the economical and intensive use of residential bases.
However, homestead agglomeration is a complex project that is subject to the combined effects of natural conditions, socioeconomics and culture [20,21]. The natural resource background, topography, dominant function, settlement culture and economic development level vary from region to region, and the demand for homestead agglomeration, site selection characteristics and the ease of implementation also differ. At the level of farmers, their willingness to participate has an important impact on the smooth implementation of the policy. Farmers’ willingness to agglomerate homesteads is a choice made by farmers after judging the current situation of family life, considering their own needs and the possible impact of agglomeration, which is influenced by both subjective and objective factors [22]. Public participation mechanisms are now emphasized in territorial spatial planning around the world, and in Europe, formal institutions have been established to collect residents’ opinions and views [23,24], which shows that public opinion is an important element in the implementation of spatial planning. Under the background of the special land system in rural China, farmers, as the basic unit of residential land assembly and the decision makers, determine the quality and direction of the economical and intensive use of residential land in rural China by the level of their willingness and demands for agglomeration [25]. Therefore, it is important to understand the intention of farmers to agglomerate for the effective implementation of homestead agglomeration [5]. Existing studies on farmers’ willingness to make decisions about their homesteads have mainly discussed the factors influencing the willingness to quit and transfer their homesteads and their driving mechanisms [2,22,26,27], suggesting that household economy, living environment, social interactions, policies to support and benefit farmers, employment distribution and livelihood strategies affect farmers’ decision making willingness. The research on the willingness to agglomerate homesteads is relatively lacking, but due to the importance of homestead assembly work, farmers’ willingness to agglomerate and the influencing factors should also become the focus of current rural geography research. At present, some scholars believe that farmers’ posterior livelihood sources and their income changes, living conditions, neighborhood relations and social status perceptions are important driving mechanisms for the formation of farmers’ intention of homestead agglomeration [5,25]. From the perspective of symbiosis, other scholars believe that the decision factor of agglomeration shifts along the direction of “survival-economic development-psychosocial” [28]. In terms of research methods, the PRA method [29] and questionnaires [30,31] are currently used for data collection, while logistic model [32,33,34], probit model [35,36], Double-Hurdle model [37] and linear regression [38] are employed for correlation analysis, where the logistic regression model is the ideal model for analyzing micro-individual intentions and is suitable for regression analysis, where the explanatory variable is a categorical variable.
Since there is an interrelationship between farmers’ livelihoods and rural land use, the improvement of rural house sites based on livelihood characteristics is conducive to the reconfiguration of rural territorial sustainability [39]. Moreover, the level of livelihood vulnerability, i.e., whether farmers are prone to exhibit instability and vulnerability to losses after shocks [40], affects farmers’ behavioral choices [41,42], reflecting a correlation between farmers’ livelihood vulnerability and farmers’ willingness to cluster their homesteads. Therefore, the study on the intention of homestead agglomeration can be attempted from the perspective of farmers’ livelihood vulnerability. The current research on livelihood vulnerability of farmers focuses on the establishment of the concept of livelihood vulnerability, the formation of an analytical framework and the construction of a system of indicators to measure the impact of different shocks (e.g., climate fluctuations, changes in market demand, land loss, etc.) [43,44,45]. Livelihood vulnerability analysis frameworks are divided into two main types of mainstream analytical frameworks, one based on the vulnerability environment, livelihood capital and adaptive capacity, which is integrated into the DFID sustainable livelihoods framework [46], and the other based on the “exposure-sensitivity-adaptability” framework proposed by the Intergovernmental Panel on Climate Change (IPCC) [47,48]. A number of scholars have also proposed other analytical frameworks [49,50], and they have selected indicators for evaluation based on their understanding of the framework and differences in the characteristics of the research subjects [51] and have analyzed their influencing factors and corresponding strategies [52,53]. Existing studies are rich in evaluation methods, including the functional model method [54], the integrated index method [55], the participatory rural appraisal (PRA) method [44], the entropy TOPSIS method [56] and the BP network simulation method for evaluation [57], but the main ones are the functional model method and the integrated index method.
In general, most studies have focused on the factors influencing farmers’ livelihood vulnerability, but fewer studies have investigated the behavioral decisions of farmers in the context of livelihood vulnerability and the impact of livelihood vulnerability on the development of rural settlements, especially in the area of intention to agglomerate homestead, which needs to be deepened. In view of this, this paper studies farmers’ intention of homestead agglomeration from the perspective of farmers’ livelihoods, so as to adopt precise policies for farmers with different livelihood vulnerabilities. The brief structure of the study is as follows: (1) to construct a theoretical analysis framework and a livelihood vulnerability evaluation system; (2) to evaluate the livelihood vulnerability of the sample farmers and analyze the current situation of different types of farmers’ intention to agglomerate their homesteads and their livelihood vulnerability characteristics; (3) to analyze the impact of livelihood vulnerability on farmers’ intention to agglomerate their homesteads through a binary logistic regression model, so as to provide a reference and basis for the formulation of related spatial optimization and residential land consolidation policies.

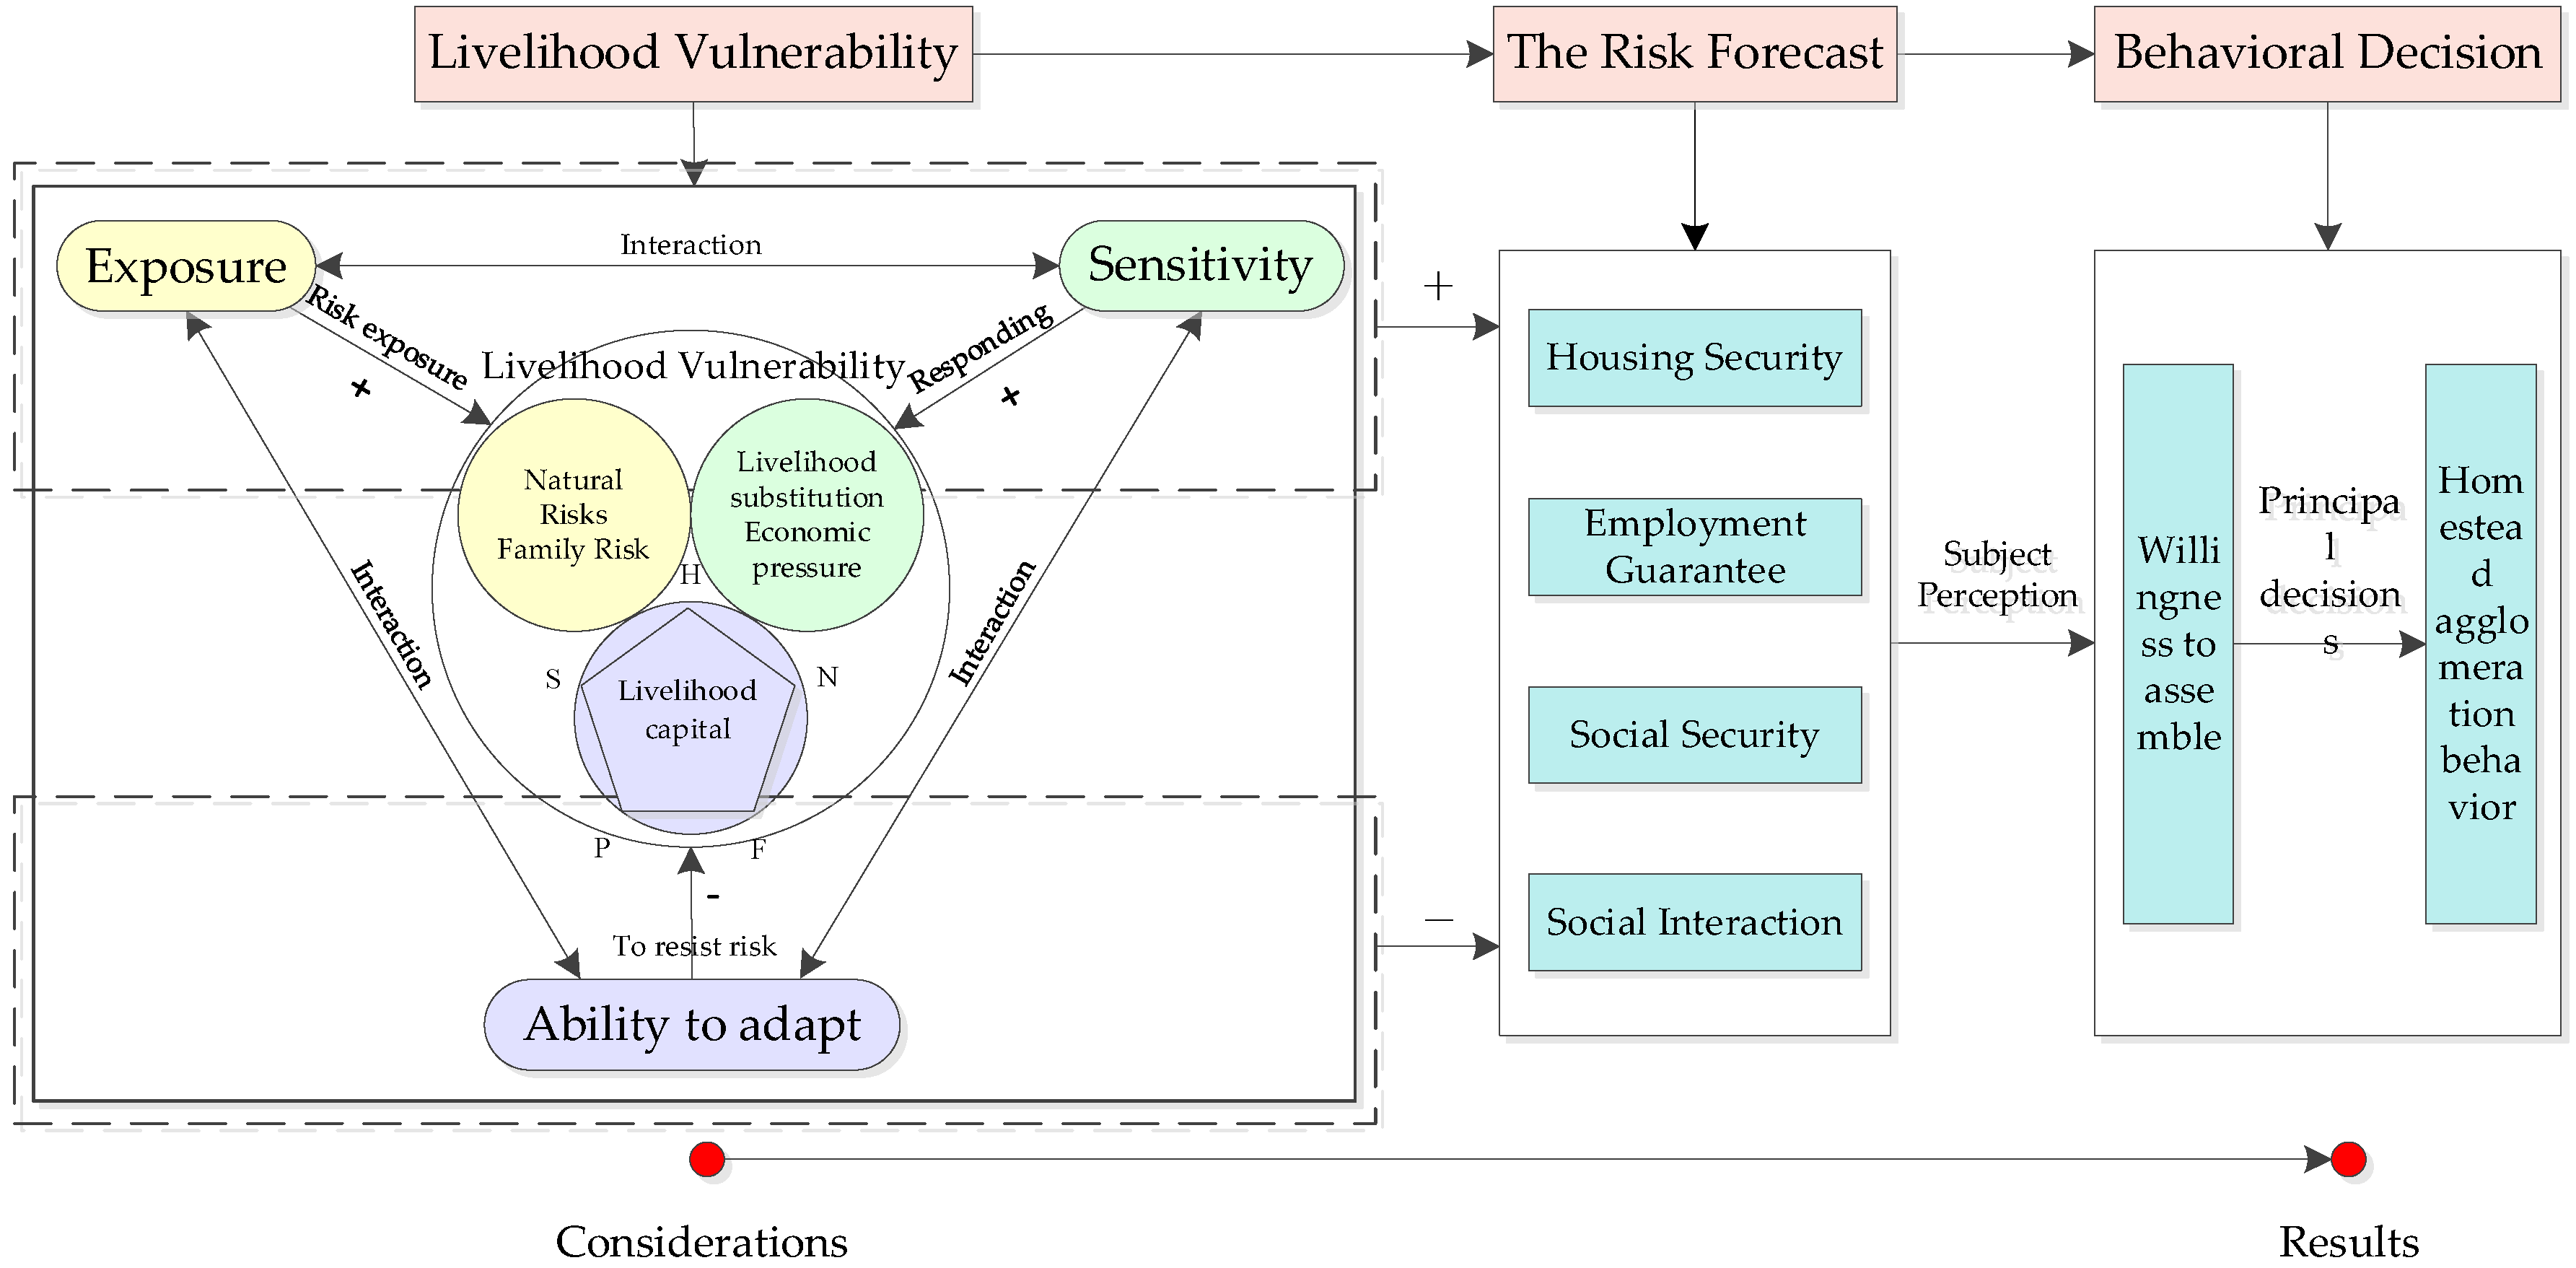
2. Theoretical Framework

Farm household livelihood vulnerability refers to the instability and vulnerability to loss that households or individuals exhibit in their livelihood activities due to changes or shocks in their livelihood structures [45,58,59]. In response to the characteristics and requirements of rural revitalization and rural settlement reconstruction, livelihood vulnerability assessments of farm households focus more on the measurement of farm households’ livelihoods and production. Homestead agglomeration behavior is one of the many important parts of the livelihood decisions of farming households. Farmers’ willingness to change their current situation of land assembly requires them to weigh the benefits, costs and risks [60]. Even under the influence of the same policy of land assembly, farmers with different levels of livelihood vulnerability face different types and intensities of risks and have different risk expectations, risk mitigation and adaptive capacity, which further generates differential responses in terms of willingness to agglomerate around residential land. Thus, the livelihood situation of farmers will influence the way they use their homesteads [51,61] and their various decisions on land use, which in turn will determine whether their homesteads will develop in the direction of agglomeration.
This paper describes livelihood vulnerability in terms of three dimensions: exposure, sensitivity and adaptive capacity. Exposure refers to the degree of impact of livelihood risks that farm households may be exposed to in their productive lives, including potential threats from both natural and household risks [49,62]. Sensitivity refers to the nature of ease of perception in the face of risk perturbations [35], i.e., the sensitivity of farm households to constraints affecting livelihood development in the face of the process of homestead agglomeration, the state of ease of loss, which is mainly evaluated in terms of the number of livelihood alternatives, and economic pressure [63].The higher the sensitivity of a farmer is, the greater the probability that the farmer is vulnerable to risk disruption. Adaptive capacity refers to the ability of farm households to withstand risks when faced with stress and risks with the resources they have [64]. The selection of indicators for adaptive capacity is usually based on the five major livelihood capitals of the DFID Sustainable Livelihoods (SL) analytical framework, i.e., the five aspects of human, natural, physical, financial and social capital to evaluate the adaptive capacity of farm households in the face of risk [65].
The impact of livelihood vulnerability on farmers’ willingness to cluster around their homesteads is mainly in terms of risk expectations and behavioral decisions (Figure 1). The level of livelihood vulnerability affects farmers’ expectations of the risks they may face. The level of exposure tends to determine the risk to farmers’ livelihoods, while sensitivity is measured by how farmers react when faced with external risks, both of which are expressed in terms of the external shocks that farmers may face in the process of home base assembly and the amount of pressure they bear when exposed to external shocks. When farmers have higher exposure and sensitivity, they are more affected by the external environment and will bear more pressure, which leads to higher risk expectations and the choice of risk avoidance or more prudent behavioral decisions. In contrast, when farmers have increased adaptive capacity, the livelihood system will form more effective ways of coping and adaptive management under external perturbations or internal pressures, resulting in farmers having greater tolerance under the same risk expectations, as well as more positive perceptions of their household livelihood situation, and being able to choose behavioral decisions with a certain level of risk, thus effectively stimulating their willingness to cluster their homesteads.
Therefore, it is clear that when farmers’ livelihood systems are less exposed, are less sensitive or have a greater capacity to adapt, they are less likely to be attacked, are able to sustain themselves in the long term under threatening pressure and are more likely to make decisions to change the status quo without regard to state subsidy policies.

3. Study Area Selection and Data Sources
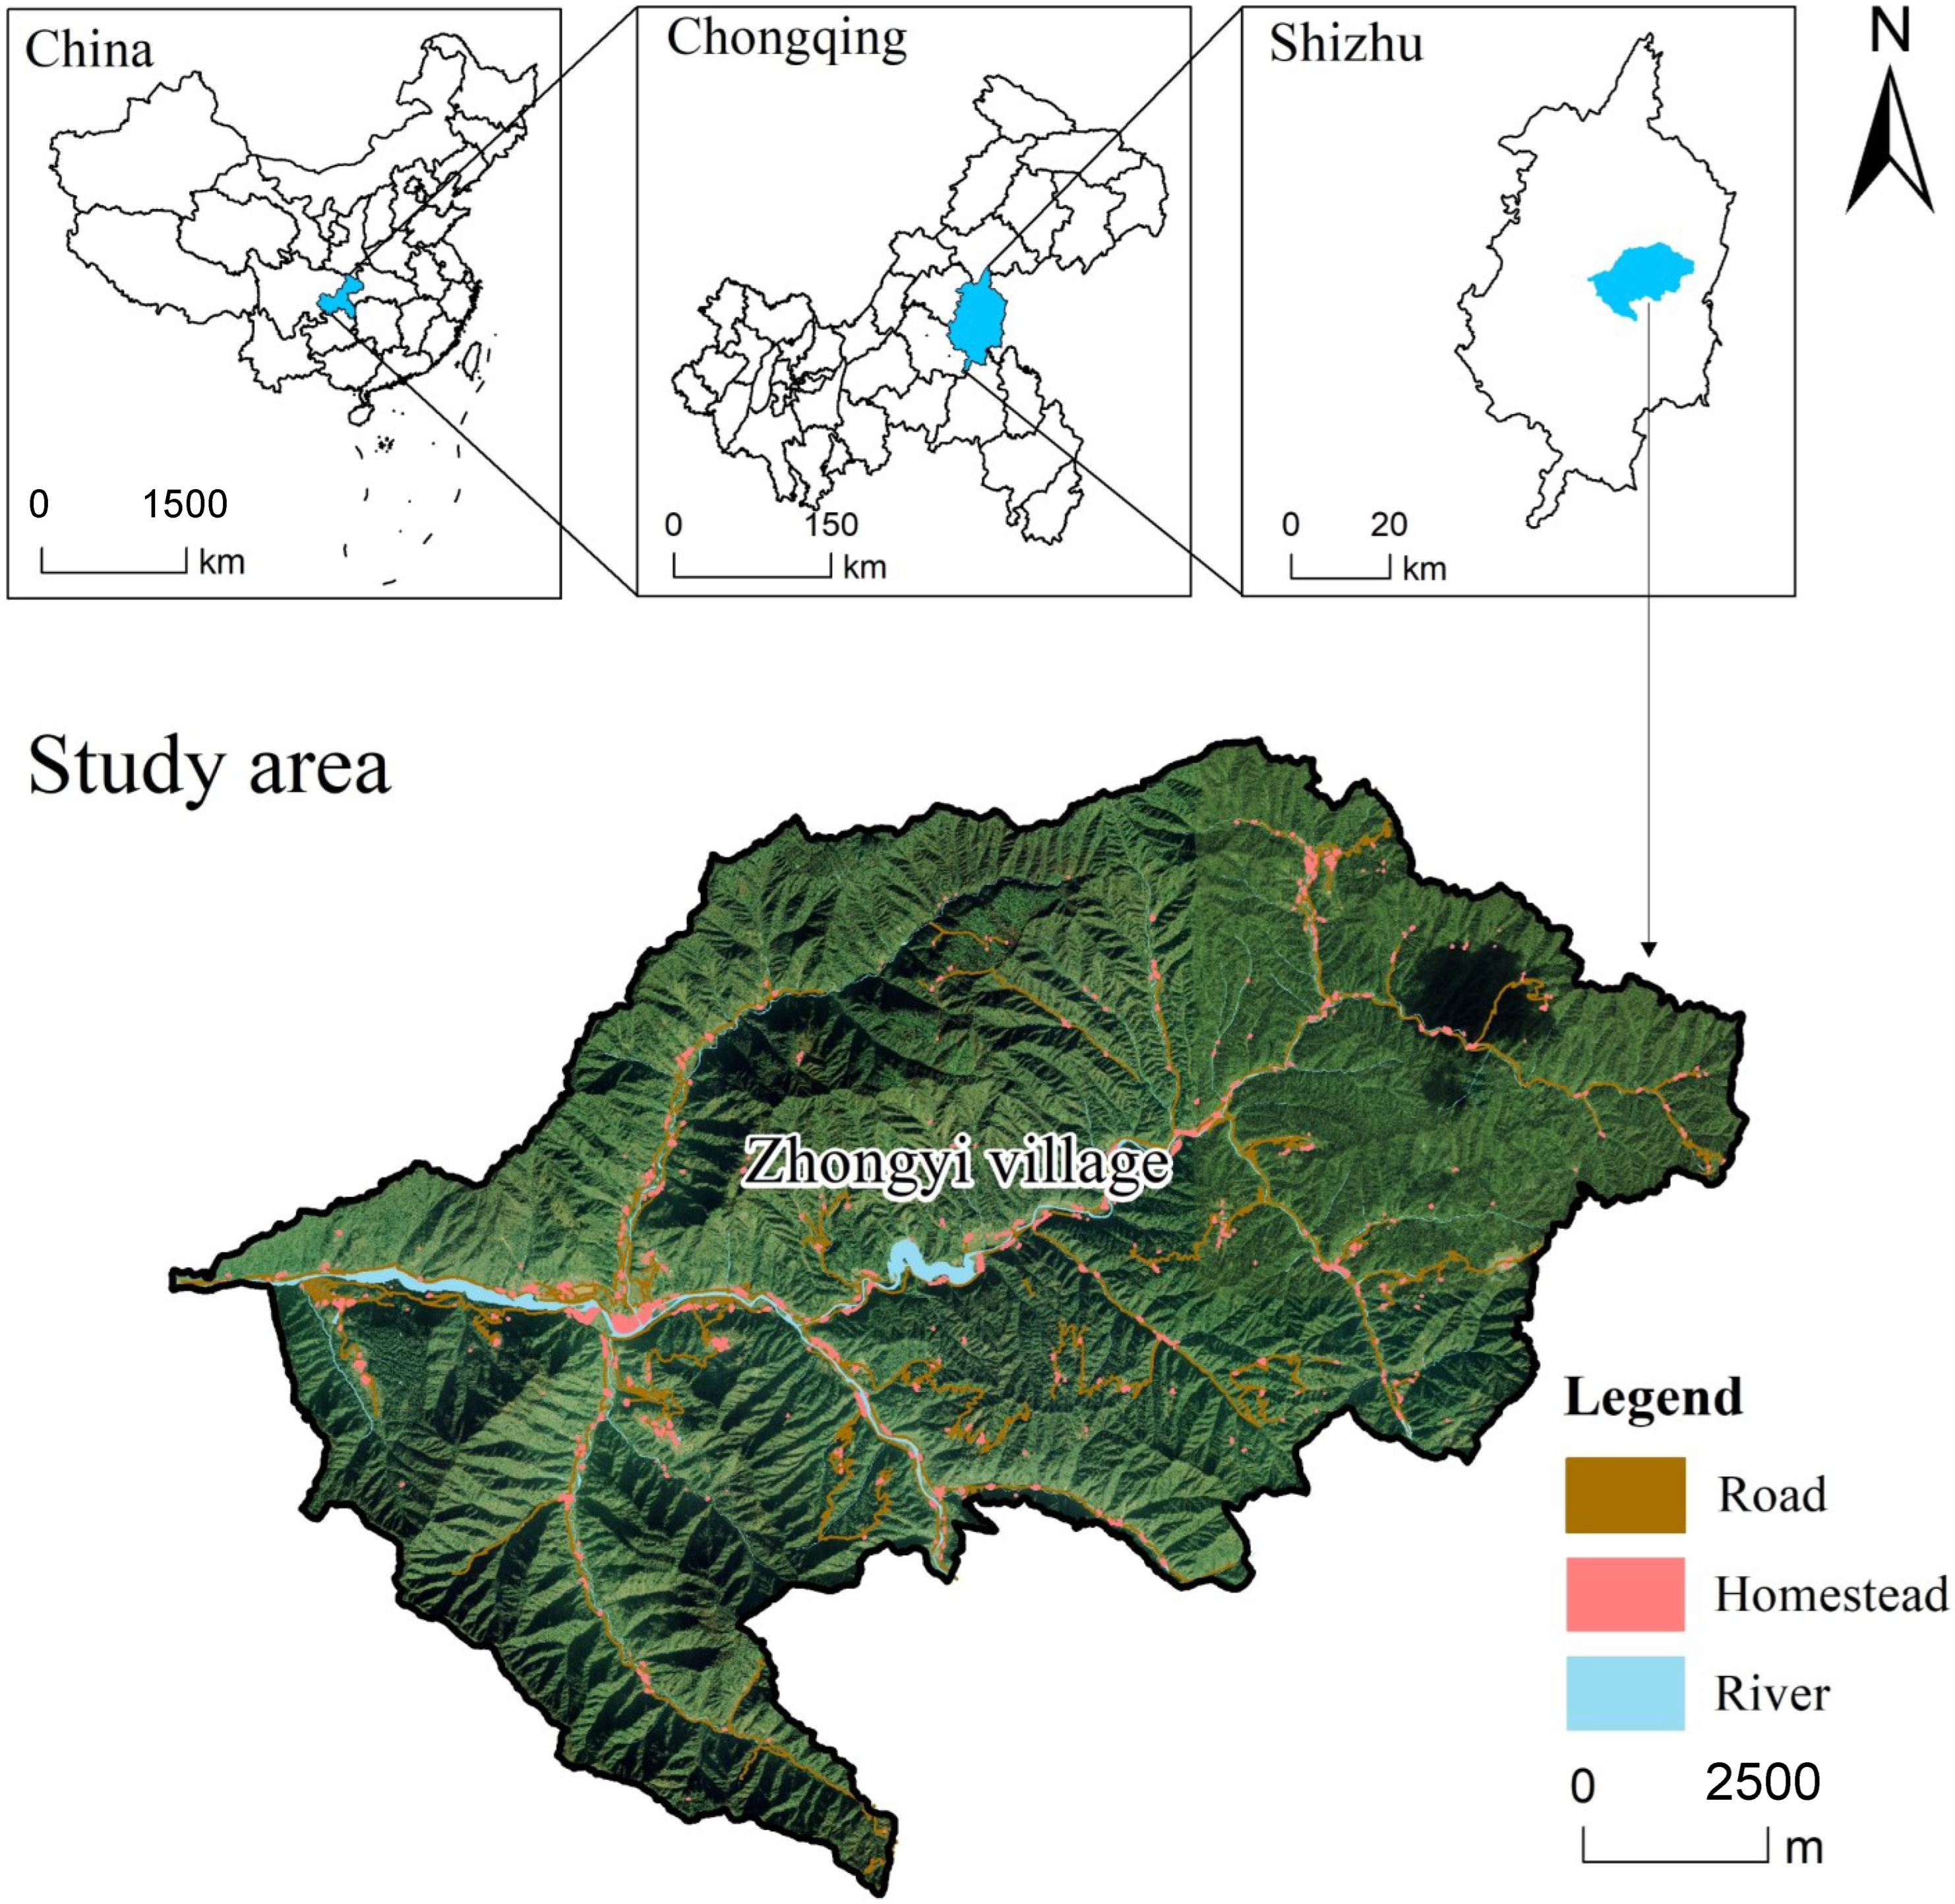
3.1. Case Selection

The selection of a suitable township as a case area is a prerequisite to ensure the smooth conduct of the empirical study. For the case area selection, this paper mainly takes into account the following aspects: (1) The urgency of moderate agglomeration of homesteads caused by topographical and geomorphological conditions. As the township settlement space in mountainous areas is more restricted by topography, geological conditions and traffic, the spatial layout of historically formed settlements is extremely scattered more obviously, and there is an urgent need for moderate agglomeration of homesteads. (2) China’s countryside is in a critical period of poverty eradication to rural revitalization, of which the moderate clustering of residential bases is an important element, and the selection of relevant demonstration towns has a good policy advantage, propaganda base and practice foundation. (3) Clear development orientation. The livelihood of farmers in townships with integrated industrial development is more typical and in line with the mainstream trend of most rural development. At present, most townships have integrated the development of one, two, three industries as the development direction, which leads to the transformation of farmers’ livelihood capital and strategies. The overall situation of farmers’ livelihoods shows that farming is reduced, labor is increased and service industries such as B&B and farm caravans are gradually emerging, and thus, the vulnerability of farmers’ livelihoods also changes accordingly. (4) Full consideration was given to the team’s existing projects and the basis of cooperation with the local area, which facilitated access to villages and households for in-depth research. Based on the above screening conditions, Zhongyi Township in Shizhu County was selected as the research case for this paper (Figure 2).
Zhongyi Township is located in the middle of Shizhu County, 40 km away from Shizhu County. It used to be one of the 18 deeply impoverished townships in Chongqing, and now it has completed part of the work of home base gathering, and is a key township to consolidate and expand the effective connection between poverty alleviation and rural revitalization. The terrain is mainly mountainous, with high mountains and steep slopes, the elevation is between 777~1892 m, and the slope is between 0~67°. The climate is moderate, with abundant rainfall and four distinct seasons. In total, 49.8% of the area is located in the Dafengbao Nature Reserve.
Zhongyi Township covers an area of 160 km2, under the jurisdiction of 7 administrative villages, 34 village groups. In 2020, the township registered a population of 8249 people, a resident population of 4658 people, of which 1600 people in the Zhongyi Township field town and 1000 people in the Guantian field town, and a resident population urbanization rate of about 56%. At present, a large number of farmers in Zhongyi Township go out to work, and the farming conditions of local farmers have been improved, from only growing food to special economic crops, and the township has formed different types of industries, mainly planting and breeding, agricultural products processing and rural tourism, and the farmers’ livelihoods are more diverse.
Through the statistics on the rural house site map and the number of farm households in Zhongyi Township, it is found that the current clustering situation in Zhongyi Township is not strong, and the number of rural house sites with fewer than 5 households is the largest, i.e., 434, accounting for 83.95% of the total number of house sites in the township, among which the situation of 1 household in a site is the most common, i.e., 298, more than half of the total number of house sites in Zhongyi Township, reaching 68.66%. During our field research, we found that the scattering of residential bases in the area has caused problems in terms of difficult government infrastructure allocation, high cost of rural governance and inconvenient production procurement for farmers, and currently, the implementation of work related to the clustering of residential bases has been carried out in the area.

3.2. Questionnaire Design

The questionnaire was designed to focus on the following five sections. (1) The basic situation of farming households. The survey mainly covers the nature of the household, the members of the household, the education level and the occupation of the household and is used to assess the basic characteristics of the household and to classify the type of household. (2) The current living conditions of farm households. The survey covers the use of the farming household’s current residence, building structure, functional structure, property rights, rental and operation and safety risks. It is mainly used to reflect the adaptive capacity of farmers’ livelihoods. (3) Household economic income and expenditure. This includes the structure of household income and expenditure, and the data obtained are used to analyze the economic stress and financial capital of farming households, reflecting livelihood sensitivity and adaptive capacity. (4) Social interaction and living conditions, which is used to analyze the social capital of farm households. (5) The demand and willingness of farm households to assemble on residential land. This includes farmers’ satisfaction with their current housing situation, their willingness to cluster and their demand for clustering, which involve data on the control variables and explanatory variables in this paper.

3.3. Data Source and Pre-Processing

The data in this paper were obtained from a farm household study conducted in Zhongyi Township, Shizhu County, Chongqing in 2021. We used the Participatory Rural Appraisal (PRA) method [30] to obtain the required data by interviewing farm households with questionnaires through semi-structured interviews and mini-symposiums to understand their livelihood status and willingness to gather homesteads, with each household questionnaire controlled within 40 min. Simple random sampling method was used to determine the sample size of 226 households for the household interview work. After checking the authenticity and logic of the questionnaires with omission, misadjustment and obvious logical errors in the form of telephone call-back, and then eliminating invalid questionnaires that did not obtain effective verification, 211 valid questionnaires were finally collected, and the questionnaire efficiency rate reached 93.36%. The basic characteristics of the interviewed farmers are shown in Table 1.
In order to ensure the scientific validity of the questionnaire and data, this study conducted reliability and validity tests on 211 valid farmers’ questionnaires. The results showed that the overall reliability of the scale in this paper reached 0.742, and the reliability values of all five dimensions reached above 0.70, indicating that the reliability of the questionnaire is relatively good and meets the requirements of scientific research, and the KMO (Kaiser–Meyer–Olkin) value of the data reached 0.822 (greater than 0.5), while the Bartlett’s sphericity significance was greater than 95% (p < 0.05), indicating that factor analysis can be performed. Further extracting the common factor variance of the five question dimensions, the results showed that the variance of the question items in all dimensions was greater than 0.5 and concentrated around 0.7, which again confirmed the validity of the questionnaire.

4. Materials and Methods

4.1. Indicator System Construction

In this paper, we first determine the analysis framework, then select the relevant indicators, and finally assign the indicators, so as to construct the livelihood vulnerability evaluation index system. Currently, the Exposure-Sensitivity-Adaptive Capacity (ESAC) is the most widely used framework for livelihood vulnerability analysis [66], allowing for a top-down analysis of the risks, stresses and resilience of farmers’ livelihoods. Specific indicators are added or subtracted depending on the research question. Therefore, this paper regards farmers as livelihood subjects in the specific sensitive and fragile period of poverty alleviation and Rural Revitalization. Based on the above analysis of the connotation of farmers’ livelihood vulnerability, drawing on existing research results [40,67,68,69], and considering the availability of data, this paper selects indicators from the three dimensions of exposure, sensitivity and adaptive capacity, and initially constructs a livelihood vulnerability evaluation index system applicable to the region. Then, SPSS24 was used to conduct Pearson correlation analysis and cross-tabulation analysis on the preliminary indicators of the same dimension, and only one indicator with a strong and significant correlation was retained. Finally, 26 indicators were screened out from the 35 indicators in the questionnaire. At the same time, the indicators were standardized using the extreme value method and assigned using the entropy method, and finally, a comprehensive livelihood vulnerability evaluation index system was constructed (Table 2) to quantitatively assess the livelihood vulnerability of farmers.

4.2. Livelihood Vulnerability Index (LVI)

LVI is an index formed based on the concept of vulnerability [59,65]; in this paper, the livelihood vulnerability index (LVI) of each household is calculated using a composite index assessment model [59], which is calculated as follows:
LVI 1 = E + S A
LVI 2 = E A * S
where E is livelihood exposure, S is livelihood sensitivity and A is livelihood adaptive capacity. A higher LVI value indicates a higher vulnerability of the farm household. A negative LVI indicates that household livelihood vulnerability is low and livelihood adaptive capacity is greater than livelihood risk.

4.3. The Impact Model of Farmers’ Livelihood Vulnerability on Their Homestead Agglomeration Willingness

4.3.1. Model Setup

In this paper, we need to analyze the impact of farmers’ livelihood vulnerability on their willingness to cluster their homesteads. The explanatory variable is the willingness to cluster, which meets the nature and characteristics of the binomial distribution, so we use binary logistic regression to build a mathematical model. The regression analysis model is constructed by taking the probability of occurrence P of the explanatory variable y = 1 as the dependent variable.
The binary logistic model is used for the regression analysis of farm households’ willingness to cluster their homesteads from each level of the Livelihood Vulnerability Assessment Indicator System and is used to study the impact is formulated as follows:
P = e x p ( β 0 + β 1 x 1 + + β n x n ) 1 + e x p ( β 0 + β 1 x 1 + + β n x n )
1 P = 1 1 + exp ( β 0 + β 1 x 1 + + β n x n )
where P is the probability that the farmer in the study area is willing to cluster; if P > 0.5, the farmer is willing to cluster, otherwise they are not. The logistic transformation of P, denoted as logit P , leads to the following transformed equation:
logit P = ln ( P / ( 1 P ) ) = β 0 + β 1 x 1 + + β n x n
where β 0 is a constant term, indicating that when the independent variable takes all values of 0, the dependent variable ln ( P / ( 1 P ) ) has no analytical significance when the value of the dependent variable is zero, x j is the independent variable and β 0 , , β n are the estimated coefficients, which indicates the x j the contribution to P. When the independent variable x j increases by 1 unit, the dependent variable increases by β j of one unit.

4.3.2. Selection of Variables

(1)
Explained variable
The aim of this study is to analyze the willingness of settlements to cluster and the factors influencing it. In the questionnaire, the question was set as “Are you willing to agglomerate on residential land”. Of the 211 questionnaires surveyed, 49.77% (105) of the farmers were willing to cluster and 50.23% (106) were not willing to cluster.
(2)
Explanatory variables
The willingness of farm households to cluster around their homesteads was first modeled by regressing livelihood vulnerability ( LVI ) as the independent variable:
logit P = ln ( P / ( 1 P ) ) = β 0 + β 1 LVI
Livelihood vulnerability is then decomposed, and the willingness of farmers to cluster their homesteads is regressed on three dimensions, i.e., exposure, sensitivity and adaptive capacity, to create a model:
logit P = ln ( P / ( 1 P ) ) = β 0 + β 1 E + β 2 S + β 3 A
(3)
Control variables
Studies have been conducted to investigate the factors influencing farmers’ willingness to agglomerate their homesteads, and it has been suggested that personal and family characteristics, house utilization, infrastructure environment and individual subjective perceptions are all factors influencing farmers’ willingness to agglomerate their homesteads [5]. In order to avoid endogeneity problems caused by omitted variables, this paper summarizes the control variables into five aspects: ① Household nature ( x 1 ). Generally speaking, the degree of family hardship will influence farmers’ demand for housing and their behavioral decisions [70]. ② The presence or absence of business rentals ( x 2 ). In the context of the emerging rural tourism, the utilization of the house base such as business rental will influence the judgment of farm households on the homestead decision at this stage [30]. ③ Satisfaction with the living conditions of the homestead ( x 3 ). Farmers’ perceptions of the living environment of their homesteads largely influence their behavioral decisions regarding their homesteads, and when farmers are extremely dissatisfied with their current living conditions, the stronger their desire to make changes [71]. ④ Satisfaction with the scale of settlement on the housing site ( x 4 ). Farmers’ satisfaction with the current situation of residential land assembly directly reflects the farmers’ demand for residential land assembly [5]. ⑤ The use status of the homestead ( x 5 ). The higher the degree of idleness, the weaker the dependence on rural land resources and the stronger the willingness to cluster [72]. Among them, x 1 is divided into four categories, namely, low-income households, households out of poverty, households with five guarantees and general farming households. Moreover, x 5 is divided into four categories: normal use, partial idleness, seasonal idleness and perennial idleness. Because of the unified management aspects such as government subsidies, which are generally consistent within the same commune, they are not included in the control variables.

5. Results

5.1. The Current Situation of Divided Livelihood Vulnerability and Willingness of Farm Households to Agglomerate around Their Homesteads

Livelihood exposure, sensitivity and adaptive capacity were calculated for each of the 211 farm households according to Table 1, leading to the calculation of livelihood vulnerability results for each household according to Equation (1) (Figure 3).
From the fitting trend of the normal distribution, the livelihood vulnerability index of farm households in Zhongyi Township, Shizhu County, is in line with the normal distribution. Regarding the total value of livelihood vulnerability, the vast majority of farm households were in the medium and low livelihood vulnerability levels, with a difference of 0.980 between the maximum and minimum values. The low livelihood vulnerability levels accounted for 9.00% of the total number of farm households, and the high livelihood vulnerability levels accounted for 13.74% of the total number of farm households. The difference between the maximum and minimum values of farmers’ exposure is 0.073, the mean value (0.020) is greater than the median value (0.014), 40.76% of farmers’ livelihood exposure is greater than the mean value, as shown by the normal distribution curve, the normal distribution of farmers’ exposure is poorly fitted and the distribution of the calculated results is more scattered: 38.86% of farmers’ livelihood exposure is less than 0.010, while 31.75% of farmers’ livelihood is more than 0.010. The difference between the maximum and minimum values of farmers’ sensitivity is 0.042, and the mean value (0.012) is larger than the median value (0.009), and based on the fitting trend of normal distribution, farmers’ sensitivity is close to normal distribution, with 49.29% of farmers’ livelihood sensitivity being concentrated within 0.007~0.018. Farmers’ adaptive capacity varied widely, with the maximum and minimum values differing by 0.155, and the mean (0.080) was slightly larger than the median (0.078). More than half (52.61%) of the farmers’ livelihood adaptive capacity was below the mean, and based on the fitting trend of the normal distribution, the adaptive capacity was close to the normal distribution.

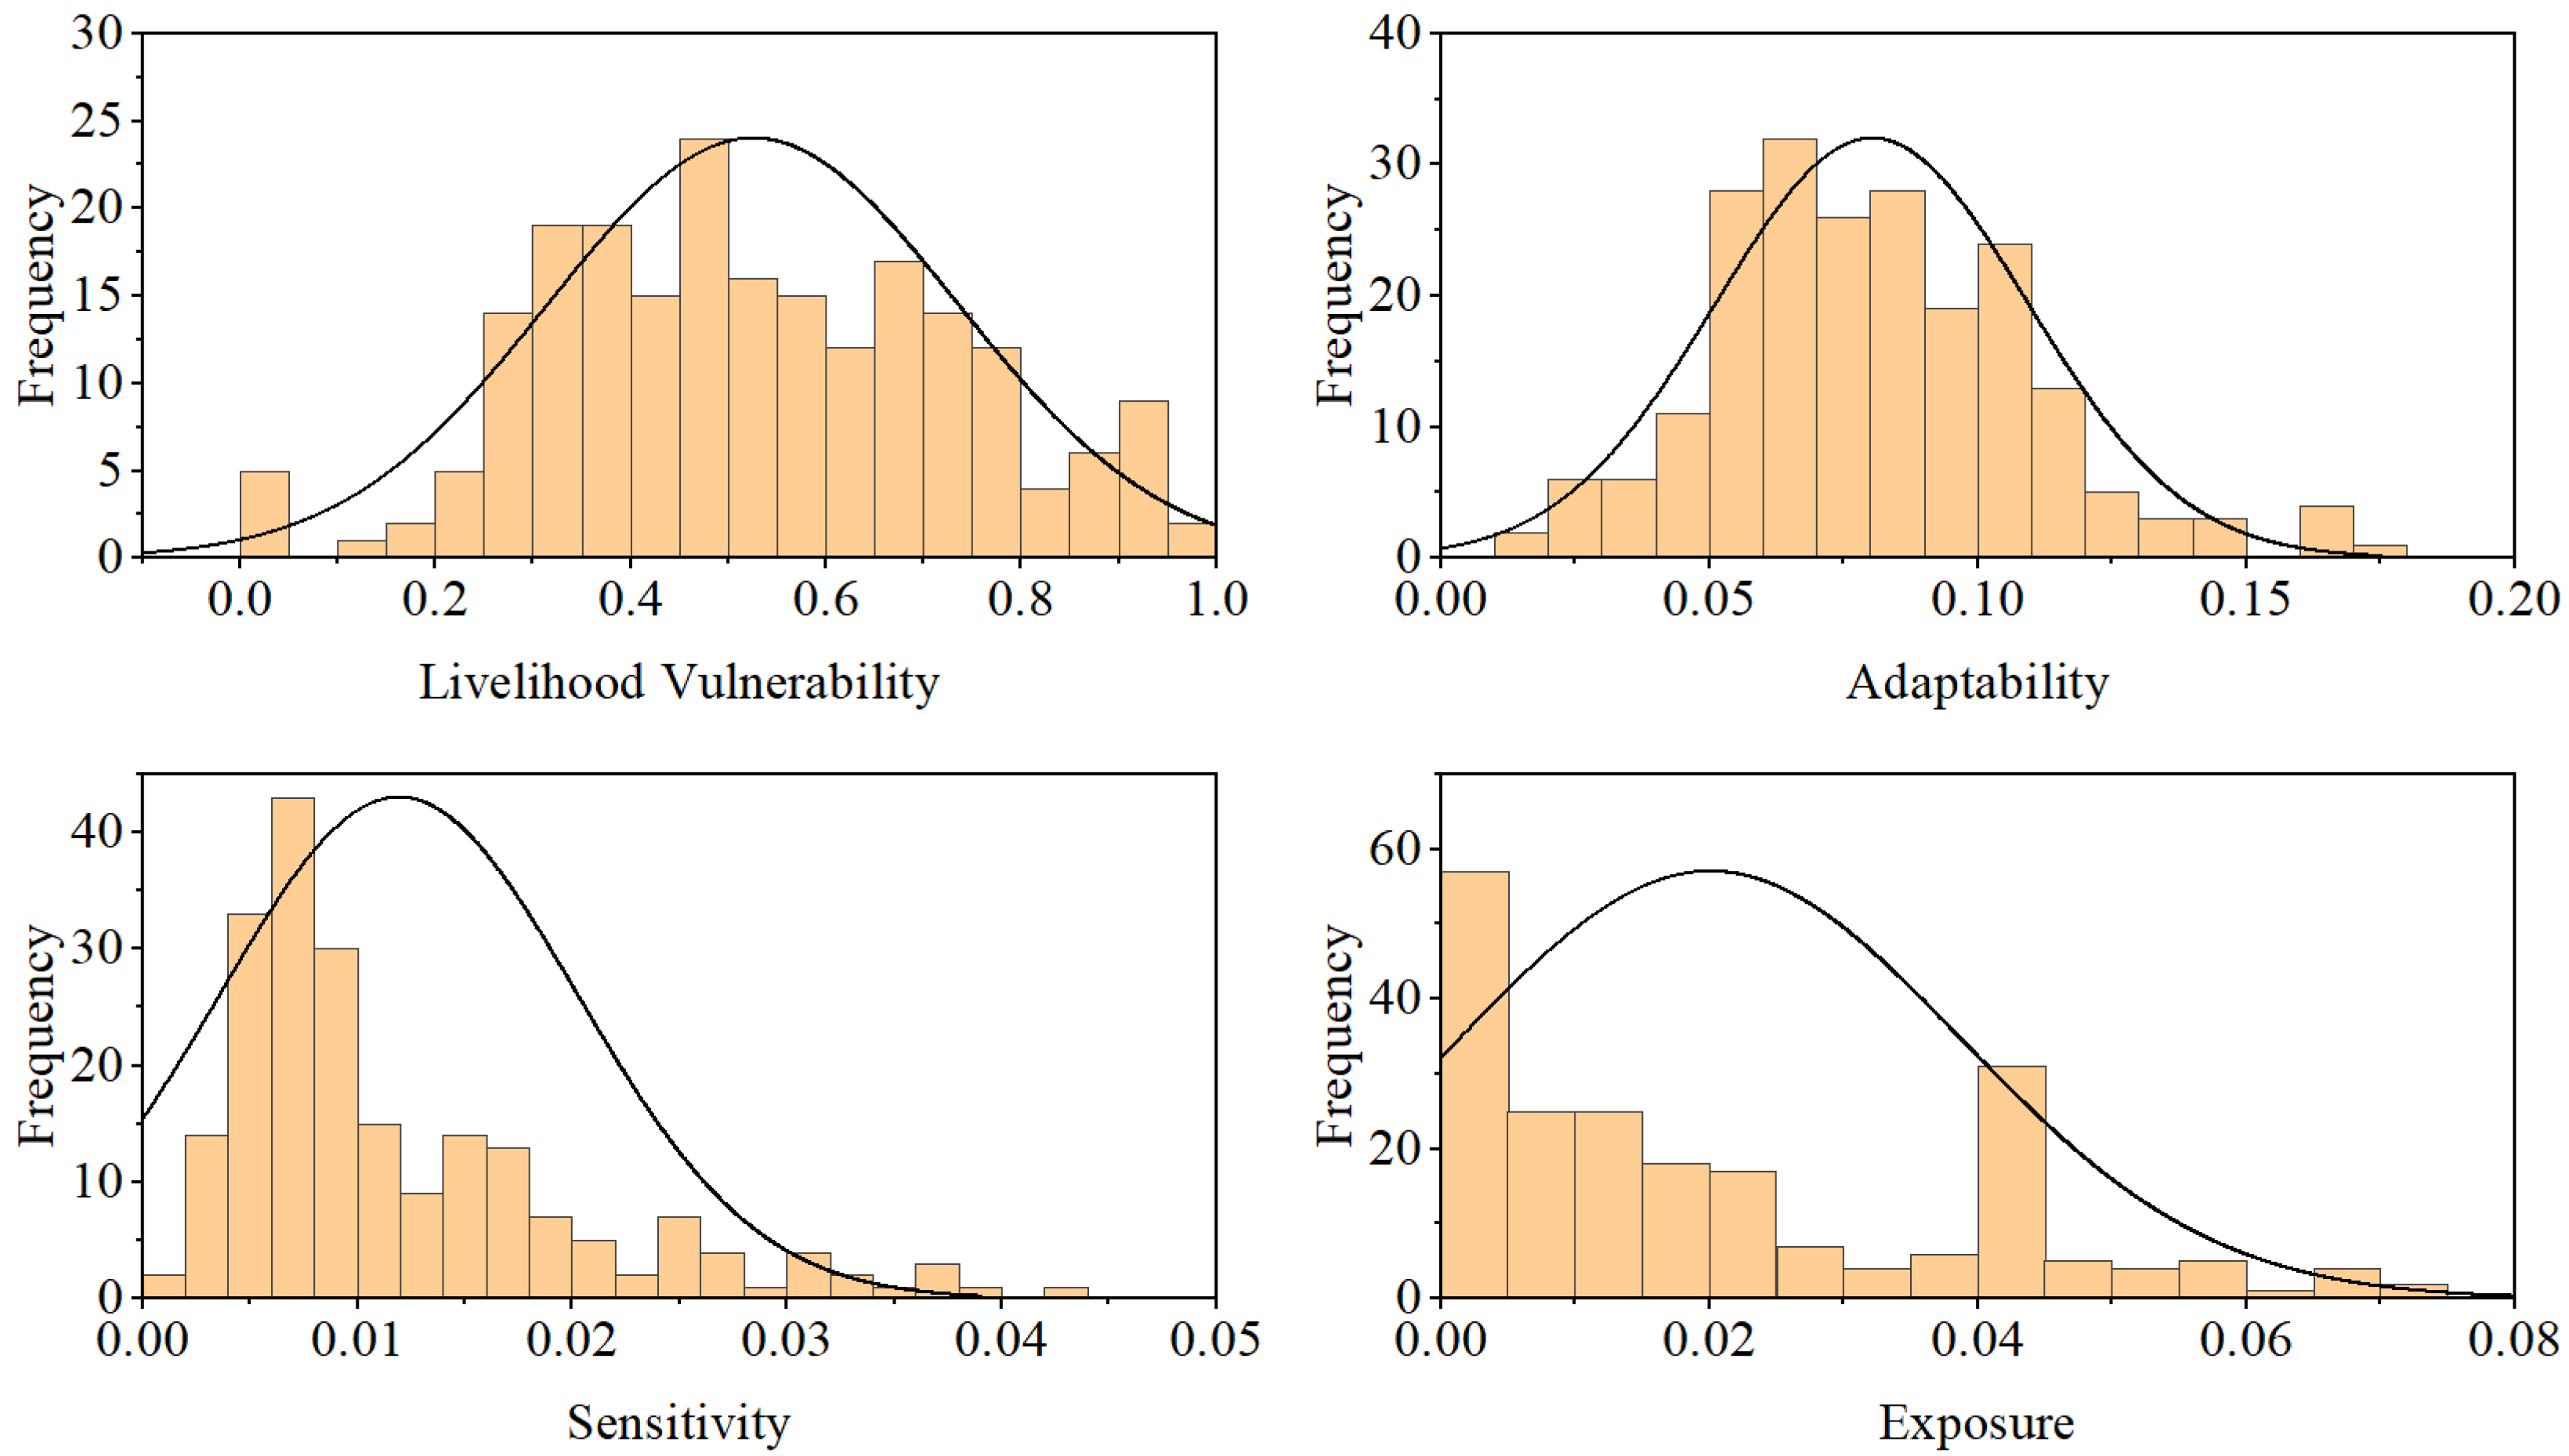
5.1.1. Status of Livelihood Vulnerability of Different Categories of Farm Households

Farmers’ own attributes are the basis for their decision making. Different categories of farmers have different considerations and emotional ties to the homestead; therefore, farmers make behavioral decisions. Based on the proportion of nonfarm income, farm households were classified into four livelihoods—pure, one part-time, two part-time and abandoned—according to less than 50%, 50–90%, 90–100% and 100% [69], and the current livelihood vulnerability of farmers with different livelihoods was described (Table 3). It was found that the livelihood vulnerability of part-time households is lower, where the high livelihood vulnerability of pure farmers is mainly due to their higher exposure, while the difference between the livelihood vulnerability of two part-time and abandoned farmers is lower, with the main difference being that abandoned farmers are much more sensitive than two part-time farmers.
The top 20%, middle 60% and bottom 20% were then classified as low-dependency, medium-dependency and high-dependency farming households according to the ratio of the nonworking age population to the working age population [40], and it was found that livelihood vulnerability was much higher for high-dependency farming households than for medium- and low-dependency farming households, indicating that the higher the dependency burden is, the higher the household livelihood vulnerability.
Based on the proportion of the number of people in the household with a high school education or higher in the household register, and based on the natural breakpoint method, households were classified as having a low level of education, a medium level of education and a high level of education. It was found that households with a low level of education had higher livelihood vulnerability, mainly because they were much more exposed and had less adaptive capacity than farming households with a medium or high level of education.

5.1.2. Current Situation of Farmers’ Willingness to Cluster Their Homesteads

(1)
Two part-time and abandoned farm households are more willing to cluster
Based on the results of the questionnaire (Table 4), it is found that there is a small difference in the willingness to agglomerate among farmers with different livelihoods, with more than half of the households willing to agglomerate in the two categories of two-part time and abandoned farmers, while pure farmers and one part-time farmers are less willing to agglomerate. Meanwhile, the analysis of the current livelihood vulnerability of farmers in the previous section shows that for farmers with different livelihoods, low livelihood vulnerability is more likely to lead to a willingness to agglomerate.
(2)
Low percentage of farmers with a high dependency ratio willing to agglomerate
Under different dependency ratios, the proportion of willingness to cluster is low, with medium and high dependency ratios in descending order, indicating that the higher the dependency burden is, the more farmers tend to be reluctant to cluster; furthermore, as seen above, livelihood vulnerability has high, medium and low dependency ratios in descending order; thus, under different dependency ratios, the higher the livelihood vulnerability is, the more the tendency or reluctance to cluster. Moreover, the higher the dependency ratio is, the greater the tendency or reluctance to cluster.
(3)
The higher the level of education, the greater the share of willingness to agglomerate
The willingness to cluster has a descending order of higher, middle and lower levels of education. It is also clear that households with medium and high levels of education are more likely to make the choice to cluster. Combined with their livelihood vulnerability, it is again found that households with low livelihood vulnerability are more likely to be willing to agglomerate. Therefore, this paper examines the impact of farmers’ livelihood vulnerability on their willingness to cluster around residential land.

5.2. Impact of Livelihood Vulnerability on the Willingness to Cluster around Homesteads

The causality of livelihood vulnerability affecting farm households’ willingness to cluster around their homesteads was tested by Equation (6), and the results of the full sample regression are shown in Table 5.

5.2.1. Full Sample Test for Livelihood Vulnerability Index

The regression results of the impact of the livelihood vulnerability index on the willingness of farmers to cluster their homesteads show that the core variable livelihood vulnerability is significantly negative at the 1% level, with a coefficient of −4.393, indicating that the livelihood vulnerability index is negatively related to farmers’ willingness to cluster. The higher the livelihood vulnerability of farmers is, the more unstable their livelihood system is, the more vulnerable they are to external environmental changes and the greater the risks they are likely to take. The coefficient of farmers’ overall satisfaction with their current housing situation is significantly negative at the 1% level, suggesting that as overall satisfaction with their housing situation increases, farmers’ willingness to cluster around their homesteads decreases. The coefficients on the nature of the household, the presence of a business/rental situation, satisfaction with the size of the current home base clustering and the state of use of the home base are negative but not significant.

5.2.2. Full Sample Test for Target Layer Dimensions

Regression analysis was done on the effect of target level dimensions, i.e., exposure, sensitivity and adaptability, on farmers’ willingness to agglomerate on their homesteads. From columns (2), (3) and (4) of Table 5, it can be seen that exposure has the most significant effect on farmers’ willingness to cluster on their homesteads, which is significantly negative at the 1% level with a coefficient of −0.792, indicating that livelihood exposure has a negative relationship with farmers’ willingness to cluster, and the higher the exposure, the lower farmers’ willingness to cluster on their homesteads; sensitivity results are significantly negative at the 5% level with a coefficient of −1.384, indicating that the regression result of adaptive capacity is significantly positive at the 1% level, in turn indicating that the adaptive capacity of farmers’ livelihoods is positively related to their willingness to cluster on their homesteads.

5.3. Robustness Tests

To ensure that the estimates are reliable, the paper also uses an alternative livelihood vulnerability index L V I 2 (Equation (2)), with risk sensitivity as a disturbance term, which is a proxy for robustness testing. Similarly, the willingness to cluster around residential land was tested as the explanatory variable, and the regression results are shown in Table 6. Column (6) is the regression result based on Column (5) with the addition of control variables.
The regression results in Table 6 show that the coefficient of livelihood vulnerability ( LVI 2 ) is still significantly negative and the regression results do not vary significantly, indicating that the results of the regression on livelihood vulnerability affecting farmers’ willingness to cluster around their homesteads are robust. In addition, the control variables show that farmers’ overall satisfaction with their current housing situation is significantly negative at the 10 percent level, indicating that farmers’ housing situation is negatively related to their willingness to live on their homesteads. In contrast, the coefficients of the four variables of household nature, the presence of business or rental status, satisfaction with the size of current homestead clustering and homestead use status are consistent with the sign of the results in Table 5, which suggests that an improvement in the above four indicators would somewhat dampen farmers’ willingness to cluster their homesteads, but the results are not significant.

6. Discussion

6.1. Impact of Farm Households’ Willingness to Cluster Their Homesteads

Farmers’ livelihood situation determines their land use decisions. In this study, the higher the livelihood vulnerability of farm households, the greater their risk expectations, resulting in weaker willingness to cluster homesteads. In the case of subjective rationality, farmers aim at maximizing benefits [30] and are more willing to reject the agglomeration of homesteads to avoid the perturbation of changes in the external environment, such as disputes over property rights, fairness of rights and interests, ease of living, time, economic costs and the mental costs of adapting to the new environment.
Farming households are mainly exposed to natural and household risks in their productive lives. When the household is more dependent on natural resources, the greater the probability of being threatened by natural disasters [73]; when the household has a smaller labor force and a higher degree of aging and insecurity in old age, it is more vulnerable to public health emergencies and socioeconomic downturns, and thus, the greater the degree of exposure to shocks emanating from livelihood risks. As a result, farming households prefer to reduce external disturbances and are reluctant to engage in homestead clustering. When farmers are exposed to risks, i.e., the lower the number of livelihood alternatives and the higher the economic pressure on daily consumption, children’s education, medical expenses and social interactions, the more susceptible farmers are to perturbations from homestead clustering. The more sensitive the farming household is, the more likely it is to suffer more stress and losses, and therefore, the more reluctant it is to engage in home base clustering from the perspective of the farming household’s short-term interests. In contrast, when farmers face the same household and natural livelihood risks and are subject to internal and external pressures, the stronger their adaptive capacity, the greater they are able to withstand external disturbances and internal pressures and the greater they are able to adapt to the changes brought about by homestead clustering. Therefore, without considering factors such as national policies, increased adaptive capacity is conducive to promoting homestead clustering among farmers.
(1)
The quality of human capital determines the choice of farm households’ livelihood approach [74], which in turn has an impact on the output of household livelihood outcomes. Combined with existing studies, it is known that when farm households have higher levels of education [75], they are relatively less dependent on land and more receptive to new environments: when the share of labor force is higher, household income sources are more stable and livelihood options are more likely; when household health per capita is higher, livelihood security is higher and household members are less likely to reduce their income sources due to illness; when the number of migrant workers is higher, household income is generally higher and their aspirations to the city and awareness of new things are higher. This supports the possibility of livelihood development for farming households.
(2)
Natural and physical capital can provide material security for farm households when their livelihoods are affected by shocks. When faced with shocks that affect the global socioeconomic development process such as the New Crown epidemic, and when most of the migrant workers are threatened by unemployment and return home, the more arable land area a farm household has, the richer its livestock capital and the better its housing structure, environment and infrastructure, the more it is able to secure food and shelter for the household, thus improving the farm household’s livelihood adaptation.
(3)
Financial capital is the reserve of funds at the disposal of farmers [37,74] and is directly linked to the livelihood situation of farm households, while reflecting their financial security capacity and standard of living. The amount of financial capital reflects the ability of farmers to generate income, and their access to subsidies. Farmers with sufficient financial capital have more money available for their own use, and thus, farmers with sufficient financial capital can take more risk and, in turn, have stronger livelihood adaptability.
(4)
Social capital refers mainly to the external support and help that farmers may receive and the external resources that they can use [63]. For one, when a farmer’s family works in a village committee, government or other unit, their ability to control news about their livelihood is higher. When a household faces a shock that leads to a lack of funds, farmers are more likely to choose to apply for state subsidies, loans and other different means; second, when there are better relationships between neighbors and relatives, there are more ways to seek help when a farmer faces difficulties. Thus, social capital can contribute to the improvement of farm households’ living standards.
While addressing the key questions, this paper also finds some other findings that corroborate the existing research results: the tendency of different types of farm households to cluster their homesteads shows different characteristics. There are differences in farmers’ homestead utilization decisions under different livelihood approaches [61]. In this study, when farmers’ income is more derived from farming, their daily food is mainly from their own cultivation, and their dependence on arable land is higher, their production demand is higher and their willingness to agglomerate is weaker. Yan, Y argued that family dependency ratio has an impact on farm households’ willingness to agglomerate [5]. In this study, when there are more elderly people in the household or the head of the household is older, traditional thinking is entrenched and there is a strong spiritual dependence on the homestead [76], which makes it difficult to influence their traditional land values, even if the benefits brought by homestead clustering are greater; when the burden of household support is higher, farmers prefer to reduce the risk, and thus, avoid the possible series of disturbances brought by homestead agglomeration. In addition, farmers with a high willingness to cluster their homesteads usually possess a high level of literacy [77]. Literacy level tends to increase the ability of farm households to accept new things, making them less influenced by traditional livelihood values and more likely to change the social stereotypes they hold. In this study, households with middle and higher education levels are less dependent on farmland and more receptive to new environments and changes, and thus, they have a tendency to cluster their homesteads.
In addition, factors that influence farmers’ behavioral decisions include human attitudes, which are behavioral attitudes displayed by a person’s perception of the state of something objective in terms of likes and dislikes. In this study, the regression results of household nature, the presence of business/rental, the perception of the current size of the residential site and the status of residential site use revealed that when the household is in difficulty, the farmers’ desire to change their current living conditions is stronger and even exceeds their prediction of risks; the better the household’s business or rental situation is, the more reluctant the household is to give up the current residential site. Therefore, the nature of the household, the existence of business/rental, the satisfaction with the current scale of residence, and the improvement of the status of residence use not only do not promote the willingness of farmers to gather their residence bases, but also inhibit the agglomeration enthusiasm. However, the above four aspects should not be suppressed in order to increase farmers’ willingness to agglomerate on their homesteads.

6.2. Policy Implications

At present, farmers’ livelihoods are still vulnerable to a certain extent, and reducing livelihood vulnerability is conducive to enhancing farmers’ willingness to cluster their homesteads. Accordingly, this paper proposes some possible policy suggestions to promote homestead agglomeration: (1) Diversification of livelihoods can reduce sensitivity and enhance the adaptive capacity. The government can guide farmers to shift their livelihoods to nonfarm employment by promoting pure farming on a large scale, facilitating the transfer of farmland to increase natural capital, providing technical guidance and financial support to increase the demand for expanding production or organizing technical training for farmers’ nonfarm employment, promoting diversification of farmers’ livelihood options and achieving occupational upgrading of household labor (e.g., operating B&Bs and farm caravans). (2) It is found that the livelihood vulnerability of households with high dependency ratio is higher under pressure. In addition to actively seeking beneficial agricultural policies, financial support and various protection services, the government can increase the publicity of beneficial agricultural policies, reduce information asymmetry in the work of homestead clustering and enhance farmers’ sense of social security and their ability to prevent livelihood risks in the process of homestead clustering. (3) Livelihood adaptability has a positive impact on the clustering of farmers’ homesteads, while human capital plays a decisive role in the growth of other household capital. In response to the low education level of the farm households studied, the government should vigorously strengthen the investment in rural basic education, such as teaching and popularizing skills and general knowledge to farm households with the help of online platforms, in order to provide security for their long-term livelihoods.

6.3. Limitations

This paper does not trace the layout of existing residential sites and neglects the analysis of the relationship between their evolutionary process and the willingness of farm households to agglomerate. For example, the location of settlements is categorized as declining, stable or growing to control for the impact of the distribution of existing housing sites on the intentions of farming households to agglomerate. In addition, it was found that farmers’ livelihoods and their perceptions of their homesteads are a reciprocal process and that farmers’ livelihood vulnerability and homestead agglomeration have an interactive and coupled potential relationship. The level of livelihood vulnerability will change farmers’ dependence on, and use and perception of their homesteads, thus affecting their willingness to agglomerate around their homesteads, while a change in the location of their homesteads will have a positive or negative impact on their livelihoods and production, which in turn will act on their livelihood vulnerability. This paper only focuses on the impact of livelihood vulnerability on the willingness to cluster on a home base, but does not analyze the interrelationship between the two; thus, a comprehensive account of the relationship between livelihood vulnerability and home base clustering is worthy of further study.

7. Conclusions

Based on the research data of 211 farm households in Zhongyi Township, Shizhu County, Chongqing, this paper evaluates the livelihood vulnerability of farm households and uses the binary logistic model to analyze the impact of livelihood vulnerability on farm households’ willingness to cluster their homesteads. The study shows that farmers’ livelihood vulnerability has a significant negative effect on their willingness to gather residential land. From the perspective of “exposure-sensitivity-adaptability”, exposure and sensitivity have a negative effect on farmers’ willingness of homestead agglomeration, while adaptability has a significant positive effect, which is mainly due to the high-risk expectation and weak social security brought by high livelihood vulnerability. Improving the livelihood vulnerability of farmers is conducive to promoting the willingness of homestead agglomeration. According to the characteristics of different groups of farmers, corresponding measures can be taken to reduce the exposure and sensitivity of farmers’ livelihood and improve the livelihood adaptation capacity, so as to enhance the willingness of farmers’ homestead agglomeration.

Author Contributions

The co-authors together contributed to the completion of this article. Specifically, it follows their individual contribution: conceptualization, Y.Q. and Q.Y.; validation, H.Z. (Haozhe Zhang) and Y.Q.; data curation, H.Z. (Huiming Zhang) and X.Q.; formal analysis, K.S. and H.Z. (Haozhe Zhang); methodology, Y.Q., K.S. and Q.Y.; supervision, project administration, Q.Y.; writing—original draft, Y.Q.; writing—review and editing, Y.Q., Q.Y. and K.S.; visualization, Y.Q. All authors have read and agreed to the published version of the manuscript.

Funding

This research was funded by Innovation Research 2035 Pilot Plan of Southwest University, grant number SWUPilotPlan031; National Natural Science Foundation of China, grant number 42071234; China Postdoctoral Science Foundation, grant number 2022M712620; Chongqing Social Science Planning Project, grant number 2021NDYB084; The Fundamental Research Funds for the Central Universities, grant number SWU2109308.

Institutional Review Board Statement

Not applicable.

Informed Consent Statement

Not applicable.

Data Availability Statement

Not applicable.

Acknowledgments

Our gratitude to everyone who contributed to this study.

Conflicts of Interest

The authors declare no conflict of interest.

References

  1. Balta, S.; Atik, M. Rural planning guidelines for urban-rural transition zones as a tool for the protection of rural landscape characters and retaining urban sprawl: Antalya case from Mediterranean. Land Use Policy 2022, 119, 106144. [Google Scholar] [CrossRef]
  2. Cao, Q.; Sarker, M.; Sun, J. Model of the influencing factors of the withdrawal from rural homesteads in China: Application of grounded theory method. Land Use Policy 2019, 85, 285–289. [Google Scholar] [CrossRef]
  3. Scott, M. Spatial Planning and the Rural Economy; The Routledge Companion to Rural Planning: London, UK, 2019. [Google Scholar]
  4. Zachrisson, A.; Bjarstig, T.; Thellbro, C.; Neumann, W.; Svensson, J. Participatory comprehensive planning to handle competing land-use priorities in the sparsely populated rural context. J. Rural. Stud. 2021, 88, 1–13. [Google Scholar] [CrossRef]
  5. Yan, Y.; Yang, Q.; Su, K.; Bi, G.; Li, Y. Farmers’ Willingness to Gather Homesteads and the Influencing Factors-An Empirical Study of Different Geomorphic Areas in Chongqing. Int. J. Environ. Res. Public Health 2022, 19, 5252. [Google Scholar] [CrossRef] [PubMed]
  6. Tang, C.; He, Y.; Zhou, G.; Zeng, S.; Xiao, L. Optimizing the spatial organization of rural settlements based on life quality. J. Geogr. Sci. 2018, 28, 685–704. [Google Scholar] [CrossRef]
  7. Zhou, Y.; Li, X.; Liu, Y. Rural land system reforms in China: History, issues, measures and prospects. Land Use Policy 2020, 91, 104330. [Google Scholar] [CrossRef]
  8. Li, Y.; Liu, Y.; Long, H.; Cui, W. Community-based rural residential land consolidation and allocation can help to revitalize hollowed villages in traditional agricultural areas of China: Evidence from Dancheng County, Henan Province. Land Use Policy 2014, 39, 188–198. [Google Scholar] [CrossRef]
  9. Tian, Y.; Liu, Y.; Kong, X. Restructuring rural settlements based on mutualism at a patch scale: A case study of Huangpi District, central China. Appl. Geogr. 2018, 92, 74–84. [Google Scholar] [CrossRef]
  10. Guo, P.; Zhang, F.; Wang, H.; Qin, F. Suitability Evaluation and Layout Optimization of the Spatial Distribution of Rural Residential Areas. Sustainability 2020, 12, 2409. [Google Scholar] [CrossRef]
  11. Tu, S.; Long, H.; Zhang, Y.; Ge, D. Rural restructuring at village level under rapid urbanization in metropolitan suburbs of China and its implications for innovations in land use policy. Habitat Int. 2018, 77, 143–152. [Google Scholar] [CrossRef]
  12. Wang, J.; Yang, M.; Zhang, Y.; Wu, Y.; You, H. Factor Analysis of Concentration and Decentralization:Comparison Between Beijing and Tolyo Based on the Perspective of Administrative Power, Population and lmplementation Cost. Urban Dev. Stud. 2019, 26, 37–44. [Google Scholar]
  13. Gonzalez-Abraham, C.E.; Radeloff, V.C.; Hammer, R.B.; Hawbaker, T.J.; Stewart, S.I.; Clayton, M.K. Building patterns and landscape fragmentation in northern Wisconsin, USA. Landsc. Ecol. 2007, 22, 217–230. [Google Scholar] [CrossRef]
  14. Bjorna, H.; Aarsaether, N. Combating Depopulation in the Northern Periphery: Local Leadership Strategies in two Norwegian Municipalities. Local Gov. Stud. 2009, 35, 213–233. [Google Scholar] [CrossRef]
  15. Natsuda, K.; Igusa, K.; Wiboonpongse, A.; Thoburn, J. One Village One Product—Rural development strategy in Asia: The case of OTOP in Thailand. Can. J. Dev. Stud. Rev. Can. D Etudes Du Dev. 2012, 33, 369–385. [Google Scholar] [CrossRef]
  16. Lerise, F. Centralised spatial planning practice and land development realities in rural Tanzania. Habitat Int. 2000, 24, 185–200. [Google Scholar] [CrossRef]
  17. Daniels, T.L.; Lapping, M.B. Small town triage: A rural settlement policy for the American Midwest. J. Rural. Stud. 1987, 3, 273–280. [Google Scholar] [CrossRef]
  18. Broitman, D.; Ben-Haim, Y. Forecasting residential sprawl under uncertainty: An info-gap analysis. Land Use Policy 2022, 120, 106259. [Google Scholar] [CrossRef]
  19. Li, Y.; Wu, W.; Liu, Y. Land consolidation for rural sustainability in China: Practical reflections and policy implications. Land Use Policy 2018, 74, 137–141. [Google Scholar] [CrossRef]
  20. Huang, Q.; Song, W.; Song, C. Consolidating the layout of rural settlements using system dynamics and the multi-agent system. J. Clean. Prod. 2020, 274, 123150. [Google Scholar] [CrossRef]
  21. Fan, W.; Zhang, L.F. Does cognition matter? Applying the push-pull-mooring model to Chinese farmers’ willingness to withdraw from rural homesteads. Pap. Reg. Sci. 2019, 98, 2355–2369. [Google Scholar] [CrossRef]
  22. Zhang, X.; Han, L. Which Factors Factors Affect Farmers’ Willingness for rural community remediation? A tale of three rural villages in China. Land Use Policy 2018, 74, 195–203. [Google Scholar] [CrossRef]
  23. Koniuszewska, E. Legal Guarantees of Public Participation in Spatial Planning and Development. J. Eur. Environ. Plan. Law 2021, 18, 275–296. [Google Scholar] [CrossRef]
  24. Krupowicz, W.; Czarnecka, A.; Grus, M. Implementing crowdsourcing initiatives in land consolidation procedures in Poland. Land Use Policy 2020, 99, 105015. [Google Scholar] [CrossRef]
  25. Wang, C.; Wang, L.; Li, X.; Li, Y.; Shao, J.; Jiang, W. The Source of the Forward-security of Farmers Llivelihood and Settlement Integration: Based on the Survey of 477 Farmers in Bailin Vilage, West Suburbs of Chongqing. Acta Geogr. Sin. 2011, 66, 1141–1152. [Google Scholar]
  26. Li, L.; Li, X.; Hai, B.; Wang, X.; Xu, J. Evolution of rural settlement in an inland nonmetropolitan region of China at a time of rapid urbanisation: The case of Gongyi. J. Rural. Stud. 2020, 79, 45–56. [Google Scholar] [CrossRef]
  27. Zhang, L.; Fan, W. Rural Homesteads Withdrawal and Urban Housing Market: A Pilot Study in China. Emerg. Mark. Financ. Trade 2020, 56, 228–242. [Google Scholar] [CrossRef]
  28. Zhang, B.; Wang, C.; Wang, L.; Li, X.; Jiang, F. Heterogeneous households’ decision on household registration transfer and farmland relinquishment: From livelihood perspective. Prog. Geogr. 2013, 32, 170–180. (In Chinese) [Google Scholar]
  29. Zhang, Z.; Wen, Y.; Wang, R.; Han, W. Factors influencing rural households’ willingness of centralized residence: Comparing pure and nonpure farming areas in China. Habitat Int. 2018, 73, 25–33. [Google Scholar] [CrossRef]
  30. Su, K.; Wu, J.; Yan, Y.; Zhang, Z.; Yang, Q. The Functional Value Evolution of Rural Homesteads in Different Types of Villages: Evidence from a Chinese Traditional Agricultural Village and Homestay Village. Land 2022, 11, 903. [Google Scholar] [CrossRef]
  31. Su, K.; Hu, B.; Shi, K.; Zhang, Z.; Yang, Q. The structural and functional evolution of rural homesteads in mountainous areas: A case study of Sujiaying village in Yunnan province, China. Land Use Policy 2019, 88, 104100. [Google Scholar] [CrossRef]
  32. Tu, T.; Bao, Z. An Empirical Study on Farmers′ Willingness to Participate in “Internet” Marketing–Taking Jiangsu Province as an Example. Anhui Agric. Sci. Bull. 2019, 25, 13–16+20. (In Chinese) [Google Scholar]
  33. Li, P.; Chen, J.; Liu, X.; Kuang, Y. A study on the influencing factors of farmers’ willingness in rural settlements renovation based on logistic model: An Empirical Study of Haitang village in Changshou District. Rural. Econ. Sci. Technol. 2019, 30, 39–41+43. (In Chinese) [Google Scholar]
  34. Charatsari, C.; Kitsios, F.; Stafyla, A.; Aidonis, D.; Lioutas, E. Antecedents of farmers’ willingness to participate in short food supply chains. Br. Food J. 2018, 120, 2317–2333. [Google Scholar] [CrossRef]
  35. Hu, H.; Si, Y.; Wang, L. The lmpact of Industrial Poverty Alleviation Strategies on the Livelihoods and Household lncomes of the Rural Poor: An Empirical Analysis from Shaanxi Province. Chin. Rural. Econ. 2018, 1, 78–89. (In Chinese) [Google Scholar]
  36. Cui, M.; Xia, X. Ilnfluence of perceived value and policy incentive on farmers’willingness and behavior to maintain the achievement of returning farmland to conservation. J. Arid. Land Resour. Environ. 2022, 36, 28–37. [Google Scholar]
  37. Yang, S.; Yang, J. The lmpact of Livelihood Capital on Peasant’s Wilingness to Participatein Rural Environment Govermnance:From the Dual erspectives of Capital Llevel and Structure. J. Nanjing Tech Univ. (Soc. Sci. Ed.) 2022, 21, 34–47+115. [Google Scholar]
  38. Nguyen, K.A.T.; Nguyen, T.A.T.; Bui, C.; Jolly, C.; Nguelifack, B.M. Shrimp farmers risk management and demand for insurance in Ben Tre and Tra Vinh Provinces in Vietnam. Aquac. Rep. 2021, 19, 100606. [Google Scholar] [CrossRef]
  39. Yang, R.; Luo, X. Progress and Prospects in Rural Space Diversification, Reconstruction, and Governance from a Development Perspective. Trop. Geogr. 2020, 40, 575–588. [Google Scholar]
  40. Zhang, Q.; Zhao, X.; Li, L.; Wang, Y.; Xue, B. Assessment of the impact of climate change on vulnerability of farmer households’ livelihood in an ecologically vulnerable alpine region: Taking Gannan Plateau for example. Chin. J. Ecol. 2016, 35, 781–790. [Google Scholar]
  41. Ye, J. Stayers in China’s “hollowed-out” villages: A counter narrative on massive rural-urban migration. Popul. Space Place 2018, 24, e2128. [Google Scholar] [CrossRef]
  42. Cuizhen, L.; Xiangbin, K.; Jianchun, X. Farm household livelihood diversity and land use in suburban areas of the metropolis:The case study of Daxing District, Beijing. Geogr. Res. 2012, 31, 1039–1049. [Google Scholar]
  43. Mukherjee, S.; Mandal, S.; Haldar, S.; Mandal, P.; Bhattacharya, S.; Paul, S. Chapter 5—Assessing and quantifying livelihood vulnerability of tribal farmers in water-stressed region of rural West Bengal, India. In Indigenous People and Nature; Chatterjee, U., Kashyap, A., Everard, M., Panda, G.K., Mahata, D., Eds.; Elsevier: Amsterdam, The Netherlands, 2022; pp. 105–132. [Google Scholar]
  44. Huang, X.; Huang, X.; He, Y.; Yang, X. Assessment of livelihood vulnerability of land-lost farmers in urban fringes: A case study of Xi’an, China. Habitat Int. 2017, 59, 1–9. [Google Scholar] [CrossRef]
  45. Wang, D.; Wan, K.; Song, X. Coal miners’ livelihood vulnerability to economic shock: Multi-criteria assessment and policy implications. Energy Policy 2018, 114, 301–314. [Google Scholar] [CrossRef]
  46. Zhang, Y.; Wu, Y.; Yan, J.; Peng, T. How does rural labor migration affect crop diversification for adapting to climate change in the Hehuang Valley, Tibetan Plateau? Land Use Policy 2022, 113, 105928. [Google Scholar] [CrossRef]
  47. Qina, Z.; Haili, X.; Xiao, L.; Luwei, D.; Bojie, W.; Fengqi, C.; Haiping, T. Livelihood vulnerability of pastoral households in the semiarid grasslands of northern China: Measurement and determinants. Ecol. Indic. 2022, 140, 109020. [Google Scholar] [CrossRef]
  48. Zhao, X. Sustainable livelihoods research from the perspective of geography: The present status, questions and priority areas. Geogr. Res. 2017, 36, 1859–1872. (In Chinese) [Google Scholar]
  49. He, Y.; Zhou, C. Evaluation of farmers’ livelihood vulnerability and analysis of influencing factors in poor areas. Stat. Decis. 2020, 36, 70–74. (In Chinese) [Google Scholar]
  50. Yang, J.; Zhao, W.; Zeng, C. Study on the evaluation of livelihood vulnerability index of rural households in rural land consolidation—An Empirical Study Based on Jingmen and Yichang in Hubei Province. Chin. J. Agric. Resour. Reg. Plan. 2020, 41, 275–283. (In Chinese) [Google Scholar]
  51. Hahn, M.B.; Riederer, A.M.; Foster, S.O. The Livelihood Vulnerability Index: A pragmatic approach to assessing risks from climate variability and change—A case study in Mozambique. Glob. Environ. Chang. 2009, 19, 74–88. [Google Scholar] [CrossRef]
  52. Wu, K.; Liu, Q.; Zhang, J.; Yang, X. Farmers’ Livelihood Vulnerability and Adaptation Model in Minqin Oasis under the Arid Environment Stress. Econ. Geogr. 2019, 39, 157–167. (In Chinese) [Google Scholar]
  53. Han, W.; Liu, X.; Pei, Y.; An, Q.; Li, Y. Agro-household livelihood vulnerability and influence factors of ethnic villages under different geomorphology backgrounds. Yingyong Shengtai Xuebao 2016, 27, 1229–1240. [Google Scholar] [PubMed]
  54. Kuang, F.; Jin, J.; He, R.; Ning, J.; Wan, X. Farmers’ livelihood risks, livelihood assets and adaptation strategies in Rugao City, China. J. Environ. Manag. 2020, 264, 110463. [Google Scholar] [CrossRef]
  55. Ren, W.; Xiong, K.; Ying, B.; Xiao, J. Assessment of the Impact Factors of Farmers’ Livelihood Vulnerability Under Different Landforms in Karst Areas: A Case Study of Huajiang and Salaxi. J. Ecol. Rural. Environ. 2020, 36, 442–449. [Google Scholar]
  56. Wang, J.; Li, L.; Xia, S.; Mao, X. A Study on the Sustainability Evaluation and Policy Effect of Poverty Alleviation Livelihood in the Context of lnstitutional Cooperation. J. Southwest Univ. (Soc. Sci. Ed.) 2020, 46, 68–76+192. [Google Scholar]
  57. Liu, J.; Gan, S.; Lv, J.; Yan, H.; Yuan, X.; Liu, C.; Xie, C. Spatial Simulation Using GlS and Artificial Neural Network for Household Livelihood Vulnerability. Mt. Res. 2012, 30, 622–627. (In Chinese) [Google Scholar]
  58. Peng, Y.; Liu, B.; Zhou, M. Sustainable Livelihoods in Rural Areas under the Shock of Climate Change: Evidence from China Labor-Force Dynamic Survey. Sustainability 2022, 14, 7262. [Google Scholar] [CrossRef]
  59. Bauer, T.; de Jong, W.; Ingram, V.; Arts, B.; Pacheco, P. Thriving in turbulent times: Livelihood resilience and vulnerability assessment of Bolivian Indigenous forest households. Land Use Policy 2022, 119, 106146. [Google Scholar] [CrossRef]
  60. Wang, Z.; Wang, M. Influencing factors of farmers’ homestead withdrawal decision based on the technology acceptance model and perceived risk: Evidence from Chongqing. Resour. Sci. 2021, 43, 1335–1347. (In Chinese) [Google Scholar]
  61. Ma, L.; Liu, S.; Niu, Y.; Chen, M. Village-Scale Livelihood Change and the Response of Rural Settlement Land Use: Sihe Village of Tongwei County in Mid-Gansu Loess Hilly Region as an Example. Int. J. Environ. Res. Public Health 2018, 15, 1801. [Google Scholar] [CrossRef]
  62. Xiang, J.; Li, X.; Xiao, R.; Wang, Y. Effects of land use transition on ecological vulnerability in poverty-stricken mountainous areas of China: A complex network approach. J. Environ. Manag. 2021, 297, 113206. [Google Scholar] [CrossRef]
  63. Yang, X.; Guo, S.; Deng, X.; Xu, D. Livelihood Adaptation of Rural Households under Livelihood Stress: Evidence from Sichuan Province, China. Agriculture 2021, 11, 506. [Google Scholar] [CrossRef]
  64. Polsky, C.; Neff, R.; Yarnal, B. Building comparable global change vulnerability assessments: The vulnerability scoping diagram. Glob. Environ. Chang. 2007, 17, 472–485. [Google Scholar] [CrossRef]
  65. Asfaw, A.; Bantider, A.; Simane, B.; Hassen, A. Smallholder farmers’ livelihood vulnerability to climate change-induced hazards: Agroecology-based comparative analysis in Northcentral Ethiopia (Woleka Sub-basin). Heliyon 2021, 7, e06761. [Google Scholar] [CrossRef] [PubMed]
  66. Lu, J.; Lu, T. A Review of Livelihood Vulnerability Assessment Studies. China South. Agric. Mach. 2022, 53, 31–35. [Google Scholar]
  67. Su, K.; Yang, Q.; Zhang, Z.; Bi, G. Investigation of differential fallow patterns and technical measures for cultivated land in China. Trans. Chin. Soc. Agric. Eng. 2020, 36, 283–291. (In Chinese) [Google Scholar]
  68. Li, X.; Gao, G.; Qiao, J. Rural household’s income and its determinant factors:Evidence from 1251 rural households in Henan Province, China. Geogr. Res. 2008, 5, 1037–1047. (In Chinese) [Google Scholar]
  69. Zhao, X.; Xue, B. Farmer’s perception and adaptation intention for climate change in high-cold eco-fragile region:A case of Gannan Plateau, China. Chin. J. Appl. Ecol. 2016, 27, 2329–2339. (In Chinese) [Google Scholar]
  70. Lu, S.; Doo, J.H. Deteriorated Hillside Residents’ Needs and Preferences for Housing Estate Regeneration According to Level of Household Income—Focused on the Seoul Metropolitan Region. J. Archit. Inst. Korea Plan. Des. 2013, 29, 13–24. [Google Scholar]
  71. Sun, T.; Ou, M. Study on Infuence and Mechanism of Households’ wilingness in Rural Settlements Consolidation Based on the Framework of Theory of Planned Behavior. J. Huazhong Agric. Univ. (Soc. Sci. Ed.) 2020, 2, 118–126+168. [Google Scholar]
  72. Li, N.; Huang, L. Willingness and Behavioral Divergence of Rural Home Base Withdrawal and Its Influencing Factors—An Empirical Analysis Based on Questionnaire Survey of 303 Farming Households in 6 Cities of Shandong Province. Rural. Econ. Sci. Technol. 2022, 33, 17–21. [Google Scholar]
  73. Singh, S. Bridging the gap between biophysical and social vulnerability in rural India: A community livelihood vulnerability approach. Area Dev. Policy 2020, 5, 390–411. [Google Scholar] [CrossRef]
  74. Zhang, H.; Yang, Q.; Su, K.; Yin, W.; Wang, W.; Zhang, R. lmpact of the Development of Rural Bed-andBreakfast Business on the changes of Farmers’ Livelihood Capital:A Perspe ctive of Rural Revitalization. J. Southwest Univ. (Nat. Sci. Ed.) 2021, 43, 11–21. (In Chinese) [Google Scholar]
  75. Kuang, F.; Chen, M.; Lu, Y.; Weng, Z. The lmpact of Farmers’ Livelihood Capital on the Wilingness of Cultivated Land ProtectionBased on the Investigation Data from 587 Farmer in Jiangi Province. China Land Sci. 2017, 31, 58–66. [Google Scholar]
  76. Kuang, F.; Chen, M. Influence of Risk Expectation and Livelihood Capital on Farmers’ Willingness to Withdraw Homestead and lts Intergenerational Differences:Based on Survey Data of 456 Households in Jiangxi Province. J. Agro-For. Econ. Manag. 2021, 20, 92–101. [Google Scholar]
  77. Xia, M.; Liu, J.; Tan, S. Analysis of farmers’ willingness to optimize settlement space at the village scale. Rural. Econ. Sci. Technol. 2021, 32, 23–25. [Google Scholar]
Figure 1. The impact mechanism of farmers’ livelihood vulnerability on homestead agglomeration intention.
Land 11 01322 g001
Figure 2. Location of the study area.
Land 11 01322 g002
Figure 3. Current situation of farmers’ livelihood vulnerability.
Land 11 01322 g003
Table 1. Characteristics of the farming household samples.
ProjectsCategoryFrequencyProportion/%ProjectsCategoryFrequencyProportion/%
Age
(years)
≤3063Education
level
Never went to school5827
31~4073Primary school culture9344
41~503316Lower Secondary Culture4823
51~608138High School Culture94
>618440High School or above31
Number of household population (persons)≤27335Annual household income (10,000 yuan)≤14320
3~485401~56028
5~647225~106129
>663>104722
Livelihoods approach (category)02512Labor
force ratio
(%)
≤253014
1803825~503918
2944550~756531
3126>757736
Table 2. Comprehensive evaluation indicator system of livelihood vulnerability.
Target LevelGuideline LevelIndicator LayerAssignmentPropertiesWeighting
Livelihood exposure
E
Natural risksDegree of dependence of household income on natural resourcesAnnual income from farming/Annual total household income/%+0.0361
Family risksOld age securityElderly person in household without pension = 0; elderly person in household with pension, elderly person in household with pension, no elderly person in household = 10.5411
Level of agingNumber of household farming members over 60 years of age as a proportion of total household farming members/%+0.0408
Livelihood Sensitivity SNumber of livelihood substitutionsNumber of ways in which farmers earn their livelihoodsAssign values by type of livelihood activity, 1 for 1 and n for n0.0095
Economic pressuresDaily consumptionPercentage of daily consumption expenditure/%+0.0229
Children’s educationPercentage of expenditure on education/%+0.0212
Medical expensesPercentage of medical expenditure/%+0.0208
Social interactionPercentage of expenditure on favors/%+0.0172
Livelihood resilience AHuman capitalFarmers’ education levelNumber of people with high school education or above as a percentage of household population/%+0.0299
Resident population/householdResident population as a percentage of household population/%+0.0061
Labor force shareNumber of labor force as a percentage of household population/%+0.0124
Healthiness per householdGrading based on the natural breakpoint method of medical costs (0~1400 = 5, 1400~4500 = 4, 4500~10,000 = 3, 10,000~28,000 = 2, 28,000~60,000 = 1)+0.0066
Number of outworkersNumber of outworkers as a percentage of household population/%+0.0246
Natural capitalArable land per capitaArable land area/household population/yuan+0.0167
Physical capital Livestock capitalCalculation based on the type of livestock available and their market value+0.0231
Housing structureAssignment by housing structure, adobe or all-wood = 1; adobe = 2; brick = 3, brick = 4, steel = 5+0.0251
Housing area per personHousing area/household population/m2+0.0117
Level of infrastructure developmentX = X1 + X2 + X3 + X4 + X5 + X6 + X7+0.0047
Are there any safety hazardsYes = 1. No = 00.0197
Financial capitalIncome diversityAssign values by type of income, 1 for 1 and n for n+0.0121
Nonfarm income per capitaNonfarm income/household population/$+0.0180
Access to subsidiesAssign a value to the type of subsidy received, 1 for 1 type and n for n types+0.0163
Social capitalNumber of family members working in institutionsBy household: number of people in the household working in the village council, government, etc./person+0.0528
NeighborhoodsAssign a value to the neighborhood relationship scale, conflicted, never = 0; average, occasional = 1; harmonious, frequent = 2+0.0032
Visiting with relativesAssign a value to the level of visits with relatives, never = 0 Basically none = 1 Occasionally = 2 Often = 3 Daily = 4+0.0071
Note: X1 for hardened roads, X2 for night lighting, X3 for water supply, X4 for energy type, X5 for sanitary toilets, X6 for electricity access, X7 for network coverage.
Table 3. Livelihood vulnerability of different types of farmers.
Type of Farming HouseholdESALVI
Pure Farmers0.0388870.0151130.0727230.660050
One part-time household0.0239940.0104310.0766440.553218
Two part-time households0.0098490.0069340.0857430.415439
Abandoned Farmers0.0098360.0126950.0908520.434556
Low dependency ratio0.0071910.0107670.092880.404528
Medium dependency ratio0.0135920.0093240.0870410.453629
High dependency ratio0.0435620.0178990.0565590.767111
Lower level of education0.0244400.0128820.0724820.585191
Intermediate level of education0.0094680.0100000.0960730.396873
Higher level of education0.0107330.0087800.1070650.347102
Table 4. Homestead agglomeration willingness of different types of farmers.
Type of Farming HouseholdWillingness to Agglomerate as a Percentage/%Type of Farming HouseholdWillingness to Agglomerate as a Percentage/%Type of Farming HouseholdWillingness to Agglomerate as a Percentage/%
Pure Farmers46.15Low dependency ratio59.18Lower level of education44.59
One part-time household48.15Medium dependency ratio56.60Intermediate level of education62.50
Two part-time household56.52High dependency ratio30.36Higher level of education66.67
Abandoned Farmers51.56
Table 5. Regression results of the livelihood vulnerability index and target layer.
Variables(1)(2)(3)(4)
LVI 1 −4.393 ***
Exposure−0.792 ***
Sensitivity−1.384 **
Adaptability4.920 ***
Nature of the family−0.0191−0.252−0.048−0.242
Availability of business/rental−0.471−0.417−0.152−0.380
Overall satisfaction with the current housing situation on the homestead−0.522 ***−0.252 **−0.366 **−0.535 **
Satisfaction with the current scale of settlement of the homestead−0.2090.295 *−0.218−0.209
Homestead use status0.187−0.2520.2530.158
Note: *, **, *** indicate significance at the 10%, 5% and 1% level.
Table 6. Regression results of the livelihood vulnerability index.
Variables(5)(6)
LVI 2 −2.437 **−2.782 **
Nature of the family-−0.145
Availability of business/rental-−0.035
Overall satisfaction with the current housing situation on the homestead-−0.0363 *
Satisfaction with the current scale of settlement of the homestead-−0.258
Homestead use status-0.255
Note: *, ** indicate significance at the 10% and 5% level.
Publisher’s Note: MDPI stays neutral with regard to jurisdictional claims in published maps and institutional affiliations.

