Article

Changes in Urban Growth Patterns in Busan Metropolitan City, Korea: Population and Urbanized Areas

1
Department of Urban Planning and Engineering, Dong-A University, Busan 49315, Korea
2
Department of Urban Planning and Engineering, Pusan National University, Busan 46241, Korea
*
Author to whom correspondence should be addressed.
Land 2022, 11(8), 1319; https://doi.org/10.3390/land11081319
Submission received: 8 July 2022 / Revised: 5 August 2022 / Accepted: 15 August 2022 / Published: 16 August 2022
(This article belongs to the Special Issue Urban Land Development in the Process of Urbanization)

Abstract

:
Cities have exhibited spatial patterns of expansion or compacting in the process of economic and population growth. South Korea is a well-known example of a country that has experienced rapid economic growth and urbanization. This study’s target area, Busan Metropolitan City (BMC), experienced urban growth but, over the past 20 years, underwent economic and population stagnation. How will urban growth patterns change if economic and population growth stagnates? This study aimed to identify changes in urban growth patterns using population and urbanized areas in BMC, South Korea, from 1980 to 2020. It uses Exploratory Spatial Data Analysis, Bachi’s Index and the Standard Deviational Ellipse, and Social Network Analysis to identify population concentration, changes in centrality, inland expansion of urbanized land, and centrality of migration. The results showed that (1) BMC’s urban growth pattern extended outward, despite population and economic stagnation since 2000; (2) population and economic stagnation over the next 20 years expanded population polarization in the city’s urban center and outskirts; (3) the built-up area expanded in all directions for 40 years—the centrality of the urbanized area was seen in and around the urban center in 1980 but moved northeast in 2020; and (4) since 2000, when population stagnation first emerged, the centrality of the population in migration has been more evident in the outskirts. These results suggest that if there is no sustainable urban planning and development strategy when growth is stagnant, expansionary urban growth will continue, and cities will reach the growth limit.

1. Introduction

The level of global urbanization exceeded 55% in 2018 and is forecasted to reach 68% by 2050 [1]. While definitions of urbanization vary among scholars, a commonality among them is that they include the expansion of industries and jobs with economic growth and an increase in population density [2,3]. Urbanization, which is closely related to economic growth, refers to the process in which land development expands outward as the population of non-urban areas moves to urban areas and population density increases due to the expansion of jobs and industries in urban areas [4,5]. Western developed countries have experienced urbanization over a long period of time, but in many developing countries, urbanization occurs in a short period due to the effect of economic growth [6].
Recent discussions on urbanized areas and populations have noted the phenomenon of imbalance. They reveal the appearance of urbanization patterns that differ from those of the past growth period because of aging, population decline, and so on, particularly focusing on patterns in which population loss appears in tandem with an increase in built-up areas [7,8]. Furthermore, they discuss that even in growing areas, the patterns formerly represented by urban sprawl or suburbanization are changing in that the expansion of urbanized land occurs more rapidly than population growth [9,10,11].
The research questions of this study are as follows: What does the urban growth pattern of a city experiencing two stagnation periods after rapid urbanization look like? How did the urbanized area and population, representative indicators of the urban growth pattern, and their centrality change?
This study targets Busan Metropolitan City (BMC), the second-largest city in South Korea, as the most representative example of the situation raised in the research questions above. In South Korea, the expansion of urbanized areas from 1970 to 1990 was led by rapid economic growth, population movement to urban areas, and population growth [12]. However, rapid population aging since 2010 and the population’s concentration in the capital region, including Seoul, has led to a population decline in metropolitan cities in non-capital regions [13]. In particular, this has caused issues such as the shrinkage and hollowing out of the inner city (the central business district [CBD] and the surrounding old town) in metropolitan cities in non-capital regions, resulting in changes in urban structure [14]. Such changes are aggravated when population and economic stagnation manifest in combination [14,15]. Among the various cities in South Korea that have undergone rapid urbanization, BMC is a representative example of two continuous stagnations. It experienced its most rapid growth through industrialization after the Korean War, but since 1995, the economic growth rate has decreased, and the population has continued to decrease as well.
This study aims to identify changes in urban growth patterns using the indicators of population and urbanized area in BMC. Population and urbanized area (or built-up area) are representative indicators of urbanization levels and spatial patterns. In this study, the spatial pattern of the population was examined to distinguish between residents and migrants, and land cover developed into urban areas was used to represent the urbanized area. Regarding the spatial scope, a 40-year period from 1980 to 2020 was applied to include both the period of rapid economic and population growth and the period of decline after growth peaked in 1995. After examining the Local Moran’s I of the population on a 10-year basis, the changes in the urbanized area and its resulting centrality were determined through Bachi’s Index and the Standard Deviational Ellipse (SDE). The migration centrality of the population, a key variable reflecting urban growth pattern change, was then identified through Social Network Analysis. Finally, we examined this change.
This study does not address urban expansion patterns as suburbanization; rather, it focuses on how the inner area of a large city that is experiencing both growth and decline shows changes. It clarifies (a) the changes in population concentration within the city during the period of decline after a period of growth, (b) the changes in urbanized area expansion and centrality, and (c) the changes in the migration of people within the city. This study is meaningful in terms of how cities in developing counties where rapid urbanization takes place implement planning and development strategies. In particular, it shows empirical facts related to how cities reach the limit of growth if they follow existing development methods without sustainable planning and development strategies at a time when population and economic growth are stagnant.

2. Previous Studies

The approach to urban growth patterns depends on what the result of urban growth is, and the theoretical approach depends on how far out the spatial range is set. Discussions on identifying urban growth as a characteristic of urban sprawl focus on the spatial patterns as well as the density and distribution of the population or activities in which the urbanized area has expanded [16,17,18].
Existing studies approaching urban growth patterns as urban sprawl have long researched Western cities, discussing those cities’ leapfrog development characterized by low density, suburban development, motor-vehicle-oriented transportation, and fragmented land development [16,19]. Since the main purpose of these discussions is to identify the form of expansion leading to urban growth, this study included not just one urban boundary but also the surrounding boundary as its spatial scope and quantified changes in that scope. The new spatial patterns of urban growth, which have recently become a topic of discussion, are divided into edge growth, outlying growth, and infilling growth [20]. The new spatial patterns appear as a result of the interaction between the pre-grown and the newly grown urban areas [21]. These two areas indicate that the roles of urban planning and land use regulation are considered in the process of urban growth, resulting in different urban growth patterns for each city [22]. These discussions include the surrounding boundaries around the existing city boundaries.
Numerous studies have been conducted on the urbanization patterns arising from economic and population growth, such as population density, the spatial patterns of urbanized land, and urban sprawl. In particular, various methods have been proposed to quantify urbanization patterns. Such studies are diverse and include those (a) using population, land consumption, and multidimensional indicators [7,23,24], (b) based on remote sensing data [16,25,26,27], and (c) identifying changes in the density and distribution of explanations using exponential, quadric exponential, and power functions [28,29,30,31,32,33].
Urbanization has two prominent features: urban population growth and urban area expansion [34]. The two interact closely in the process of urbanization [35]. Urban population growth increases the demand for urban land, resulting in the inevitable expansion of urban areas. Studies on urbanization, including those on urban sprawl, have been conducted from various perspectives. Such studies include discussions on changes in urban population growth as a major indicator of urbanization [36,37,38], the spatial patterns of urban areas [39,40,41,42], and urban density [19,23]. Much of the discussion on the spatial patterns of urbanization primarily focuses on the sprawl and suburbanization phenomena that emerged during the period of rapidly increasing urban population and economic growth.
Existing discussions indicate that similar forms of urbanization expansion emerged in various developed areas, such as the United States and Europe, following the Industrial Revolution and World War II, and lasted until the 1990s [19,43,44]; they also indicate that similar spatial patterns are seen in developing countries [11,45]. This process is caused not only by population growth, income growth, and low commuting costs, which are powerful initiators of socioeconomic transformation [46,47], but also by inappropriate public finance policies issued by a government relying heavily on the land market [48], ill-suited urban growth boundaries [49], local government decisions [50], and excessive investment in public transportation [51].
Recent studies argue that there is an imbalance in the close relationship between population growth and the expansion of urban areas, which was deliberated as orderly market forces in terms of urban economies, thus leading to various issues [52]. Urbanized areas exceeding the urban population cause severe diseconomies, leading to the ghost city phenomenon [11]; additionally, they cause environmental problems and human and land conflicts [35,53]. Furthermore, they suggest that urbanization patterns are emerging in forms different from those of the past period of growth and are centered on cities in developed countries. Based on an analysis of urbanization patterns in European cities after the 1990s and using the indicators of population and density of land use, Wolff et al. [7] found an occurrence of sprawl-without-growth. Liu and Meng [54] also identified functional urban areas in European cities after 1990 through the indicators of population and discontinuity of the urban area and, as a result, suggested that factors of population loss and sprawl were emerging simultaneously. Urbanization patterns also appear in a form contrary to conventional sprawl development [55,56,57]. These studies demonstrate a return flow of small- and high-income households into the city borders and indicate regrowth or redensification of existing urban areas rather than suburban areas.
Many studies have attempted to analyze the urban growth patterns of various cities. Recent comparative studies of urban growth patterns in several cities have targeted cities in China and the United States. Jia et al. [58], who studied the urban area of Beijing-Tianjin-Hebei (BTH), discussed the dynamics of the urban growth patterns shown distinctively in Chinese cities in terms of urban land, inner structure, mixed uses of land, accessibility, and environmental impact. Analysis between 2015 and 2018 suggested that there was a difference in the urban growth patterns of both large and small cities in BTH. As small cities expanded, they became spatially fragmented and decentralized [58]. He et al. [59] also compared urban growth patterns of Chinese and American cities between 1995 and 2005 and between 2005 and 2015. These studies investigated three major cities in the United States—the Northeast megalopolis, the California megalopolis, and the Great Lakes megalopolis—and the three urban agglomerations of China—the Beijing-Tianjin-Hebei megalopolis, the Yangtze River Delta urban megaregion, and the Pearl River Delta urban agglomeration. For the U.S., outlying urban sprawl occurred within 4 km of the primary urban center; for China, it occurred within 4–10 km. Edge urban sprawl appeared to be a key urban growth pattern in the two countries. Xu et al. [60] identified the change in urban sprawl using population density. They confirmed that population density is decreasing in 35 Chinese and 20 American cities and suggested that, while urban sprawl appeared in both countries, it was more evident in the United States.
In addition, studies on the urban growth pattern over 20–30 years have been conducted for cities that have grown rapidly. Cengiz et al. [61] studied the urban growth that occurred from 1984 to 2018 for Ankara, Turkey. Their study identified that irregular expansion occurred using land use and land cover change and density analysis; in particular, they found that edge expansion was significantly increasing. Dou and Chen [62] identified urban growth patterns in the Shezhen area in Guanding Province, China, from 1988 to 2015, which was characterized by an extensional urbanization of urbanized land cover; they found that foreign capital investment and government policies played an important role in the area’s growth. Verstegen and Goch [63] applied cellular automata modeling to Dublin, Ireland, Milan, Italy, and Warsaw, Poland, from 1990 to 2018, and confirmed that monocentric edge expansion occurred in Dublin, ribbon sprawl occurred in Warsaw, and polycentric infill development occurred in Milan. Dadashpoor et al. [17] confirmed that the edge growth pattern appeared, as well as that a dispersed growth pattern appeared in some subregions, as a result of applying the cellular automata method to the Tabriz metropolitan area in Iran. Sharma and Kumar [64] analyzed India’s Rohtak City using land cover and land use data; a four-fold growth occurred in the built-up area, which is characteristic of planned and unplanned residential and commercial arrangement. Nong et al. [65] identified the urban growth pattern of Hanoi, Vietnam, between 1993 and 2010. The spatiotemporal dynamics of the built-up land confirmed that it was extended by 10–35 km from the urban center, and infilling and edge expansion growth primarily appeared. Zhang et al. [66] confirmed the urban growth pattern of Wuhan, China, through the change in urban land between 1990 and 2010. Wuhan experienced redevelopment, infilling, and edge expansion, which were confirmed to have been influenced by industrial upgrading, educational leveling up, and population aging. Baqa et al. [67] identified the urban growth pattern of Karachi, Pakistan, between 1990 and 2020 through cellular automata of land cover. They showed that the built-up area extended outward in an unpredictable manner. Sun et al. [68] identified the urban growth pattern of Shenyang, China, between 1989 and 2018 through changes in the residential area. It was suggested that urban planning and economic growth resulted in the expansion of residential space.
Existing studies have primarily focused on identifying the expansion modes of growing cities, with their basis on the growth mechanism that urban growth is the result of the expansion of urban land, stimulated by population growth following economic growth. Studies on urban growth patterns are based on finding the common laws [69] and determining types of cities based on generalized types. Existing studies have focused on the positive relationship between the economic and population growth pattern and the urban growth pattern but have overlooked cases in which economic and population growth have stagnated. Therefore, this study focuses on determining whether urban growth patterns vary or the existing patterns are maintained through step-by-step comparison, including periods of both growth and stagnation.
In addition, existing studies have primarily focused on the relationship between the urban center and suburban areas in the urban growth pattern and overlooked changes within the city. The form of suburbanization, which has been explored in many studies, and the new types recently considered, such as edge, outlying, and infilling growth, have been discussed with a focus on the relationship between the city and the periphery. Existing studies have suggested that the roles of urban planning and development policy were the key factors behind such change. However, urban planning and development policy is defined within the administrative boundaries of the city and is independent of the urban planning and development policy of the city that constitutes the suburban areas. Therefore, this study focuses on the process of internal change in a city, a unit of urban planning and development policy, and identifies how the expansion of the urbanized area changes the urban centrality and what type of pattern the internal movement of the population embodies.

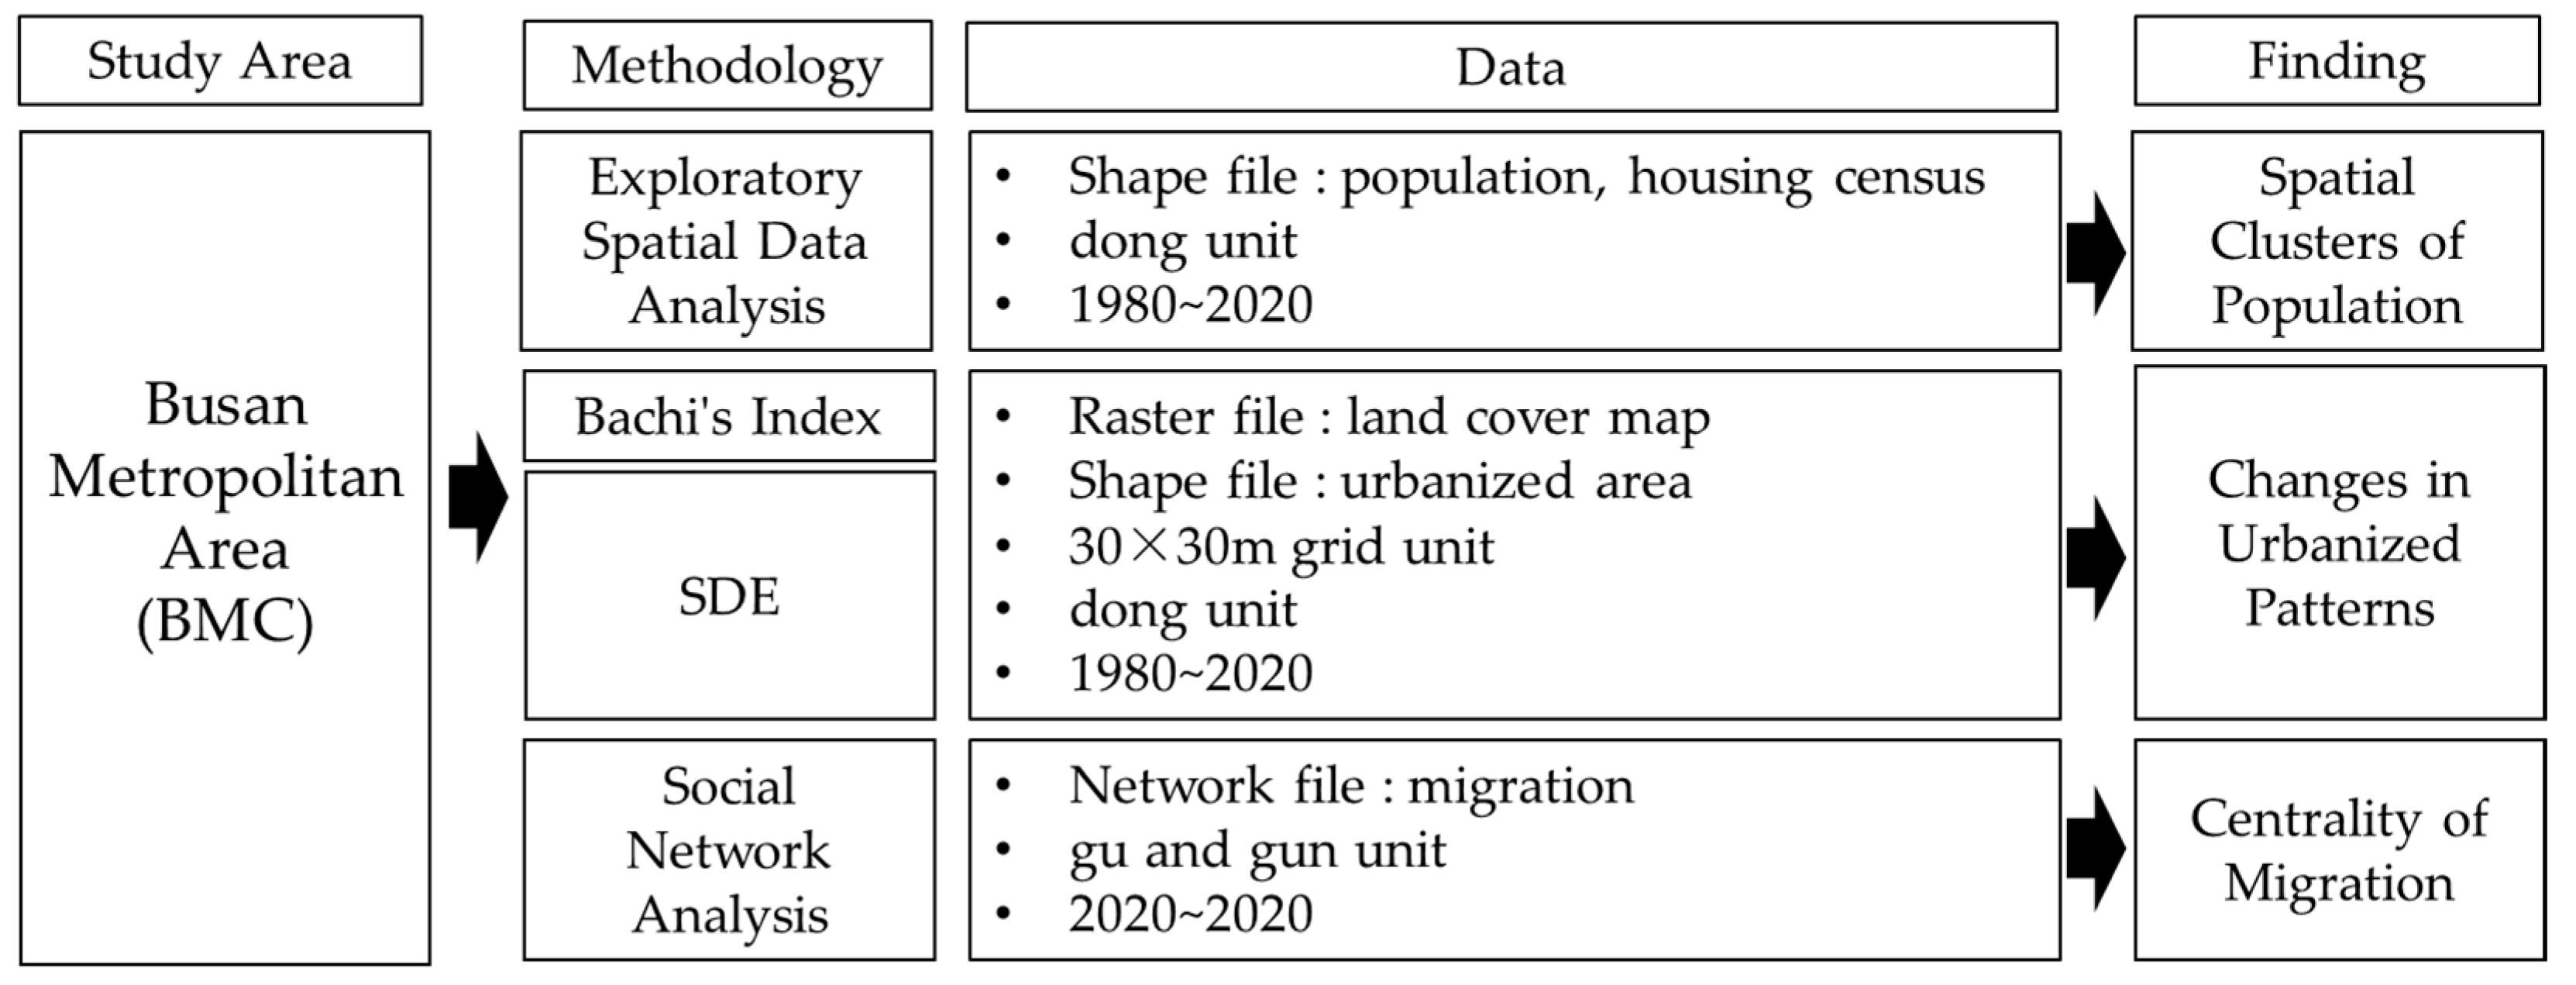
3. Material and Methods
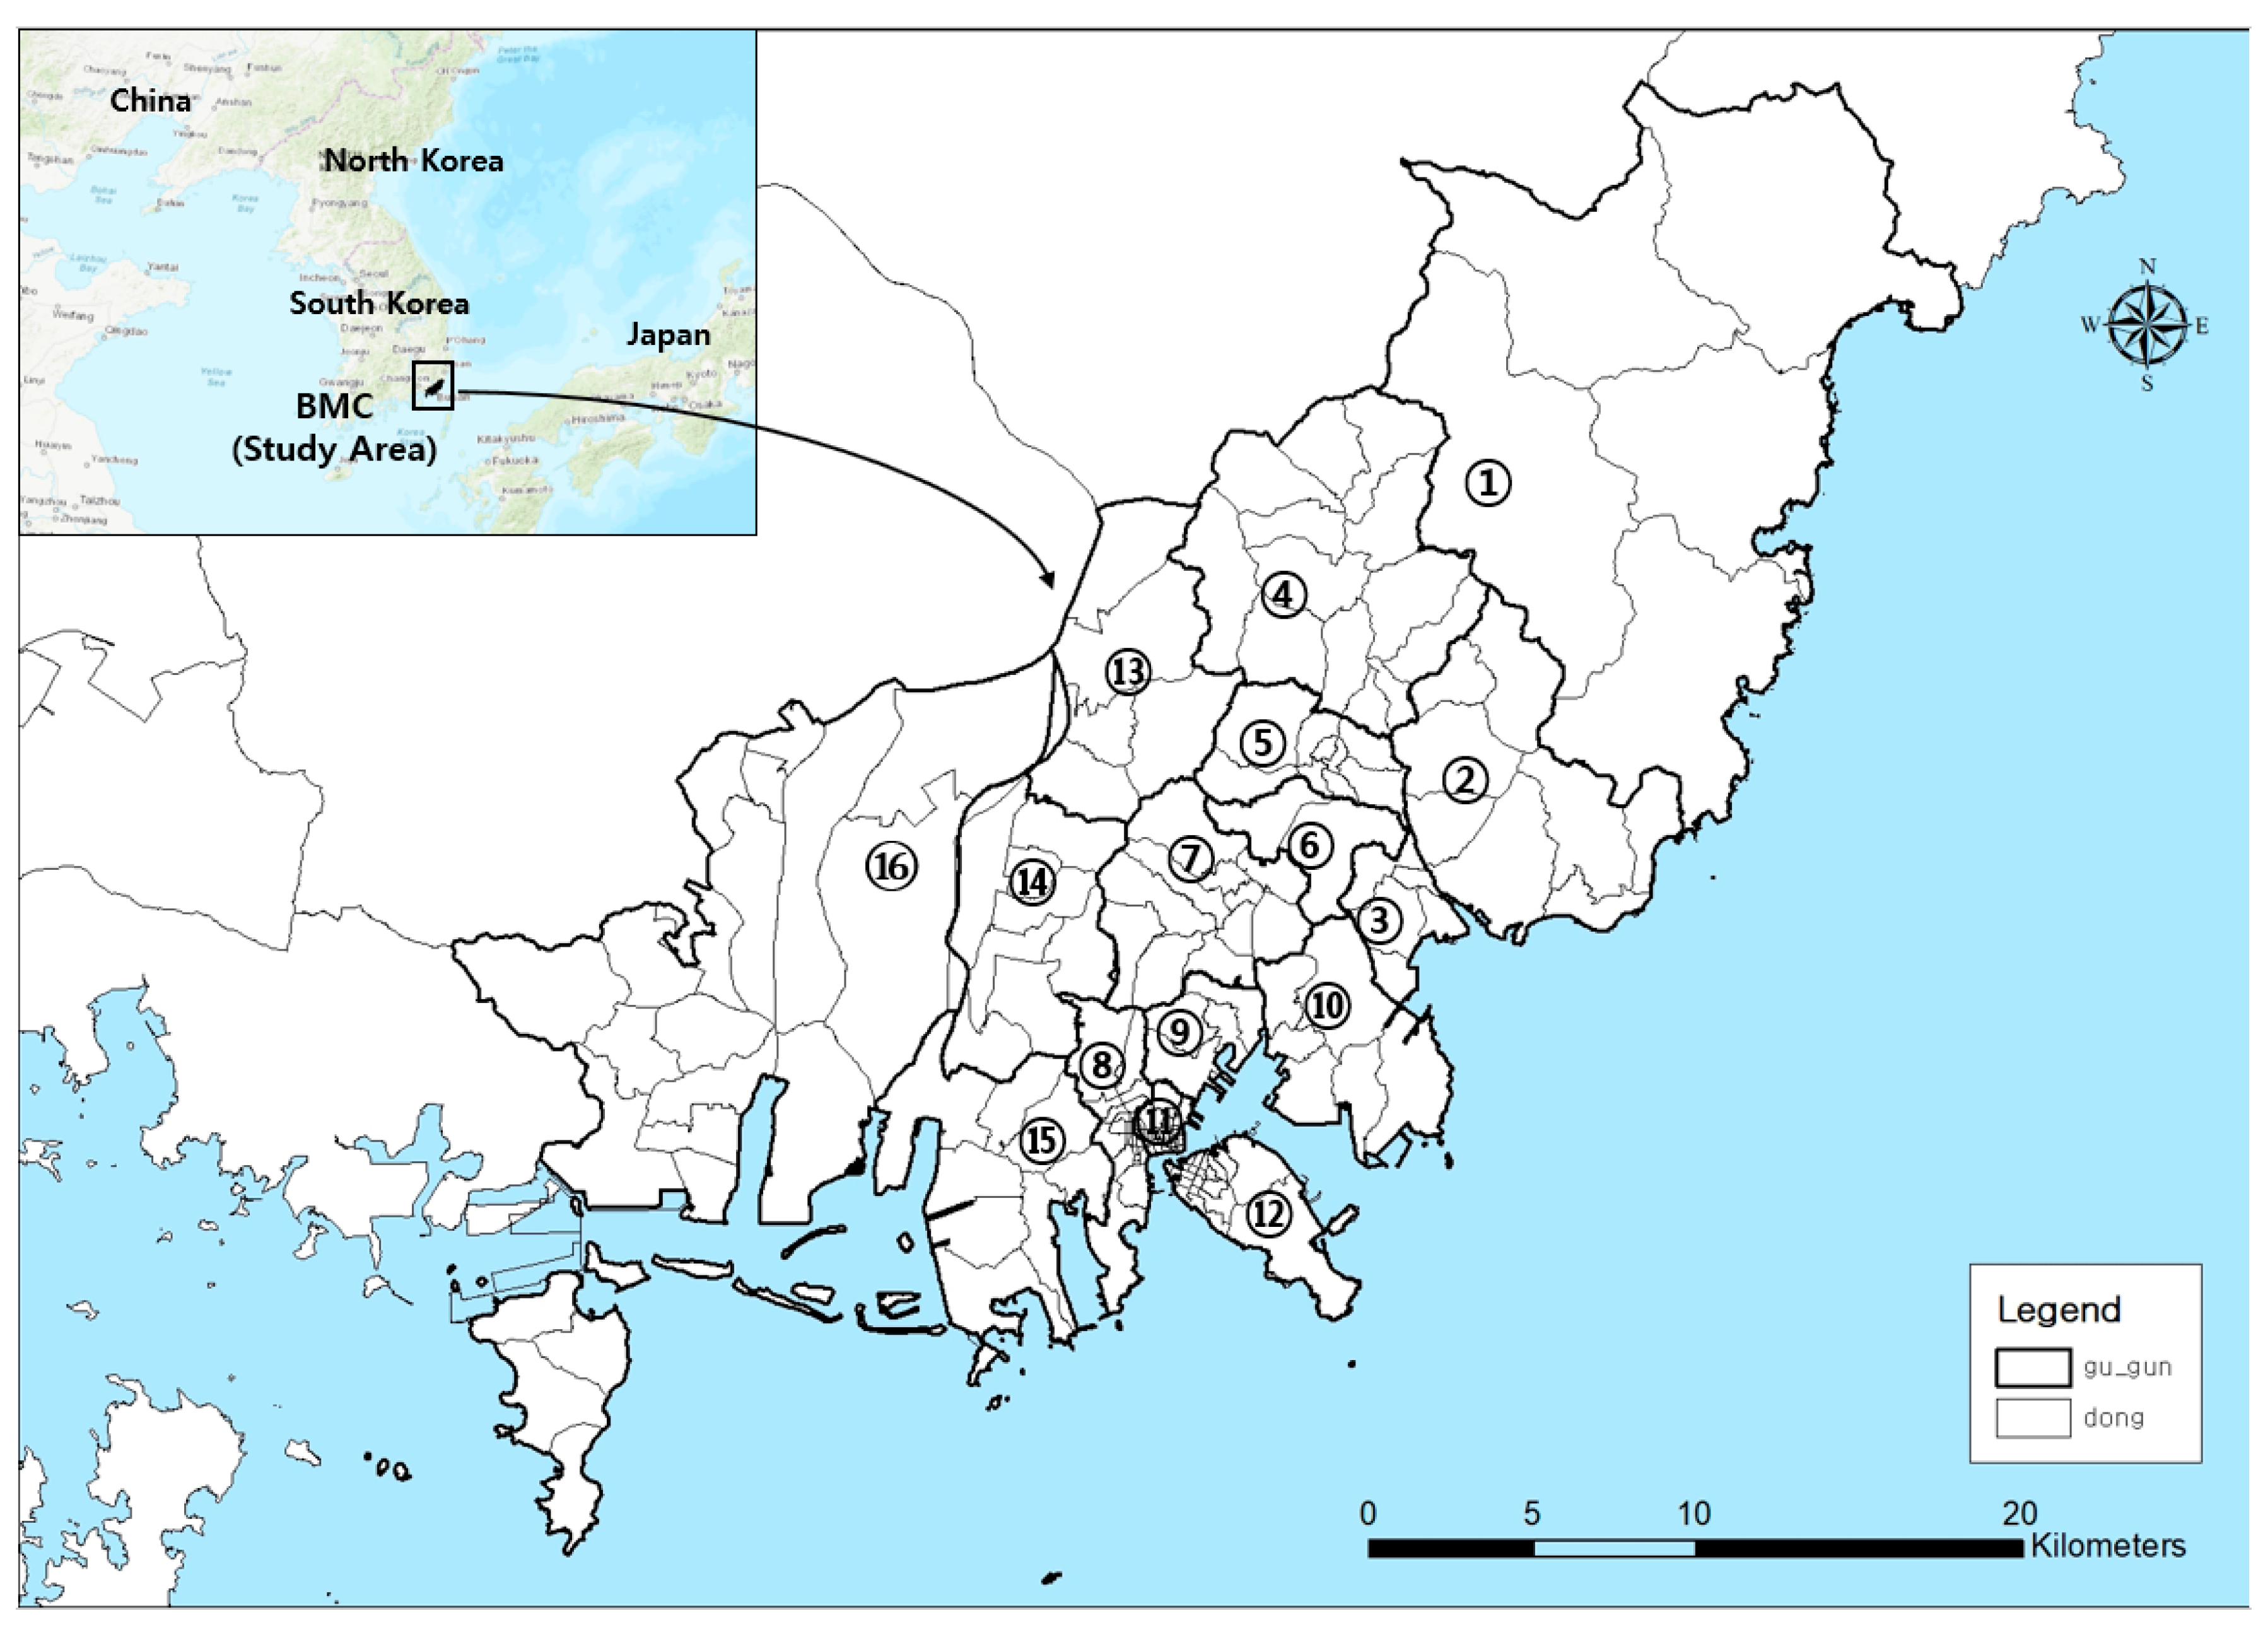
3.1. Study Area

The study area is BMC in South Korea, a representative city where economic and social stagnation persists. BMC is located in the southeastern part of the Korean Peninsula and consists of 16 sub-city administrative areas (gu and gun) and 206 community areas (dong; Figure 1). BMC experienced a rapid increase in population due to unregulated population growth after the Korean War [70] as well as dramatic economic and massive suburban expansion during the high growth period from 1970 to 1980 [71]. Although BMC has been the second-largest city in South Korea since 1914 when cities first began to form, it has experienced significant depopulation, industrial hollowing out and deindustrialization, aging, and gaps in living conditions between the city center and suburban areas. This has led the city to enter a state of economic and social stagnation [70,71].
BMC reveals a growth of 20 years as well as a decline of 20 years based on the data from 2000. These characteristics typically signify economic and population stagnation (see Table A1 and Figure A1 in Appendix A). Further, BMC is a representative city for understanding how urban growth patterns change in big cities that experience a decline after a period of growth. There are three reasons for selecting BMC as the target area for this study. First, BMC is the second-largest city in South Korea. However, despite the general trend of population growth in South Korea, in BMC, there has been a continuous decline since 1995. Second, the youth formed a major segment of BMC’s population previously, but in recent times, the city primarily comprises a rapidly aging population. In 2009, it topped the list of aging cities in South Korea, with the degree of aging increasing by 1% every year. Third, despite South Korea’s continuous economic growth, BMC has not kept pace with other cities. With a shrinking population, the gap in GDP per capita between BMC and other cities in South Korea is gradually increasing. These three reasons constitute the typical characteristics of a declining city.

3.2. Unit of Analysis and Data

The units of analysis used are the community area (dong) and sub-city administrative area (gu/gun). The spatial features of the lowest units are used as bases to identify the spatial patterns of urban growth throughout the city. The community area (dong) is used for studying the population, a 30 m × 30 m grid and the community area (dong) are used for studying urbanization, and the sub-city administrative area (gu/gun) is used for examining migration. The variables, time ranges, and data used for analysis are presented in Table 1.
Three methodologies were used to analyze changes in the patterns of urban growth. First, for spatial clusters of population analysis, the Exploration Spatial Data Analysis (ESDA) method was used. The shape files of the community area (dong) unit were used for the data. The data include the attributes of the population and housing census and were analyzed every 10 years from 1980 to 2020. Second, for the analysis of changes in urbanized patterns, Bachi’s Index and the SDE method were used. The shape files of the community area (dong) unit and a 30 m × 30 m grid file were used for the data. The data include the properties of land cover and population and were analyzed every 10 years from 1980 to 2020. Finally, for the centrality of migration analysis, the Social Network Analysis method was used. The network files for the sub-city administrative area (gu/gun) unit were used for the data. The data include the property of O-D matrix attributes for traffic volume and were analyzed every 10 years from 2000 to 2020 when the data were statistically collected. ArcMap 10.8 and NetMiner 4 software were used for analysis. The flow of the study is presented in Figure 2.

3.3. Exploratory Spatial Data Analysis

Local Moran’s I was used as a local indicator of spatial association (LISA), as proposed by Anselin [72], to identify the spatial concentration based on population quantity. Local Moran’s I can distinguish clusters of spatial features into four types with 95% statistical significance. HH (High-High) indicates that an object with a high value is clustered around a surrounding object with a high value. LL (Low-Low) indicates that an object with a low value is clustered around a surrounding object with a low value. HL (High-Low) indicates that an object with a high value has a spatial correction with a surrounding object with a low value, and LH (Low-High) indicates that an object with a low value has a spatial correction with a surrounding object with a high value [72]. Local Moran’s I was calculated using Equation (1).
I i = ( X i X ¯ ) S i 2 j = 1 ,   j i n w i j ( x j X ¯ ) ,   S i 2 = j = 1 ,   j i n w i j ( ( x j x ¯ ¯ ) 2 n 1
x i : an attribute for feature i; X ¯ : the mean of attribute; W i j : spatial adjacent weight between features i and j; n: total number of features.
This study used the fixed distance band method as the spatially adjacent weight ( W i j ) of the LISA. The fixed distance band method is useful for evaluating the statistical properties of data on a particular spatial scale. The fixed distance was calculated using Ripley’s K function (Equation (2)). Spatially adjacent weight was assigned if the adjacent spatial weight fell within a distance based on the calculated distance.
L ( d ) = A i = 1 n i = 1 , j i n k ( i , j ) π n ( n 1 )

3.4. Bachi’s Index and Standard Deviational Ellipse

This study first compared urbanization patterns from 1980 to 2020 on a 10-year basis using the urbanized area of the 30 m × 30 m land cover maps to determine the changes in urbanization in terms of land use. The urbanized area in the land cover map refers to the developed or built-up area, including residential, industrial, commercial, recreational, and transport areas. Next, the community area (dong) was integrated into areas changing into urban areas, and Bachi’s Index and SDE were applied to identify the forms of spatial changes in urbanization. These two measurement tools are used to derive the spatial distribution characteristics as oblong, principal axis, and ellipsoid in space, using the mean center and the Standard Deviation Distance (SDD) of distribution [73,74]. It is possible to understand, through the average center, how the center of the urbanization area moves, and the concentration of the urbanization area can be understood according to the SDD increase and decrease. Furthermore, the orientation of the variance and concentration of the urbanized area can be determined through the oblong and Standard Deviation Ellipse. The mean center and SDD were calculated according to Equation (3), and oblong was calculated according to Equation (4). The orientation and size of the SDD were calculated according to Equation (5).
X ¯ = i = 1 n q i X i i = 1 n q i , Y ¯ = i = 1 n q i Y i i = 1 n q i , S D D = i = 1 n q i ( X i X ¯ ) 2 + q i ( Y i Y ¯ ) 2 i = 1 n q i
O = 1 2 ( σ x σ y + σ y σ x ) , σ x = i = 1 n q i ( X i X ¯ ) 2 i = 1 n q i   , σ y = i = 1 n q i ( Y i Y ¯ ) 2 i = 1 n q i
t a n 2 α = 2 γ σ x σ y σ x 2 σ y 2   ,   S D E x = i = 1 n ( X i X ¯ ) 2 n   , S D E y = i = 1 n ( Y i Y ¯ ) 2 n
X ¯ , Y ¯ : mean center coordinates; q i : urbanized area of community area i ; X i ,   Y i : coordinates of community area i .

3.5. Social Network Analysis

Regarding sub-city migration within a metropolitan city, the interregional connectivity and centrality of in-migration and out-migration of the population were measured using Social Network Analysis. Social Network Analysis is a method used to describe an overall structure that considers the relational properties between regions [75]. The centrality index refers to the most important node among various nodes in a network [76]. In-migration centrality ( I C i k ) and out-migration centrality ( O C i k ) were calculated according to Equation (6) to identify the centrality distinguishing between in-migration and out-migration, and the eigenvector centrality ( P i ) was calculated according to the same equation to identify centrality considering the relative proportion within the city as a whole.
I C j k = i = 1 n Z i j k = Z j k , O C i k = j = 1 n Z i j k = Z i k , P i = j = 1 N 1 P j P Z j i  

4. Results

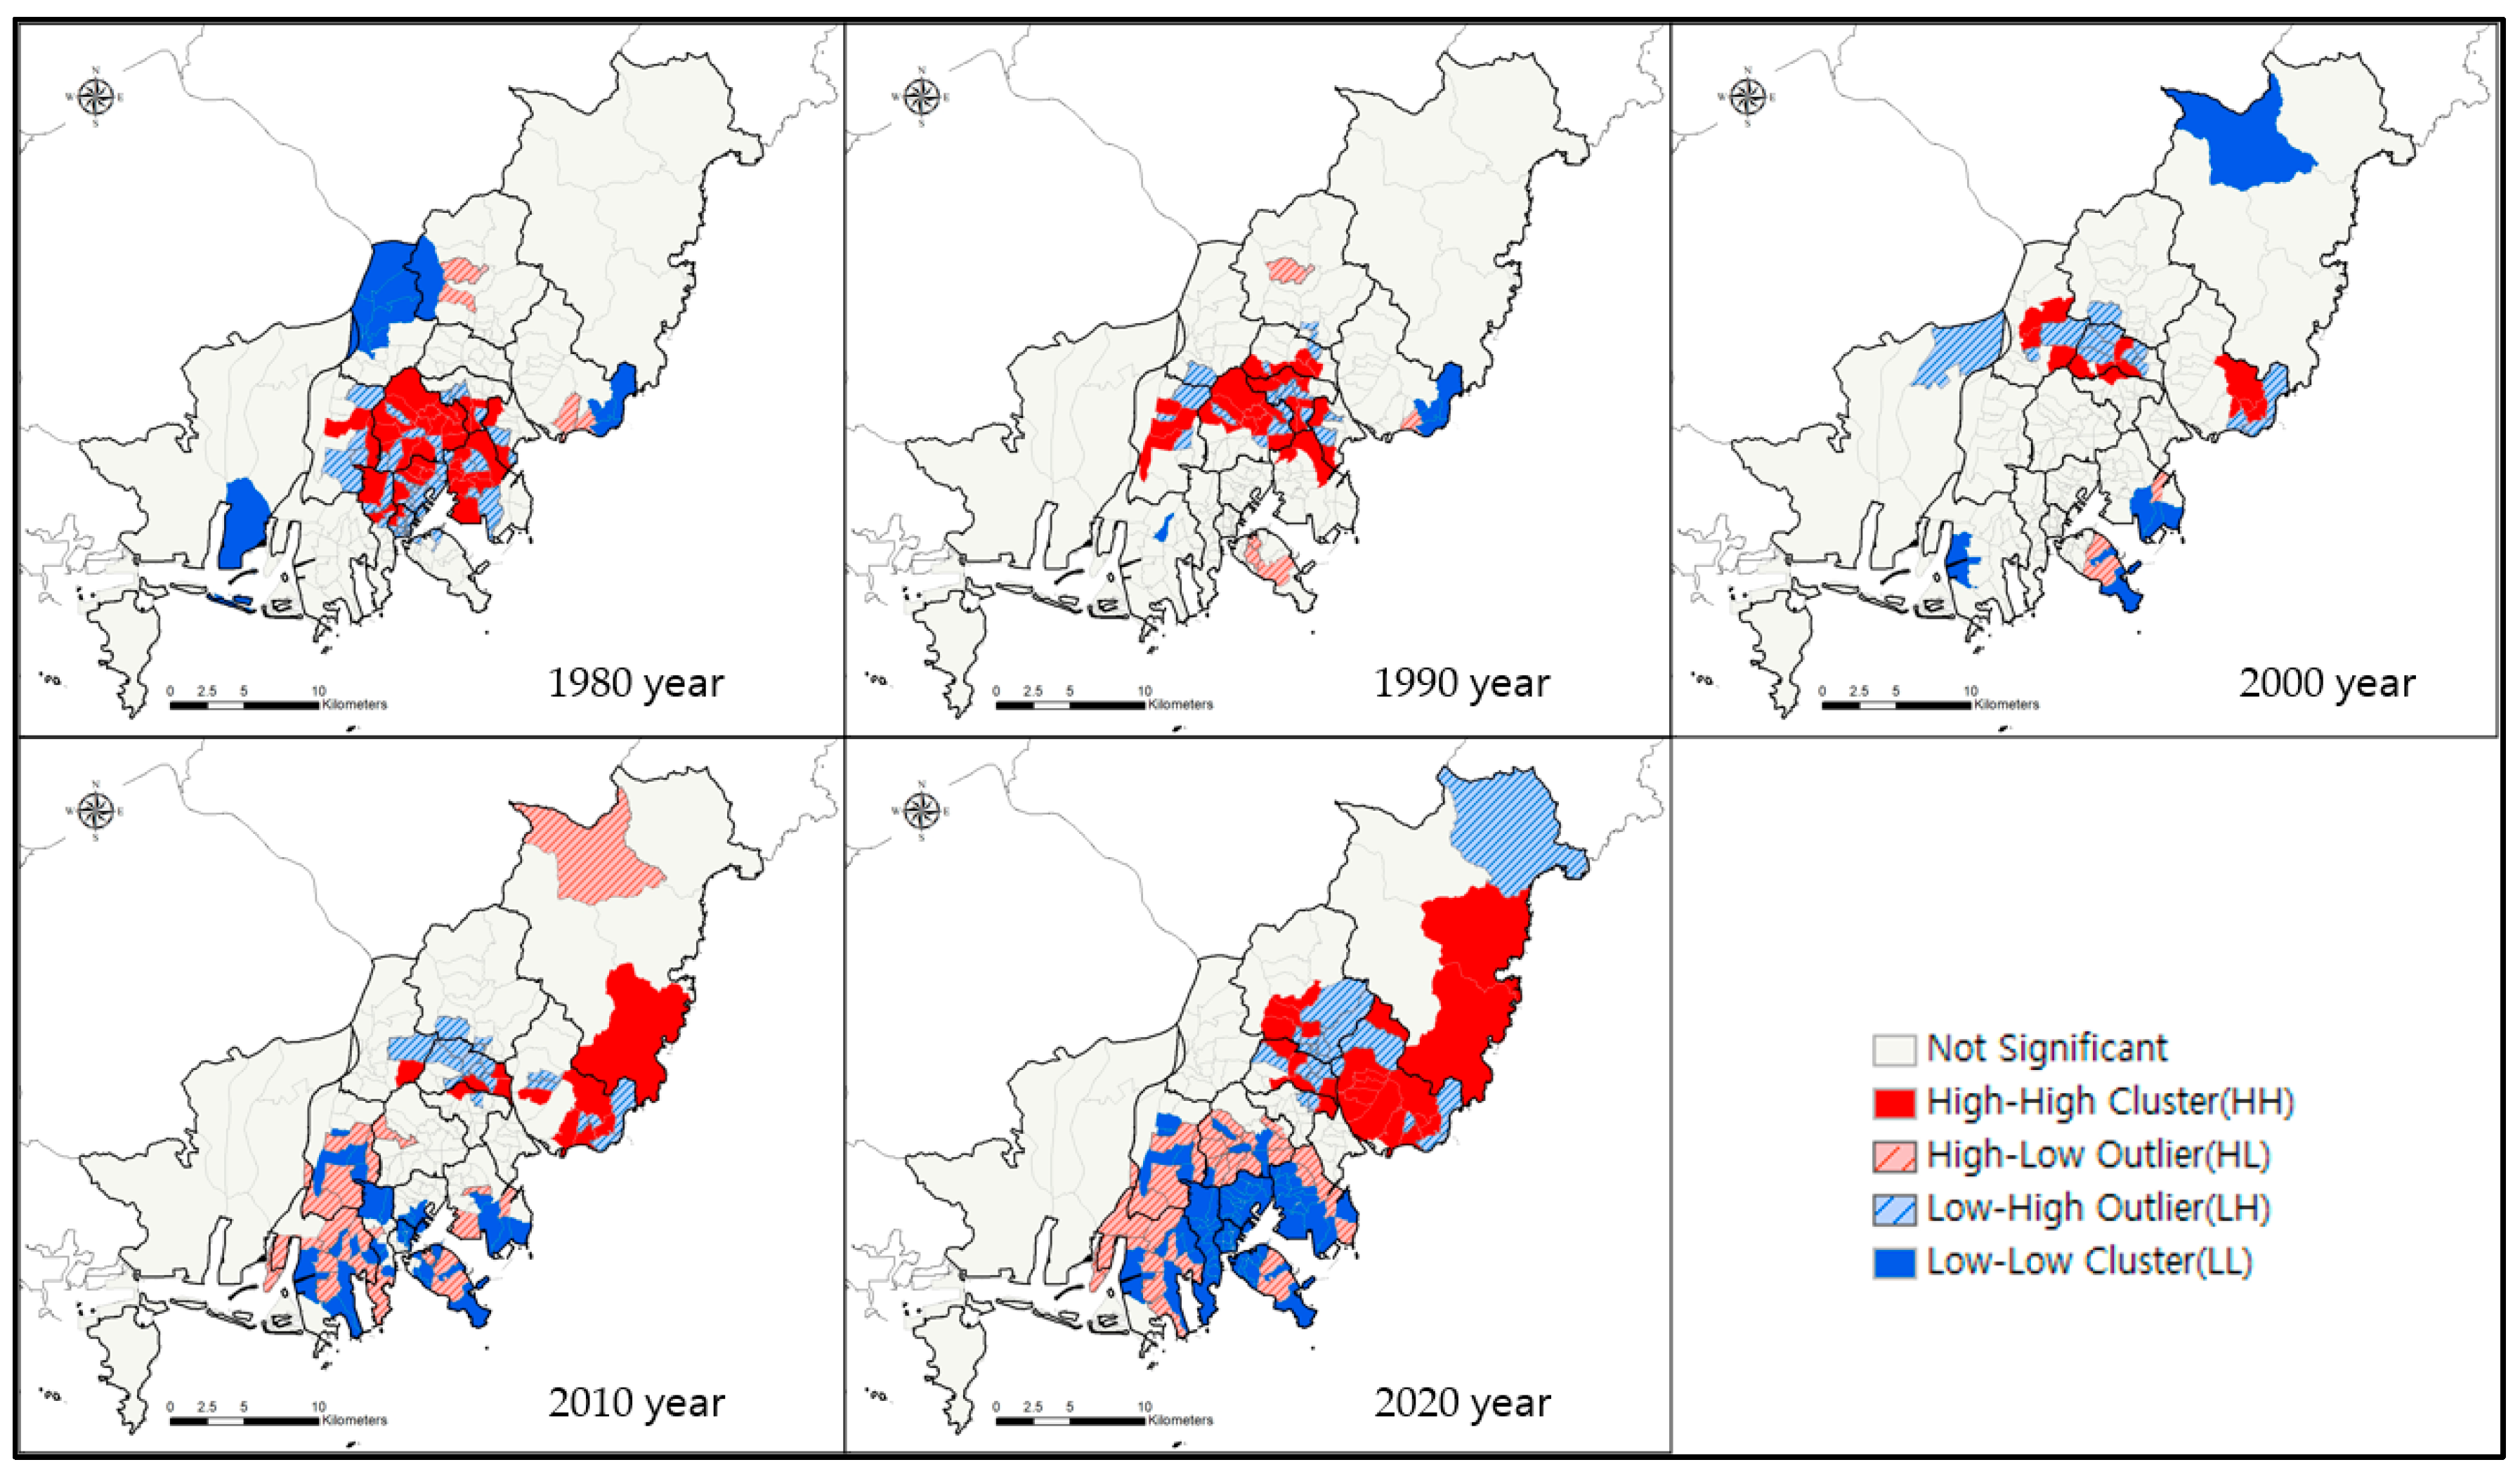
4.1. Spatial Clusters of Population

Figure 3 presents the areas of population concentration from 1980 to 2020 identified using Local Moran’s I. In 1980, an HH cluster of population concentration emerged around the CBD and the surrounding old town (Busanjin-gu, Seo-gu, Dong-gu, Nam-gu, Jung-gu), which had formed around the Busan port. In 1990, the HH cluster moved inland to the northeast of the CBD. However, in 2000, there was no emergence of clusters of populated areas; instead, the clusters tended to be dispersed across the region. Nonetheless, HH clusters appeared in some areas of Haeundae-gu and Buk-gu, which are believed to have been influenced by Hwamyung New Town (Buk-gu) and Haeundae New Town (Haeundae-gu), among others, toward which occupants began to move during the late 1990s. In 2010, population-intensive HH clusters emerged around some parts of Haeundae-gu, Yeonje, and Dongrae in the eastern area of BMC. This is attributed to the influence of Centum City (Haeundae-gu) and Dongbusan New Town (Haeundae-gu and Gijang-gun), among others, which began to develop rapidly after 2005. Many development projects emerged in the outskirts, and the depopulation in the CBD and the surrounding old town accelerated due to the dilapidated infrastructure, resulting in spatial polarization of the eastern and the western areas. The population-intensive HH cluster in 2020 is completely different from that of 1980. Most areas where HH clusters manifested in 1980 exhibited LL clusters, and HH clusters were concentrated in the eastern area of BMC. Table 2 demonstrates that 88.9% of community areas had population-intensive HH clusters in the CBD and the surrounding old town (Busanjin-gu, Seo-gu, Dong-gu, Nam-gu, Jung-gu) in 1980, but this shifted to 82.4% with LL clusters in 2020. Conversely, most of the population-intensive HH clusters in 2020 were found in the eastern areas (Gijang-gun, Haeundae-gu, Geumjeong-gu, Dongrae-gu). Figure 3 and Table 2 can be summarized into two main findings. (1) Between 1980 and 2000, when the city’s population and economy were growing, areas in which the population was concentrated moved to the outskirts of the CBD. (2) Between 2000 and 2020, when economic and population growth was stagnant, such areas moved further to the outer boundaries of the city. As a result, the differences between east and west population-intensive areas were evident.

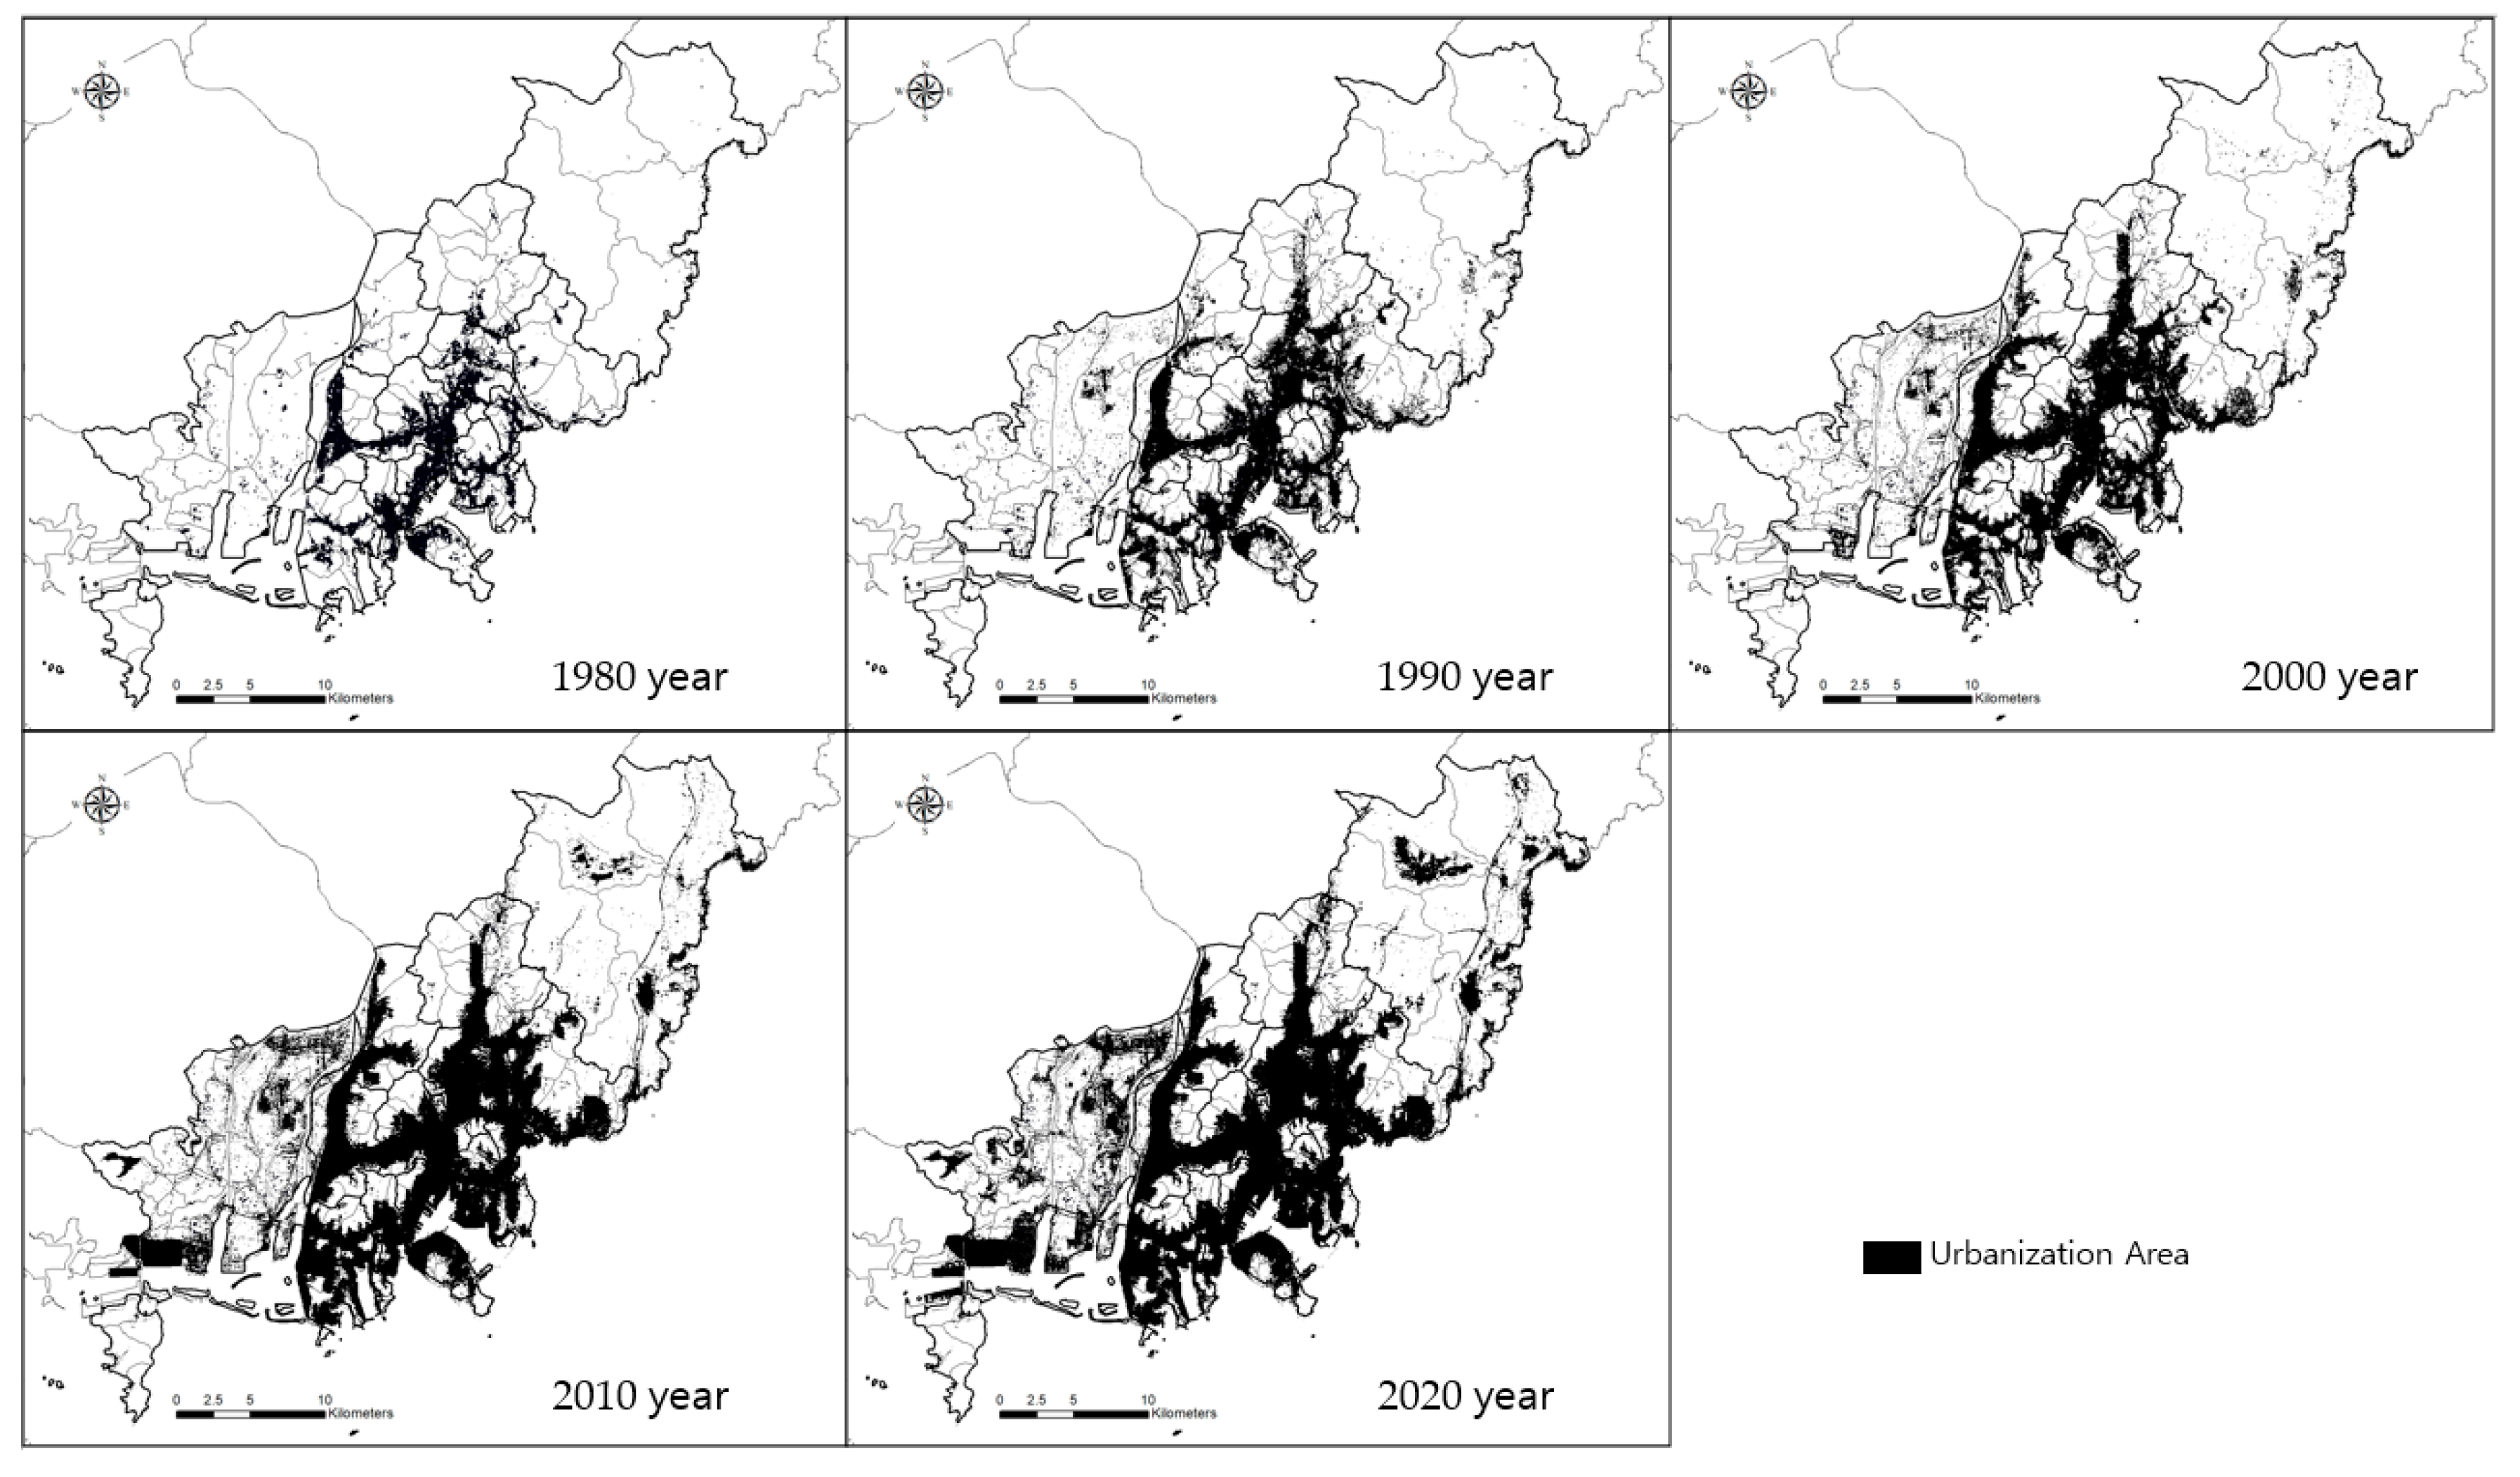
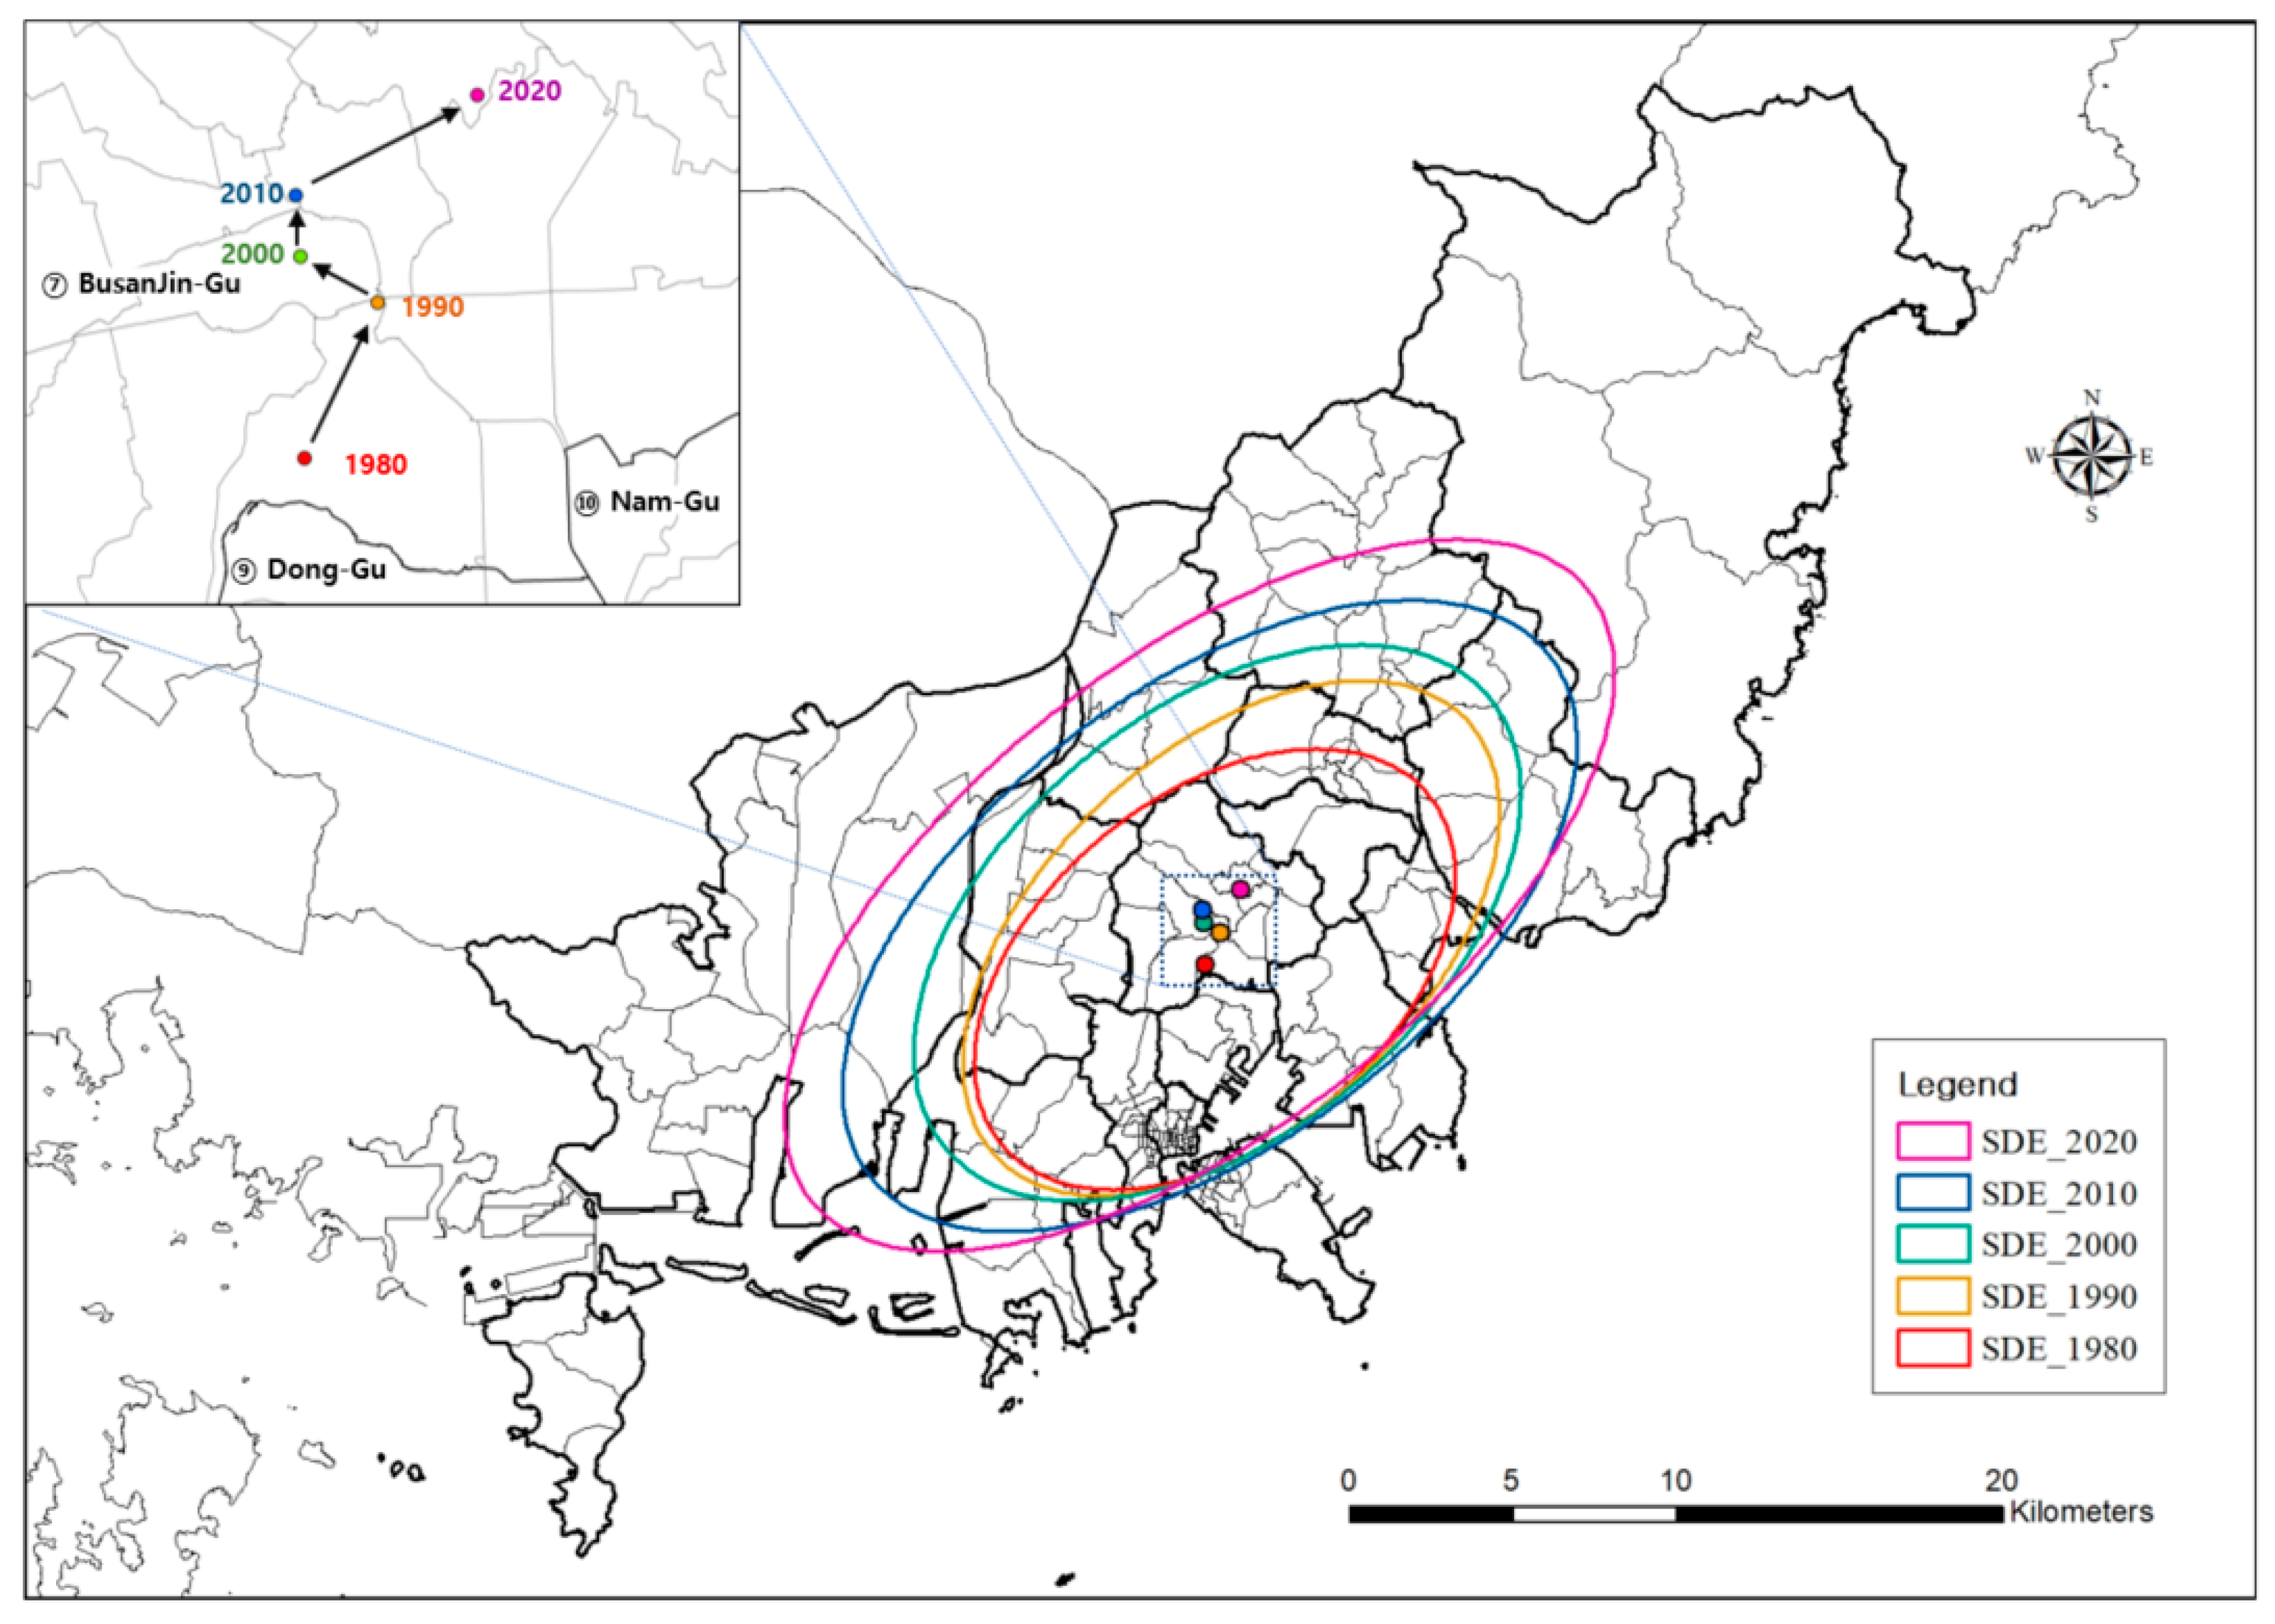
4.2. Changes in Urbanized Patterns

As presented in Figure 4, the urbanized area of BMC has expanded from the CBD and the surrounding old town to the outskirts, which were previously underdeveloped. Compared with 1980, urbanized 30 m × 30 m area units expanded in 1990 to areas such as Dongrae-gu, Haeundae-gu, and Saha-gu. The urbanized area expanded in Haeundae-gu, Buk-gu, and Gangseo-gu in 2000; in Gijang-gun, Haeundae-gu, and Gangseo-gu in 2010; and in Gijang-gun and Gangseo-gu in 2020.
Two facts can be identified by looking at the change in urbanized 30 m × 30 m area units shown in Table 3. First, the urbanized unit was continuously increasing at all times. The urbanized unit increased in two stagnation periods, by 192.48% between 1980 and 2000 during the period of population and economic growth and by 76.98% between 2000 and 2020. In particular, the total area increased further during those stagnation periods. Second, the degree of increase in the urbanized unit at the urban boundary continued, and the gap was even larger when considering the average growth degree. In the case of Gijang-gun, located at the eastern boundary of the city, the rate of increase was 587.68% during the growth period and 494.15% during the stagnation periods, showing the tendency above. Gangseo-gu, located at the western boundary of the city, also followed such a tendency, increasing by 351.07% during the growth period and 247.69% during the two stagnation periods. Gijang-gun, which accounts for 5% of the urbanized units that increased during the growth period, grew to 21% during the two stages, and Gangseo-gu grew from 15% to 33%.
The center and form of the urbanized area, identified using Bachi’s Index, can be seen in Table 3, and the SDE appears in Figure 5. The SDD of Bachi’s Index demonstrates an increase from 6703.9 in 1980 to 10,717.5 in 2020. This indicates that the distribution of urbanization patterns expanded throughout the space. The mean center represents the centrality of the urbanized area, with the average center moving 1087.2 m northeast (64.8°) in 1990 compared with 1980, having moved 569.5 m northwest (149.28°) in 2000, 385.92 m north (94.38°) in 2010, and 1313.1 m east (29.0°) in 2020. The oblong value did not change significantly between 1980 and 2020, indicating that the form of urbanization expansion increased evenly in all directions except the south. The orientation of urbanization expansion progressed in all directions but to varying degrees. As seen in Figure 5, the SDE extended in along the east-west direction, owing to a significant expansion of urbanized areas in Gijang-gun and Gangseo-gu. Compared with 1980, urbanized areas in Gijang-gun increased by 3.986%, and those in Gangseo-gu increased by 1.468%.

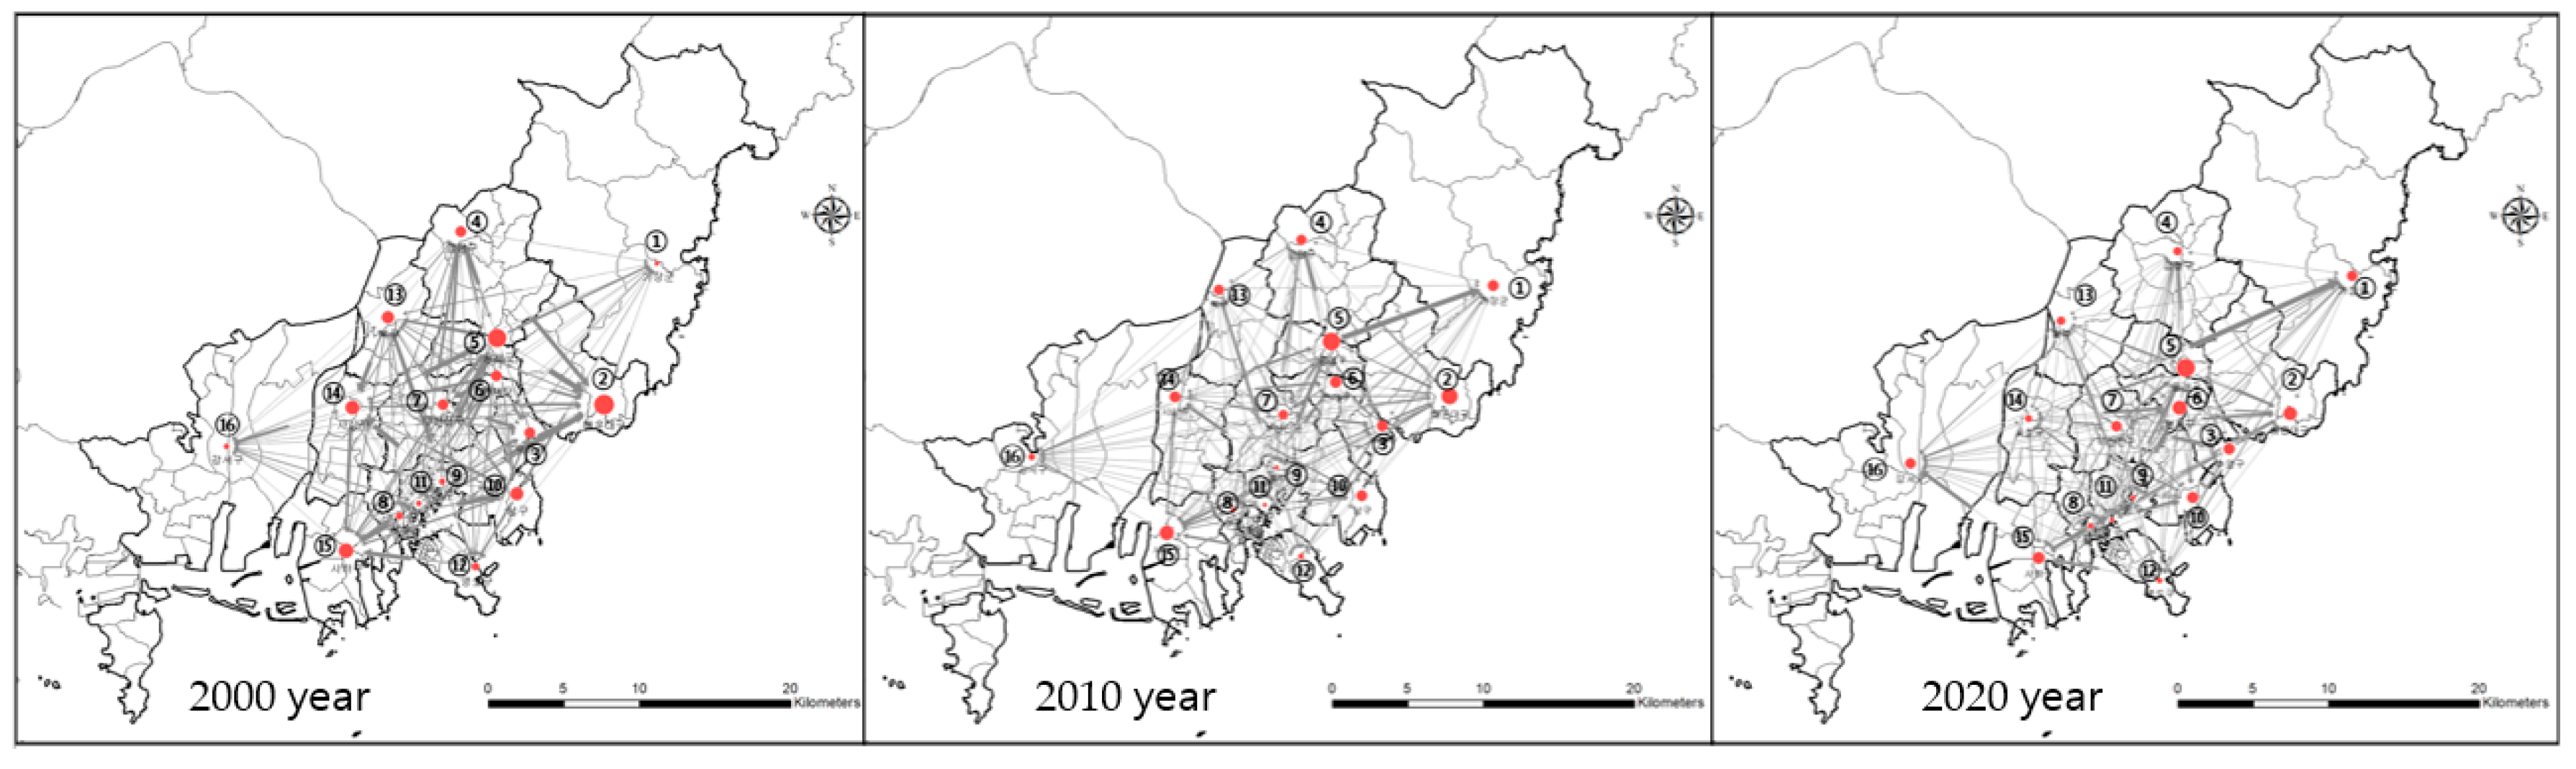
4.3. Centrality of Migration

Figure 6 presents the centrality of migration for BMC in 2000, 2010, and 2020, prepared using Social Network Analysis. The highest figures were seen in Dongrae-gu and Haeundae-gu in all years. Since 2000 was a time of expansion toward the city’s outskirts, population migration was centered on Dongrae-gu and Haeundae-gu in the eastern area of BMC, and the movement toward Gangseo-gu in the western area of BMC also continually increased. Apart from such outskirts, areas in Suyeong-gu and Nam-gu emerged where centrality was higher for in-migration than out-migration. However, similar to the previous analysis, areas of the CBD and the surrounding old town area demonstrated higher centrality for out-migration and movement toward the outskirts.
The results shown in Table 4 also support the movement patterns toward the outskirts. Among the areas located on these outskirts, Haeundae-gu, Gangseo-gu, and Geumjeong-gu demonstrated higher centrality for in-migration than for out-migration in 2000, 2010, and 2020, while Gijang-gun demonstrated higher in-migration than out-migration following 2010. The eigenvector centrality shown in Table 4 indicates the central influence of movement, considering both in-migration and out-migration. Haeundae-gu, Dongrae-gu, Yeonje-gu, Busanjin-gu, Dong-gu, and Sasang-gu were among the areas with high population mobility. Among them, in-migration affected Haeundae-gu, out-migration affected Busanjin-gu, Dong-gu, and Sasang-gu, and both in-migration and out-migration affected Dongrae-gu and Yeonje-gu. The eigenvector centrality, while not high, steadily increased for Gijang-gun and Gangseo-gu due to in-migration.

5. Discussion

5.1. Urban Growth Pattern

This study identified the population and urbanized land cover patterns from 1980 to 2020 in BMC, a representative city in South Korea that is currently experiencing economic and population stagnation following a period of economic and population growth. Until 1990, the population concentration patterns expanded to the outskirts along with population growth; however, the trend toward the outskirts intensified even after 2000, when population and economic stagnation emerged. Particularly in 2020, population polarization was also evident between the CBD and the surrounding old town and the outskirts. The expansion of the urbanized area has manifested in a rapid increase in the volume of built-up area, and the expansion toward the outskirts has further intensified since 2000, when population expansion and economic stagnation occurred. The centrality of the built-up area also moved from near the CBD in 1980 to the outskirts in 2020, with expansion in all directions but to significantly varying degrees in the east and west directions. The population migration analysis also demonstrated high centrality of in-migration in the outskirts.
The urban expansion in BMC identified in this study is similar to the growth pattern of cities found in previous studies, specifically showing the edge growth among the types raised by Richardson and Chang-Hee [20], which have recently begun to be widely discussed. This finding is similar to that of Cengiz et al. [61], who studied Ankara’s urban growth pattern for a similar period, that of Dadashpoor et al. [17] targeting Tabriz, Iran, and that of Zhang et al. [66] targeting Wuhan, China. However, in BMC, economic and population growth, which are the drivers of urban growth, have been stagnant for 20 years. Despite these two stagnations, urban growth patterns with edge expansion appeared in BMC, which was more evident during the period of stagnation rather than during the period of growth.
The results, which show an urban growth pattern similar to that of the sprawl-without-growth concept presented by Wolff et al. [7] and Liu and Meng [54], have two implications. First, despite population loss and aging, the simultaneous migration of the population center to the outskirts and the expansion of urbanized areas indicates strong path dependence in which the behavioral cause of land consumption leading to urbanization follows behaviors based on the past period of growth rather than on rational decision-making. Numerous studies on coordination in the relationship between humans and land present various driving mechanisms in terms of the urban economies of urban human-land change [46,54,77,78]. However, the reinforced movement and expansion toward the outskirts despite the absence of population and economic growth, which are considered fundamental forces for the expansion of urbanized areas, can be understood as a manifestation of the path dependence of urban sprawl, as presented by Atkinson and Oleson [79], in the development-inducing urban growth management planning and policy of the local government. This implies that the phenomenon of path dependence, demonstrated in the bottom-up process of land consumption by each actor, as presented in the discussion by Brown et al. [80], is projected to the urban growth pattern as a result.
Second, urban growth management policies and planning to date aim to effectively induce the allocation of various sizes of land in cities [81]. In particular, urban growth management approaches for managing the urbanization process have focused on finding an appropriate balance between the negative and positive effects of urbanization [82]. The results of this study, which demonstrate a simultaneous pattern of population loss and expansion to the outskirts, show that even within a single city, the expansion of abandoned spaces and polarization between spaces may have negative effects. This means that in discussions of conventional suburbanization, the hollowed-out core and growing hinterland phenomena between urban and rural areas can emerge within a single metropolitan city [43,83,84], which suggests the need for a shift in policy and planning orientation to recognize different urban growth patterns and their consequent negative effects on cities facing population decline and aging following a period of growth and the need to consider them in the course of urban growth management.

5.2. Contributions

This study contributes to the field by providing empirical examples of what happens when cities in developing counties that are currently growing rapidly show stagnant growth. Existing studies have focused on identifying growth patterns between urban and suburban areas under circumstances of economic and population growth. However, many cities face economic and population stagnation or decline after a period of growth. In this regard, existing studies are limited in that they have not been able to present the dynamics of how urban growth patterns change in such circumstances. As a city that experienced both rapid growth and staging, BMC was a suitable case study for identifying changes according to the situation. This study found that BMC followed existing urban growth patterns and that those patterns were, in fact, strengthened. Only 5.8% of the total area remains to be developed [85], which means that the city has reached the limits of urban growth. This shows that urban planning tools should be developed and applied to prepare for the rapid expansion of cities in developing counties while in an economically stagnant period and help them achieve sustainability.

5.3. Limitations and Recommendations for Future Work

Although this study identifies patterns of change in population and urban expansion over 40 years, it cannot explain the cause of such change based on rationales. Despite population and economic stagnation, there are various economic and social driving forces in the urban expansion of land development and population concentration toward the outskirts. In particular, discussions are needed on the path-dependent characteristics of the local government, which requires a qualitative study of the institution and policy decisions associated with urban growth management policy and planning. In addition, this study is limited in that it targets one city, BMC, in which the representative shrinkage of South Korea is seen. BMC was chosen because it is a city where the population is rapidly flowing out and where super-aging was first expected in South Korea. While it is significant to find that new patterns can emerge in a city, future research must be conducted on multiple cities with similar conditions to develop more generalized patterns. Finally, patterns between 1980 and 2000 could not be identified in this study in terms of understanding the characteristics of population migration due to data limitations.

Author Contributions

Conceptualization, H.K. and D.K.; methodology, H.K.; software, H.K.; formal analysis, H.K. and D.K.; writing—original draft preparation, H.K. and D.K.; writing—review and editing, D.K.; visualization, H.K.; funding acquisition, D.K. All authors have read and agreed to the published version of the manuscript.

Funding

This research was funded by the Basic Science Research Program through the National Research Foundation of Korea (NRF), funded by the Ministry of Education, grant number 2020R1I1A3056561.

Institutional Review Board Statement

Not applicable.

Informed Consent Statement

Not applicable.

Data Availability Statement

All data were provided by Statistics Korea (kosis.kr).

Conflicts of Interest

The authors declare no conflict of interest.

Appendix A

Table A1. Population in BMC and Korea.
YearPopulationElderly Population (Above 65 Years of Age)
(A) BMC(B) KoreaRatio (A/B)(C) BMC(D) KoreaRatio
(C/A)
Ratio
(D/B)
19752,580,47234,706,6207.44%48,8981,206,5991.89%3.48%
19803,248,23237,436,3158.68%71,1451,446,1142.19%3.86%
19853,595,40540,448,4868.89%91,7071,749,5492.55%4.33%
19903,854,96043,410,8998.88%127,1302,162,2393.30%4.98%
19953,883,88045,858,0298.47%172,3892,640,2054.44%5.76%
19963,867,12546,266,2568.36%181,0452,715,5984.68%5.87%
19973,851,31246,684,0698.25%190,0782,829,6744.94%6.06%
19983,829,09846,991,1718.15%199,6222,959,9575.21%6.30%
19993,817,27047,335,6788.06%210,2783,103,5125.51%6.56%
20003,796,50647,732,5587.95%222,6973,268,0585.87%6.85%
20013,770,53648,021,5437.85%235,6093,444,5426.25%7.17%
20023,730,12548,229,9487.73%248,3933,623,0486.66%7.51%
20033,691,44548,386,8237.63%261,4393,808,8057.08%7.87%
20043,666,34548,583,8057.55%277,0814,014,9657.56%8.26%
20053,638,29348,782,2747.46%294,3564,224,7358.09%8.66%
20063,611,99248,991,7797.37%312,4024,440,6298.65%9.06%
20073,587,43949,268,9287.28%333,7564,709,1059.30%9.56%
20083,564,57749,540,3677.20%354,5664,965,3759.95%10.02%
20093,543,03049,773,1457.12%372,7055,168,49110.52%10.38%
20103,567,91050,515,6667.06%388,0475,348,18210.88%10.59%
20113,550,96350,734,2847.00%402,5115,525,63011.34%10.89%
20123,538,48450,948,2726.95%422,5755,759,79311.94%11.31%
20133,527,63551,141,4636.90%446,8776,030,55512.67%11.79%
20143,519,40151,327,9166.86%471,4656,296,93113.40%12.27%
20153,513,77751,529,3386.82%494,5836,552,52814.08%12.72%
20163,498,52951,696,2166.77%515,9186,781,15914.75%13.12%
20173,470,65351,778,5446.70%540,9557,066,20115.59%13.65%
20183,441,45351,826,0596.64%567,6037,389,47416.49%14.26%
20193,413,84151,849,8616.58%594,4047,718,61617.41%14.89%
20203,391,94651,829,0236.54%627,7248,134,67518.51%15.70%
Note: Data were drawn from Statistics Korea, and the population was adjusted according to the present spatial scope.
Figure A1. GDP per capita (unit: 1000 won; base year: 2015). Note: Data were drawn from Statistics Korea.
Land 11 01319 g0a1

References

  1. United Nations Department of Economic and Social Affairs Population Division. World Urbanization Prospects: The 2018 Revision (ST/ESA/SER.A/420); United Nations: New York, NY, USA, 2019. [Google Scholar]
  2. Gu, C. Urbanization: Processes and driving forces. Sci. China Earth Sci. 2019, 62, 1351–1360. [Google Scholar] [CrossRef]
  3. Henderson, V. The Urbanization Process and Economic Growth: The So-What Question. J. Econ. Growth 2003, 8, 47–71. [Google Scholar] [CrossRef]
  4. Wang, J.-F.; Liu, X.-H.; Peng, L.; Chen, H.-Y.; Driskell, L.; Zheng, X.-Y. Cities evolution tree and applications to predicting urban growth. Popul. Environ. 2012, 33, 186–201. [Google Scholar] [CrossRef]
  5. Gollin, D.; Jedwab, R.; Vollrath, D. Urbanization with and without industrialization. J. Econ. Growth 2016, 21, 35–70. [Google Scholar] [CrossRef]
  6. Datt, G.; Ravallion, M.; Murgai, R. Growth, Urbanization, and Poverty Reduction in India (Policy Research Working Paper; No.7568); World Bank: Washington, DC, USA, 2016. [Google Scholar]
  7. Wolff, M.; Haase, D.; Haase, A. Compact or spread? A quantitative spatial model of urban areas in Europe since 1990. PLoS ONE 2018, 13, e0192326. [Google Scholar] [CrossRef]
  8. Guastella, G.; Oueslati, W.; Pareglio, S. Patterns of Urban Spatial Expansion in European Cities. Sustainability 2019, 11, 2247. [Google Scholar] [CrossRef]
  9. Li, Y.; Kong, X.; Zhu, Z. Multiscale analysis of the correlation patterns between the urban population and construction land in China. Sustain. Cities Soc. 2020, 61, 102326. [Google Scholar] [CrossRef]
  10. Bren D'Amour, C.; Reitsma, F.; Baiocchi, G.; Barthel, S.; Güneralp, B.; Erb, K.-H.; Haberl, H.; Creutzig, F.; Seto, K.C. Future urban land expansion and implications for global croplands. Proc. Natl. Acad. Sci. USA 2017, 114, 8939–8944. [Google Scholar] [CrossRef]
  11. Deng, H.; Zhang, K.; Wang, F.; Dang, A. Compact or disperse? Evolution patterns and coupling of urban land expansion and population distribution evolution of major cities in China, 1998–2018. Habitat Int. 2021, 108, 102324. [Google Scholar] [CrossRef]
  12. Kim, K.-H.; Mills, E.S. Korean development and urbanization: Prospects and problems. World Dev. 1988, 16, 157–167. [Google Scholar] [CrossRef]
  13. Kim, K.W.; Kim, O.S. Super Aging in South Korea Unstoppable but Mitigatable: A Sub-National Scale Population Projection for Best Policy Planning. Spat. Demogr. 2020, 8, 155–173. [Google Scholar] [CrossRef] [PubMed]
  14. Hwang, U.; Woo, M. Analysis of Inter-Relationships between Urban Decline and Urban Sprawl in City-Regions of South Korea. Sustainability 2020, 12, 1656. [Google Scholar] [CrossRef]
  15. Joo, Y.-M.; Seo, B.K. Dual policy to fight urban shrinkage: Daegu, South Korea. Cities 2018, 73, 128–137. [Google Scholar] [CrossRef]
  16. Galster, G.; Hanson, R.; Ratcliffe, M.R.; Wolman, H.; Coleman, S.; Freihage, J. Wrestling Sprawl to the Ground: Defining and measuring an elusive concept. Hous. Policy Debate 2001, 12, 681–717. [Google Scholar] [CrossRef]
  17. Dadashpoor, H.; Azizi, P.; Moghadasi, M. Analyzing spatial patterns, driving forces and predicting future growth scenarios for supporting sustainable urban growth: Evidence from Tabriz metropolitan area, Iran. Sustain. Cities Soc. 2019, 47, 101502. [Google Scholar] [CrossRef]
  18. Steurer, M.; Bayr, C. Measuring urban sprawl using land use data. Land Use Policy 2020, 97, 104799. [Google Scholar] [CrossRef]
  19. Hamidi, S.; Ewing, R. A longitudinal study of changes in urban sprawl between 2000 and 2010 in the United States. Landsc. Urban Plan. 2014, 128, 72–82. [Google Scholar] [CrossRef]
  20. Richardson, H.W.; Chang-Hee, C.B. Urban Sprawl in Western Europe and the United States; Ashgate: Aldershot, UK, 2004. [Google Scholar]
  21. Xu, C.; Liu, M.; Zhang, C.; An, S.; Yu, W.; Chen, J.M. The spatiotemporal dynamics of rapid urban growth in the Nanjing metropolitan region of China. Landsc. Ecol. 2007, 22, 925–937. [Google Scholar] [CrossRef]
  22. Lei, Y.; Flacke, J.; Schwarz, N. Does Urban planning affect urban growth pattern? A case study of Shenzhen, China. Land Use Policy 2021, 101, 105100. [Google Scholar] [CrossRef]
  23. Kasanko, M.; Barredo, J.I.; Lavalle, C.; McCormick, N.; Demicheli, L.; Sagris, V.; Brezger, A. Are European cities becoming dispersed?: A comparative analysis of 15 European urban areas. Landsc. Urban Plan. 2006, 77, 111–130. [Google Scholar] [CrossRef]
  24. Patacchini, E.; Zenou, Y. Urban sprawl in Europe. Brook. Whart. Pap. Urban Aff. 2009, 10, 125–149. [Google Scholar]
  25. Sapena, M.; Ruiz, L.A. Identifying urban growth patterns through land-use/land-cover spatio-temporal metrics: Simulation and analysis. Int. J. Geogr. Inf. Sci. 2021, 35, 375–396. [Google Scholar] [CrossRef]
  26. Pan, H.; Deal, B.; Chen, Y.; Hewings, G. A Reassessment of urban structure and land-use patterns: Distance to CBD or network-based?—Evidence from Chicago. Reg. Sci. Urban Econ. 2018, 70, 215–228. [Google Scholar] [CrossRef]
  27. Jenberu, A.A.; Admasu, T.G. Urbanization and land use pattern in Arba Minch town, Ethiopia: Driving forces and challenges. GeoJournal 2020, 85, 761–778. [Google Scholar] [CrossRef]
  28. Clark, C. Urban Population Densities. J. R. Stat. Soc. Ser. A 1951, 114, 490. [Google Scholar] [CrossRef]
  29. Newling, B.E. The Spatial Variation of Urban Population Densities. Geogr. Rev. 1969, 59, 242. [Google Scholar] [CrossRef]
  30. Bussière, R.; Snickars, F. Derivation of the Negative Exponential Model by an Entropy Maximising Method. Environ. Plan. A Econ. Space 1970, 2, 295–301. [Google Scholar] [CrossRef]
  31. Batty, M.; Longley, P.; Fotheringham, S. Urban Growth and Form: Scaling, Fractal Geometry, and Diffusion-Limited Aggregation. Environ. Plan. A Econ. Space 1989, 21, 1447–1472. [Google Scholar] [CrossRef]
  32. Hu, D.; Huang, S.-L.; Feng, Q.; Li, F.; Zhao, J.-J.; Zhao, Y.-H.; Wang, B.-N. Relationships between rapid urban development and the appropriation of ecosystems in Jiangyin City, Eastern China. Landsc. Urban Plan. 2008, 87, 180–191. [Google Scholar] [CrossRef]
  33. Huang, Q.; Yang, Y.; Li, Y.; Gao, B. A Simulation Study on the Urban Population of China Based on Nighttime Light Data Acquired from DMSP/OLS. Sustainability 2016, 8, 521. [Google Scholar] [CrossRef]
  34. Luo, J.; Xing, X.; Wu, Y.; Zhang, W.; Chen, R.S. Spatio-temporal analysis on built-up land expansion and population growth in the Yangtze River Delta Region, China: From a coordination perspective. Appl. Geogr. 2018, 96, 98–108. [Google Scholar] [CrossRef]
  35. Alalouch, C.; Al-Hajri, S.; Naser, A.; Al Hinai, A. The impact of space syntax spatial attributes on urban land use in Muscat: Implications for urban sustainability. Sustain. Cities Soc. 2019, 46, 101417. [Google Scholar] [CrossRef]
  36. Brueckner, J.K. Urban Sprawl: Diagnosis and Remedies. Int. Reg. Sci. Rev. 2000, 23, 160–171. [Google Scholar] [CrossRef]
  37. Siedentop, S.; Fina, S. Who Sprawls Most? Exploring the Patterns of Urban Growth across 26 European Countries. Environ. Plan. A Econ. Space 2012, 44, 2765–2784. [Google Scholar] [CrossRef]
  38. Sahana, M.; Hong, H.; Sajjad, H. Analyzing urban spatial patterns and trend of urban growth using urban sprawl matrix: A study on Kolkata urban agglomeration, India. Sci. Total Environ. 2018, 628–629, 1557–1566. [Google Scholar] [CrossRef]
  39. Batty, M. The Size, Scale, and Shape of Cities. Science 2008, 319, 769–771. [Google Scholar] [CrossRef]
  40. Santé, I.; García, A.M.; Miranda, D.; Crecente, R. Cellular automata models for the simulation of real-world urban processes: A review and analysis. Landsc. Urban Plan. 2010, 96, 108–122. [Google Scholar] [CrossRef]
  41. Oueslati, W.; Alvanides, S.; Garrod, G. Determinants of urban sprawl in European cities. Urban Stud. 2015, 52, 1594–1614. [Google Scholar] [CrossRef]
  42. Gao, J.; O’Neill, B.C. Data-driven spatial modeling of global long-term urban land development: The SELECT model. Environ. Model. Softw. 2019, 119, 458–471. [Google Scholar] [CrossRef]
  43. Haase, D.; Nuissl, H. The urban-to-rural gradient of land use change and impervious cover: A long-term trajectory for the city of Leipzig. J. Land Use Sci. 2010, 5, 123–141. [Google Scholar] [CrossRef]
  44. Gottdiener, M.; Budd, L. Key Concepts in Urban Studies; SAGE Publications Ltd.: London, UK, 2005. [Google Scholar]
  45. Seto, K.C.; Parnell, S.; Elmqvist, T. A global outlook on urbanization. In Urbanization, Biodiversity and Ecosystem Services: Challenges and Opportunities; Elmqvist, T., Fragkias, M., Goodness, J., Güneralp, B., Marcotullio, P.J., McDonald, R.I., Parnell, S., Schewenius, M., Sendstad, M., Seto, K.C., et al., Eds.; Springer: New York, NY, USA, 2013; pp. 1–12. [Google Scholar] [CrossRef]
  46. Baum-Snow, N.; Pavan, R. Inequality and City Size. Rev. Econ. Stat. 2013, 95, 1535–1548. [Google Scholar] [CrossRef]
  47. Angel, S.; Parent, J.; Civco, D.L.; Blei, A.; Potere, D. The dimensions of global urban expansion: Estimates and projections for all countries, 2000–2050. Prog. Plan. 2011, 75, 53–107. [Google Scholar] [CrossRef]
  48. Zhang, T. Land market forces and government's role in sprawl. Cities 2000, 17, 123–135. [Google Scholar] [CrossRef]
  49. Anas, A.; Rhee, H.-J. When are urban growth boundaries not second-best policies to congestion tolls? J. Urban Econ. 2007, 61, 263–286. [Google Scholar] [CrossRef]
  50. Huang, Z.; Wei, Y.D.; He, C.; Li, H. Urban land expansion under economic transition in China: A multi-level modeling analysis. Habitat Int. 2015, 47, 69–82. [Google Scholar] [CrossRef]
  51. Loo, B.P.Y.; Chow, A.S.Y. Changing Urban Form in Hong Kong: What Are the Challenges on Sustainable Transportation? Int. J. Sustain. Transp. 2008, 2, 177–193. [Google Scholar] [CrossRef]
  52. Zhao, S.; Liu, S.; Xu, C.; Yuan, W.; Sun, Y.; Yan, W.; Zhao, M.; Henebry, G.M.; Fang, J. Contemporary evolution and scaling of 32 major cities in China. Ecol. Appl. 2018, 28, 1655–1668. [Google Scholar] [CrossRef]
  53. Ramyar, R.; Zarghami, E.; Bryant, M. Spatio-temporal planning of urban neighborhoods in the context of global climate change: Lessons for urban form design in Tehran, Iran. Sustain. Cities Soc. 2019, 51, 101554. [Google Scholar] [CrossRef]
  54. Liu, L.; Meng, L. Patterns of Urban Sprawl from a Global Perspective. J. Urban Plan. Dev. 2020, 146, 04020004. [Google Scholar] [CrossRef]
  55. Wolff, M.; Haase, A.; Haase, D.; Kabisch, N. The impact of urban growth on the built environment. Urban Stud. 2017, 54, 2683–2700. [Google Scholar] [CrossRef]
  56. Kabisch, N.; Haase, D.; Haase, A. Evolving Reurbanisation? Spatio-temporal Dynamics as Exemplified by the East German City of Leipzig. Urban Stud. 2010, 47, 967–990. [Google Scholar] [CrossRef]
  57. Cheshire, P.C. Resurgent Cities, Urban Myths and Policy Hubris: What We Need to Know. Urban Stud. 2006, 43, 1231–1246. [Google Scholar] [CrossRef]
  58. Jia, M.; Zhang, H.; Yang, Z. Compactness or sprawl: Multi-dimensional approach to understanding the urban growth patterns in Beijing-Tianjin-Hebei region, China. Ecol. Indic. 2022, 138, 108816. [Google Scholar] [CrossRef]
  59. He, Q.; Zeng, C.; Xie, P.; Tan, S.; Wu, J. Comparison of urban growth patterns and changes between three urban agglomerations in China and three metropolises in the USA from 1995 to 2015. Sustain. Cities Soc. 2019, 50, 101649. [Google Scholar] [CrossRef]
  60. Xu, G.; Jiao, L.; Yuan, M.; Dong, T.; Zhang, B.; Du, C. How does urban population density decline over time? An exponential model for Chinese cities with international comparisons. Landsc. Urban Plan. 2019, 183, 59–67. [Google Scholar] [CrossRef]
  61. Cengiz, S.; Görmüş, S.; Oğuz, D. Analysis of the urban growth pattern through spatial metrics; Ankara City. Land Use Policy 2022, 112, 105812. [Google Scholar] [CrossRef]
  62. Dou, P.; Chen, Y. Dynamic monitoring of land-use/land-cover change and urban expansion in Shenzhen using Landsat imagery from 1988 to 2015. Int. J. Remote Sens. 2017, 38, 5388–5407. [Google Scholar] [CrossRef]
  63. Verstegen, J.A.; Goch, K. Pattern-oriented calibration and validation of urban growth models: Case studies of Dublin, Milan and Warsaw. Land Use Policy 2022, 112, 105831. [Google Scholar] [CrossRef]
  64. Sharma, M.; Kumar, S. Analysing the spatial patterns and trends of urban growth in Rohtak city, India. Sustain. Environ. 2022, 8, 1–10. [Google Scholar] [CrossRef]
  65. Nong, D.H.; Lepczyk, C.A.; Miura, T.; Fox, J.M. Quantifying urban growth patterns in Hanoi using landscape expansion modes and time series spatial metrics. PLoS ONE 2018, 13, e0196940. [Google Scholar] [CrossRef]
  66. Zhang, L.; Han, R.; Cao, H. Understanding Urban Land Growth through a Social-Spatial Perspective. Land 2021, 10, 348. [Google Scholar] [CrossRef]
  67. Baqa, M.F.; Chen, F.; Lu, L.; Qureshi, S.; Tariq, A.; Wang, S.; Jing, L.; Hamza, S.; Li, Q. Monitoring and modeling the patterns and trends of urban growth using urban sprawl matrix and CA-Markov model: A case study of Karachi, Pakistan. Land 2021, 10, 700. [Google Scholar] [CrossRef]
  68. Sun, H.; Li, X.; Guan, Y.; Tian, S.; Liu, H. The Evolution of the Urban Residential Space Structure and Driving Forces in the Megacity—A Case Study of Shenyang City. Land 2021, 10, 1081. [Google Scholar] [CrossRef]
  69. Ou, J.; Liu, X.; Li, X.; Chen, Y.; Li, J. Quantifying Spatiotemporal Dynamics of Urban Growth Modes in Metropolitan Cities of China: Beijing, Shanghai, Tianjin, and Guangzhou. J. Urban Plan. Dev. 2017, 143, 04016023. [Google Scholar] [CrossRef]
  70. Seo, J.K.; Cho, M.; Skelton, T.; Seo, J.K.; Cho, M.; Skelton, T. “Dynamic Busan”: Envisioning a global hub city in Korea. Cities 2015, 46, 26–34. [Google Scholar] [CrossRef]
  71. Park, S.H. Can we implant an artist community? A reflection on government-led cultural districts in Korea. Cities 2016, 56, 172–179. [Google Scholar] [CrossRef]
  72. Anselin, L. Local Indicators of Spatial Association—LISA. Geogr. Anal. 1995, 27, 93–115. [Google Scholar] [CrossRef]
  73. Bachi, R.A. Statistical analysis of the revival of Hebrew in Israel and Palestine. Scr. Hierosolymitana 1956, 3, 179–247. [Google Scholar]
  74. Kader, G.D.; Perry, M.; Kader, G.D.; Perry, M. Variability for Categorical Variables. J. Stat. Educ. 2007, 15, 1–16. [Google Scholar] [CrossRef]
  75. Jang, J.-W.; Woo, J.; Mohaisen, A.; Yun, J.; Kim, H.K. Mal-Netminer: Malware Classification Approach Based on Social Network Analysis of System Call Graph. Math. Probl. Eng. 2015, 2015, 1–20. [Google Scholar] [CrossRef]
  76. Rusinowska, A.; Berghammer, R.; De Swart, H.; Grabisch, M. Social networks: Prestige, centrality, and influence. In Lecture Notes in Computer Science; Swart, H., Ed.; Springer: Berlin/Heidelberg, Germany, 2011; pp. 22–39. [Google Scholar] [CrossRef]
  77. Artmann, M.; Breuste, J. Cities Built for and by Residents: Soil Sealing Management in the Eyes of Urban Dwellers in Germany. J. Urban Plan. Dev. 2015, 141, A5014004. [Google Scholar] [CrossRef]
  78. Azhdari, A.; Sasani, M.A.; Soltani, A. Exploring the relationship between spatial driving forces of urban expansion and socioeconomic segregation: The case of Shiraz. Habitat Int. 2018, 81, 33–44. [Google Scholar] [CrossRef]
  79. Atkinson, G.; Oleson, T. Urban Sprawl as a Path Dependent Process. J. Econ. Issues 1996, 30, 609–615. [Google Scholar] [CrossRef]
  80. Brown, D.G.; Page, S.; Riolo, R.; Zellner, M.; Rand, W. Path dependence and the validation of agent-based spatial models of land use. Int. J. Geogr. Inf. Sci. 2005, 19, 153–174. [Google Scholar] [CrossRef]
  81. Anthony, J. Do State Growth Management Regulations Reduce Sprawl? Urban Aff. Rev. 2004, 39, 376–397. [Google Scholar] [CrossRef]
  82. Geneletti, D.; La Rosa, D.; Spyra, M.; Cortinovis, C. A review of approaches and challenges for sustainable planning in urban peripheries. Landsc. Urban Plan. 2017, 165, 231–243. [Google Scholar] [CrossRef]
  83. Couch, C.; Karecha, J.; Nuissl, H.; Rink, D. Decline and sprawl: An evolving type of urban development—observed in Liverpool and Leipzig. Eur. Plan. Stud. 2005, 13, 117–136. [Google Scholar] [CrossRef]
  84. Westerink, J.; Haase, D.; Bauer, A.; Ravetz, J.; Jarrige, F.; Aalbers, C.B.M. Dealing with Sustainability Trade-Offs of the Compact City in Peri-Urban Planning Across European City Regions. Eur. Plan. Stud. 2013, 21, 473–497. [Google Scholar] [CrossRef]
  85. Busan Metropolitan City. 2030 Master Plan for Busan Metropolitan City; Busan Metropolitan City: Busan, Korea, 2017. [Google Scholar]
Figure 1. Location and Map of BMC. Note: ① Gijang-gun, ② Haeundae-gu, ③ Suyeong-gu, ④ Geumjeong-gu, ⑤ Dongrae-gu, ⑥ Yeonje-gu, ⑦ Busanjin-gu, ⑧ Seo-gu, ⑨ Dong-gu, ⑩ Nam-gu, ⑪ Jung-gu, ⑫ Yeongdo-gu, ⑬ Buk-gu, ⑭ Sasang-gu, ⑮ Saha-gu, ⑯ Gangseo-gu. The base map was adopted from the National Spatial Data Infrastructure Portal of Korea (www.nsdi.go.kr (accessed on 12 August 2022)).
Land 11 01319 g001
Figure 2. Analytic flow.
Land 11 01319 g002
Figure 3. Spatial clusters of population in BMC. Note: The base map was adopted from the National Spatial Data Infrastructure Portal of Korea (www.nsdi.go.kr (accessed on 12 August 2022)).
Land 11 01319 g003
Figure 4. Changes in the urbanized area in BMC. Note: The base map was adopted from the National Spatial Data Infrastructure Portal of Korea (www.nsdi.go.kr (accessed on 12 August 2022)).
Land 11 01319 g004
Figure 5. SDE in BMC. Note: The base map was adopted from the National Spatial Data Infrastructure Portal of Korea (www.nsdi.go.kr (accessed on 12 August 2022)).
Land 11 01319 g005
Figure 6. Social Network Analysis of migration in BMC. Note: The base map was adopted from the National Spatial Data Infrastructure Portal of Korea (www.nsdi.go.kr (accessed on 12 August 2022)).
Land 11 01319 g006
Table 1. Data and unit of analysis.
VariableMethodologyData TypeYearUnit of AnalysisData Source
PopulationExploratory Spatial Data AnalysisShape file1980, 1990, 2000, 2010, 2020DongPopulation and Housing Census
(Statistics Korea)
UrbanizationBachi’s Index,
SDE
Raster file
Shape file
1980, 1990, 2000, 2010, 202030 m × 30 m grid and dongLand Cover Map
(Ministry of Environment)
Domestic MigrationSocial Network AnalysisNetwork file2000, 2010, 2020Gu and gunInternal Migration Statistics
(Statistics Korea)
Table 2. Numbers of High-High (HH) and Low-Low (LL) clusters in BMC.
Gu-Gun19801990200020102020
HHLLHHLLHHLLHHLLHHLL
Gijang-gun-----11-2-
Haeundae-gu-4-44-5-12-
Suyeong-gu2-2-------
Geumjeong-gu-1------4-
Dongrae-gu--5-4-3-5-
Yeonje-gu2-5-1-1-1-
Busanjin-gu14-8------6
Seo-gu3------5-13
Dong-gu5------3-12
Nam-gu8-2--3-4-13
Jung-gu2------5-9
Yeongdo-gu-- --2-6-9
Buk-gu-6--3-1---
Sasang-gu2-3----4-5
Saha-gu---1-2-7-7
Gangseo-gu-1--------
Total381225512811342474
Table 3. Number of urbanized area units (30 m × 30 m) and Bachi’s Index.
19801990200020102020
Number of Urbanized Area Units (30 m × 30 m)Gijang-gun641 2689 4408 13,174 26,190
Haeundae-gu2539 9281 13,162 18,565 20,357
Suyeong-gu4018 5872 6368 7614 8176
Geumjeong-gu3295 7687 10,301 12,547 15,536
Dongrae-gu3965 8966 9950 11,623 12,011
Yeonje-gu4658 7479 7727 8379 9603
Busanjin-gu12,143 13,183 14,405 17,025 18,117
Seo-gu4255 4405 4977 6322 6976
Dong-gu5894 5997 6195 6865 7159
Nam-gu9292 11,508 12,935 17,742 19,579
Jung-gu2272 23462458 27462776
Yeongdo-gu4238 5438 6125 8099 9224
Buk-gu820 4501 8044 10,442 12,695
Sasang-gu10,276 13,128 15,518 16,323 17,914
Saha-gu6280 14,112 16,953 21,868 23,956
Gangseo-gu3139 5805 14,159 27,692 49,230
Bachi IndexMean Center
( X ¯ , Y ¯ )
(386,281.2, 185,179.9)(386,744.6, 186,163.3)(386,255.3, 186,454.6)(386,226.3, 186,839.5)(387,375.1, 187,475.6)
Distance of Mean Center-1087.2 m569.5 m385.9 m1313.1 m
Direction of Mean Center-64.8°149.2°94.3°29.0°
SDD6703.97855.58511.69602.210,717.5
Oblongity (O)1.00081.00031.00961.00511.0005
Table 4. In-migration centrality, out-migration centrality, and eigenvector centrality.
Gu-GunIn-Migration Centrality
( I C i k )
Out-Migration Centrality
( O C i k )
Eigenvector Centrality
( P i )
200020102020200020102020200020102020
Gijang-gun377104110037955144590.130.220.21
Haeundae-gu2295158412813303714970.320.280.26
Suyeong-gu1186102410722842945040.160.180.22
Geumjeong-gu11949787289595684580.240.210.16
Dongrae-gu2176168717051749142513060.380.370.37
Yeonje-gu1147110812871414115711990.270.300.34
Busanjin-gu11868809711316116712740.240.260.31
Seo-gu72145048013769419670.190.160.18
Dong-gu5943804332122178715460.310.310.29
Nam-gu1438106910387104293400.200.180.18
Jung-gu482326304136410148330.210.190.17
Yeongdo-gu7715115041167103610540.180.190.20
Buk-gu142295274713059848410.270.230.20
Sasang-gu160110666391934181016380.350.370.32
Saha-gu1668135711121522122311240.240.260.25
Gangseo-gu55361410004633072630.100.120.18
Publisher’s Note: MDPI stays neutral with regard to jurisdictional claims in published maps and institutional affiliations.

