
Identifying Primary Drivers of Participants from Various Socioeconomic Backgrounds to Choose National Forest Lands in the Southeastern Region of the US as a Travel Destination for Recreation


 ,
,
Abstract
:1. Introduction
2. Materials and Methods
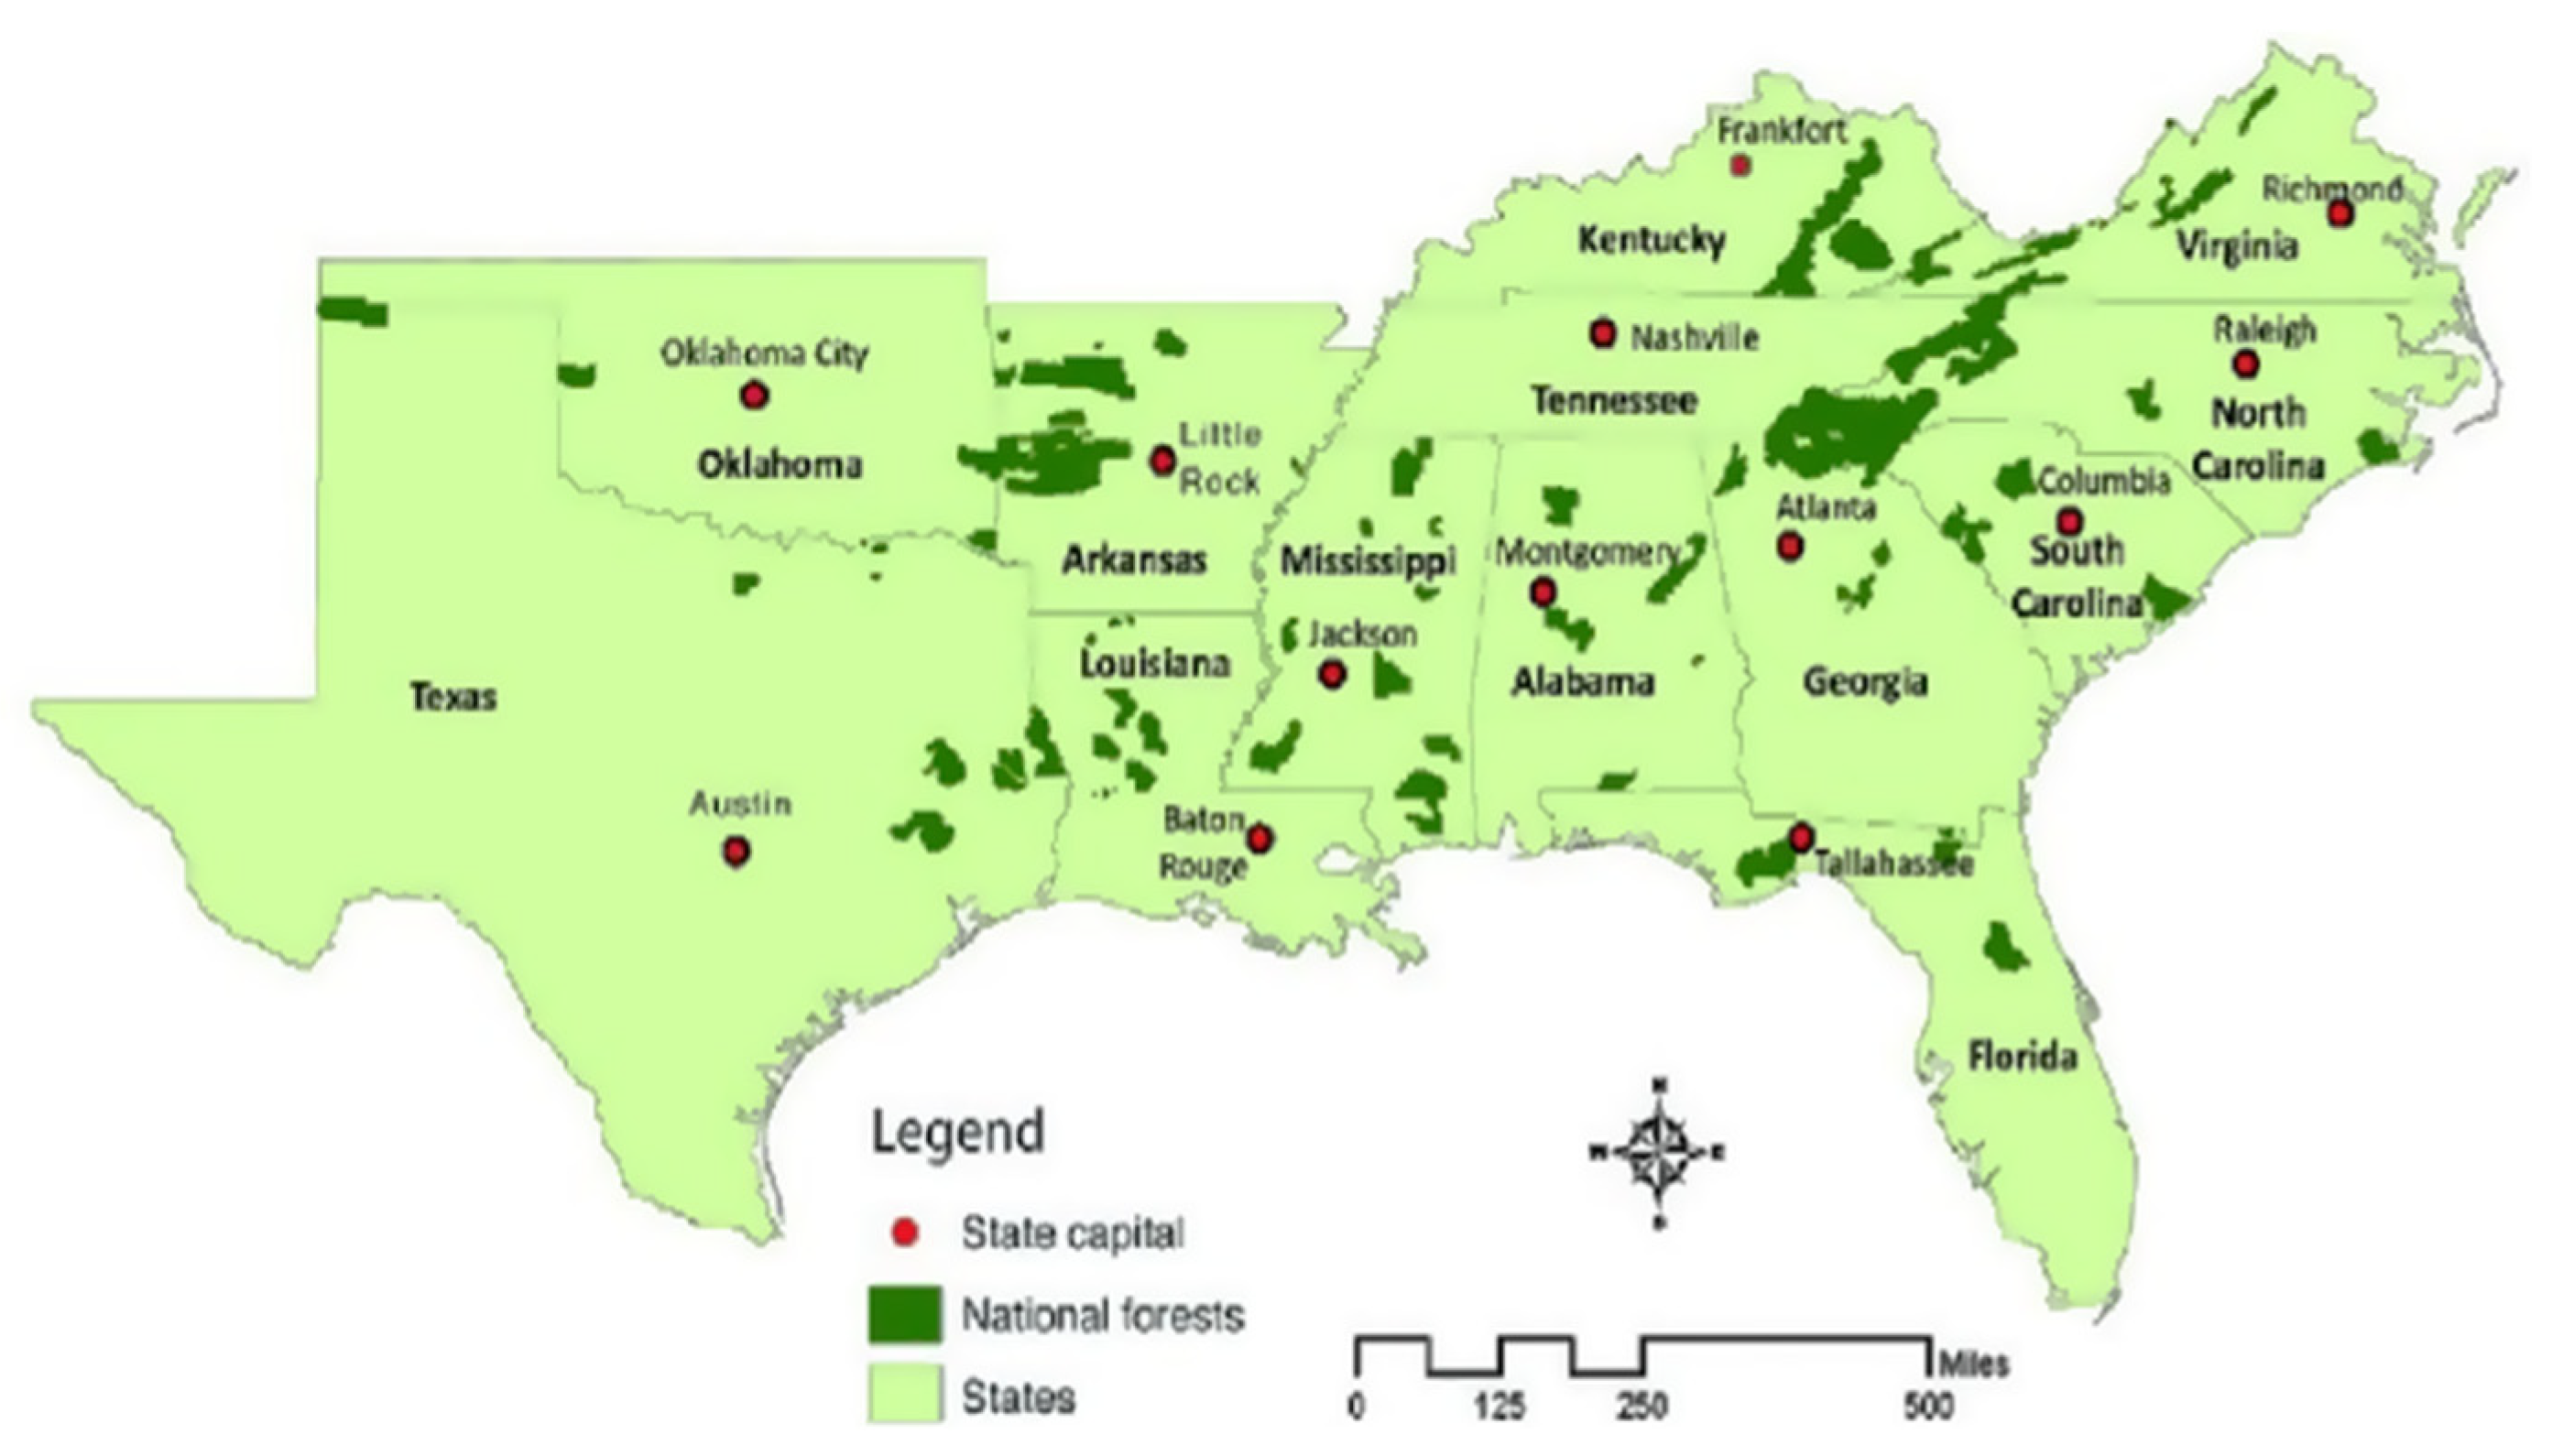
2.1. Study Area
2.2. Data Collection
2.3. Statistical Analysis
3. Results
3.1. Primary Drivers
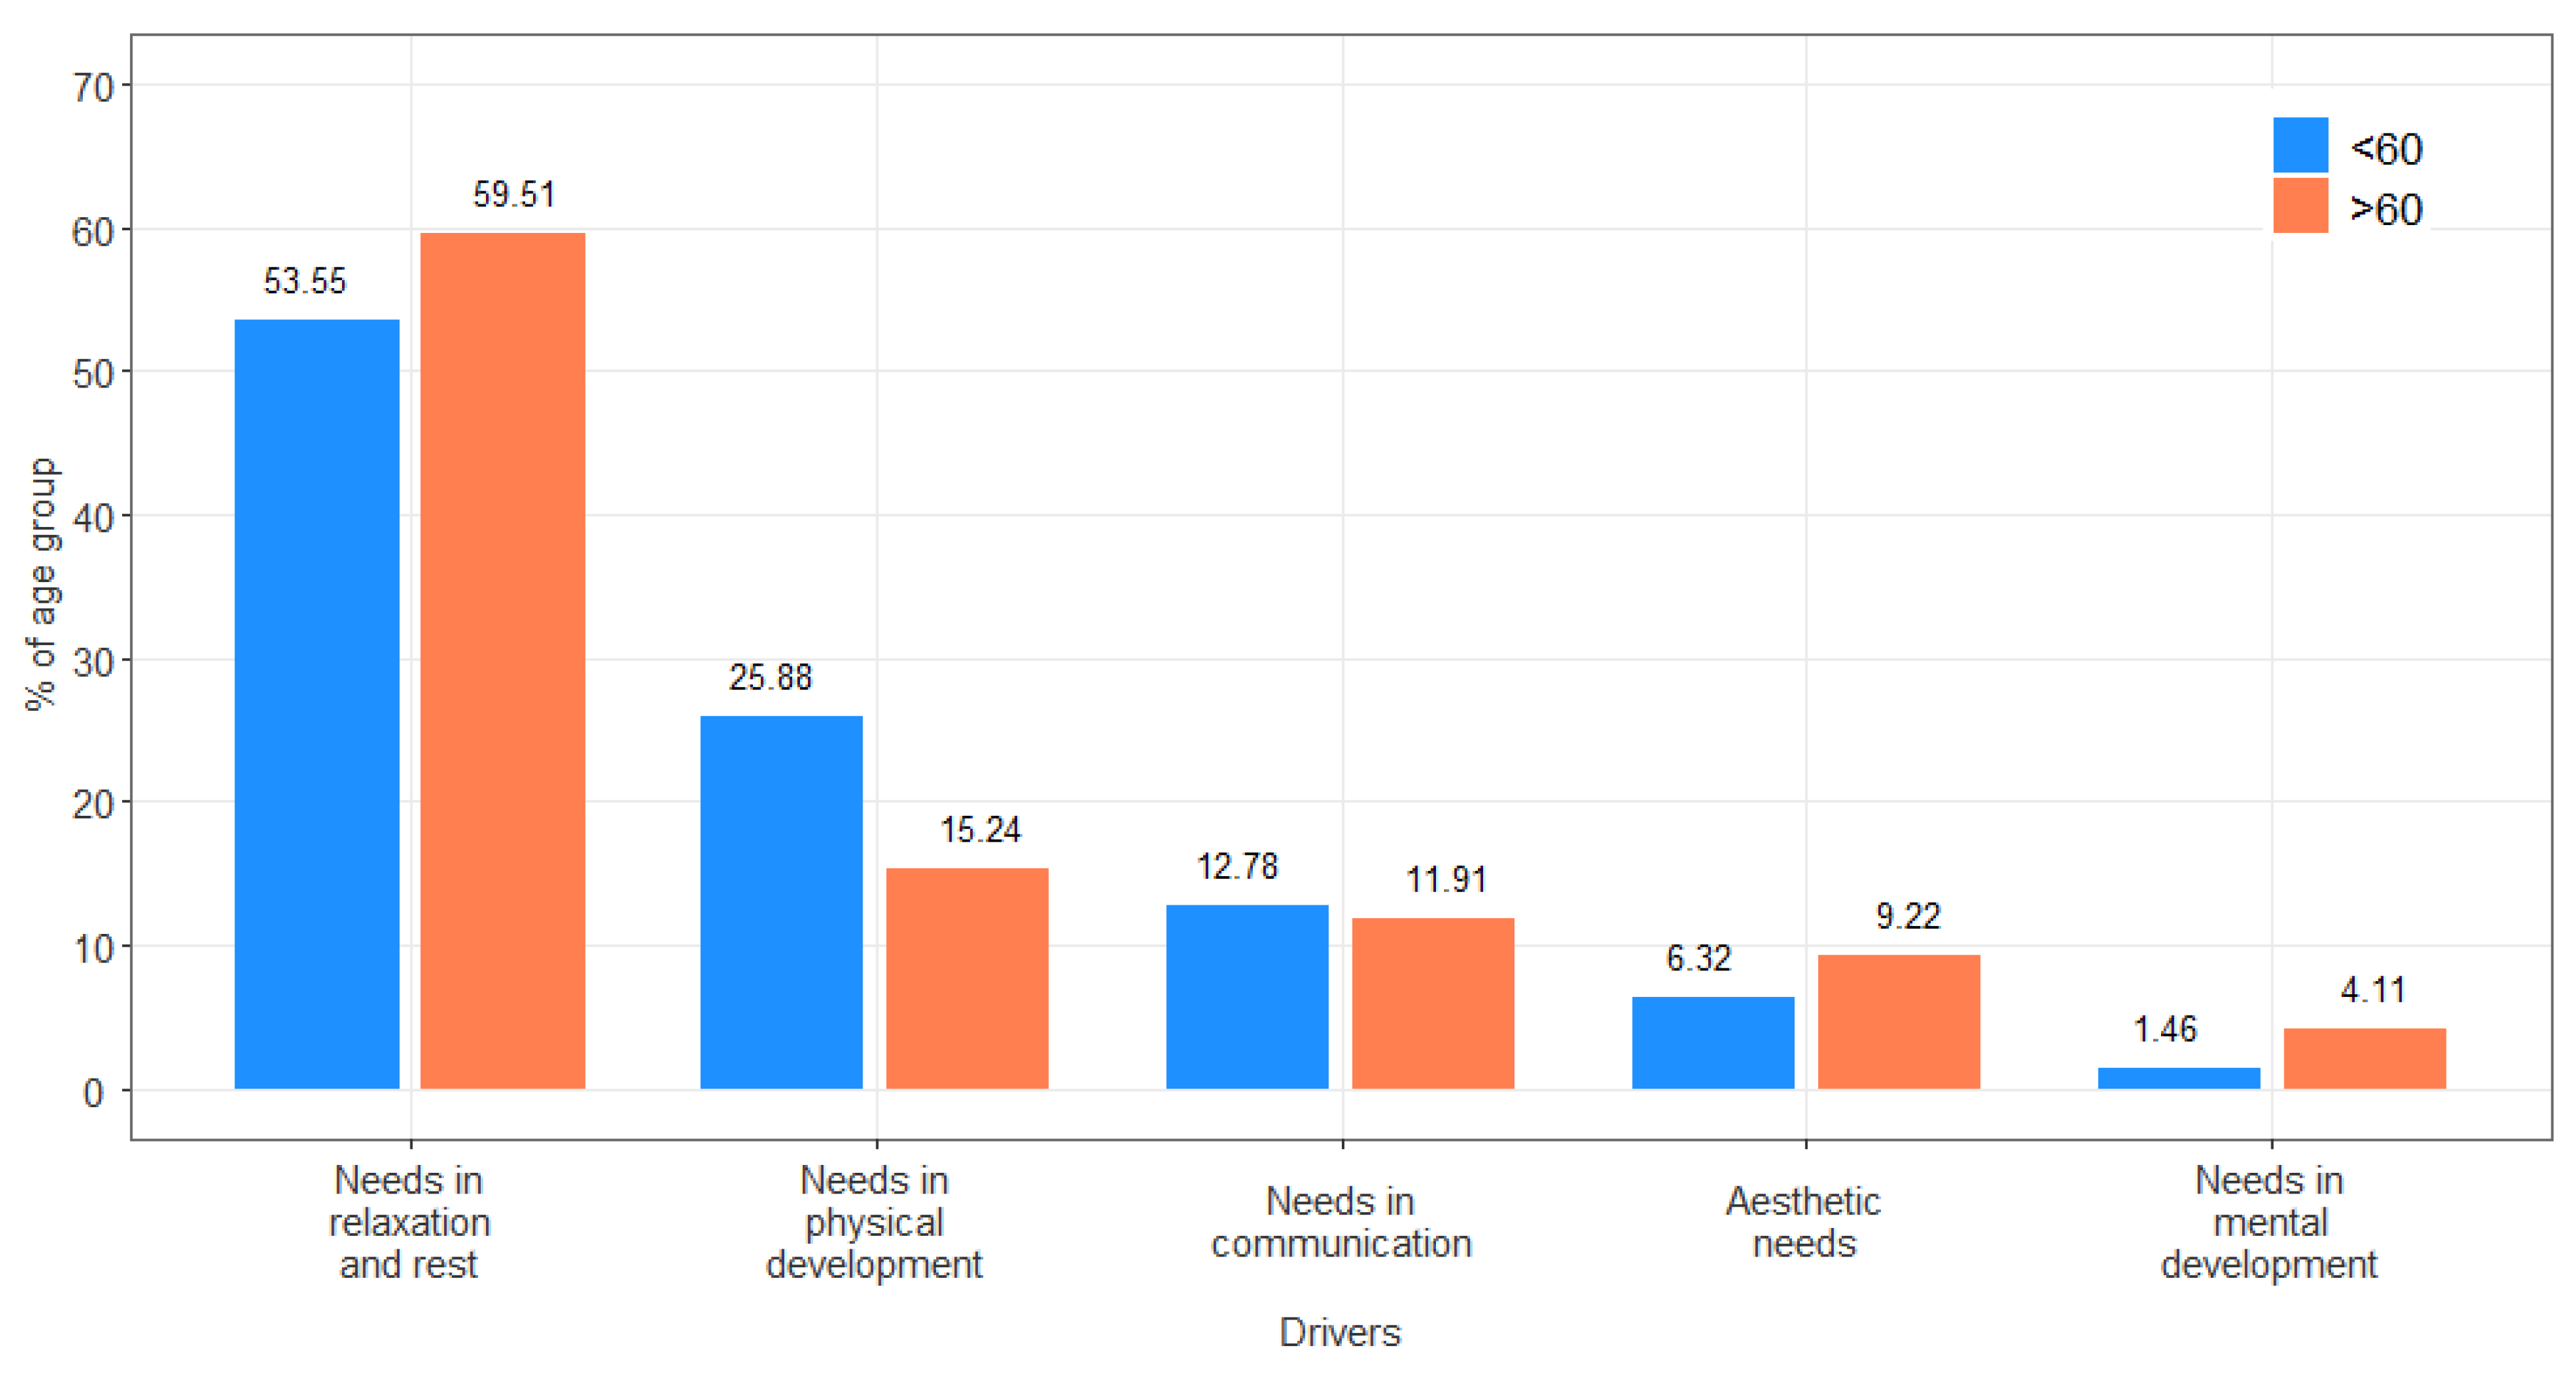
3.2. Primary Drivers by Age
3.3. Recreation Drivers by Gender
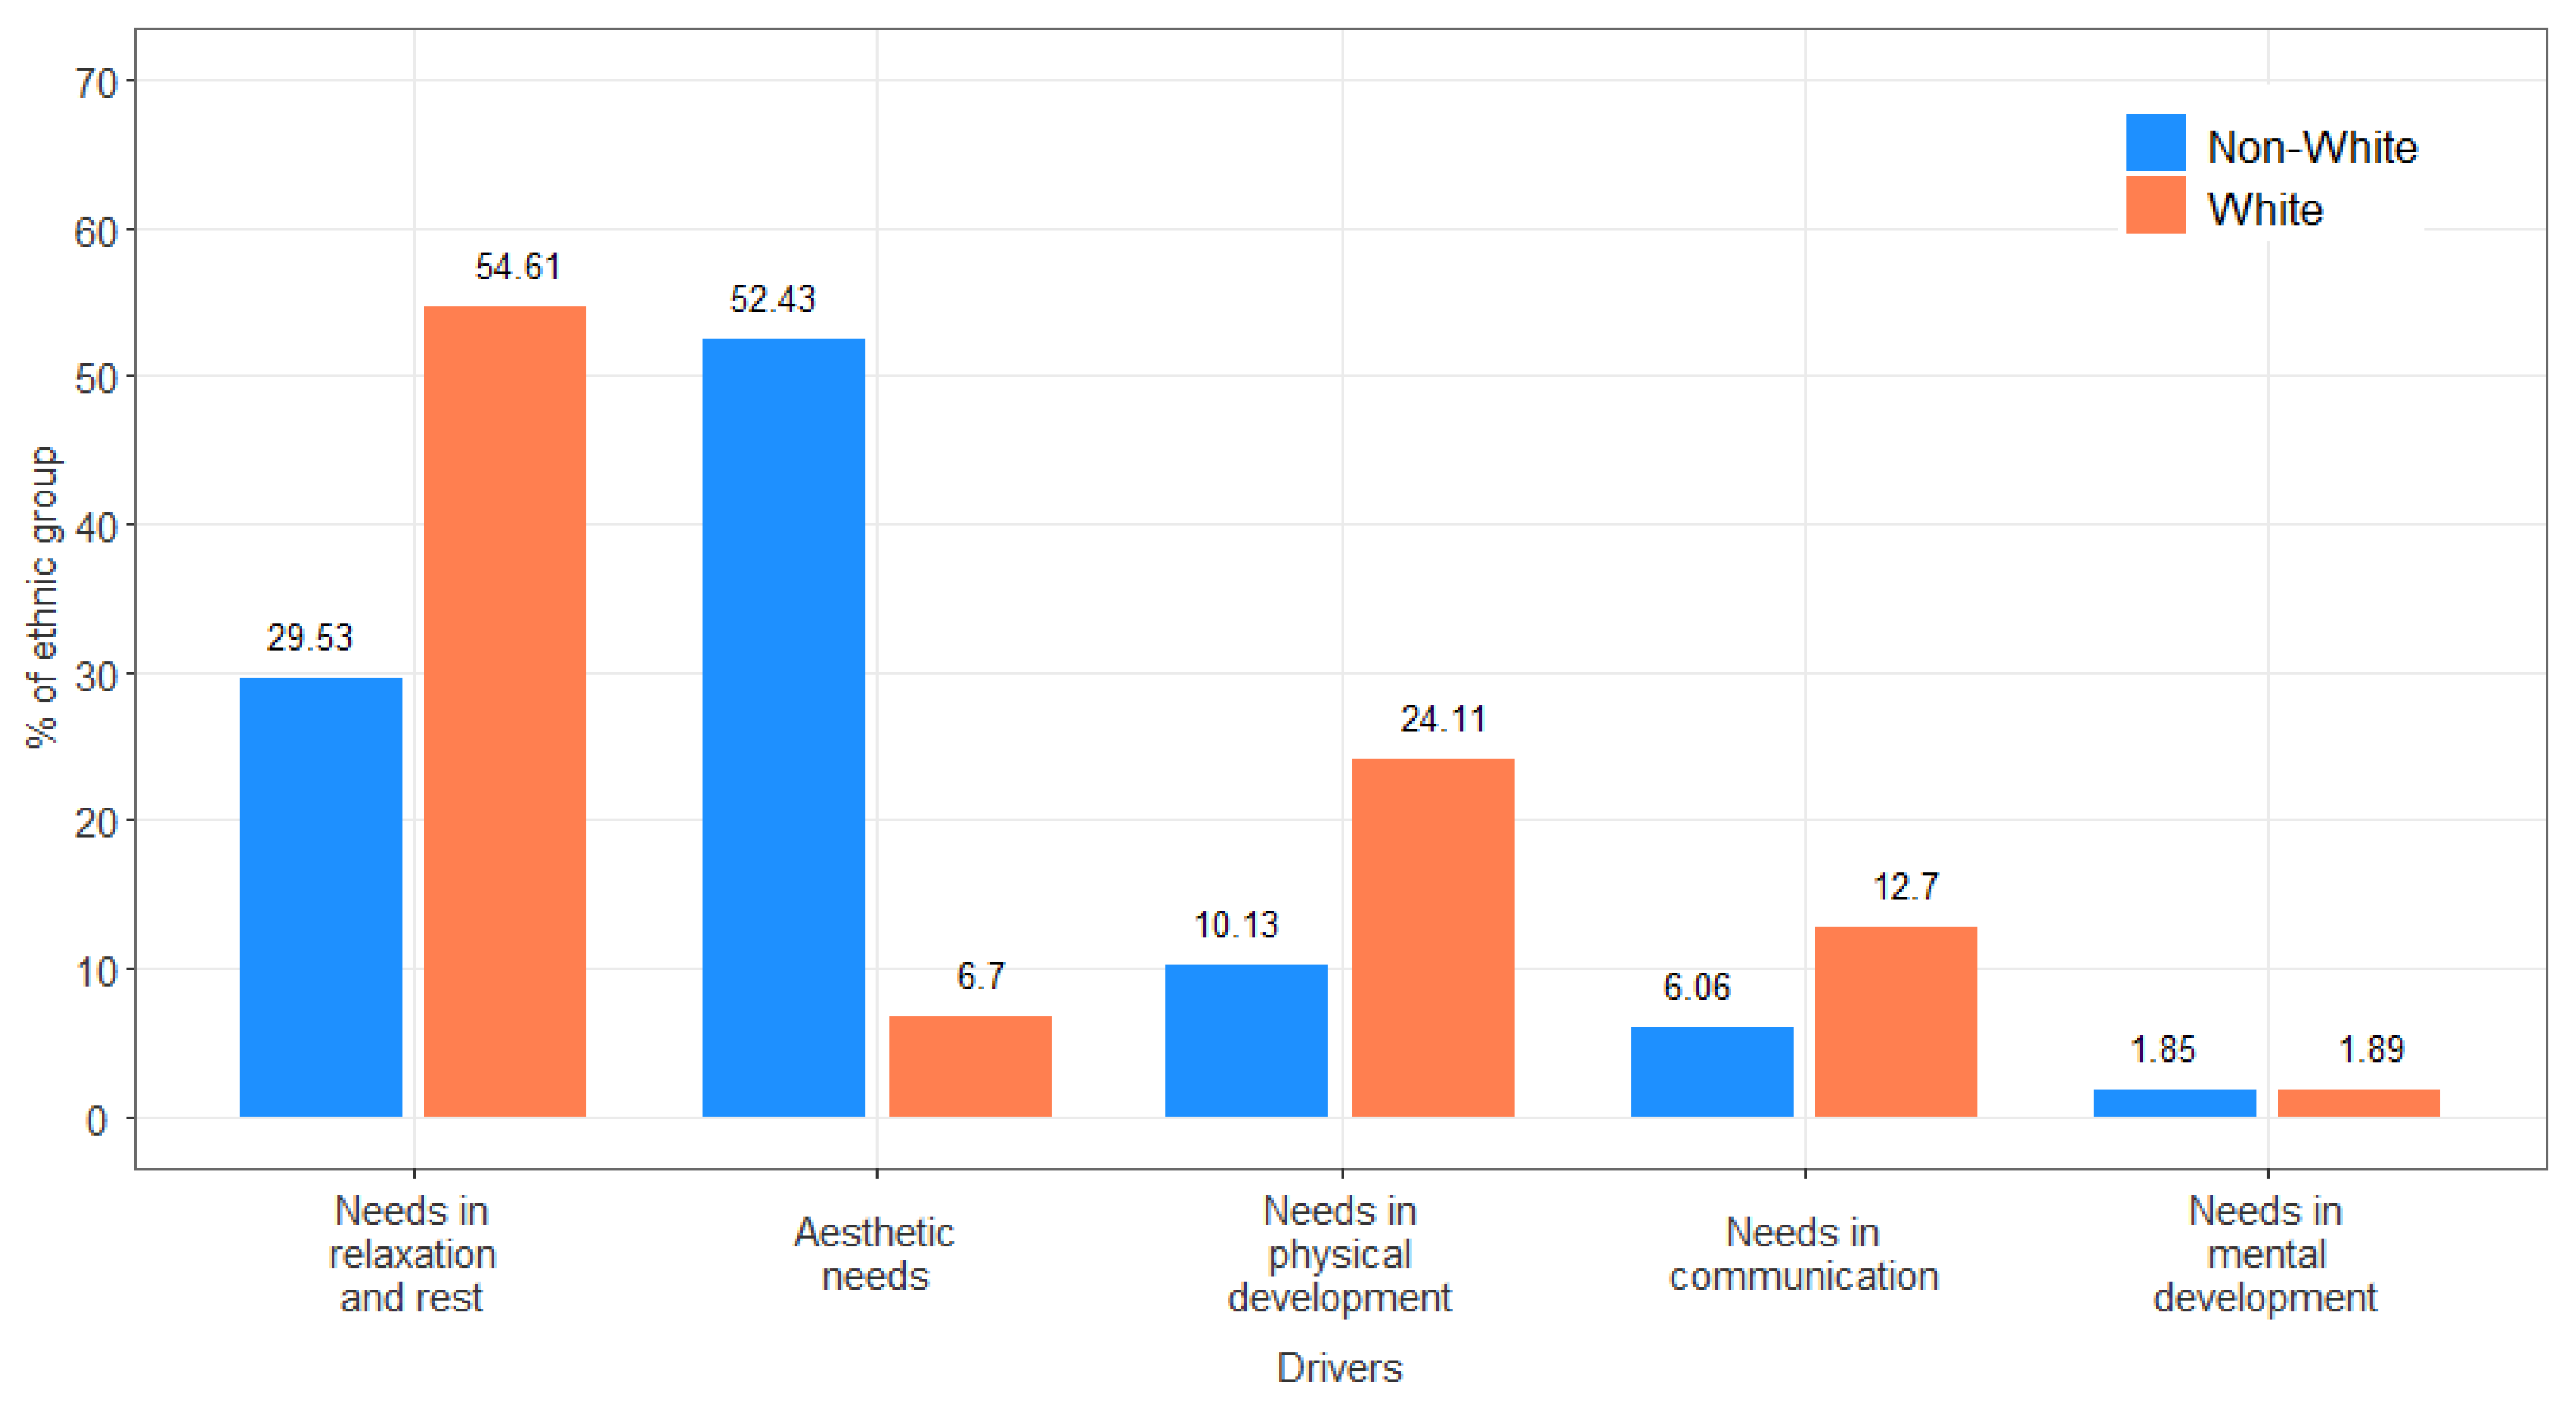
3.4. Recreation Drivers by Ethnicity
3.5. Recreation Drivers by Income
4. Discussion
5. Conclusions
Supplementary Materials
Author Contributions
Funding
Institutional Review Board Statement
Informed Consent Statement
Data Availability Statement
Conflicts of Interest
References
- Knetsch, J. Outdoor Recreation Demands and Benefits. Land Econ. 1963, 39, 387–396. [Google Scholar] [CrossRef]
- U.S. Forest Service National Visitor Use Monitoring Survey Results National Summary Report. 2016. Available online: https://www.fs.fed.us/recreation/programs/nvum/pdf/5082016NationalSummaryReport062217.pdf (accessed on 29 October 2021).
- Brabyn, L.; Brown, G. SIRC NZ 2013—GIS and Remote Sensing Research Conference University of Otago. In Proceedings of the Using GIS to Survey Landscape Values, Dunedin, New Zealand, 29–30 August 2013. [Google Scholar]
- Hammitt, W.E.; Cole, D.N.; Monz, C.A. Wildland Recreation: Ecology and Management; John and Wiley and Sons: Hoboken, NJ, USA, 2015. [Google Scholar]
- Leung, Y.F.; Marion, J.L. Recreation impacts and management in wilderness: A state-of-knowledge review. In Proceedings of the Wilderness science in a time of change conference-Volume 5: Wilderness ecosystems, threats, and management, Missoula, MT, USA, 23–27 May 1999. [Google Scholar]
- Alberini, A.; Longo, A. Combining the travel cost and contingent behavior methods to value cultural heritage sites: Evidence from Armenia. J. Cult. Econ. 2006, 30, 287–304. [Google Scholar] [CrossRef]
- Van Riper, C.J.; Kyle, G. Capturing multiple values of ecosystem services shaped by environmental worldviews: A spatial analysis. J. Environ. Manag. 2014, 145, 374–384. [Google Scholar] [CrossRef] [PubMed]
- Tyrväinen, L.; Mäntymaa, E.; Ovaskainen, V. Demand for Enhanced Forest Amenities in Private Lands: The Case of the Ruka-Kuusamo Tourism Area, Finland. For. Policy Econom. 2014, 47, 4–13. [Google Scholar] [CrossRef]
- García-Martín, M.; Bieling, C.; Fagerholm, N.; Gounaridis, D. The Landscape Values: Place and Praxis; Centre for Landscape Studies, NUI Galway: Galway, Ireland, 2016; pp. 127–134. [Google Scholar]
- Rokeach, M. The Nature of Human Values; Freedom of the Press: New York, NY, USA, 1973. [Google Scholar]
- Pirikiya, M.; Amirnejad, H.; Oladi, J.; Solout, K.A. Determining the recreational value of forest park by travel cost method and defining its effective factors. J. For. Sci. 2016, 62, 399–406. [Google Scholar] [CrossRef]
- Valles-Planells, M.; Galiana, F.; Van Eetvelde, V. A classification of landscape services to support local landscape planning. Ecol. Soc. 2014, 19, 44. [Google Scholar] [CrossRef]
- Hoyos, D.; Mariel, P. Contingent Valuation: Past, Present and Future. Prague Econ. Pap. 2010, 4, 329–343. [Google Scholar] [CrossRef]
- Garcia-Martin, M.; Fagerholm, N.; Bieling, C.; Gounaridis, D.; Kizos, T.; Printsmann, A.; Müller, M.; Lieskovský, J.; Plieninger, T. Participatory mapping of landscape values in a Pan-European perspective. Landsc. Ecol. 2017, 32, 2133–2150. [Google Scholar] [CrossRef]
- Marcus, C.C. Environmental Psychology and Human Well-Being; Academic Press: Cambridge, MA, USA, 2018. [Google Scholar] [CrossRef]
- Church, A.; Coles, T.; Fish, R. Tourism in sub-global assessments of ecosystem services. J. Sustain. Tour. 2017, 25, 1529–1546. [Google Scholar] [CrossRef]
- Sniehotta, F.F.; Presseau, J.; Araújo-Soares, V. Time to retire the theory of planned behaviour. Health Psychol. Rev. 2014, 8, 1–7. [Google Scholar] [CrossRef]
- Clough, P. The Value of Ecosystem Services for Recreation. Ecosystem Services in New Zealand-Conditions and Trends; Manaaki Whenua Press: Lincoln, New Zealand, 2013; pp. 330–342. [Google Scholar]
- Schröter, M.; Van der Zanden, E.H.; Van Oudenhoven, A.P.E.; Remme, R.P.; Serna-Chavez, H.M.; de Groot, R.S.; Opdam, P. Ecosystem services as a contested concept—A synthesis of critique and counterarguments. Conserv. Lett. 2014, 7, 514–523. [Google Scholar] [CrossRef]
- Stålhammar, S.; Pedersen, E. Recreational cultural ecosystem services: How do people describe the value? Ecosyst. Serv. 2017, 26, 1–9. [Google Scholar] [CrossRef]
- Bowker, J.M.; English, D.B.K.; Donovan, J.A. Toward a Value for Guided Rafting on Southern Rivers. J. Agric. Appl. Econ. 1996, 28, 423–432. [Google Scholar] [CrossRef]
- Derrick, B.; Toher, D.; White, P. Test statistics for comparing two proportions with partially overlapping samples. J. Appl. Quant. Methods 2015, 10, 1–14. [Google Scholar]
- Cho, S.-H.; Bowker, J.; English, D.B.; Roberts, R.K.; Kim, T. Effects of travel cost and participation in recreational activities on national forest visits. For. Policy Econ. 2014, 40, 21–30. [Google Scholar] [CrossRef]
- Ferguson, B.K. The Concept of Landscape Health. J. Environ. Manag. 1994, 40, 129–137. [Google Scholar] [CrossRef]
- Mäntymaa, E.; Ovaskainen, V.; Juutinen, A.; Tyrväinen, L. Integrating nature-based tourism and forestry in private lands under heterogeneous visitor preferences for forest attributes. J. Environ. Plan. Manag. 2018, 61, 724–746. [Google Scholar] [CrossRef]
- Brown, G. Mapping Landscape Values and Development Preferences: A Method for Tourism and Residential Development Planning. Int. J. Tour. Res. 2006, 8, 101–113. [Google Scholar] [CrossRef]
- Fagerholm, N.; Oteros-Rozas, E.; Raymond, C.M.; Torralba, M.; Moreno, G.; Plieninger, T. Assessing linkages between ecosystem services, land-use and well-being in an agroforestry landscape using public participation GIS. Appl. Geogr. 2016, 74, 30–46. [Google Scholar] [CrossRef]
- Heung, V.C.S.; Qu, H. Hong Kong as a travel destination: An analysis of Japanese tourists’ satisfaction levels, and the likelihood of them recommending Hong Kong to others. J. Travel Tour. Mark. 2000, 9, 57–80. [Google Scholar] [CrossRef]
- Lee, J.; Graefe, A.R.; Burns, R.C. Service quality, satisfaction, and behavioural intention among forest visitors. J. Travel Tour. Mark. 2004, 17, 73–83. [Google Scholar] [CrossRef]
- Lin, J.H.; Chen, T.Y.; Liu, C.R. The influence of tourism image on tourist’s behavioural intention on Taiwan’s coastal scenic area: Testing the mediating variable of tourists’ satisfaction. J. Outdoor Recreat. Study 2003, 16, 1–22. [Google Scholar]
- Lee, T.H. An ecotourism behavioural model of national forest recreation areas in Taiwan. Int. For. Rev. 2007, 9, 771–785. [Google Scholar] [CrossRef]


| State | National Forest | Area in Acres | Selected Recreational Opportunities/Features | State | National Forest | Area in Acres | Selected Recreational Opportunities/Features |
|---|---|---|---|---|---|---|---|
| Alabama | William B. Bankhead | 181.23 | Hiking, Bicycling, Water Activates, bird Watching, Picnicking, Scenic Driving, Shooting Range | North Carolina | Nanatahala | 531.2 | Camping, Off-Highway Vehicle riding, Scenic Driving, Outdoor Learning, Nature Viewing, Climbing, Horse Riding, Fishing, Hiking |
| Talladega | 392,567 | Hiking, Fishing, Camping, Water activities | Pisgah | 500 | Outdoor Learning, Nature viewing, Hunting, Picnicking, Bicycling, Scenic Driving, Fishing | ||
| Tuskegee | 11,252 | Shooting Range, Bicycling, Horse Trail | Uwharrie | 50,645 | Nature Viewing, Water Activities, Bicycling | ||
| Conecuh | 83,861 | Hiking Trails, Shooting Range, Water Activities | Croatan | 159,872 | Off-Highway Vehicle Riding, Nature Viewing, Hiking | ||
| Tennessee | Cherokee | 655,598 | Bicycling, Camping, Fishing, Outdoor learning, Scenic Driving, Horse Riding, Winter Sports | South Carolina | Francis Marion | 258.56 | Scenic Driving, Fishing, Nature viewing, Hunting |
| Georgia | Chattahoochee-Oconee | 867 | Nature Viewing, Bicycling, Camping, Fishing, Outdoor learning, Scenic Driving, Horse Riding | Sumter | 370,442 | Hunting, Off-Highway Vehicle riding, Nature Viewing, Water activities, picnicking, camping | |
| Kentucky | Daniel Boone | 2,100,000 | Hiking, Camping, Picnicking, Rock climbing, boating, Hunting, Fishing, Target Shooting | Texas | Davy Crockett | 160.64 | Camping & Cabins, Climbing, Bicycling, Off-Highway Vehicle riding, Nature Viewing |
| Florida | Apalachicola | 632.89 | Scenic Driving, Picnicking, Nature Viewing, Fishing, Hunting, Horse Riding, Camping | Angelina | 153.18 | Picnicking, Hiking, Horse Riding, Fishing, Bicycling | |
| Osceola | 200 | Water Activities, Bicycling, Fishing, Nature Viewing, Outdoor Learning, Camping | Sabine | 160,896 | Nature Viewing, Water Activities, Picnicking, fishing | ||
| Ocala | 387 | Scenic Driving, Outdoor Learning, Off-Highway Vehicle riding, Nature viewing, Boating | Sam Houston | 163,072 | Scenic Driving, Fishing, Off-Highway Vehicle riding, Water activities, picnicking, camping | ||
| Louisiana | Kisatchie | 604 | Fishing, Off-Highway Vehicle riding, Nature Viewing, Water activities, picnicking, camping | Caddo Lyndon B. | 17,784 | Picnicking, Hiking, Bicycling, Hiking, Fishing | |
| Mississippi | De Soto | 518,587 | Scenic Driving, Picnicking, Hiking, Target Shooting, Nature viewing, fishing, Horse Riding | Johnson Grasslands | 20,309 | Horse Riding, Bicycling, Camping & Cabins, Hiking | |
| Homochito | 191,839 | Hunting, Off-Highway Vehicle riding, Nature Viewing, Water activities, picnicking, camping | Virginia | George Washington-Jefferson | 1,803,869 | Beaches & Dunes, Winter Sports, Water Activities, Hunting, Rocks & Minerals, Fishing | |
| Bienville | 178,541 | Fishing, Boating, Hunting, Hiking, Picnicking | Arkansas/Oklahoma | Ouachita | 1,784,457 | Mineral Prospecting, Hiking, Horse Riding, Fishing, Hunting, Bicycling, Water Activities. | |
| Delta | 60,898 | Target Shooting, Scenic Driving, Hiking, Bicycling | |||||
| Tombigbee | 67,005 | Water activities, Nature viewing, Picnicking, Hiking | Arkansas | Ozark | 1,200,000 | Winter Sports, Water Activities, Horse Riding, Camping & Cabins, Climbing, Bicycling | |
| Holly Springs | 155,661 | Horse Riding, Camping, Bicycling, Fishing, Hiking | St. Francis | 22.6 | Scenic Driving, Picnicking, Nature Viewing, Fishing, Hunting, Climbing, Camping | ||
| Kentucky/Tennessee | Land Between the Lakes | 170 | hiking, biking, riding. Kayaking, boating, camping, wildlife viewing opportunities | Puerto Rico | El Yunque | 28 | Nature viewing, Hiking, Water Activities, Camping, Picnicking, Outdoor Learning |
| Main Drivers for Individuals to Participate in Alabama’s National Forest Recreation | Corresponding Questionnaire Items |
|---|---|
| Individual needs in relaxation and resting | MAIN_RELAX |
| MAIN_HIKING | |
| MAIN_DRIVING | |
| MAIN_FISHING | |
| MAIN_HUNTING | |
| MAIN_GATHERING | |
| MAIN_BACKPACK | |
| Needs for communication and spending time with other people outdoors | MAIN_DEV_CAMPING |
| MAIN_PICNIC | |
| MAIN_PRIM_CAMPING | |
| MAIN_RESORTS | |
| Individual aesthetic needs and development | MAIN_VIEW_WILDLIFE |
| MAIN_VIEW_NATURE | |
| Personal mental development | MAIN_HISTORY |
| MAIN_NATURE_CENTER | |
| MAIN_NATURE_STUDY | |
| Personal physical development | MAIN_BIKING |
| MAIN_DOWNHILL_SKI | |
| MAIN_HORSE | |
| MAIN_MOT_WATER | |
| MAIN_NONMOT_WATER | |
| MAIN_OHV_USE | |
| MAIN_OTHER_MOT | |
| MAIN_OTHER_NONMOT | |
| MAIN_SNOWMOBILE | |
| MAIN_XC_SKI | |
| MAIN_MOTOR_TRAIL | |
| MAIN_OTH_ACTIV |
| Main Drivers for Individuals to Participate in Southeastern National Forest Recreation | National Forest Recreation Values [14] | Main Forest Recreation Activities [23] | Corresponding Questionnaire Variables |
|---|---|---|---|
| Individual needs in relaxation and resting | Outdoor recreation | Hiking or walking Relaxing, hanging out, escaping heat, noise | MAIN_RELAX MAIN_HIKING MAIN_DRIVING MAIN_FISHING MAIN_HUNTING MAIN_GATHERING MAIN_BACKPACK |
| Needs for communication and spending time with other people outdoors | Social well-being, social fulfilment | Picnicking and family day gathering in developed sites (family or group) | MAIN_DEV_CAMPING MAIN_PICNIC MAIN_PRIM_CAMPING MAIN_RESORTS |
| Individual aesthetic needs and development | Aesthetic | All items related to Viewing Nature& Culture | MAIN_VIEW_WILDLIFE MAIN_VIEW_NATURE |
| Personal mental development | Existence | Nature study | MAIN_HISTORY MAIN_NATURE_CENTER MAIN_NATURE_STUDY |
| Personal physical development | Outdoor sports | All motorized Activities | MAIN_BIKING MAIN_DOWNHILL_SKI MAIN_HORSE MAIN_MOT_WATER MAIN_NONMOT_WATER MAIN_OHV_USE MAIN_OTHER_MOT MAIN_OTHER_NONMOT MAIN_SNOWMOBILE MAIN_XC_SKI MAIN_MOTOR_TRAIL MAIN_OTH_ACTIV |
| NF Code | Needs in Relaxation and Resting | Needs in Commu- Nication | Aesthetic Needs | Needs in Mental Development | Needs in Physical Development |
|---|---|---|---|---|---|
| (William B. Bankhead, Talladega, Tuskegee, Conecuh) | 158 | 73 | 14 | 0 | 171 |
| −37.98 | −17.55 | −3.37 | 0 | −41.11 | |
| (Daniel Boone) | 774 | 184 | 126 | 10 | 244 |
| −57.85 | −13.75 | −9.42 | −0.75 | −18.24 | |
| (Chattahoochee-Oconee) | 430 | 33 | 145 | 7 | 78 |
| −62.05 | −4.76 | −20.92 | −1.01 | −11.26 | |
| (Cherokee) | 694 | 191 | 214 | 6 | 404 |
| −45.99 | −12.66 | −14.18 | −0.4 | −26.77 | |
| (Apalachicola, Osceola, Ocala) | 285 | 189 | 23 | 18 | 250 |
| −37.25 | −24.71 | −3.01 | −2.35 | −32.68 | |
| (Kisatchie) | 395 | 207 | 39 | 14 | 224 |
| −44.94 | −23.55 | −4.44 | −1.59 | −25.48 | |
| (De Soto, Homochito, Bienville, Delta, Tombigbee, Holly Springs) | 294 | 68 | 59 | 4 | 63 |
| −60.25 | −13.93 | −12.09 | −0.82 | −12.91 | |
| (George Washington-Jefferson) | 562 | 118 | 83 | 11 | 426 |
| −46.83 | −9.83 | −6.92 | −0.92 | −35.5 | |
| (St. Francis, Ouachita) | 159 | 73 | 149 | 3 | 76 |
| −34.57 | −15.87 | −32.39 | −0.65 | −16.52 | |
| (Ozark) | 167 | 64 | 63 | 2 | 193 |
| −34.15 | −13.09 | −12.88 | −0.41 | −39.47 | |
| (Nanatahala, Pisgah, Uwharrie, Croatan) | 1621 | 138 | 252 | 66 | 277 |
| −68.86 | −5.86 | −10.71 | −2.8 | −11.77 | |
| (Francis Marion, Sumter) | 183 | 35 | 76 | 31 | 243 |
| −32.22 | −6.16 | −13.38 | −5.46 | −42.78 | |
| (Davy Crockett, Angelina, Sabine, Sam Houston, Caddo Lyndon B., Johnson Grasslands) | 506 | 119 | 62 | 6 | 143 |
| −60.53 | −14.23 | −7.42 | −0.72 | −17.11 | |
| (El Yunque) | 235 | 1 | 151 | 28 | 13 |
| −54.91 | −0.23 | −35.28 | −6.54 | −3.04 | |
| (Land Between the Lakes) | 174 | 39 | 42 | 35 | 84 |
| −46.52 | −10.43 | −11.23 | −9.36 | −22.46 | |
| All forests | 6637 | 1532 | 1498 | 241 | 2889 |
| −51.86 | −11.97 | −11.71 | −1.88 | −22.58 |
| Forests | Percentage | Difference | Chi 2 Statistics | p-Value | |
|---|---|---|---|---|---|
| Females | Males | ||||
| Needs in relaxation and rest | |||||
| (William B. Bankhead, Talladega, Tuskegee, Conecuh) | 39.6 | 35.19 | 4.42 | 0.38 | 0.536 |
| (Daniel Boone) | 59.82 | 55.97 | 3.85 | 0.86 | 0.355 |
| (Chattahoochee-Oconee) | 69.19 | 60.17 | 9.02 | 3.56 | 0.059 |
| (Cherokee) | 49.91 | 56.37 | −6.46 | 2.9 | 0.089 |
| (Apalachicola, Osceola, Ocala) | 34.79 | 48.43 | −13.64 | 9.94 | 0.002 |
| (Kisatchie) | 43.43 | 58.26 | −14.83 | 8.86 | 0.003 |
| (De Soto, Homochito, Bienville, Delta, Tombigbee, Holly Springs) | 66.06 | 67.89 | −1.83 | 0.12 | 0.726 |
| (George Washington-Jefferson) | 47.95 | 45.56 | 2.4 | 0.35 | 0.553 |
| (St. Francis, Ouachita) | 45.59 | 46.91 | −1.32 | 0.04 | 0.835 |
| (Ozark) | 38.73 | 30.43 | 8.29 | 1.71 | 0.191 |
| (Nanatahala, Pisgah, Uwharrie, Croatan) | 70.74 | 74.51 | −3.77 | 3.3 | 0.069 |
| (Francis Marion, Sumter) | 32.63 | 35.71 | −3.08 | 0.38 | 0.538 |
| (Davy Crockett, Angelina, Sabine, Sam Houston, Caddo Lyndon B., Johnson Grasslands) | 60.4 | 74.51 | −14.11 | 10.58 | 0.001 |
| (El Yunque) | 57.58 | 49.09 | 8.49 | 1.4 | 0.237 |
| (Land Between the Lakes) | 45.2 | 58.11 | −12.91 | 3.91 | 0.048 |
| Needs in physical development | |||||
| (William B. Bankhead, Talladega, Tuskegee, Conecuh) | 42.45 | 38.89 | 3.56 | 0.24 | 0.622 |
| (Daniel Boone) | 19.21 | 15.72 | 3.48 | 1.11 | 0.292 |
| (Chattahoochee-Oconee) | 12.21 | 12.71 | −0.5 | 0.02 | 0.881 |
| (Cherokee) | 31.43 | 19.61 | 11.83 | 11.63 | 0.001 |
| (Apalachicola, Osceola, Ocala) | 35.8 | 23.27 | 12.53 | 8.89 | 0.003 |
| (Kisatchie) | 27.62 | 13.91 | 13.71 | 9.79 | 0.002 |
| (De Soto, Homochito, Bienville, Delta, Tombigbee, Holly Springs) | 16.97 | 6.42 | 10.55 | 7.42 | 0.006 |
| (George Washington-Jefferson) | 36.66 | 32.78 | 3.89 | 1 | 0.318 |
| (St. Francis, Ouachita) | 24.14 | 14.81 | 9.32 | 3.14 | 0.076 |
| (Ozark) | 43.24 | 43.48 | −0.24 | 0 | 0.97 |
| (Nanatahala, Pisgah, Uwharrie, Croatan) | 15.07 | 5.7 | 9.37 | 38.25 | 0 |
| (Francis Marion, Sumter) | 48.25 | 29.46 | 18.79 | 12.7 | 0 |
| (Davy Crockett, Angelina, Sabine, Sam Houston, Caddo Lyndon B., Johnson Grasslands) | 19.88 | 9.15 | 10.73 | 9.72 | 0.002 |
| (El Yunque) | 3.37 | 1.82 | 1.55 | 0.37 | 0.54 |
| (Land Between the Lakes) | 28.47 | 5.41 | 23.06 | 17.25 | 0 |
| Needs in communication | |||||
| (William B. Bankhead, Talladega, Tuskegee, Conecuh) | 16.52 | 25.93 | −9.4 | 2.83 | 0.093 |
| (Daniel Boone) | 14.27 | 13.21 | 1.07 | 0.13 | 0.718 |
| (Chattahoochee-Oconee) | 4.84 | 6.78 | −1.93 | 0.73 | 0.393 |
| (Cherokee) | 13.64 | 14.71 | −1.06 | 0.16 | 0.685 |
| (Apalachicola, Osceola, Ocala) | 25.55 | 23.27 | 2.28 | 0.35 | 0.556 |
| (Kisatchie) | 24.17 | 21.74 | 2.43 | 0.32 | 0.569 |
| (De Soto, Homochito, Bienville, Delta, Tombigbee, Holly Springs) | 13.33 | 22.02 | −8.69 | 4.72 | 0.03 |
| (George Washington-Jefferson) | 9.79 | 11.11 | −1.32 | 0.3 | 0.586 |
| (St. Francis, Ouachita) | 19.92 | 25.93 | −6 | 1.33 | 0.249 |
| (Ozark) | 13.53 | 18.84 | −5.31 | 1.34 | 0.247 |
| (Nanatahala, Pisgah, Uwharrie Croatan) | 6.43 | 5.4 | 1.03 | 0.87 | 0.35 |
| (Francis Marion, Sumter) | 7.23 | 3.57 | 3.65 | 1.96 | 0.161 |
| (Davy Crockett, Angelina, Sabine, Sam Houston, Caddo Lyndon B., Johnson Grasslands) | 15.72 | 10.46 | 5.26 | 2.73 | 0.099 |
| (El Yunque) | 0.28 | 0 | 0.28 | 0.15 | 0.694 |
| (Land Between the Lakes) | 11.39 | 8.11 | 3.28 | 0.66 | 0.417 |
| Aesthetic needs | |||||
| (William B. Bankhead, Talladega, Tuskegee, Conecuh) | 1.42 | 0 | 1.42 | 0.78 | 0.377 |
| (Daniel Boone) | 6.34 | 11.32 | −4.98 | 5.34 | 0.021 |
| (Chattahoochee-Oconee) | 12.79 | 18.64 | −5.85 | 2.75 | 0.097 |
| (Cherokee) | 4.75 | 7.84 | −3.09 | 3.36 | 0.067 |
| (Apalachicola, Osceola, Ocala) | 1.68 | 1.89 | −0.21 | 0.03 | 0.859 |
| (Kisatchie) | 3.32 | 3.48 | −0.16 | 0.01 | 0.93 |
| (De Soto, Homochito, Bienville, Delta, Tombigbee, Holly Springs) | 3.03 | 1.83 | 1.2 | 0.44 | 0.507 |
| (George Washington-Jefferson) | 5.19 | 6.67 | −1.47 | 0.64 | 0.422 |
| (St. Francis, Ouachita) | 9.58 | 11.11 | −1.53 | 0.16 | 0.687 |
| (Ozark) | 3.98 | 7.25 | −3.27 | 1.45 | 0.228 |
| (Nanatahala, Pisgah, Uwharrie, Croatan) | 5.61 | 9.6 | −3.98 | 11.77 | 0.001 |
| (Francis Marion, Sumter) | 8.39 | 16.96 | −8.57 | 7.15 | 0.008 |
| (Davy Crockett, Angelina, Sabine, Sam Houston, Caddo Lyndon B., Johnson Grasslands) | 3.24 | 5.23 | −1.99 | 1.41 | 0.235 |
| (El Yunque) | 32.87 | 38.18 | −5.32 | 0.6 | 0.437 |
| (Land Between the Lakes) | 7.12 | 13.51 | −6.4 | 3.1 | 0.078 |
| Needs in mental development | |||||
| (William B. Bankhead, Talladega, Tuskegee, Conecuh) | 0 | 0 | 0 | NA | |
| (Daniel Boone) | 0.35 | 3.77 | −3.42 | 21.29 | 0 |
| (Chattahoochee-Oconee) | 0.97 | 1.69 | −0.73 | 0.46 | 0.496 |
| (Cherokee) | 0.26 | 1.47 | −1.21 | 5.8 | 0.016 |
| (Apalachicola, Osceola, Ocala) | 2.18 | 3.14 | −0.96 | 0.5 | 0.481 |
| (Kisatchie) | 1.46 | 2.61 | −1.15 | 0.83 | 0.363 |
| (De Soto, Homochito, Bienville, Delta, Tombigbee, Holly Springs) | 0.61 | 1.83 | −1.23 | 1.37 | 0.242 |
| (George Washington-Jefferson) | 0.4 | 3.89 | −3.49 | 20.13 | 0 |
| (St. Francis, Ouachita) | 0.77 | 1.23 | −0.47 | 0.16 | 0.693 |
| (Ozark) | 0.53 | 0 | 0.53 | 0.37 | 0.544 |
| (Nanatahala, Pisgah, Uwharrie, Croatan) | 2.14 | 4.8 | −2.65 | 11.63 | 0.001 |
| (Francis Marion, Sumter | 3.5 | 14.29 | −10.79 | 19.14 | 0 |
| (Davy Crockett, Angelina, Sabine, Sam Houston, Caddo Lyndon B., Johnson Grasslands) | 0.77 | 0.65 | 0.12 | 0.02 | 0.88 |
| (El Yunque) | 5.9 | 10.91 | −5.01 | 1.95 | 0.163 |
| (Land Between the Lakes) | 7.83 | 14.86 | −7.04 | 3.44 | 0.064 |
| (a) | |||||
|---|---|---|---|---|---|
| Forests | Percentage | Difference | Chi 2 Statistics | p-Value | |
| Females | Males | ||||
| Needs in relaxation and rest | |||||
| (William B. Bankhead, Talladega, Tuskegee, Conecuh) | 47.19 | 36.28 | 10.91 | 3.49 | 0.062 |
| (Daniel Boone) | 55.33 | 61.93 | −6.6 | 5.5 | 0.019 |
| (Chattahoochee-Oconee) | 63.84 | 68.93 | −5.09 | 1.5 | 0.22 |
| (Cherokee) | 50.77 | 50.95 | −0.18 | 0 | 0.949 |
| (Apalachicola, Osceola, Ocala) | 27.05 | 41.58 | −14.52 | 13.49 | 0 |
| (Kisatchie) | 31.14 | 52.02 | −20.88 | 32.91 | 0 |
| (De Soto, Homochito, Bienville, Delta, Tombigbee, Holly Springs) | 45.05 | 72.67 | −27.62 | 24.79 | 0 |
| (George Washington-Jefferson) | 52.21 | 45.35 | 6.86 | 4.89 | 0.027 |
| (St. Francis, Ouachita) | 35.71 | 47.35 | −11.64 | 2.01 | 0.156 |
| (Ozark) | 29.75 | 41.46 | −11.72 | 5.98 | 0.014 |
| (Nanatahala, Pisgah, Uwharrie, Croatan) | 72.9 | 71.27 | 1.63 | 0.68 | 0.411 |
| (Francis Marion, Sumter) | 29.58 | 34.58 | −5 | 1.18 | 0.277 |
| (Davy Crockett, Angelina, Sabine, Sam Houston, Caddo Lyndon B., Johnson Grasslands) | 43.26 | 70.43 | −27.17 | 49.87 | 0 |
| (El Yunque) | 54.77 | 57.62 | −2.85 | 0.34 | 0.562 |
| (Land Between the Lakes) | 41.13 | 51.52 | −10.39 | 3.49 | 0.062 |
| Needs in physical development | |||||
| (William B. Bankhead, Talladega, Tuskegee, Conecuh) | 35.96 | 43.85 | −7.89 | 1.78 | 0.183 |
| (Daniel Boone) | 21.52 | 17.06 | 4.46 | 3.97 | 0.046 |
| (Chattahoochee-Oconee) | 14.12 | 11.6 | 2.53 | 0.76 | 0.385 |
| (Cherokee) | 27.8 | 30.64 | −2.84 | 1.24 | 0.265 |
| (Apalachicola, Osceola, Ocala) | 36.23 | 32.05 | 4.18 | 1.18 | 0.277 |
| (Kisatchie) | 34.07 | 21.89 | 12.18 | 14.52 | 0 |
| (De Soto, Homochito, Bienville, Delta, Tombigbee, Holly Springs) | 23.08 | 11.92 | 11.16 | 7.33 | 0.007 |
| (George Washington-Jefferson) | 29.09 | 39.45 | −10.36 | 12.07 | 0.001 |
| (St. Francis, Ouachita) | 26.19 | 21.52 | 4.67 | 0.47 | 0.495 |
| (Ozark) | 53.8 | 37.63 | 16.17 | 10.84 | 0.001 |
| (Nanatahala, Pisgah, Uwharrie, Croatan) | 8.91 | 14.16 | −5.25 | 13.21 | 0 |
| (Francis Marion, Sumter) | 27.46 | 50.25 | −22.78 | 22.08 | 0 |
| (Davy Crockett, Angelina, Sabine, Sam Houston, Caddo Lyndon B., Johnson Grasslands) | 28.84 | 13.68 | 15.16 | 24.76 | 0 |
| (El Yunque) | 5.03 | 1.43 | 3.6 | 4.29 | 0.038 |
| (Land Between the Lakes) | 20.16 | 25.54 | −5.38 | 1.29 | 0.256 |
| Needs in communication | |||||
| (William B. Bankhead, Talladega, Tuskegee, Conecuh) | 13.48 | 19.24 | −5.76 | 1.56 | 0.211 |
| (Daniel Boone) | 15.78 | 13.1 | 2.68 | 1.8 | 0.18 |
| (Chattahoochee-Oconee) | 4.52 | 5.47 | −0.95 | 0.23 | 0.629 |
| (Cherokee) | 15.06 | 13.18 | 1.88 | 0.94 | 0.332 |
| (Apalachicola, Osceola, Ocala) | 31.4 | 22.71 | 8.69 | 6.03 | 0.014 |
| (Kisatchie) | 30.77 | 20.71 | 10.06 | 10.42 | 0.001 |
| (De Soto, Homochito, Bienville, Delta, Tombigbee, Holly Springs) | 24.18 | 12.79 | 11.39 | 7.25 | 0.007 |
| (George Washington-Jefferson) | 9.61 | 10.18 | −0.57 | 0.09 | 0.761 |
| (St. Francis, Ouachita) | 19.05 | 21.52 | −2.48 | 0.14 | 0.713 |
| (Ozark) | 13.92 | 14.63 | −0.71 | 0.04 | 0.838 |
| (Nanatahala, Pisgah, Uwharrie, Croatan) | 6.19 | 6.14 | 0.05 | 0 | 0.961 |
| (Francis Marion, Sumter) | 9.15 | 5.47 | 3.68 | 2.36 | 0.124 |
| (Davy Crockett, Angelina, Sabine, Sam Houston, Caddo Lyndon B., Johnson Grasslands) | 23.72 | 11.62 | 12.1 | 18.17 | 0 |
| (El Yunque) | 0 | 0.48 | −0.48 | 0.95 | 0.33 |
| (Land Between the Lakes) | 16.94 | 7.36 | 9.58 | 7.74 | 0.005 |
| Aesthetic needs | |||||
| (William B. Bankhead, Talladega, Tuskegee, Conecuh) | 3.37 | 0.63 | 2.74 | 4.29 | 0.038 |
| (Daniel Boone) | 6.56 | 7.17 | −0.61 | 0.18 | 0.674 |
| (Chattahoochee-Oconee) | 15.82 | 13.13 | 2.69 | 0.77 | 0.379 |
| (Cherokee) | 5.79 | 4.87 | 0.92 | 0.55 | 0.458 |
| (Apalachicola, Osceola, Ocala) | 2.42 | 1.47 | 0.95 | 0.8 | 0.371 |
| (Kisatchie) | 3.3 | 3.37 | −0.07 | 0 | 0.957 |
| (De Soto, Homochito, Bienville, Delta, Tombigbee, Holly Springs) | 6.59 | 1.74 | 4.85 | 6.31 | 0.012 |
| (George Washington-Jefferson) | 8.05 | 4.15 | 3.91 | 7.73 | 0.005 |
| (St. Francis, Ouachita) | 19.05 | 8.61 | 10.44 | 4.51 | 0.034 |
| (Ozark) | 1.9 | 5.92 | −4.02 | 3.85 | 0.05 |
| (Nanatahala, Pisgah, Uwharrie, Croatan) | 7.43 | 6.49 | 0.94 | 0.72 | 0.397 |
| (Francis Marion, Sumter) | 22.54 | 5.97 | 16.57 | 31.18 | 0 |
| (Davy Crockett, Angelina, Sabine, Sam Houston, Caddo Lyndon B., Johnson Grasslands) | 3.26 | 3.76 | −0.5 | 0.11 | 0.735 |
| (El Yunque) | 34.67 | 32.86 | 1.82 | 0.15 | 0.698 |
| (Land Between the Lakes) | 8.87 | 8.23 | 0.65 | 0.04 | 0.835 |
| Needs in mental development | |||||
| (William B. Bankhead, Talladega, Tuskegee, Conecuh) | 0 | 0 | 0 | NA | |
| (Daniel Boone) | 0.82 | 0.74 | 0.08 | 0.02 | 0.876 |
| (Chattahoochee-Oconee) | 1.69 | 0.88 | 0.82 | 0.78 | 0.376 |
| (Cherokee) | 0.58 | 0.36 | 0.22 | 0.36 | 0.547 |
| (Apalachicola, Osceola, Ocala) | 2.9 | 2.2 | 0.7 | 0.32 | 0.574 |
| (Kisatchie) | 0.73 | 2.02 | −1.29 | 1.95 | 0.162 |
| (De Soto, Homochito, Bienville, Delta, Tombigbee, Holly Springs) | 1.1 | 0.87 | 0.23 | 0.04 | 0.84 |
| (George Washington-Jefferson) | 1.04 | 0.88 | 0.16 | 0.07 | 0.789 |
| (St. Francis, Ouachita) | 0 | 0.99 | −0.99 | 0.42 | 0.516 |
| (Ozark) | 0.63 | 0.35 | 0.28 | 0.18 | 0.668 |
| (Nanatahala, Pisgah, Uwharrie, Croatan) | 4.58 | 1.95 | 2.63 | 12.67 | 0 |
| (Francis Marion, Sumter) | 11.27 | 3.73 | 7.54 | 11.09 | 0.001 |
| (Davy Crockett, Angelina, Sabine, Sam Houston, Caddo Lyndon B., Johnson Grasslands) | 0.93 | 0.51 | 0.42 | 0.44 | 0.507 |
| (El Yunque) | 5.53 | 7.62 | −2.09 | 0.72 | 0.395 |
| (Land Between the Lakes) | 12.9 | 7.36 | 5.54 | 2.94 | 0.086 |
| (b) | |||||
| Forests | Percentage | Difference | Chi 2 Statistics | p-Value | |
| Non-White | White | ||||
| Needs in relaxation and rest | |||||
| (William B. Bankhead, Talladega, Tuskegee, Conecuh) | 27.03 | 39.05 | −12.02 | 2.07 | 0.15 |
| (Daniel Boone) | 49.12 | 58.66 | −9.54 | 3.89 | 0.049 |
| (Chattahoochee-Oconee) | 30.61 | 67.23 | −36.61 | 47.9 | 0 |
| (Cherokee) | 18.52 | 50.58 | −32.06 | 76.59 | 0 |
| (Apalachicola, Osceola, Ocala) | 39.19 | 37.05 | 2.14 | 0.13 | 0.717 |
| (Kisatchie) | 40.43 | 45.19 | −4.77 | 0.41 | 0.523 |
| (De Soto, Homochito, Bienville, Delta, Tombigbee, Holly Springs) | 40.45 | 64.66 | −24.21 | 17.81 | 0 |
| (George Washington-Jefferson) | 37.63 | 47.61 | −9.97 | 3.43 | 0.064 |
| (St. Francis, Ouachita) | 1.61 | 46.73 | −45.11 | 81.5 | 0 |
| (Ozark) | 14.46 | 38.18 | −23.72 | 17.24 | 0 |
| (Nanatahala, Pisgah, Uwharrie, Croatan) | 34.43 | 71.76 | −37.34 | 109.73 | 0 |
| (Francis Marion, Sumter) | 17.31 | 33.72 | −16.41 | 5.83 | 0.016 |
| (Davy Crockett, Angelina, Sabine, Sam Houston, Caddo Lyndon B., Johnson Grasslands) | 25.42 | 63.19 | −37.77 | 32.74 | 0 |
| (El Yunque) | 42.42 | 58.66 | −16.24 | 8.1 | 0.004 |
| (Land Between the Lakes) | 47.06 | 46.47 | 0.59 | 0 | 0.948 |
| Needs in physical development | |||||
| (William B. Bankhead, Talladega, Tuskegee, Conecuh) | 37.84 | 41.42 | −3.59 | 0.18 | 0.672 |
| (Daniel Boone) | 7.02 | 19.28 | −12.26 | 10.52 | 0.001 |
| (Chattahoochee-Oconee) | 3.06 | 12.61 | −9.54 | 7.67 | 0.006 |
| (Cherokee) | 10.19 | 29.54 | −19.36 | 35.38 | 0 |
| (Apalachicola, Osceola, Ocala) | 25.68 | 33.43 | −7.75 | 1.83 | 0.177 |
| (Kisatchie) | 19.15 | 25.84 | −6.69 | 1.05 | 0.306 |
| (De Soto, Homochito, Bienville, Delta, Tombigbee, Holly Springs) | 0 | 15.79 | −15.79 | 16.14 | 0 |
| (George Washington-Jefferson) | 24.73 | 36.4 | −11.67 | 5.11 | 0.024 |
| (St. Francis, Ouachita) | 1.61 | 22.02 | −20.41 | 27.36 | 0 |
| (Ozark) | 20.48 | 43.35 | −22.87 | 15.08 | 0 |
| (Nanatahala, Pisgah, Uwharrie, Croatan) | 2.19 | 12.57 | −10.39 | 17.55 | 0 |
| (Francis Marion, Sumter) | 23.08 | 44.77 | −21.69 | 9.08 | 0.003 |
| (Davy Crockett, Angelina, Sabine, Sam Houston, Caddo Lyndon B., Johnson Grasslands) | 3.39 | 18.15 | −14.76 | 8.42 | 0.004 |
| (El Yunque) | 4.04 | 2.74 | 1.3 | 0.44 | 0.507 |
| (Land Between the Lakes) | 8.82 | 23.82 | −15 | 3.99 | 0.046 |
| Needs in communication | |||||
| (William B. Bankhead, Talladega, Tuskegee, Conecuh) | 10.81 | 18.21 | −7.39 | 1.27 | 0.259 |
| (Daniel Boone) | 6.14 | 14.46 | −8.32 | 6.09 | 0.014 |
| (Chattahoochee-Oconee) | 1.02 | 5.38 | −4.36 | 3.52 | 0.061 |
| (Cherokee) | 2.78 | 14.31 | −11.53 | 22.26 | 0 |
| (Apalachicola, Osceola, Ocala) | 18.92 | 25.33 | −6.41 | 1.47 | 0.225 |
| (Kisatchie) | 17.02 | 23.92 | −6.9 | 1.18 | 0.278 |
| (De Soto, Homochito, Bienville, Delta, Tombigbee, Holly Springs) | 6.74 | 15.54 | −8.8 | 4.7 | 0.03 |
| (George Washington-Jefferson) | 10.75 | 9.76 | 1 | 0.1 | 0.757 |
| (St. Francis, Ouachita) | 4.03 | 20.24 | −16.21 | 17.82 | 0 |
| (Ozark) | 13.25 | 13.05 | 0.2 | 0 | 0.961 |
| (Nanatahala, Pisgah, Uwharrie, Croatan) | 2.19 | 6.17 | −3.99 | 4.86 | 0.027 |
| (Francis Marion, Sumter) | 1.92 | 6.59 | −4.67 | 1.78 | 0.182 |
| (Davy Crockett, Angelina, Sabine, Sam Houston, Caddo Lyndon B., Johnson Grasslands) | 11.86 | 14.41 | −2.55 | 0.29 | 0.589 |
| (El Yunque) | 0 | 0.3 | −0.3 | 0.3 | 0.583 |
| (Land Between the Lakes) | 2.94 | 11.18 | −8.24 | 2.24 | 0.134 |
| Aesthetic needs | |||||
| (William B. Bankhead, Talladega, Tuskegee, Conecuh) | 24.32 | 1.32 | 23.01 | 54.86 | 0 |
| (Daniel Boone) | 35.96 | 6.94 | 29.02 | 102.96 | 0 |
| (Chattahoochee-Oconee) | 65.31 | 13.61 | 51.69 | 135.89 | 0 |
| (Cherokee) | 68.06 | 5.18 | 62.87 | 601.17 | 0 |
| (Apalachicola, Osceola, Ocala) | 14.86 | 1.74 | 13.13 | 39.51 | 0 |
| (Kisatchie) | 21.28 | 3.49 | 17.79 | 33.21 | 0 |
| (De Soto, Homochito, Bienville, Delta, Tombigbee, Holly Springs) | 52.81 | 3.01 | 49.8 | 169.81 | 0 |
| (George Washington-Jefferson) | 26.88 | 5.24 | 21.64 | 62.41 | 0 |
| (St. Francis, Ouachita) | 92.74 | 10.12 | 82.62 | 282.34 | 0 |
| (Ozark) | 51.81 | 4.93 | 46.88 | 134.95 | 0 |
| (Nanatahala, Pisgah, Uwharrie, Croatan) | 59.02 | 6.63 | 52.38 | 484.48 | 0 |
| (Francis Marion, Sumter) | 48.08 | 9.88 | 38.19 | 59.46 | 0 |
| (Davy Crockett, Angelina, Sabine, Sam Houston, Caddo Lyndon B., Johnson Grasslands) | 57.63 | 3.6 | 54.02 | 233.08 | 0 |
| (El Yunque) | 44.44 | 32.52 | 11.92 | 4.74 | 0.03 |
| (Land Between the Lakes) | 35.29 | 8.82 | 26.47 | 21.73 | 0 |
| Needs in mental development | |||||
| (William B. Bankhead, Talladega, Tuskegee, Conecuh) | 0 | 0 | 0 | NA | |
| (Daniel Boone) | 1.75 | 0.65 | 1.1 | 1.7 | 0.192 |
| (Chattahoochee-Oconee) | 0 | 1.18 | −1.18 | 1.16 | 0.28 |
| (Cherokee) | 0.46 | 0.39 | 0.08 | 0.03 | 0.869 |
| (Apalachicola, Osceola, Ocala) | 1.35 | 2.46 | −1.11 | 0.36 | 0.55 |
| (Kisatchie) | 2.13 | 1.56 | 0.57 | 0.09 | 0.763 |
| (De Soto, Homochito, Bienville, Delta, Tombigbee, Holly Springs) | 0 | 1 | −1 | 0.9 | 0.343 |
| (George Washington-Jefferson) | 0 | 0.99 | −0.99 | 0.93 | 0.334 |
| (St. Francis, Ouachita) | 0 | 0.89 | −0.89 | 1.11 | 0.291 |
| (Ozark) | 0 | 0.49 | −0.49 | 0.41 | 0.522 |
| (Nanatahala, Pisgah, Uwharrie, Croatan) | 2.19 | 2.86 | −0.67 | 0.28 | 0.598 |
| (Francis Marion, Sumter) | 9.62 | 5.04 | 4.58 | 1.92 | 0.166 |
| (Davy Crockett, Angelina, Sabine, Sam Houston, Caddo Lyndon B., Johnson Grasslands) | 1.69 | 0.64 | 1.05 | 0.85 | 0.356 |
| (El Yunque) | 9.09 | 5.78 | 3.32 | 1.37 | 0.242 |
| (Land Between the Lakes) | 5.88 | 9.71 | −3.82 | 0.53 | 0.465 |
| Forests | Percentage | Difference | Chi 2 Statistics | p-Value | |
|---|---|---|---|---|---|
| Low Income | High Income | ||||
| Needs in relaxation and rest | |||||
| (William B. Bankhead, Talladega, Tuskegee, Conecuh) | 33.85 | 40 | −6.15 | 0.3 | 0.585 |
| (Daniel Boone) | 51.63 | 62.5 | −10.87 | 3.17 | 0.075 |
| (Chattahoochee-Oconee) | 66.33 | 69.7 | −3.37 | 0.2 | 0.651 |
| (Cherokee) | 51.18 | 55.1 | −3.92 | 0.44 | 0.509 |
| (Apalachicola, Osceola, Ocala) | 40.77 | 25.45 | 15.31 | 3.92 | 0.048 |
| (Kisatchie) | 46.04 | 50.82 | −4.78 | 0.43 | 0.512 |
| (De Soto, Homochito, Bienville, Delta, Tombigbee, Holly Springs) | 75 | 62.5 | 12.5 | 0.48 | 0.486 |
| (George Washington-Jefferson) | 48.97 | 38.28 | 10.69 | 3.56 | 0.059 |
| (St. Francis, Ouachita) | 46.67 | 33.33 | 13.33 | 1.04 | 0.307 |
| (Ozark) | 38.64 | 32 | 6.64 | 0.37 | 0.545 |
| (Nanatahala, Pisgah, Uwharrie, Croatan) | 71.24 | 70.8 | 0.44 | 0.01 | 0.905 |
| (Francis Marion, Sumter) | 31.76 | 30.77 | 1 | 0.01 | 0.912 |
| (Davy Crockett, Angelina, Sabine, Sam Houston, Caddo Lyndon B., Johnson Grasslands) | 66.67 | 52.5 | 14.17 | 4.21 | 0.04 |
| (El Yunque) | 51.92 | 61.9 | −9.98 | 1.16 | 0.281 |
| (Land Between the Lakes) | 50 | 42.11 | 7.89 | 0.55 | 0.458 |
| Needs in physical development | |||||
| (William B. Bankhead, Talladega, Tuskegee, Conecuh) | 46.15 | 36 | 10.15 | 0.76 | 0.384 |
| (Daniel Boone) | 21.4 | 21.88 | −0.48 | 0.01 | 0.924 |
| (Chattahoochee-Oconee) | 12.24 | 12.12 | 0.12 | 0 | 0.981 |
| (Cherokee) | 27.17 | 26.53 | 0.63 | 0.01 | 0.904 |
| (Apalachicola, Osceola, Ocala) | 28.46 | 36.36 | −7.9 | 1.13 | 0.287 |
| (Kisatchie) | 25.25 | 22.95 | 2.3 | 0.13 | 0.716 |
| (De Soto, Homochito, Bienville, Delta, Tombigbee, Holly Springs) | 10.71 | 37.5 | −26.79 | 3.21 | 0.073 |
| (George Washington-Jefferson) | 32.99 | 43.75 | −10.76 | 3.82 | 0.051 |
| (St. Francis, Ouachita) | 24.44 | 52.38 | −27.94 | 5.03 | 0.025 |
| (Ozark) | 43.18 | 48 | −4.82 | 0.18 | 0.669 |
| (Nanatahala, Pisgah, Uwharrie, Croatan) | 11.61 | 12.8 | −1.19 | 0.2 | 0.654 |
| (Francis Marion, Sumter) | 48.24 | 35.9 | 12.34 | 1.65 | 0.199 |
| (Davy Crockett, Angelina, Sabine, Sam Houston, Caddo Lyndon B., Johnson Grasslands) | 13.64 | 23.75 | −10.11 | 3.54 | 0.06 |
| (El Yunque) | 0 | 3.17 | −3.17 | 1.68 | 0.195 |
| (Land Between the Lakes) | 17.31 | 31.58 | −14.27 | 2.5 | 0.114 |
| Needs in communication | |||||
| (William B. Bankhead, Talladega, Tuskegee, Conecuh) | 18.46 | 20 | −1.54 | 0.03 | 0.867 |
| (Daniel Boone) | 17.21 | 10.42 | 6.79 | 2.39 | 0.122 |
| (Chattahoochee-Oconee) | 7.14 | 4.55 | 2.6 | 0.46 | 0.495 |
| (Cherokee) | 17.32 | 12.24 | 5.08 | 1.36 | 0.243 |
| (Apalachicola, Osceola, Ocala) | 26.15 | 32.73 | −6.57 | 0.83 | 0.363 |
| (Kisatchie) | 22.28 | 26.23 | −3.95 | 0.41 | 0.522 |
| (De Soto, Homochito, Bienville, Delta, Tombigbee, Holly Springs) | 14.29 | 0 | 14.29 | 1.29 | 0.257 |
| (George Washington-Jefferson) | 11.86 | 7.81 | 4.04 | 1.37 | 0.242 |
| (St. Francis, Ouachita) | 22.22 | 4.76 | 17.46 | 3.14 | 0.076 |
| (Ozark) | 15.91 | 8 | 7.91 | 1 | 0.317 |
| (Nanatahala, Pisgah, Uwharrie, Croatan) | 6.6 | 6.4 | 0.2 | 0.01 | 0.922 |
| (Francis Marion, Sumter) | 3.53 | 12.82 | −9.29 | 3.82 | 0.051 |
| (Davy Crockett, Angelina, Sabine, Sam Houston, Caddo Lyndon B., Johnson Grasslands) | 15.91 | 16.25 | −0.34 | 0 | 0.948 |
| (El Yunque) | 0 | 0 | 0 | NA | NA |
| (Land Between the Lakes) | 11.54 | 7.89 | 3.64 | 0.32 | 0.569 |
| Aesthetic needs | |||||
| (William B. Bankhead, Talladega, Tuskegee, Conecuh) | 1.54 | 4 | −2.46 | 0.5 | 0.478 |
| (Daniel Boone) | 9.3 | 5.21 | 4.09 | 1.5 | 0.22 |
| (Chattahoochee-Oconee) | 13.27 | 12.12 | 1.14 | 0.05 | 0.83 |
| (Cherokee) | 4.33 | 6.12 | −1.79 | 0.49 | 0.482 |
| (Apalachicola, Osceola, Ocala) | 1.54 | 3.64 | −2.1 | 0.8 | 0.37 |
| (Kisatchie) | 3.96 | 0 | 3.96 | 2.49 | 0.114 |
| (De Soto, Homochito, Bienville, Delta, Tombigbee, Holly Springs) | 0 | 0 | 0 | NA | NA |
| (George Washington-Jefferson) | 4.64 | 9.38 | −4.74 | 2.84 | 0.092 |
| (St. Francis, Ouachita) | 6.67 | 9.52 | −2.86 | 0.17 | 0.683 |
| (Ozark) | 2.27 | 12 | −9.73 | 4.36 | 0.037 |
| (Nanatahala, Pisgah, Uwharrie, Croatan) | 7.12 | 8.4 | −1.28 | 0.35 | 0.555 |
| (Francis Marion, Sumter) | 11.76 | 7.69 | 4.07 | 0.47 | 0.492 |
| (Davy Crockett, Angelina, Sabine, Sam Houston, Caddo Lyndon B., Johnson Grasslands) | 3.03 | 6.25 | −3.22 | 1.27 | 0.26 |
| (El Yunque) | 28.85 | 28.57 | 0.27 | 0 | 0.974 |
| (Land Between the Lakes) | 7.69 | 2.63 | 5.06 | 1.07 | 0.301 |
| Needs in mental development | |||||
| (William B. Bankhead, Talladega, Tuskegee, Conecuh) | 0 | 0 | 0 | NA | |
| (Daniel Boone) | 0.47 | 0 | 0.47 | 0.45 | 0.503 |
| (Chattahoochee-Oconee) | 1.02 | 1.52 | −0.49 | 0.08 | 0.777 |
| (Cherokee) | 0 | 0 | 0 | NA | NA |
| (Apalachicola, Osceola, Ocala) | 3.08 | 1.82 | 1.26 | 0.23 | 0.629 |
| (Kisatchie) | 2.48 | 0 | 2.48 | 1.54 | 0.215 |
| (De Soto, Homochito, Bienville, Delta, Tombigbee, Holly Springs) | 0 | 0 | 0 | NA | NA |
| (George Washington-Jefferson) | 1.55 | 0.78 | 0.77 | 0.37 | 0.544 |
| (St. Francis, Ouachita) | 0 | 0 | 0 | NA | NA |
| (Ozark) | 0 | 0 | 0 | NA | NA |
| (Nanatahala, Pisgah, Uwharrie, Croatan) | 3.43 | 1.6 | 1.83 | 1.92 | 0.166 |
| (Francis Marion, Sumter) | 4.71 | 12.82 | −8.11 | 2.62 | 0.106 |
| (Davy Crockett, Angelina, Sabine, Sam Houston, Caddo Lyndon B., Johnson Grasslands) | 0.76 | 1.25 | −0.49 | 0.13 | 0.719 |
| (El Yunque) | 19.23 | 6.35 | 12.88 | 4.42 | 0.035 |
| (Land Between the Lakes) | 13.46 | 15.79 | −2.33 | 0.1 | 0.756 |
Publisher’s Note: MDPI stays neutral with regard to jurisdictional claims in published maps and institutional affiliations. |
© 2022 by the authors. Licensee MDPI, Basel, Switzerland. This article is an open access article distributed under the terms and conditions of the Creative Commons Attribution (CC BY) license (https://creativecommons.org/licenses/by/4.0/).
Share and Cite
Jean, R.; Naka, K.; Christian, C.S.; Gyawali, B.R.; Bowman, T.; Hopkinson, S. Identifying Primary Drivers of Participants from Various Socioeconomic Backgrounds to Choose National Forest Lands in the Southeastern Region of the US as a Travel Destination for Recreation. Land 2022, 11, 1301. https://doi.org/10.3390/land11081301
Jean R, Naka K, Christian CS, Gyawali BR, Bowman T, Hopkinson S. Identifying Primary Drivers of Participants from Various Socioeconomic Backgrounds to Choose National Forest Lands in the Southeastern Region of the US as a Travel Destination for Recreation. Land. 2022; 11(8):1301. https://doi.org/10.3390/land11081301
Chicago/Turabian StyleJean, Rosny, Kozma Naka, Colmore S. Christian, Buddhi Raj Gyawali, Troy Bowman, and Sampson Hopkinson. 2022. "Identifying Primary Drivers of Participants from Various Socioeconomic Backgrounds to Choose National Forest Lands in the Southeastern Region of the US as a Travel Destination for Recreation" Land 11, no. 8: 1301. https://doi.org/10.3390/land11081301
APA StyleJean, R., Naka, K., Christian, C. S., Gyawali, B. R., Bowman, T., & Hopkinson, S. (2022). Identifying Primary Drivers of Participants from Various Socioeconomic Backgrounds to Choose National Forest Lands in the Southeastern Region of the US as a Travel Destination for Recreation. Land, 11(8), 1301. https://doi.org/10.3390/land11081301