
The Impact of Salinization and Wind Erosion on the Texture of Surface Soils: An Investigation of Paired Samples from Soils with and without Salt Crust


Abstract
:1. Introduction
2. Materials and Methods
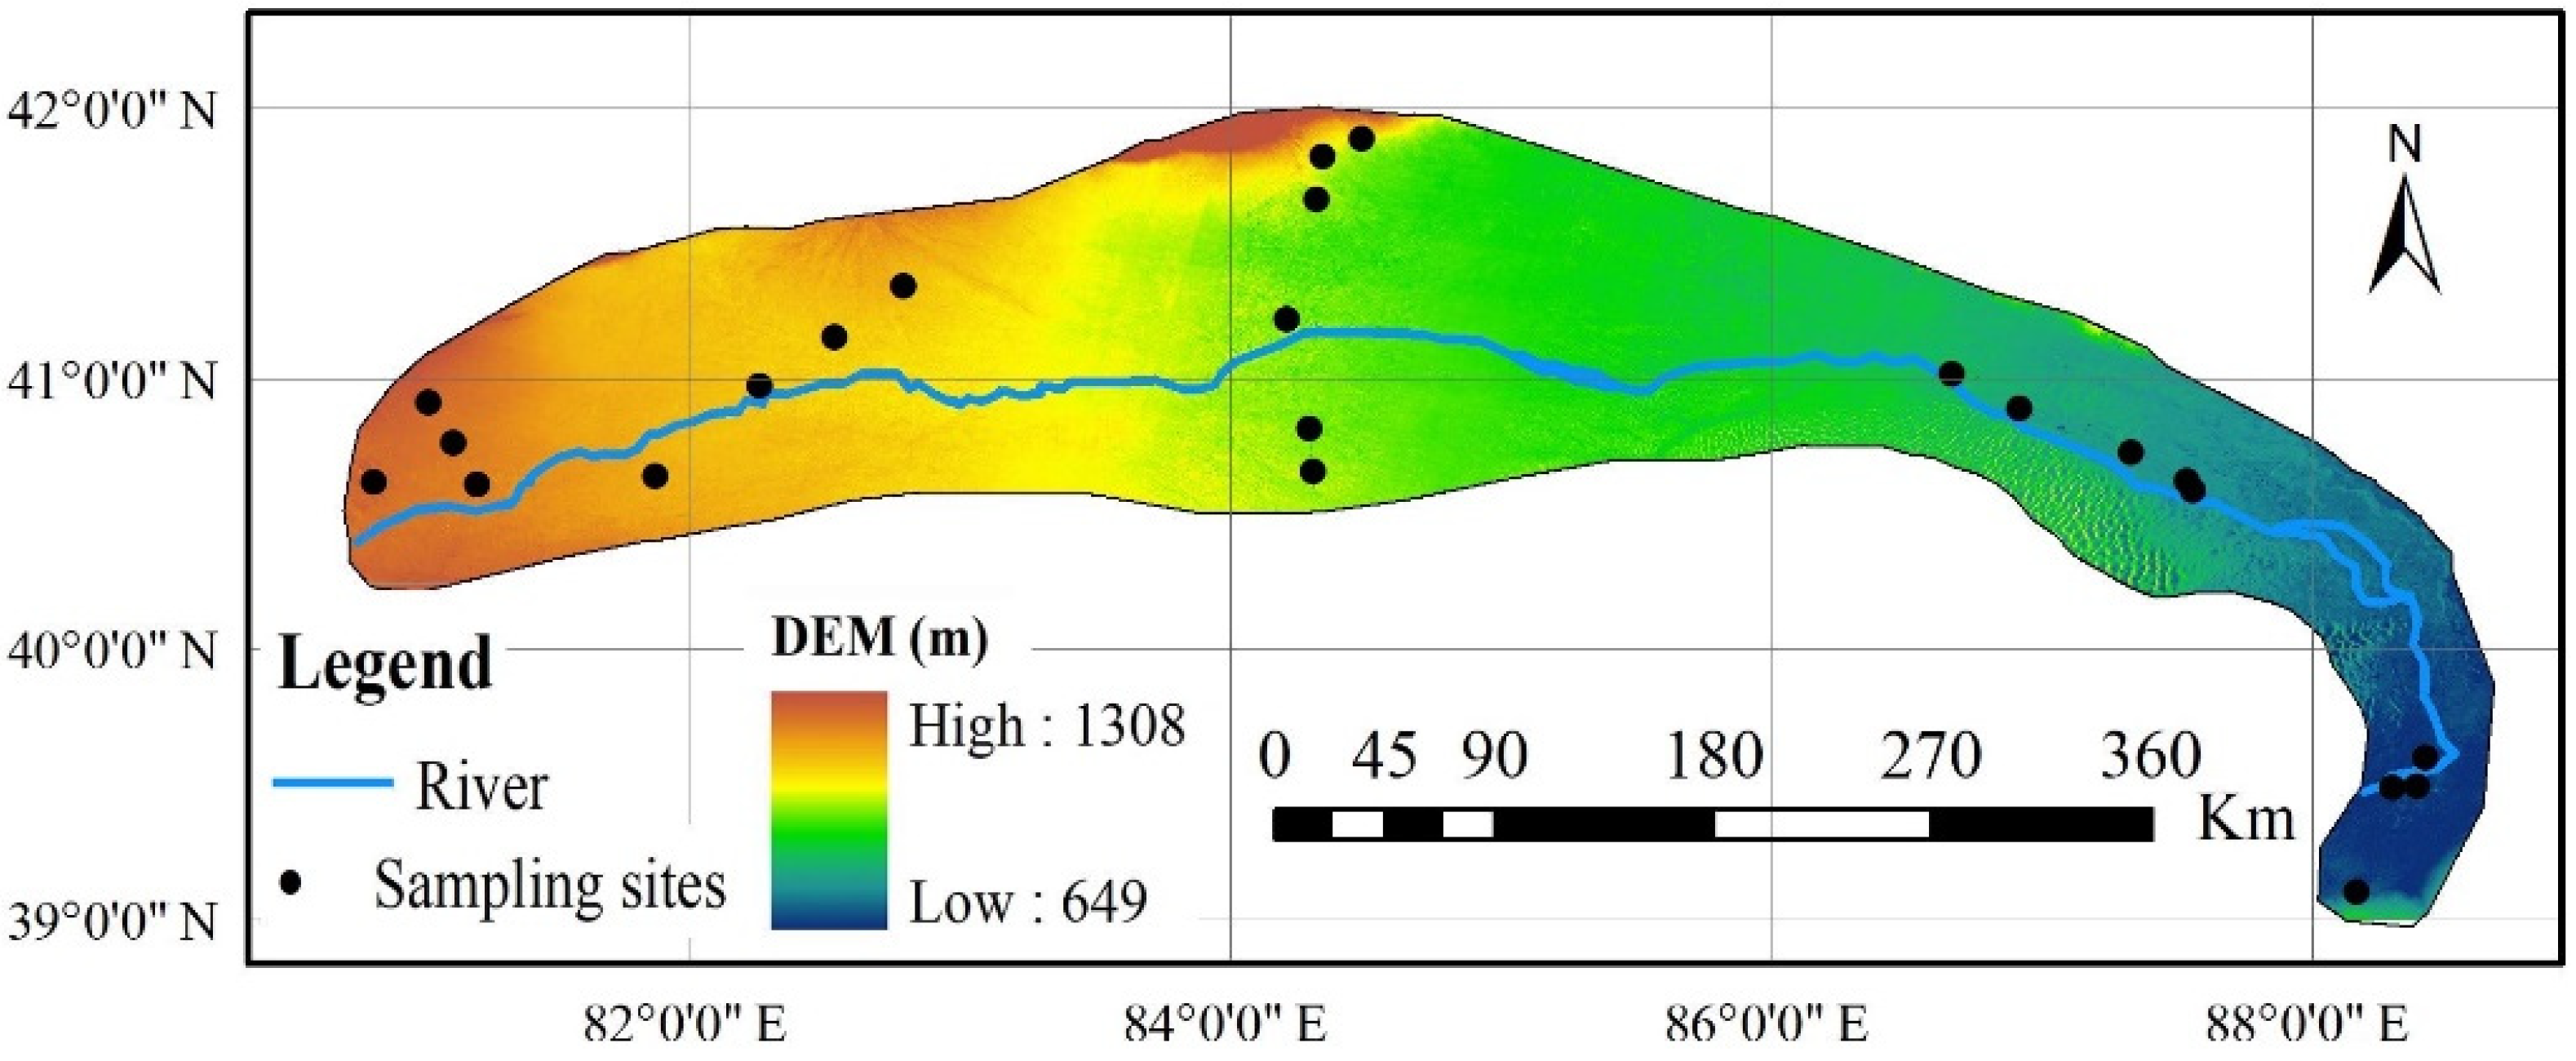
2.1. Study Area
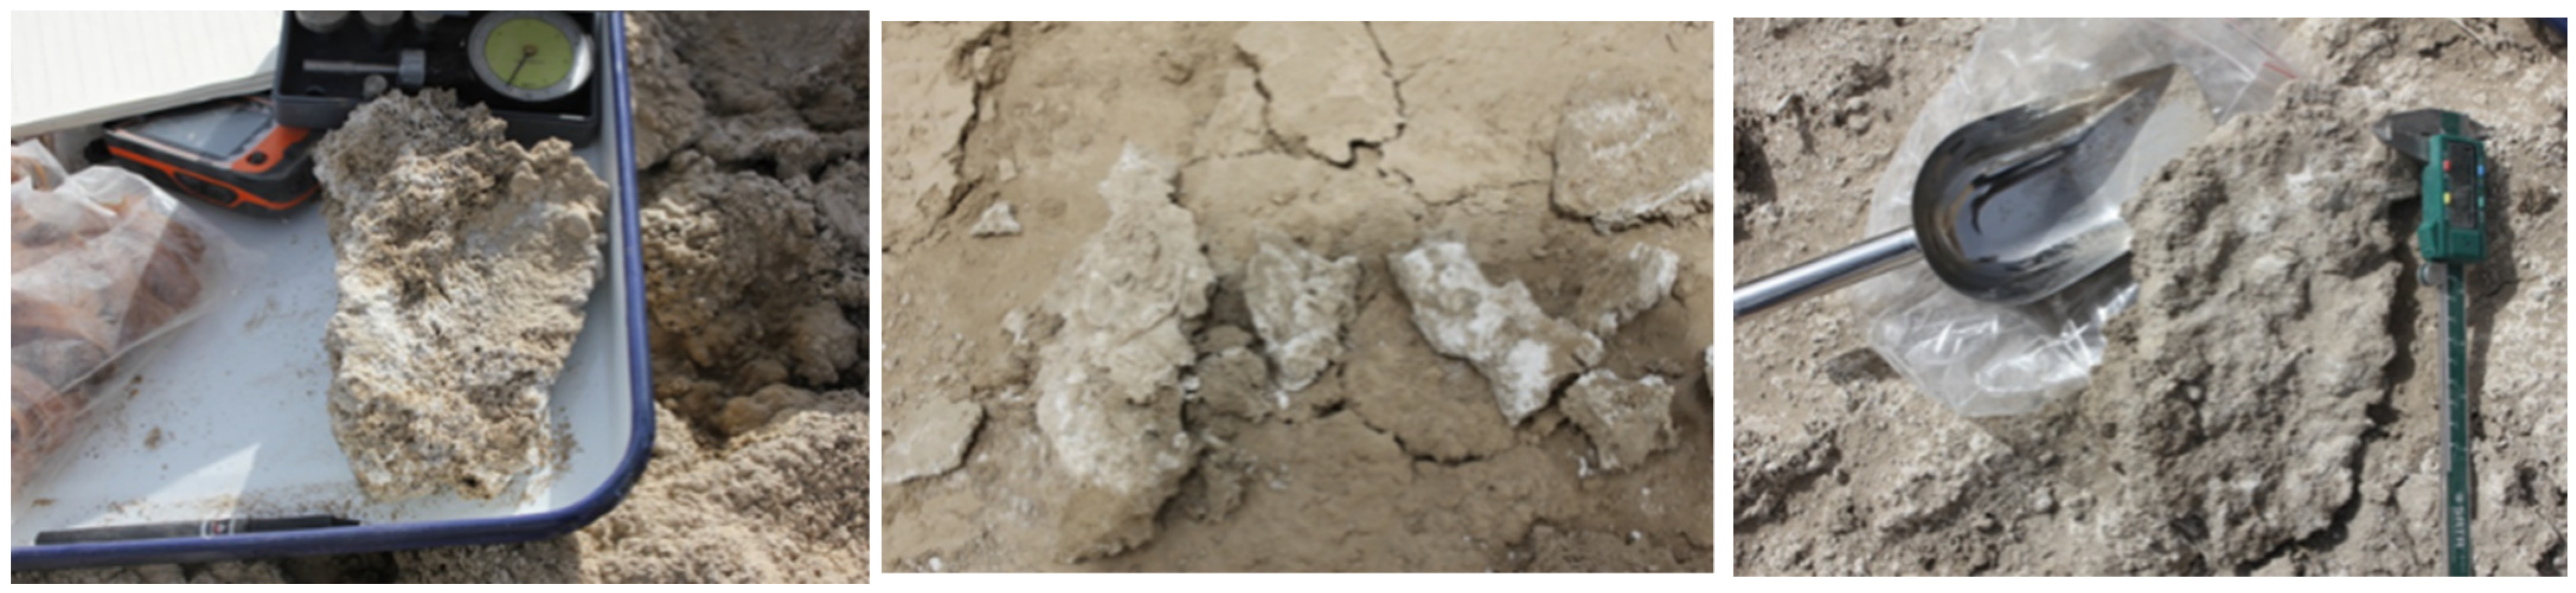
2.2. Soil Sampling
2.3. Soil Analysis
2.4. Statistical Analysis
3. Results
3.1. Salts, Electrical Conductivity, and pH
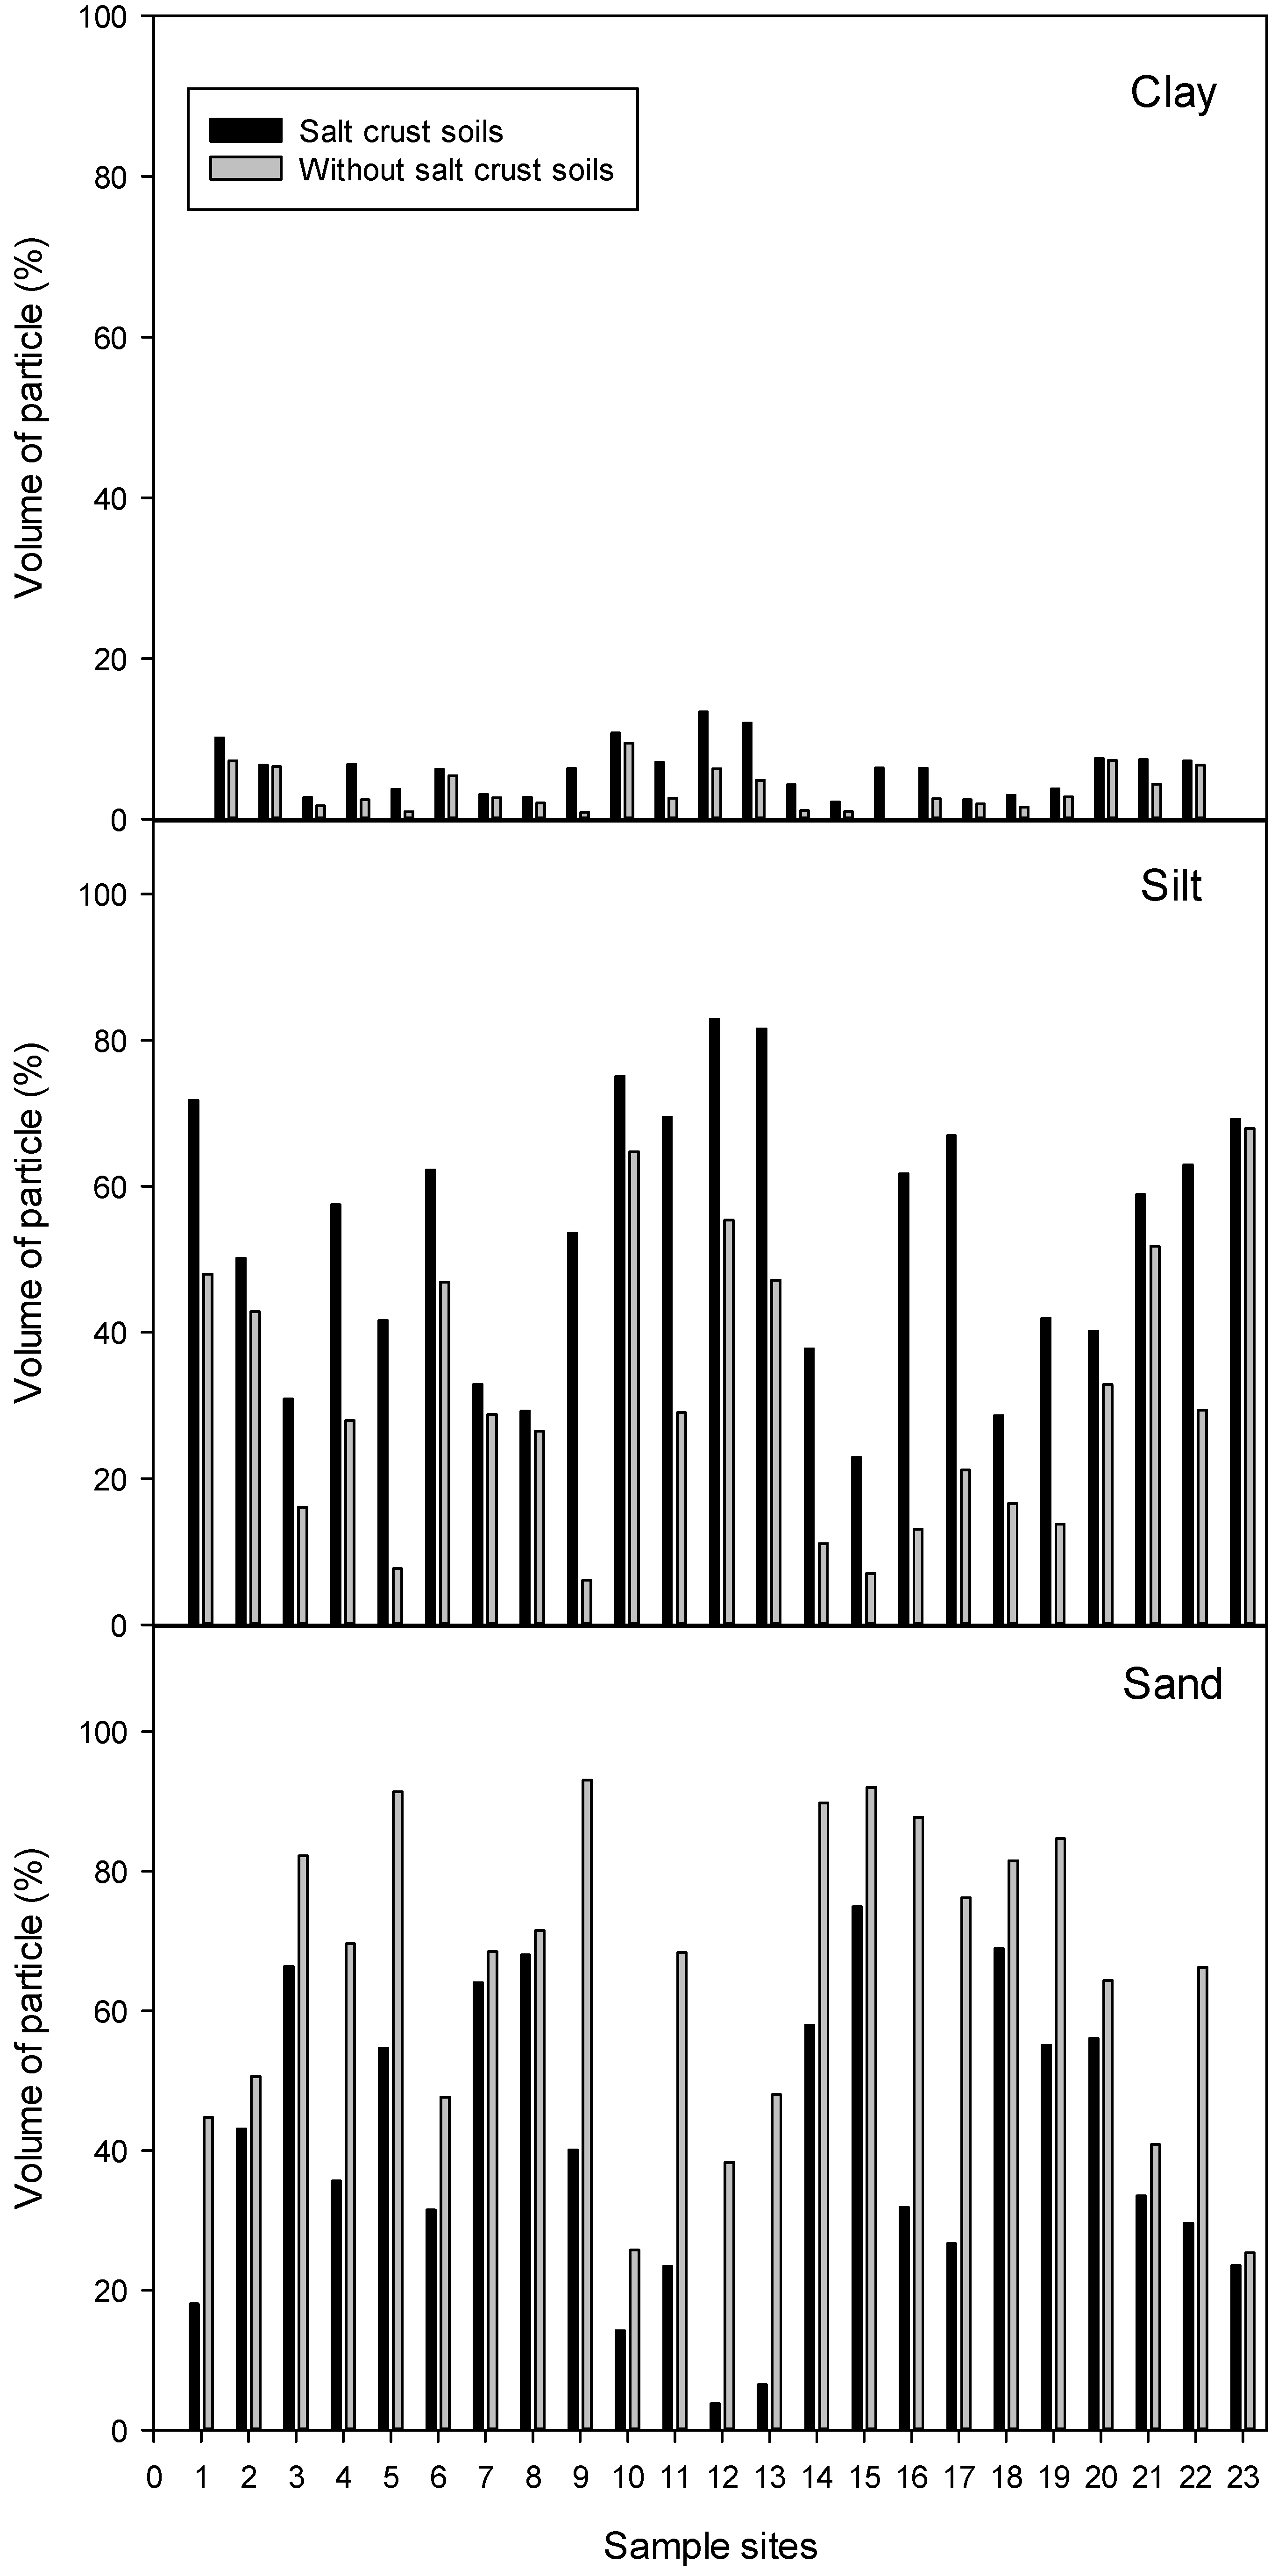
3.2. Soil Texture and Particle Size Distribution
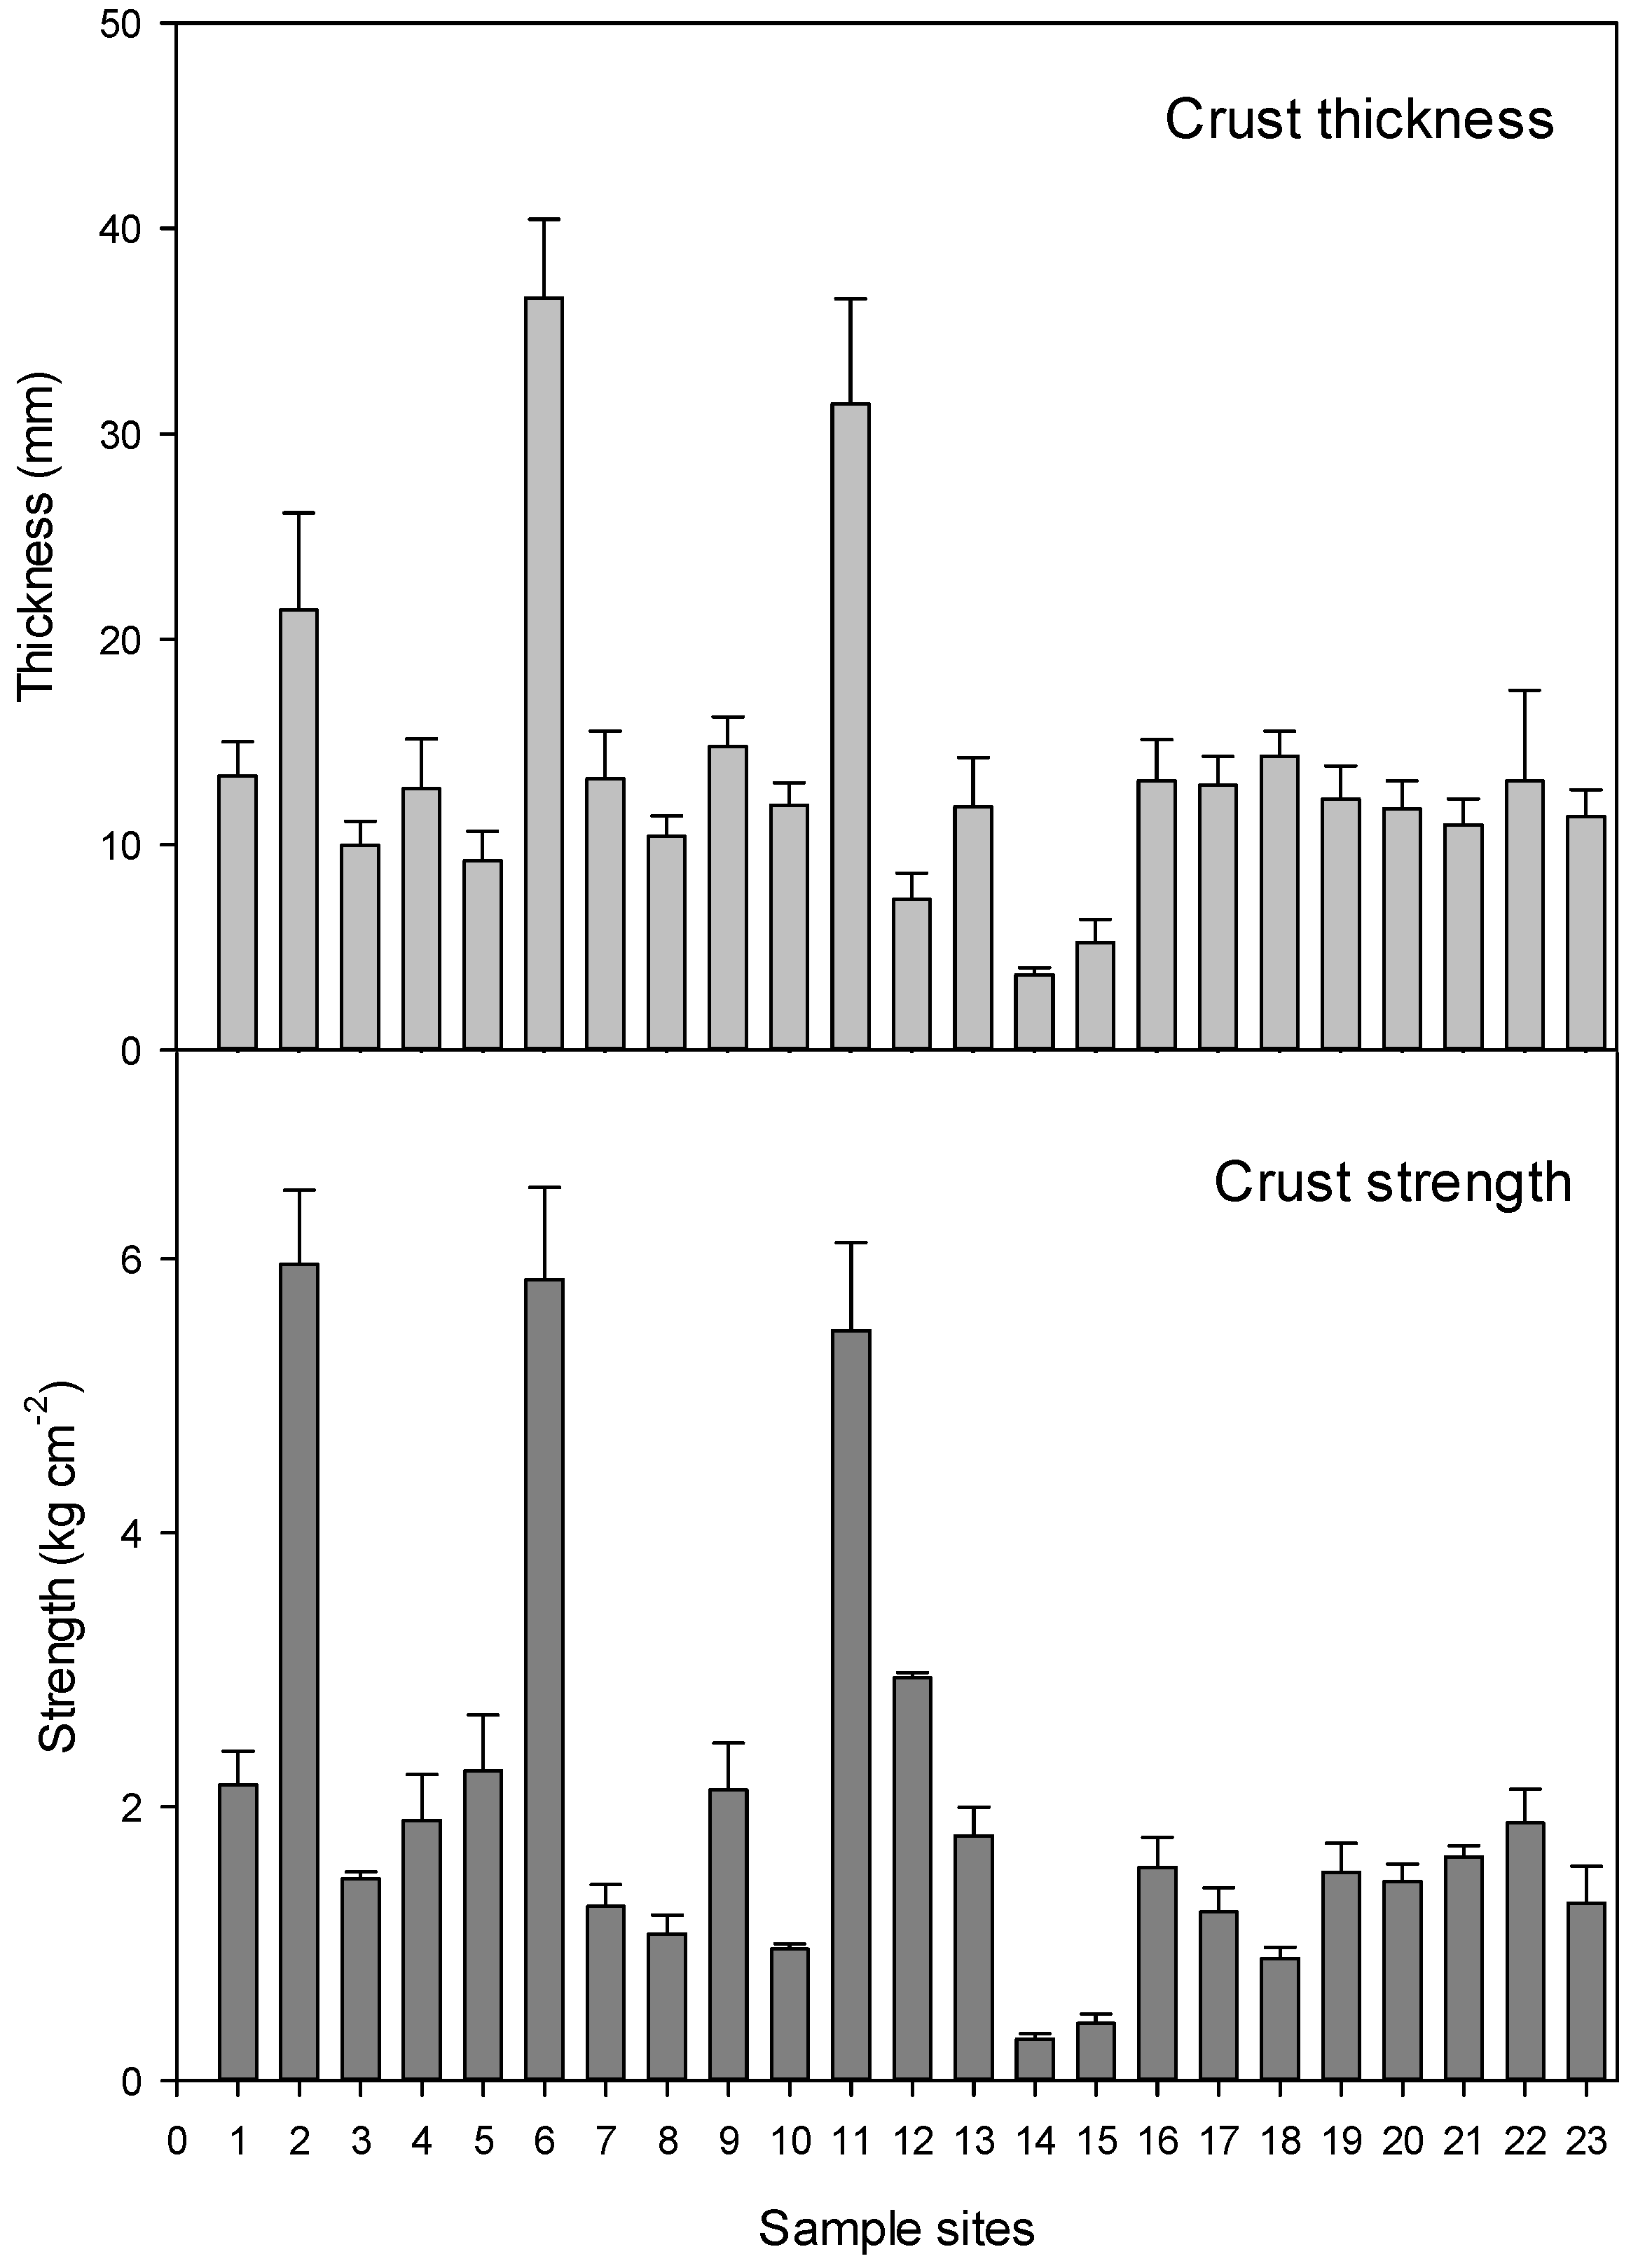
3.3. Crust Thickness and Strength
4. Discussion
4.1. Soil Texture
4.2. Salt Crust
4.3. Soil Salinization and Soil Erosion
5. Conclusions
Author Contributions
Funding
Institutional Review Board Statement
Informed Consent Statement
Data Availability Statement
Conflicts of Interest
References
- Jarrah, M.; Mayel, S.; Tatarko, J.; Funk, R.; Kuka, K. A review of wind erosion models: Data requirements, processes, and validity. Catena 2020, 187, 104388. [Google Scholar] [CrossRef]
- Lyu, X.; Li, X.; Wang, H.; Gong, J.; Li, S.; Dou, H.; Dang, D. Soil wind erosion evaluation and sustainable management of typical steppe in Inner Mongolia, China. J. Environ. Manag. 2021, 277, 111488. [Google Scholar] [CrossRef] [PubMed]
- Lemboye, K.; Almajed, A.; Alnuaim, A.; Arab, M.; Alshibli, K. Improving sand wind erosion resistance using renewable agriculturally derived biopolymers. Aeolian Res. 2021, 49, 100663. [Google Scholar] [CrossRef]
- Du, H.; Zuo, X.; Li, S.; Wang, T.; Xue, X. Wind erosion changes induced by different grazing intensities in the desert steppe, Northern China. Agric. Ecosyst. Environ. 2019, 274, 1–13. [Google Scholar] [CrossRef]
- Chappell, A.; Webb, N.P.; Leys, J.F.; Waters, C.M.; Orgill, S.; Eyres, M.J. Minimising soil organic carbon erosion by wind is critical for land degradation neutrality. Environ. Sci. Policy 2019, 93, 43–52. [Google Scholar] [CrossRef]
- Yan, Y.; Xin, X.; Xu, X.; Wang, X.; Yang, G.; Yan, R.; Chen, B. Quantitative effects of wind erosion on the soil texture and soil nutrients under different vegetation coverage in a semiarid steppe of northern China. Plant Soil 2013, 369, 585–598. [Google Scholar] [CrossRef]
- Li, X.; Feng, G.; Sharratt, B.; Zheng, Z. Aerodynamic properties of agricultural and natural surfaces in northwestern Tarim Basin. Agric. For. Meteorol. 2015, 204, 37–45. [Google Scholar] [CrossRef]
- Li, X.; Feng, G.; Sharratt, B.S.; Zheng, Z.; Pi, H.; Gao, F. Soil Wind Erodibility Based on Dry Aggregate-Size Distribution in the Tarim Basin. Soil Sci. Soc. Am. J. 2014, 78, 2009–2016. [Google Scholar] [CrossRef]
- Colazo, J.C.; Buschiazzo, D. The Impact of Agriculture on Soil Texture Due to Wind Erosion. Land Degrad. Dev. 2015, 26, 62–70. [Google Scholar] [CrossRef]
- Li, J.; Okin, G.S.; Alvarez, L.; Epstein, H. Effects of wind erosion on the spatial heterogeneity of soil nutrients in two desert grassland communities. Biogeochemistry 2008, 88, 73–88. [Google Scholar] [CrossRef]
- Li, J.; Okin, G.S.; Epstein, H.E. Effects of enhanced wind erosion on surface soil texture and characteristics of windblown sediments. J. Geophys. Res. Biogeosci. 2009, 114, G02003. [Google Scholar] [CrossRef] [Green Version]
- Li, X.; Shi, F. The Effect of Flooding on Evaporation and the Groundwater Table for a Salt-Crusted Soil. Water 2019, 11, 1003. [Google Scholar] [CrossRef] [Green Version]
- Nield, J.M.; McKenna Neuman, C.; O’Brien, P.; Bryant, R.G.; Wiggs, G.F.S. Evaporative sodium salt crust development and its wind tunnel derived transport dynamics under variable climatic conditions. Aeolian Res. 2016, 23, 51–62. [Google Scholar] [CrossRef] [Green Version]
- Li, X.; Shi, F. Effects of evolving salt precipitation on the evaporation and temperature of sandy soil with a fixed groundwater table. Vadose Zone J. 2021, 20, e20122. [Google Scholar] [CrossRef]
- Li, X.H.; Shi, F.Z. Salt precipitation and evaporative flux on sandy soil with saline groundwater under different evaporation demand conditions. Soil Res. 2021, 60, 187–196. [Google Scholar] [CrossRef]
- Baddock, M.C.; Zobeck, T.M.; Van Pelt, R.S.; Fredrickson, E.L. Dust emissions from undisturbed and disturbed, crusted playa surfaces: Cattle trampling effects. Aeolian Res. 2011, 3, 31–41. [Google Scholar] [CrossRef]
- Brungard, C.W.; Boettinger, J.L.; Hipps, L.E. Wind erosion potential of lacustrine and alluvial soils before and after disturbance in the eastern Great Basin, USA: Estimating threshold friction velocity using easier-to-measure soil properties. Aeolian Res. 2015, 18, 185–203. [Google Scholar] [CrossRef]
- Webb, N.P.; Strong, C.L. Soil erodibility dynamics and its representation for wind erosion and dust emission models. Aeolian Res. 2011, 3, 165–179. [Google Scholar] [CrossRef]
- Dai, J.; Zhang, G.; Liu, L.; Shi, P.; Zhang, H.; Han, X.; Xue, K.; Hu, X.; Zhang, J.; Xiang, M.; et al. Effects of efflorescence and subflorescence by different salts on soil physical properties and aeolian erosion. Catena 2022, 215, 106323. [Google Scholar] [CrossRef]
- Zhao, H.-L.; He, Y.-H.; Zhou, R.-L.; Su, Y.-Z.; Li, Y.-Q.; Drake, S. Effects of desertification on soil organic C and N content in sandy farmland and grassland of Inner Mongolia. Catena 2009, 77, 187–191. [Google Scholar] [CrossRef]
- Houser, C.A.; Nickling, W.G. The factors influencing the abrasion efficiency of saltating grains on a clay-crusted playa. Earth Surf. Process. Landf. 2001, 26, 491–505. [Google Scholar] [CrossRef]
- Nield, J.M.; Bryant, R.G.; Wiggs, G.F.S.; King, J.; Thomas, D.S.G.; Eckardt, F.D.; Washington, R. The dynamism of salt crust patterns on playas. Geology 2015, 43, 31–34. [Google Scholar] [CrossRef] [Green Version]
- Argaman, E.; Singer, A.; Tsoar, H. Erodibility of some crust forming soils/sediments from the Southern Aral Sea Basin as determined in a wind tunnel. Earth Surf. Process. Landf. 2006, 31, 47–63. [Google Scholar] [CrossRef]
- O’Brien, P.; McKenna Neuman, C. A wind tunnel study of particle kinematics during crust rupture and erosion. Geomorphology 2012, 173–174, 149–160. [Google Scholar] [CrossRef]
- Langston, G.; McKenna Neuman, C. An experimental study on the susceptibility of crusted surfaces to wind erosion: A comparison of the strength properties of biotic and salt crusts. Geomorphology 2005, 72, 40–53. [Google Scholar] [CrossRef]
- Li, X.H.; Feng, G.L.; Zhao, C.Y.; Zheng, Z.H. Fine-Particle Emission Potential from Overflowing Areas of the Tarim River. Soil Sci. 2013, 178, 556–567. [Google Scholar] [CrossRef]
- Rice, M.A.; McEwan, I.K.; Mullins, E. A conceptual model of wind erosion of soil surfaces by saltaing particles. Earth Surf. Process. Landf. 1999, 24, 383–392. [Google Scholar] [CrossRef]
- Buck, B.J.; King, J.; Etyemezian, V. Effects of Salt Mineralogy on Dust Emissions, Salton Sea, California. Soil Sci. Soc. Am. J. 2011, 75, 1971–1985. [Google Scholar] [CrossRef] [Green Version]
- Dong, L.; Xiong, Y.; Huang, Q.; Xu, X.; Huo, Z.; Huang, G. Evaporation-induced salt crystallization and feedback on hydrological functions in porous media with different grain morphologies. J. Hydrol. 2021, 598, 126427. [Google Scholar] [CrossRef]
- Li, X.; Feng, G.; Sharratt, B. Soil organic carbon within the vadose zone of a floodplain. Environ. Earth Sci. 2018, 77, 247. [Google Scholar] [CrossRef]
- Li, X.; Feng, G.; Zhao, C.; Shi, F. Characteristics of soil infiltration in the Tarim River floodplain. Environ. Earth Sci. 2016, 75, 782. [Google Scholar] [CrossRef]
- Chen, Y.; Xu, C.; Chen, Y.; Liu, Y.; Li, W. Progress, challenges and prospects of eco-hydrological studies in the Tarim river basin of Xinjiang, China. Environ. Manag. 2013, 51, 138–153. [Google Scholar] [CrossRef] [PubMed]
- Feng, Q.; Liu, W.; Si, J.; Su, Y.; Zhang, Y.; Cang, Z.; Xi, H. Environmental effects of water resource development and use in the Tarim River basin of northwestern China. Environ. Geol. 2005, 48, 202–210. [Google Scholar]
- Zhou, H.H.; Chen, Y.N.; Li, W.H. Soil properties and their spatial pattern in an oasis on the lower reaches of the Tarim River, northwest China. Agric. Water Manag. 2010, 97, 1915–1922. [Google Scholar] [CrossRef]
- Yan, J.; Chen, X.; Luo, G.; Guo, Q. Temporal and spatial variability response of groundwater level to land use/land cover change in oases of arid areas. Chin. Sci. Bull. 2006, 51, 51–59. [Google Scholar] [CrossRef]
- Gao, F.; Huang, Q.; Sun, X.; Yan, Z. Study on Dynamic Changes of the Soil Salinization in the Upper Stream of the Tarim River Based on RS and GIS. Procedia Environ. Sci. 2011, 11, 1135–1141. [Google Scholar]
- Rice, M.A.; McEwan, I.K. Crust strength: A wind tunnel study of the effect of impact by saltating particles on cohesive soil surfaces. Earth Surf. Process. Landf. 2001, 26, 721–733. [Google Scholar] [CrossRef]
- Nachshon, U.; Weisbrod, N. Beyond the salt crust: On combined evaporation and subflorescent salt precipitation in porous media. Transp. Porous Media 2015, 110, 295–310. [Google Scholar] [CrossRef]
- Singer, A.; Banin, A.; Poberejzsky, L.; Gilenko, M. Soil Crusts in the Amudarya River Delta: Properties and Formation. In Sustainable Land Use in Deserts; Breckle, S.-W., Ed.; Springer: Berlin/Heidelberg, Germany, 2001. [Google Scholar]
- Joeckel, R.M.; Clement, B.A. Surface features of the Salt Basin of Lancaster County, Nebraska. Catena 1999, 34, 243–275. [Google Scholar] [CrossRef]
- Yang, J.-L.; Zhang, G.-L.; Yang, F.; Yang, R.-M.; Yi, C.; Li, D.-C.; Zhao, Y.-G.; Liu, F. Controlling effects of surface crusts on water infiltration in an arid desert area of Northwest China. J. Soils Sediments 2016, 16, 2408–2418. [Google Scholar] [CrossRef]
- Chen, X.Y. Evaporation from a Salt-Encrusted Sediment Surface—Field And Laboratory Studies. Aust. J. Soil Res. 1992, 30, 429–442. [Google Scholar] [CrossRef]
- Zhang, J.G.; Xu, X.W.; Lei, J.Q.; Li, S.Y.; Hill, R.L.; Zhao, Y. The effects of soil salt crusts on soil evaporation and chemical changes in different ages of Taklimakan Desert Shelterbelts. J. Soil Sci. Plant Nutr. 2013, 13, 1019–1028. [Google Scholar] [CrossRef]
- Bergstad, M.; Shokri, N. Evaporation of NaCl solution from porous media with mixed wettability. Geophys. Res. Lett. 2016, 43, 4426–4432. [Google Scholar] [CrossRef] [Green Version]
- Eloukabi, H.; Sghaier, N.; Ben Nasrallah, S.; Prat, M. Experimental study of the effect of sodium chloride on drying of porous media: The crusty–patchy efflorescence transition. Int. J. Heat Mass Transf. 2013, 56, 80–93. [Google Scholar] [CrossRef] [Green Version]
- Nachshon, U.; Weisbrod, N.; Dragila, M.I.; Grader, A. Combined evaporation and salt precipitation in homogeneous and heterogeneous porous media. Water Resour. Res. 2011, 47, W03513. [Google Scholar] [CrossRef]
- Gran, M.; Carrera, J.; Massana, J.; Saaltink, M.W.; Olivella, S.; Ayora, C.; Lloret, A. Dynamics of water vapor flux and water separation processes during evaporation from a salty dry soil. J. Hydrol. 2011, 396, 215–220. [Google Scholar] [CrossRef]
- Song, Y.; Quan, Z.; Liu, L.; Yan, P.; Cao, T. The influence of different underlying surface on sand-dust storm in northern China. J. Geogr. Sci. 2005, 15, 431–438. [Google Scholar] [CrossRef]
- Cahill, T.A.; Gill, T.E.; Reid, J.S.; Gearhart, E.A.; Gillette, D.A. Saltating Particles, Playa Crusts and Dust Aerosols at Owens (Dry) Lake, California. Earth Surf. Process. Landf. 1996, 21, 621–639. [Google Scholar] [CrossRef]
- Wood, W.W.; Sanford, W.E. Eolian transport, saline lake basins, and groundwater solutes. Water Resour. Res. 1995, 31, 3121–3129. [Google Scholar] [CrossRef]
- Gill, T.E. Eolian sediments generated by anthropogenic disturbance of playas: Human impacts on the geomorphic system and geomorphic impacts on the human system. Geomorphology 1996, 17, 207–228. [Google Scholar] [CrossRef]
- Goudie, A.S.; Middleton, N.J. Saharan dust storms: Nature and consequences. Earth-Sci. Rev. 2001, 56, 179–204. [Google Scholar] [CrossRef]
- Yechieli, Y.; Wood, W.W. Hydrogeologic processes in saline systems: Playas, sabkhas, and saline lakes. Earth-Sci. Rev. 2002, 58, 343–365. [Google Scholar] [CrossRef]
- Husar, R.B.; Tratt, D.M.; Schichtel, B.A.; Falke, S.R.; Li, F.; Jaffe, D.; Gassó, S.; Gill, T.; Laulainen, N.S.; Lu, F.; et al. Asian dust events of April 1998. J. Geophys. Res. Atmos. 2001, 106, 18317–18330. [Google Scholar] [CrossRef]
- Leon, L.; John, T. Wind erosion affects soil texture and organic matter. J. Soil Water Conserv. 1986, 41, 191–193. [Google Scholar]
- Madden, N.M.; Southard, R.J.; Mitchell, J.P. Soil water and particle size distribution influence laboratory-generated PM10. Atmos. Environ. 2010, 44, 745–752. [Google Scholar] [CrossRef]
- Pi, H.; Huggins, D.R.; Sharratt, B. Wind erosion of soil influenced by clay amendment in the inland Pacific Northwest, USA. Land Degrad. Dev. 2020, 32, 241–255. [Google Scholar] [CrossRef]
- Qadir, M.; Ghafoor, A.; Murtaza, G. Amelioration strategies for saline soils: A review. Land Degrad. Dev. 2000, 11, 501–521. [Google Scholar] [CrossRef]
- Danalatos, N.G.; Kosmas, C.S.; Driessen, P.M.; Yassoglou, N. Estimation of the Draining Soil-Moisture Characteristic from Standard Data as Recorded in Routine Soil Surveys. Geoderma 1994, 64, 155–165. [Google Scholar] [CrossRef]
- Rice, M.A.; Willetts, B.B.; MceWan, I.K. Wind erosion of crusted soil sediments. Earth Surf. Process. Landf. 1996, 21, 279–293. [Google Scholar] [CrossRef]
- Shao, Y.; Raupach, M.R.; Findlater, P.A. Effect of Saltation Bombardment on the Entrainment of Dust by Wind. J. Geophys. Res. Atmos. 1993, 98, 12719–12726. [Google Scholar] [CrossRef] [Green Version]
- Prasad, M.N.V.; Pietrzykowski, M. Climate Change and Soil Interactions, 1st ed.; Elsevier: Cambridge, MA, USA, 2020. [Google Scholar] [CrossRef]
- Kust, G.; Andreeva, O.; Cowie, A. Land Degradation Neutrality: Concept development, practical applications and assessment. J. Environ. Manag. 2017, 195, 16–24. [Google Scholar] [CrossRef] [PubMed]


| Soil with/without Crust | Item | N | Mean | Min. | Max. | Median | SE | Cs |
|---|---|---|---|---|---|---|---|---|
| Soils without a salt crust | Clay (%) * | 23 | 3.50 | 0.17 | 9.50 | 2.63 | 0.53 | 0.79 |
| Silt (%) * | 23 | 30.60 | 6.07 | 69.89 | 28.78 | 4.06 | 0.43 | |
| Sand (%) * | 23 | 65.90 | 25.38 | 93.07 | 68.52 | 4.55 | −0.41 | |
| D50 (μm) * | 23 | 79.83 | 21.91 | 212.14 | 71.90 | 9.16 | 1.12 | |
| D95 (μm) * | 23 | 221.42 | 68.05 | 516.13 | 204.91 | 22.35 | 1.53 | |
| Salt (g·kg−1) * | 23 | 45.53 | 5.15 | 110.92 | 36.60 | 7.73 | 0.77 | |
| EC (ms·cm−1) * | 23 | 17.08 | 0.33 | 66.00 | 9.46 | 4.22 | 1.56 | |
| pH * | 23 | 8.74 | 7.87 | 9.13 | 8.77 | 0.05 | −1.74 | |
| SOM (g·kg−1) | 23 | 4.1 | 1.13 | 9.1 | 3.04 | 0.53 | 0.84 | |
| Salt-crusted soils | Clay (%) | 23 | 6.28 | 2.17 | 13.37 | 6.36 | 0.67 | 0.60 |
| Silt (%) | 23 | 53.38 | 22.94 | 82.84 | 57.50 | 3.76 | −0.09 | |
| Sand (%) | 23 | 40.34 | 3.78 | 74.89 | 35.66 | 4.39 | 0.00 | |
| D50 (μm) | 23 | 40.32 | 9.89 | 81.45 | 30.58 | 4.62 | 0.32 | |
| D95 (μm) | 23 | 142.77 | 45.13 | 224.42 | 149.74 | 9.49 | −0.36 | |
| Salt (g·kg−1) | 23 | 345.33 | 88.50 | 603.00 | 348.00 | 29.01 | 0.11 | |
| EC (ms·cm−1) | 23 | 90.96 | 17.95 | 157.40 | 91.40 | 7.14 | 0.03 | |
| pH | 23 | 8.95 | 8.09 | 10.07 | 8.91 | 0.08 | 0.66 | |
| SOM (g·kg−1) | 23 | 5.04 | 2.01 | 10.76 | 4.19 | 0.54 | 0.79 | |
| Crust thickness (mm) | 23 | 13.48 | 3.67 | 36.61 | 11.93 | 1.54 | 2.08 | |
| Crust strength (kg·cm−1) | 23 | 2.05 | 0.30 | 5.96 | 1.56 | 0.33 | 1.73 |
| Sample Site No. | Salt-Crusted Soils | Soil without a Crust | Sample Site No. | Salt-Crusted Soils | Soil without a Crust |
|---|---|---|---|---|---|
| 1 | silt loam | loam | 13 | silt | sandy loam |
| 2 | silt loam | sandy loam | 14 | sandy loam | sand |
| 3 | sandy loam | loamy sand | 15 | loamy sand | sand |
| 4 | silt loam | sandy loam | 16 | silt loam | sand |
| 5 | sandy loam | sand | 17 | silt loam | loamy sand |
| 6 | silt loam | sandy loam | 18 | sandy loam | loamy sand |
| 7 | sandy loam | sandy loam | 19 | sandy loam | loamy sand |
| 8 | sandy loam | sandy loam | 20 | sandy loam | sandy loam |
| 9 | silt loam | sand | 21 | silt loam | silt loam |
| 10 | silt loam | silt loam | 22 | silt loam | sandy loam |
| 11 | silt loam | sandy loam | 23 | silt loam | silt loam |
| 12 | silt loam | silt loam |
Publisher’s Note: MDPI stays neutral with regard to jurisdictional claims in published maps and institutional affiliations. |
© 2022 by the authors. Licensee MDPI, Basel, Switzerland. This article is an open access article distributed under the terms and conditions of the Creative Commons Attribution (CC BY) license (https://creativecommons.org/licenses/by/4.0/).
Share and Cite
Li, X.; Guo, M. The Impact of Salinization and Wind Erosion on the Texture of Surface Soils: An Investigation of Paired Samples from Soils with and without Salt Crust. Land 2022, 11, 999. https://doi.org/10.3390/land11070999
Li X, Guo M. The Impact of Salinization and Wind Erosion on the Texture of Surface Soils: An Investigation of Paired Samples from Soils with and without Salt Crust. Land. 2022; 11(7):999. https://doi.org/10.3390/land11070999
Chicago/Turabian StyleLi, Xinhu, and Min Guo. 2022. "The Impact of Salinization and Wind Erosion on the Texture of Surface Soils: An Investigation of Paired Samples from Soils with and without Salt Crust" Land 11, no. 7: 999. https://doi.org/10.3390/land11070999
APA StyleLi, X., & Guo, M. (2022). The Impact of Salinization and Wind Erosion on the Texture of Surface Soils: An Investigation of Paired Samples from Soils with and without Salt Crust. Land, 11(7), 999. https://doi.org/10.3390/land11070999