Article

Using Crowdsourced Big Data to Unravel Urban Green Space Utilization during COVID-19 in Guangzhou, China

1
Graduate School of Horticulture, Chiba University, Chiba 271-8510, Japan
2
School of Architecture and Urban Planning, Huazhong University of Science and Technology, Wuhan 430074, China
3
Gangneung-si Public Design Promotion Committee, 33 Gangneung Daero, Gangneung-si 25522, Gangwon-do, Korea
*
Author to whom correspondence should be addressed.
Land 2022, 11(7), 990; https://doi.org/10.3390/land11070990
Submission received: 21 May 2022 / Revised: 25 June 2022 / Accepted: 28 June 2022 / Published: 29 June 2022

Abstract

:
Urban green spaces (UGSs) can meet the spiritual and cultural needs of citizens and provide various ecosystem services. In the context of the COVID-19 pandemic, the utilization of UGSs has been affected in various countries worldwide. This study considered 13 UGSs in Guangzhou, China, as examples. It obtained user check-in data by sampling the check-in pages of Sina Weibo locations using a Python-based web crawler program. The study was conducted for 731 days from 1 October 2019 to 30 September 2021, during different phases of the pandemic. Based on automated Chinese corpus recognition technology, statistical results were obtained after periodization and sentiment calculation. The study assessed the pandemic’s impact on the use of UGSs by analyzing the time, frequency, and emotions of residents visiting UGSs. The study concluded that the emotions of UGS users during COVID-19 tended to be positive. They tended to choose UGSs with low expected population density and visited UGSs on weekdays. Additionally, the religious attributes of UGSs also influenced their utilization.

1. Introduction

Urban green spaces (UGSs) are essential elements of the urban environment. They provide multiple ecosystem services and positively affect physical and mental health, which may be amplified in times of social crises [1,2,3,4]. As the main body of the urban natural ecosystem, the UGSs allow urban residents to enjoy the service function of the natural ecosystem, including green space and water [2]. The use of UGSs by residents is an important reference factor in measuring a city’s civilization, quality of life, and sustainability [5]. UGSs provide health benefits to urban residents, which may be more important in times of crisis, such as the COVID-19 pandemic [6].
Previous studies have demonstrated the physiological and psychological benefits of UGSs for residents [7]. Studies have also found that prolonged isolation at home or prohibition of public activities can significantly affect people [8]. In light of the global outbreak and spread of COVID-19, governments around the world have taken important policy measures, such as restrictions on transportation and public mobility, to reduce the spread of the virus and protect public health [9]. These measures ensured less frequent visits to public green spaces, fewer outdoor social activities, and a shift in preference for activity venues [10]. Wuhan, China, followed a strict lockdown policy during the early stages of COVID-19, but in other cities, such as Guangzhou, a relatively relaxed policy allowed residents to spend time outdoors with a “health code” [11]. Several studies in the literature suggest that (perceived) access to UGSs plays an important role in people’s health and well-being [12,13] and can act as a buffer against stressful life experiences [14]. These restrictions on people’s movements and social gatherings are unprecedented, and highlight the importance of nearby green spaces for maintaining physical and mental health. The increase in new COVID-19 cases and the rapid dissemination of this information on the Internet can significantly affect people’s lives and impact UGS utilization. Recording feedback on UGS utilization usually takes less than a day. Social media, available to everyone, accurately records immediate changes in UGS utilization. This information can be gathered using a Python-based crawler.
With the development and improvement of big data mining and analysis support technologies [15], accurate big data mining and analysis can support research, analysis, program derivation, and the evaluation of planning and design [16]. The importance of big data in research has increased, and it is being used to improve the scientific nature of habitat research. For example, Sina Weibo’s big data are a typical representative of geographic data from the population. These check-in data from the non-professional public have several advantages, including a large data volume, good display ability, rich information, and low cost. They have become a research focus in international geographic information science in recent years [17]. As China’s most used social media platform, according to the Sina Weibo 2020 user development report [18], Weibo reached 224 million active users in a single day and 511 million active users in a single month, accounting for approximately 51.7% of the total Chinese Internet users. Because the Sina Weibo check-in data are complete, they record relevant content, including users’ geographic information (latitude and longitude coordinates), time information, and text information. Therefore, mining the large sample size of microblog check-in data can help record the activities and emotions of microblog users in a timely and effective manner [19].
Previous studies have not addressed real-time changes in UGS use in the face of public health emergencies. Studies conducted after the COVID-19 outbreak are often limited by sample size or sampling methods, and respondents often cannot provide rapid feedback on day-to-day changes in UGS use during the pandemic. Therefore, this study uses data from thousands of people in Guangzhou, China who checked in on social media (Sina Weibo) to examine the changing characteristics of UGS use in the context of the COVID-19 pandemic. To this end, the study poses four hypotheses:
  • There is a significant correlation between the increase in COVID-19 cases and the number of UGS users.
  • People’s preference for UGSs changed after the COVID-19 outbreak.
  • The timing of UGS utilization changed after the COVID-19 outbreak.
  • The emotions of people visiting UGSs after the COVID-19 outbreak were generally more positive than their emotions before the outbreak.

2. Materials and Methods
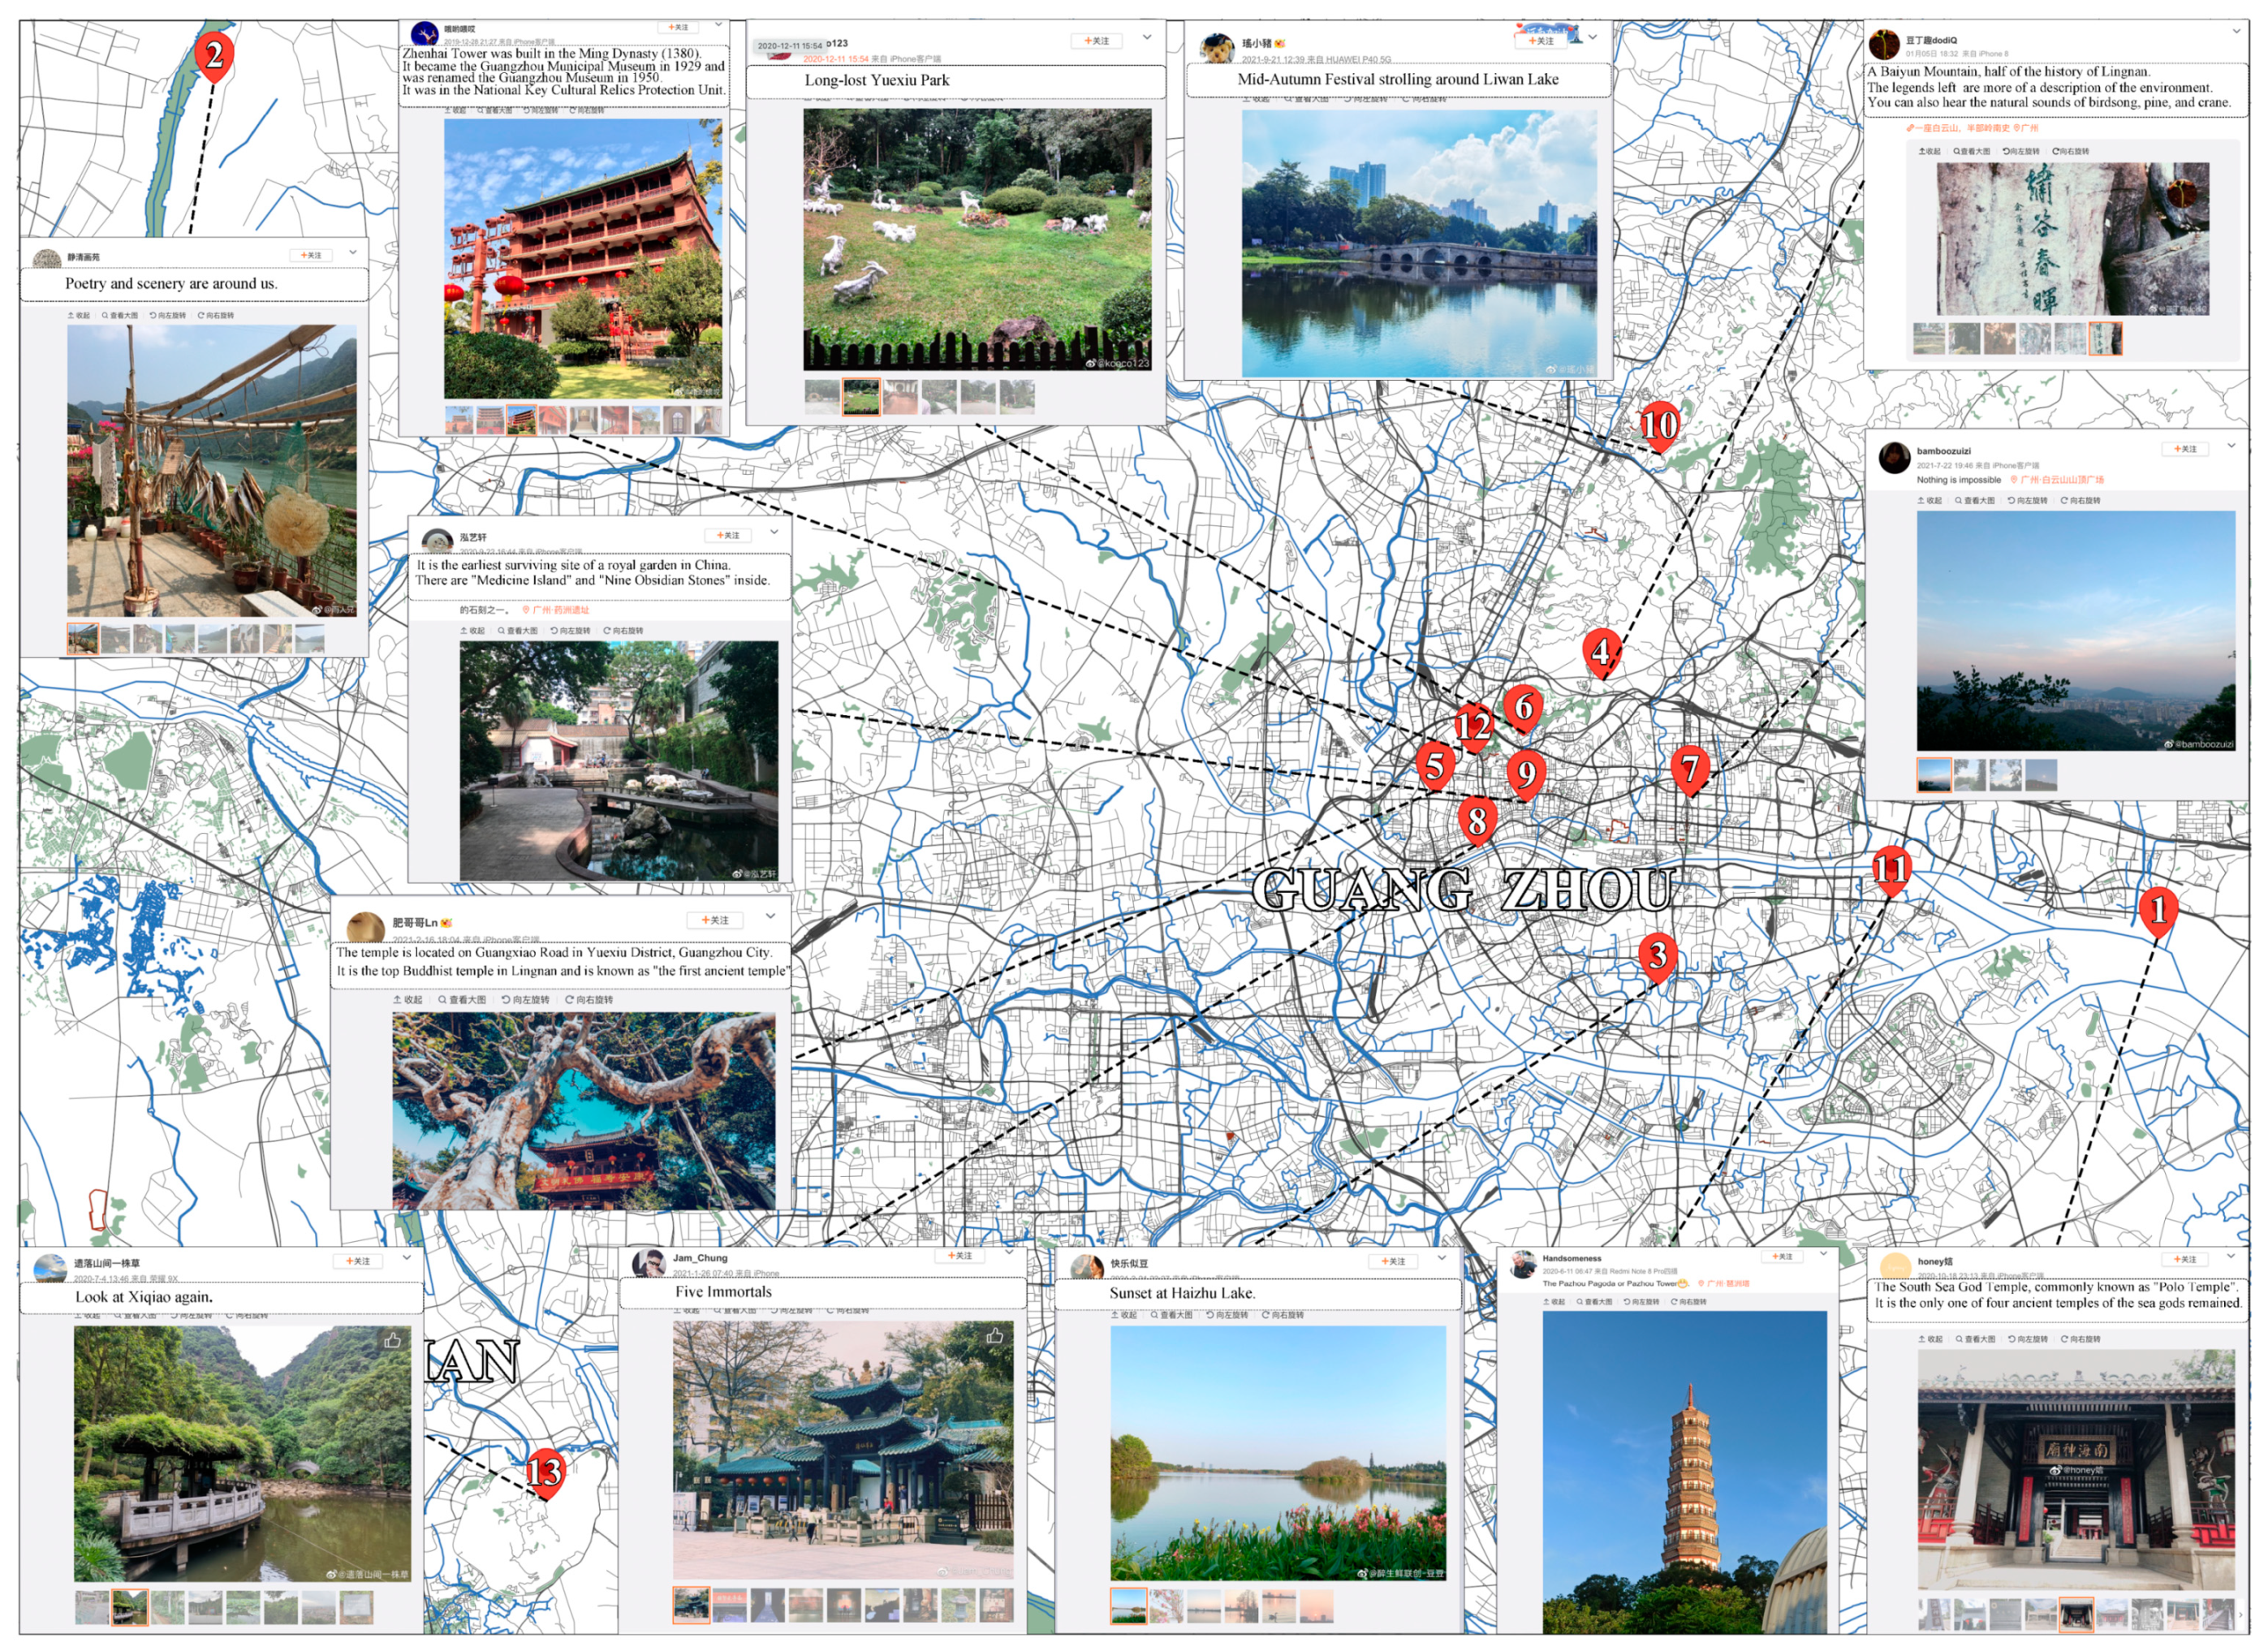
2.1. Study Area

Guangzhou, also known as Ram City, is one of the most developed cities in the People’s Republic of China, with a history of over 2200 years and a population of approximately 15.31 million. Considering the city’s long history, this study selected the most representative UGS from both the past and the present. It referred to the traditional Chinese culture that is called “the Eight Views” and selected 13 UGS as the research object (Figure 1).
The Eight Views began in China during the Song dynasty (960–1127) and included mountains, rivers, lakes, seas, and people [20]. The locals often called them the most beautiful UGS, which were recognized in four characters in Chinese script and accompanied by poems and drawings. The culture of the Eight Views came from the people, and the selection for each period was made by popular vote. The results reflected the residents’ preferences for open spaces. It is the earliest example of democratic participation in building social consciousness in China [21]. The utilization and evaluation of open spaces in green spaces continued even after thousands of years of war and turmoil. The selection of the Eight Views was passed down as a tradition from the Chinese dynasties until the end of the Qing Dynasty. Since the founding of the People’s Republic of China in 1949, the government has created eight scenic spots throughout the country and made them available as parks and scenic areas. Residents have shown great interest in using these open spaces. Since the most popular attractions are likely to be nominated and widely accepted as the eight scenic spots, the UGS system formed by the Eight Views can well reflect the characteristics of each city’s open spaces [22]. Among them, the “Eight Views of Ram City” in Guangzhou are well-preserved and their status has not been interrupted since the Song Dynasty. These places are still included in the list of the “New Eight Views of Ram City” representing the UGSs of Guangzhou [23,24,25].
In this study, 13 well-preserved areas of the Eight Views of Ram City from five periods in Chinese history, namely Song, Yuan, Ming, early Qing, and late Qing, were selected (Appendix A Table A1). The Eight Views of Ram City in Guangzhou are considered a classic example representing the revival of the traditional Eight Views culture in China [26]. The selection criteria of the sites were based on the Eight Views of Ram City in Different Eras [27], some of which were repeatedly selected in history and some of which had completely disappeared. We analyzed sites with the same locations selected repeatedly and did not include those that had completely disappeared (Appendix A Table A1). The case study’s boundaries were based on the 2010–2020 Guangzhou Green Space System Plan.

2.2. Data Collection

The data sources for this study were (1) Sina Weibo check-in data of each study site and (2) data on new COVID-19 cases in Guangzhou.
The collection of Sina Weibo check-in data was based on a Python 3.6-based microblogging crawler program that crawled information from the microblogging check-in pages of 13 research subjects over the past two years (1 October 2019 to 30 September 2021). All user data are publicly available information; the crawler does not interfere with the normal operation of the microblogging website, and the Python libraries cited are freely available. The information used includes the posting time, number of posts, posting text, and gender, age, and education of the user. The time information specifically refers to the date and time the visitor logged in, and does not include any information about the length of time spent at the UGS. Any information collected can only prove that the visitor visited a UGS at a specific time. After removing advertising content-related information and considering invalid users, 4542 valid pieces of information were obtained for the analysis.
Data on new cases in Guangzhou were obtained from the Daily Outbreak Bulletin on the Guangzhou Municipal Health and Wellness Commission website [28]. Data on daily new outbreaks were collected since the first reported detection of COVID-19 in Guangzhou (17 February 2020). These are public data published by the government and involve no personal privacy issues.

2.3. Statistical Analysis

SPSS 26.0 was used for data analysis. The raw data were first sorted by date to determine the daily number of postings and new cases from 1 October 2019, to 30 September 2021 (i.e., 731 days). The study considered the period of approximately 3 months before the first reported COVID-19 case in Guangzhou (1 October 2019, to 17 February 2020) as a period of no outbreak, and the number of new outbreaks was considered to be a value of 0. This part of the check-in data was used as the base change curve to determine the characteristics of the check-ins at each site and as a reference for the oscillating change of the curve after the outbreak of the pandemic. In the data analysis, it was hypothesized that there would be a relationship between the number of new cases and the number of check-ins in each green area, since the residential population in each area of Guangzhou is relatively constant. If this hypothesis is true, there could be a further relationship between the number of cases and the number of visitors to each green space. First, a sequence diagram based on time was constructed and the correlation was calculated to obtain a correlation matrix. This chart measures the correlation using the Pearson product-moment correlation coefficient (Pearson’s r). It can be expressed as follows:
p x , y = E ( X Y ) E ( X ) E ( Y ) E ( X 2 ) ( E ( X ) ) 2 E ( Y 2 ) ( E ( Y ) ) 2
Subsequently, Pearson’s r was tested for significance, and when the value of the significance test was less than 0.05, the correlation was found to be significant.
According to JJ Schipperijn in the Use of Urban Green Space [29], residents’ visits to green spaces usually have a cyclical pattern, with a cycle of one week (7 days). Therefore, during data processing, a cross-sectional comparison of the number of visitors is meaningful, and this study was conducted separately according to a 7-day cycle. Utilization was measured by the change in the peak number of users before and after the epidemic.
Additionally, the study used the Micro Blog Emotion Weight Calculator (MBEWC) sentiment lexicon as the base lexicon to calculate the sentiment value of the microblog text. The MBEWC sentiment can classify Chinese sentiment words into positive and negative sentiment and perform fine-grained sentiment analysis. In this study, the emotional value (E-V) of each daily attraction was taken for analysis. When the emotion value was 0, it represented stable emotions. When it was positive, it represented anxiety. When it was negative, it represented happiness. The intensity of emotion was positively correlated with the absolute value.
Finally, the study used Ansj (a Java-based Chinese word splitting program) for word separation and the Chinese corpus dataset (CHI) for feature selection. To perform sentiment classification, the term frequency-CHI(Ci) was used for feature weight calculation, calculated as follows:
X 2 ( t , C i ) = N × ( AD BC ) 2 ( A + C ) ( B + D ) ( A + B ) ( C + D )
TF CHI = # wordt # word × X 2 ( t , C i )
where A is the number of occurrences of feature t and category Ci combined, B is the number of occurrences of feature t alone, and C is the number of occurrences of Ci alone. D is the number of occurrences of both feature t and category Ci. Further, N = A + B + C + D. #wordt is the number of occurrences of feature t in the text and #word is the total number of words in the text. During preprocessing, Ci was used for feature selection.

3. Results

3.1. Data Crawling

The Weibo check-in data collection period was from 1 October 2019 (Tuesday) to 30 September 2021 (Thursday), covering 731 days or 104 weeks. The valid data obtained comprised 4542 pieces. As shown in Table 1, @1 to @13 contain 362, 196, 616, 129, 553, 362, 531, 113, 167, 562, 163, 77, and 711 data, respectively. Among all users who completed the questionnaire, 64.60% were female and 37.75% male. Furthermore, 62.40% were 17–29 years old, and 20.87% were 30–39. The data sampling in this study is biased; the proportion of women is significantly higher than that of men, and the proportion of young people is much higher than that of elderly participants. However, since each attraction fits this profile of user distribution, a comparative study is considered valid. The data collection interval for daily new infections was from 17 February 2020, through 30 September 2021. The date 17 February 2020 corresponds to the first COVID-19 report in Guangzhou. The outbreak reached its first peak on 22 March 2020, with 12 confirmed cases in a single day. After that, it was contained. On 6 June 2020, no new infections were reported for the first time in a week. Thereafter, smaller outbreaks occurred on 12 August, 30 August, 19 October, and 9 November 2020, and on 1 January, 1 February, 16 February, and 21 March 2021. On these days, there were fewer infections in a single day than on 22 March 2020, and they were quickly contained. The third major outbreak occurred between 23 May and 5 June 2021, with a maximum of 13 infections per day. This outbreak was also contained. Subsequently, outbreaks of over ten infections per day occurred on 7 July, 19 July, 29 July, and 7 August 2021.
The outbreak pattern in Guangzhou is such that the citizens’ activities and the course of the pandemic are likely to share some regularly changing characteristics. Figure 2 demonstrates the relationship between the number of check-ins and the number of new cases at each attraction using a time-series line graph. A correlation analysis was performed to describe the correlation quantitatively.

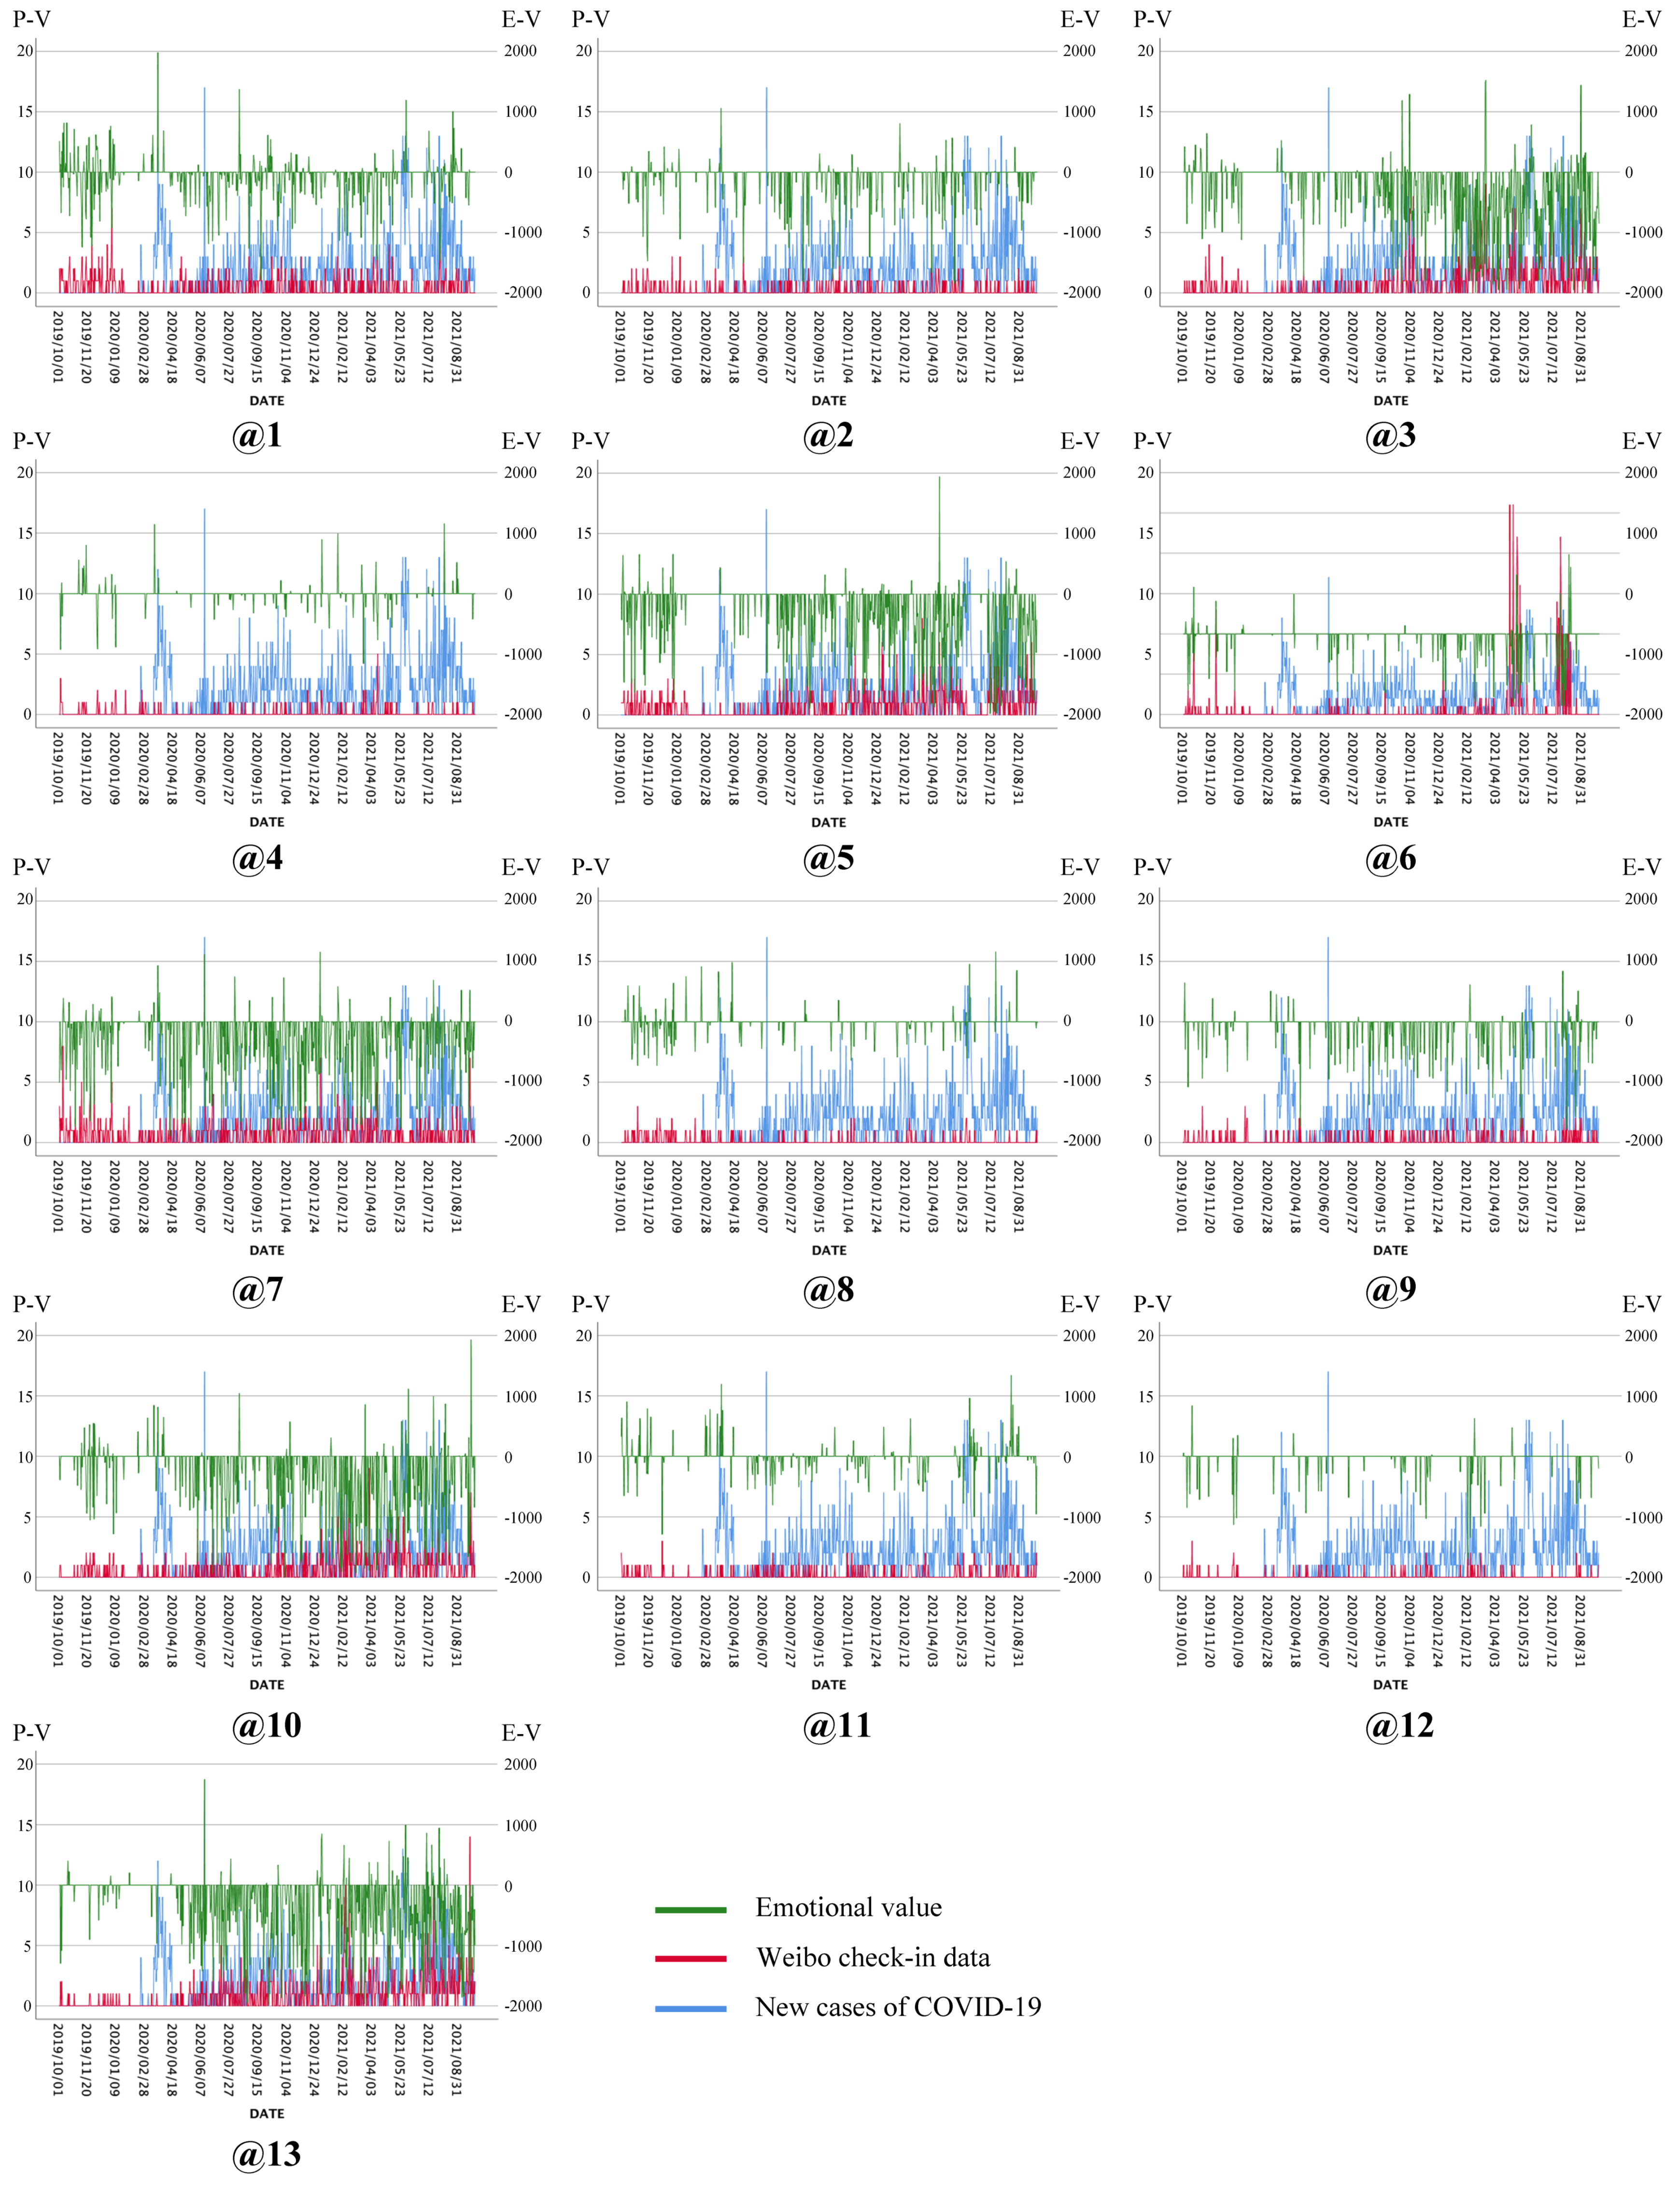
3.2. Correlation Analysis

The results of the correlation analysis with the check-in information data and the new pandemic cases using SPSS 26.0 are shown in Table 2. The correlation was considered significant if the test value was less than 0.05.
Significantly, the numbers of daily visitors for @1, @3, @5, @6, @7, @8, @9, @10, @12, and @13 were correlated with the number of new patients, with @1 and @10 showing a positive correlation; @13 showing the most significant positive correlation; @3, @5, @6, @7, @8, @9, @12, and @13 showing negative correlation; and @6 showing the most significant negative correlation. @2 was negatively correlated with @5, @8, @9, and @12 and positively correlated with @11 and @13, with the most significant negative correlation with @12 and the most significant positive correlation with @13. @4 was positively correlated with @5, @7, @8, and @9 and negatively correlated with @11, with the most significant positive correlation with @5. @11 was negatively correlated with @4, @5, @6, @7, and @9 and positively correlated with @1, @2, and @13, with the most significant negative correlation with @6 and the most significant positive correlation with @13.
Overall, the pandemic’s impact was transmissive, with the pandemic status directly affecting the utilization status of ten green spaces and the utilization status of the remaining three green spaces affected by these ten sites.

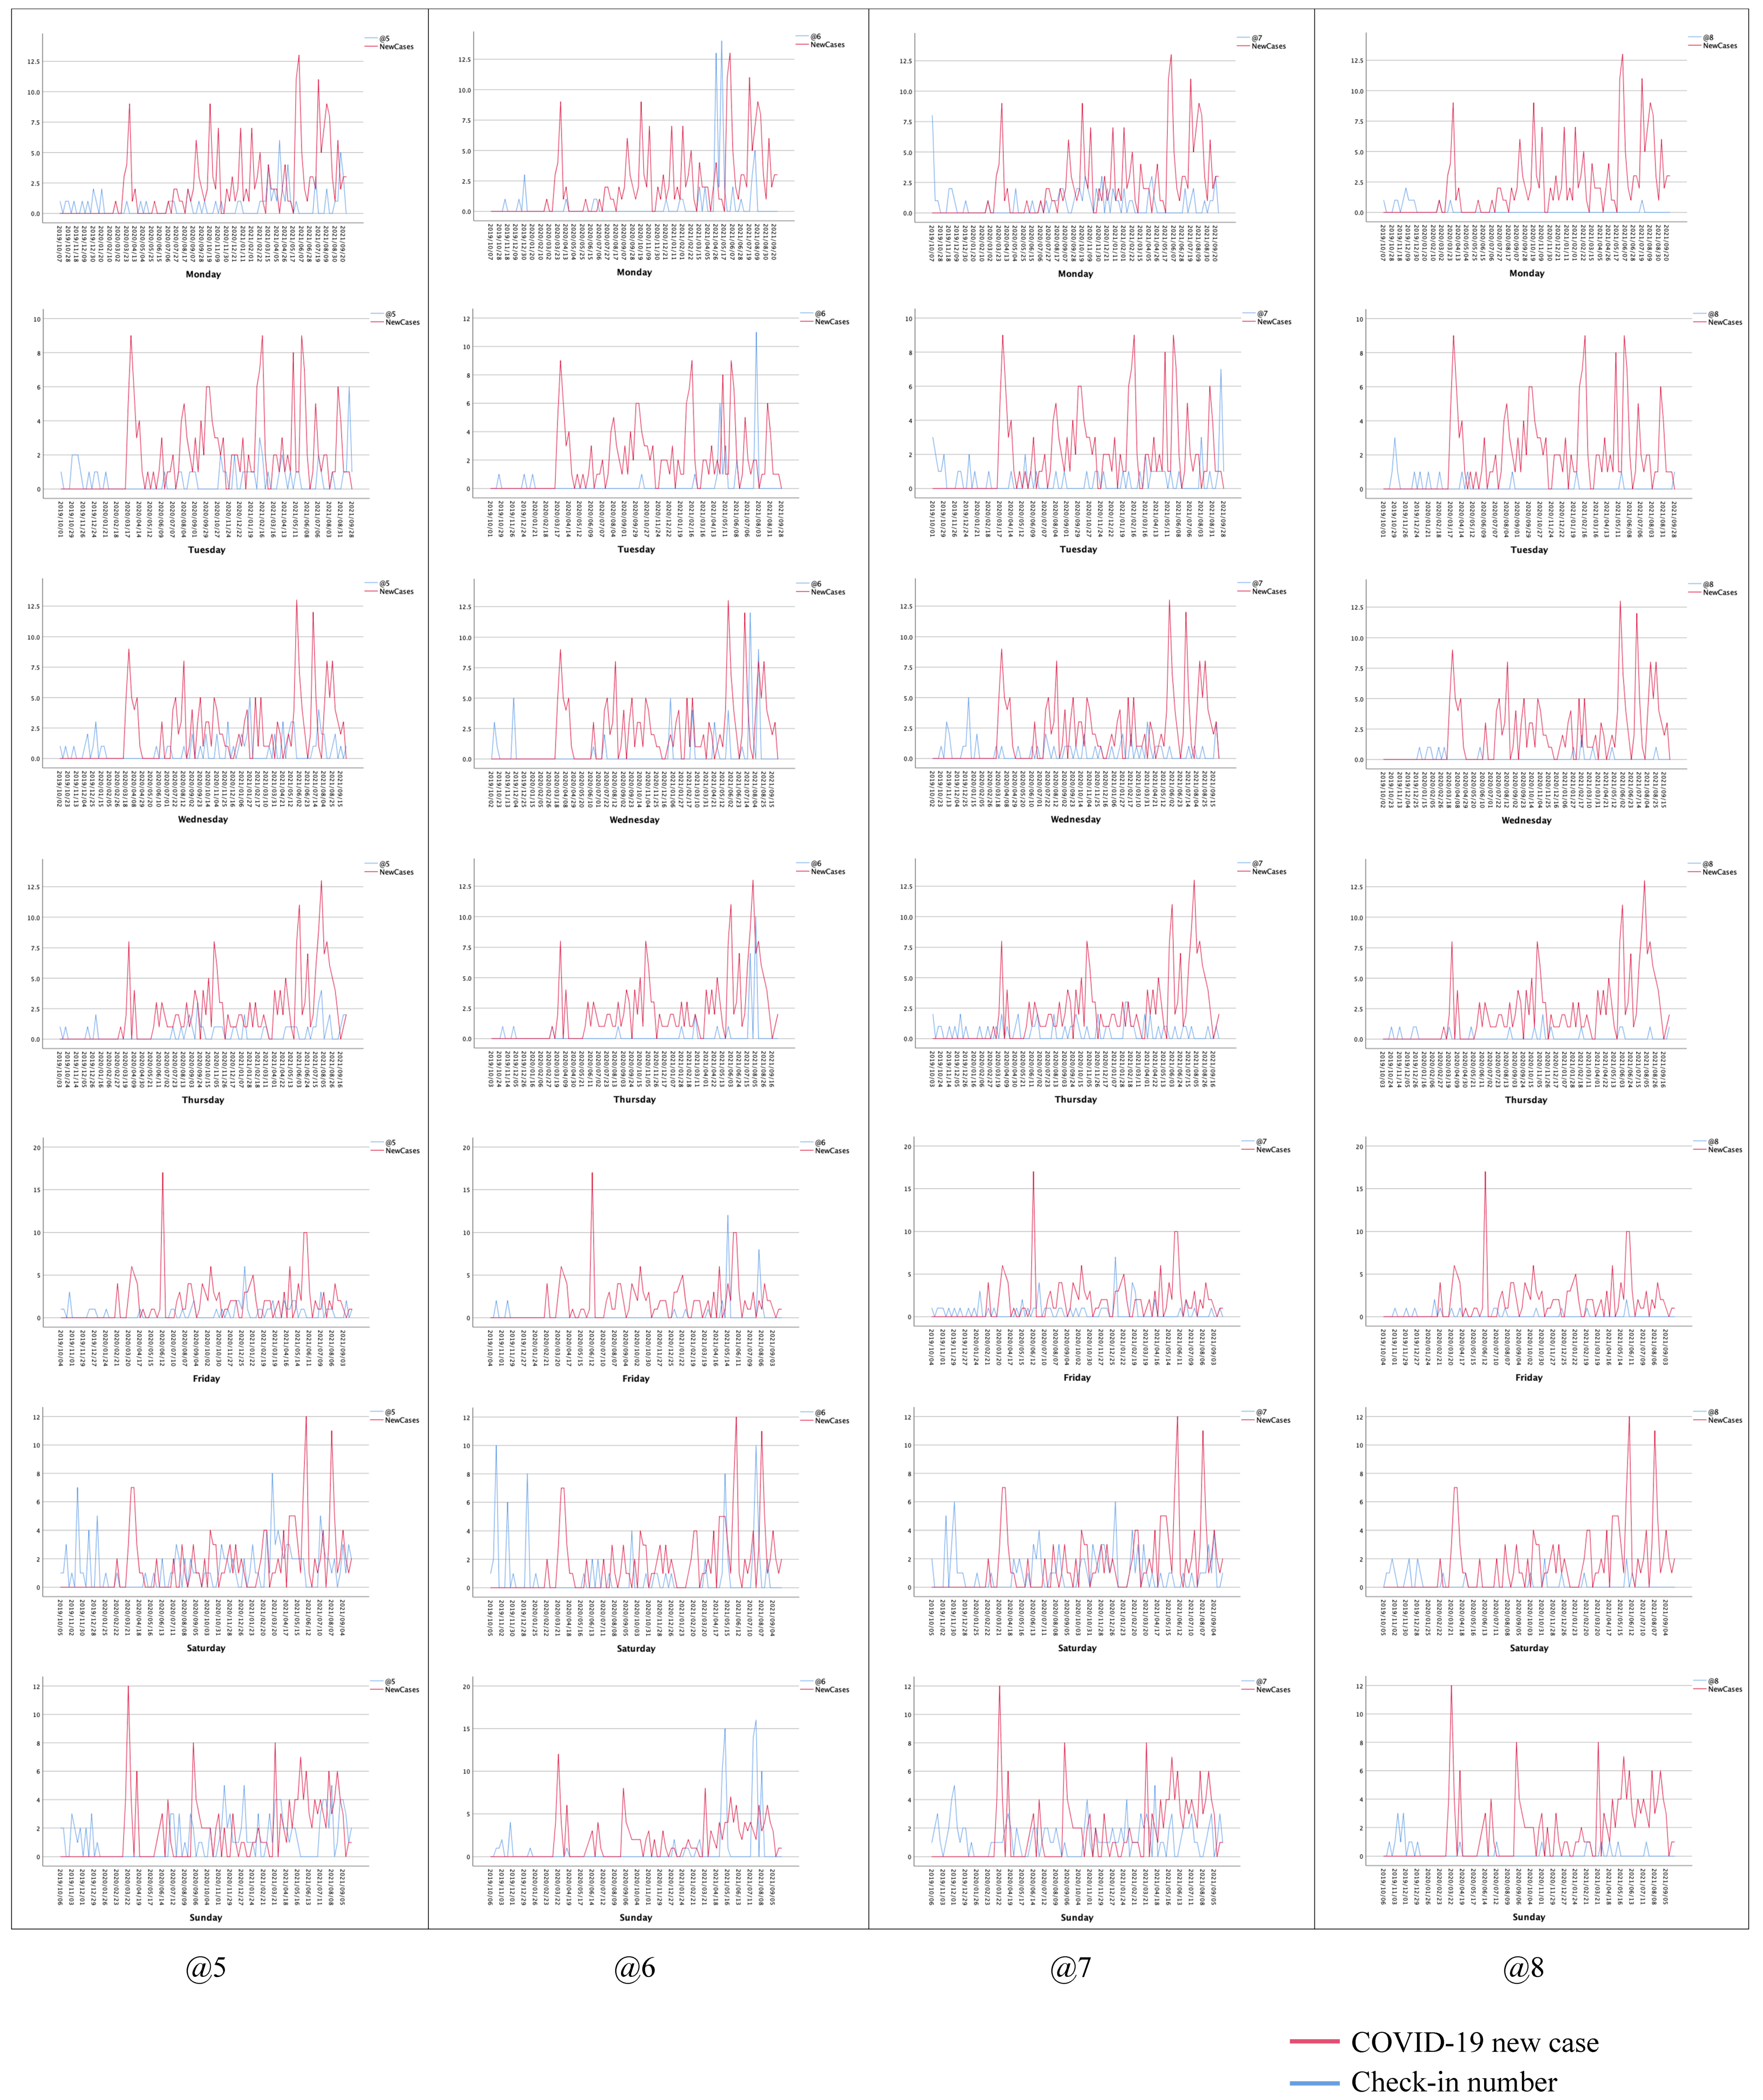
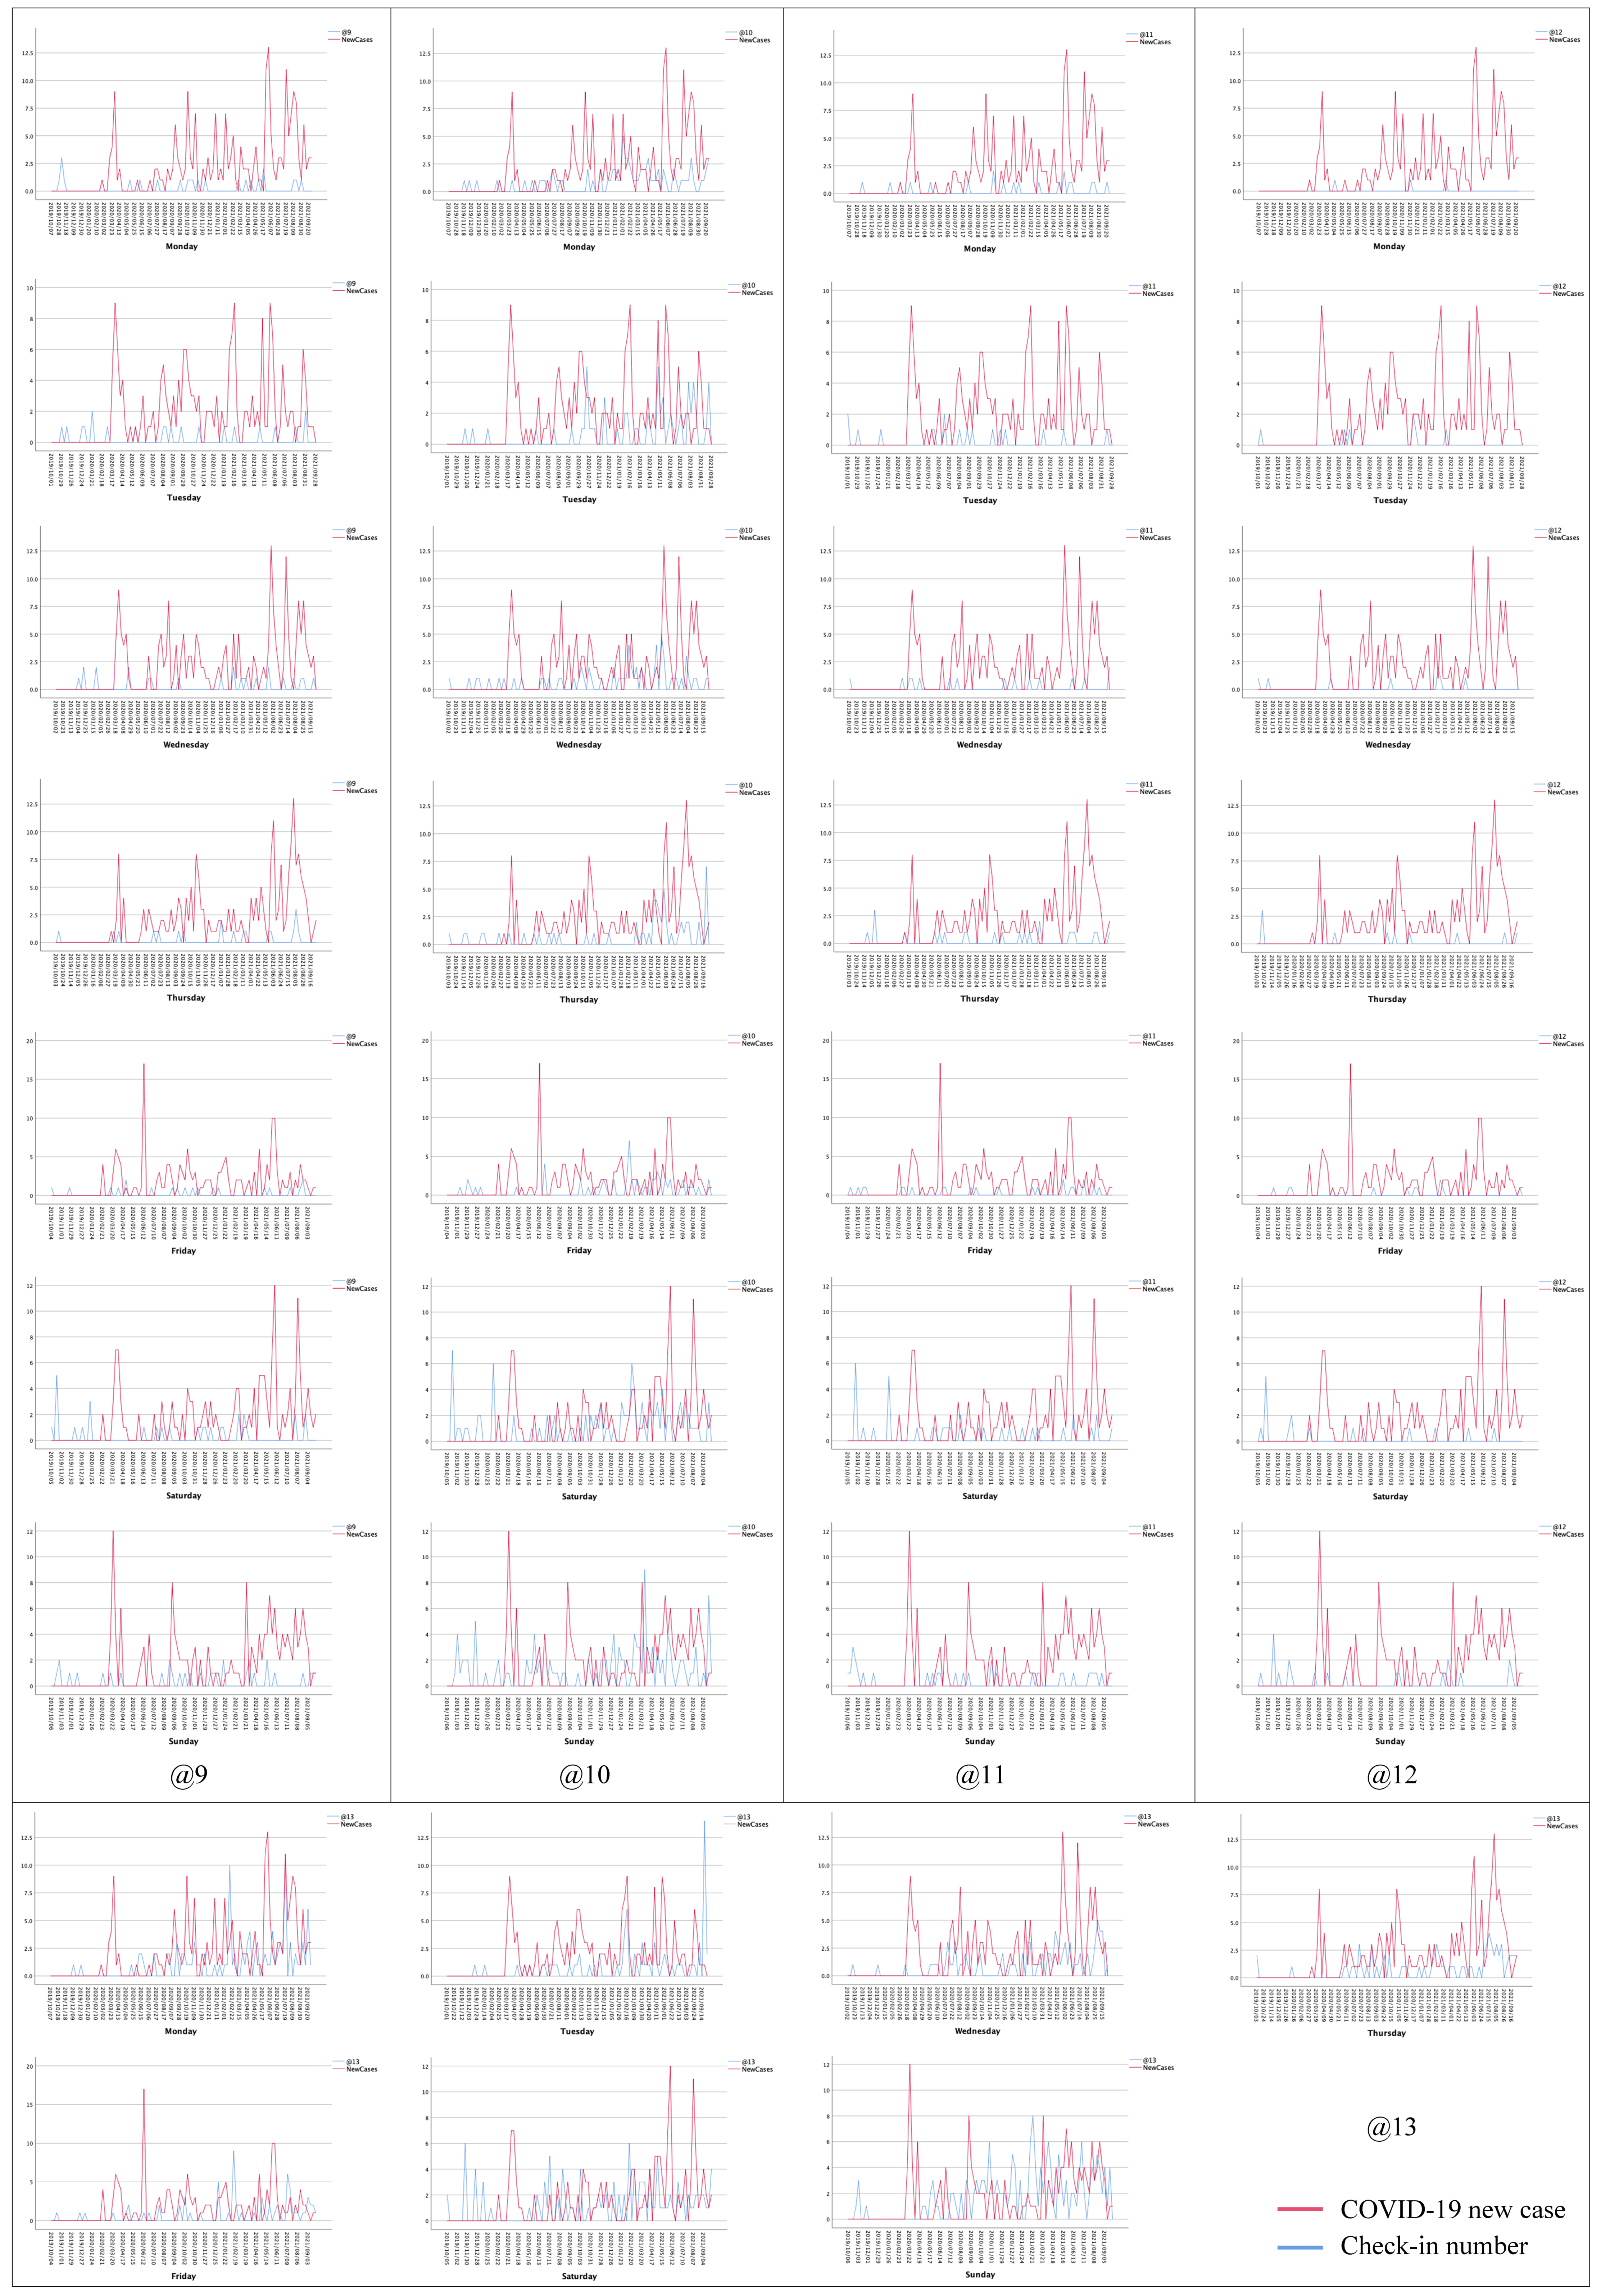
3.3. Classification by Weekly Cycle

Because residents’ UGS utilization usually has a cyclical pattern, the data were divided into seven groups: Monday, Tuesday, Wednesday, Thursday, Friday, Saturday, and Sunday, according to the check-in time in a single weekly cycle. The total number of check-ins for each group was 604, 475, 523, 456, 484, 915, and 1085, respectively (Table 3). Residents’ UGS utilization reached its lowest point one week after the pandemic’s first peak point (23–29 March 2020).
As presented in Table 3 and Appendix B, UGS utilization declined when the pandemic was at its peak. After the first wave of the pandemic, the number of check-ins at each attraction rebounded, maintaining a low level until a certain time, not exceeding the pre-pandemic condition. However, contrary to subjective expectations, certain attractions showed a new post-pandemic norm by exceeding the pre-pandemic level of utilization in some cycles. In particular, @1 peaked at the same level as the pre-pandemic level on Thursdays, Fridays, and Sundays, while the remaining days had lower peaks. @2 peaked at the same level as the pre-pandemic level on Mondays and Wednesdays; on Tuesdays and Thursdays, it exceeded the pre-pandemic level; and on Fridays, Saturdays, and Sundays, it was lower than the pre-pandemic level. @3 exceeded the pre-pandemic level on Mondays through Sundays, mainly on days after October 2020. @4 briefly exceeded the pre-pandemic level from 15 March 2021 (Monday) until 26 April 2021 (Monday) and fell below the pre-pandemic level on all other days. @5 exceeded the pre-pandemic level from Monday to Sunday, with the earliest occurrence on 24 September 2020 (Thursday). @6 exceeded the pre-pandemic level on Mondays, Tuesdays, Wednesdays, Thursdays, Fridays, and Sundays, and this occurred as early as 18 April 2021 (Monday) and reached the same level as the pre-pandemic level on Saturdays.
@7 exceeded the pre-pandemic level on Tuesdays, Thursdays, and Fridays. On Saturdays and Sundays, it was at the pre-pandemic level, and on Mondays and Wednesdays, it was below the pre-pandemic level. @8 exceeded the pre-epidemic level on Wednesdays and Thursdays and was the same as the pre-epidemic level on Fridays and Saturdays. @9 exceeded the pre-pandemic level on Thursdays and was the same as the pre-pandemic level on Wednesdays and Sundays. @10 exceeded the pre-pandemic level on Mondays, Fridays, and Sundays. @11 exceeded the pre-pandemic level on Mondays. @12 exceeded the pre-pandemic level on Tuesdays and Wednesdays. Finally, @13 exceeded the pre-pandemic level from Mondays through Fridays and on Sundays, and exhibited the same level as the pre-pandemic level on Saturdays.

3.4. Emotional Value Analysis

The daily emotion value was determined by the calculated average of the signed-in message text messages on Weibo on a particular day; the value was considered 0 if there were no signed-in messages on that day. The range of emotion from 0 to 2000 was considered a state of relative anxiety, and when the value was from 0 to −2000, it was considered a state of positive emotions. The intensity of emotion was positively correlated with the absolute value of the emotional value. As demonstrated in Figure 2, before the outbreak on 22 March 2020, UGS users were generally calm and relaxed, with occasional anxiety. The anxiety values were all in the range of 0 to 1000 points.
At the end of the first outbreak, @1, @2, @5, @6, @7, @9, @10, and @13 showed high levels of positive sentiment compared to pre-outbreak levels. Overall, after each peak point of the outbreak, anxiety values rose briefly, often following the pattern of high anxiety levels (sentiment values above 1000) followed by a rapid shift to a positive emotional state. Finally, positive and anxious emotions were expressed more strongly after the outbreak.

4. Discussion

The results of this study show that the emergence of COVID-19 led to a significant change in the number of UGS users in Guangzhou. There was a significant correlation between the number of new COVID-19 cases and the number of UGS users. The reduced frequency of UGS use was most pronounced during the first outbreak, and the frequency of use of each UGS was at a relative minimum during each new outbreak. Recovery of UGS use tended to be negatively correlated with the occurrence of new cases.
The number of visitors to @1 South Sea Temple increased after the rise in the new cases of the epidemic. It is located in a village (Fuxu Village) outside Guangzhou City and covers an area of 30,000 square meters. It is surrounded by farmland and is adjacent to the Shizi ocean. The buildings in the neighborhood are mainly rural single-family houses with few high-rise apartments, so it is reasonable to assume that the population and residential density are low. The number of visitors to @2 Bejijiang Miniature Three Gorges did not fluctuate significantly after the pandemic outbreak. The main landscape of @2 is a beautiful natural river, and rural houses dominate the surrounding area, so it is reasonable to believe that it has a low population and residential density. Also, it is far from downtown Guangzhou (about 140 km), so the distance factor will likely limit the frequency of UGS use here. The number of weekend visitors to @3 Hazizhu Lake Park increased compared to the weekends before the outbreak. It is in the central part of Guangzhou (Haizhu District); together with the city’s landmarks, Guangzhou Tower, and Sports Center, it forms the “ecological green axis” of the southern section of the city’s central axis. The area is densely populated, with many high-rise residential and commercial complexes in the vicinity. According to Figure 2, this area was also a frequently visited UGS before the outbreak; however, after the outbreak, the time interval of its visitation changed. @4 Calamus Stream is near a valley in Baiyun Mountain, Guangzhou, where many calamuses grow. It was briefly utilized more than before the outbreak, during the interval 15 March–26 April 2021, and was visited less than before the outbreak on all other days. This may be because the site is in the middle of a mountain and therefore less accessible to tourists. @5 Guangxiao Temple is located in Yuexiu District, Guangzhou, one of the smallest and most densely populated municipal districts in Guangdong Province, with an average of 52,834 people per square kilometer. After the outbreak, the number of visitors to this area on Saturdays and Sundays increased significantly compared to the pre-epidemic period. @6 Yuexiu Mountain is a natural mountain range, 70 meters above sea level, located on the north side of Guangzhou City, in the valley where the Yuexiu Mountain Stadium was built and around which a large number of people have lived since ancient times. During the initial phase after the outbreak, the number of utilizers of @6 dropped significantly. @7 Shanding Park is an elevated point running across the outskirts of Guangzhou, offering a panoramic view of the city and its suburbs. After the outbreak, the peak number of visitors using @7 on weekdays showed an upward trend. @8 Five Immortals Taoist Temple is also located in Yuexiu District, next to the Yuexiu District Museum. This area has high population and residential densities. After the outbreak, its peak number of utilizers significantly exceeded the pre-epidemic level. @9 Yaozhou Ruins is a protected cultural heritage unit of Guangdong Province, about 2000 square meters, also located in Yuexiu District. This means that it has a high population and residential density in its vicinity. After the outbreak, there was a spike in weekday users that exceeded pre-epidemic levels. @10 Liwan Park is located in Liwan District, Guangzhou, characterized by the Guangzhou government as “the central city with the most Lingnan characteristics.” Liwan Park is a lake-based park, with a lake (270,000 m2) accounting for about 2/3 of the overall park area. After the outbreak, the number of visitors generally increased on weekdays and weekends. @11 Pazhou Pagoda is located in Pazhou Village, near the Pearl River. The main landscape is an ancient pagoda, which was built in 1600. Nowadays, it is surrounded by high-rise residential areas with high population and residential densities. The number of visitors to this UGS did not change significantly before and after the epidemic. The main part of @12 Zhenhai Tower, located in Yuexiu District, is an ancient building built in 1380 and is one of Guangzhou’s urban landmarks, with a dense population around it. There is a saying in Guangzhou that “you have not arrived in Guangzhou without climbing the Zhenhai Tower.” After the pandemic outbreak, the utilization on weekdays increased. The Zhenhai Tower is known as the “lighthouse of the Pearl River civilization” and is famous for its fusion of Buddhism, Taoism, and Confucianism. It is surrounded by villages and farmland and has low residential and population densities. After the outbreak, the number of weekday visitors increased significantly.
Within two days of the increase in new cases, the use of most UGSs showed a decreasing trend, with @6 Yuexiu Mountain, a mountain with a long history nestled within the densely populated central city of Guangzhou (Yuexiu District), being the most significantly affected UGS. Many Guangzhou citizens reportedly [30] visit the mountain during their leisure time; this began in the Song dynasty and has continued to the modern era. The location is known to have a high density of visitors. Studies [31] have reported that visitors tended to avoid such high crowd density areas after the outbreak, which may explain why this area was most affected by the outbreak. In contrast, the number of visitors to both @1 and @10 UGS increased after the increase in new cases. The largest increase was in @10 Liwan Lake Park, a park with lakes and an area of about 400,000 square meters. It consists of four lakes: Xiao Cui Lake, Yu Cui Lake, Ru Yi Lake, and Wu Xiu Lake. These lakes naturally divide the UGSs into different parts, so visitors have various ways to enjoy the place. For example, visitors can use rental boats and water bikes to visit the green areas on the water. The place is far from the city center, but it is easily accessible by car, as shown in Figure 1. Therefore, the number of visitors to this place in the context of COVID-19 can be regarded as a result of the epidemic prevention campaign [32]; citizens preferred to visit the UGS while maintaining social distancing. At the same time, according to Table 2, most UGSs in the city experienced a decrease in attendance when the number of new cases increased. Since citizens’ demand for UGSs did not decrease [33], they likely preferred easily accessible UGSs with a low risk of infection. Liwan Lake Park is an excellent example of this.
Regarding the timings of UGS use, the COVID-19 outbreak marked a threshold, with the use of all 13 UGSs showing significant changes from this point. In general, the number of UGS users decreased on Saturdays and Sundays and increased on weekdays, compared to the number of users on weekends and weekdays prior to COVID-19. The most significant increase was observed on Thursdays and affected nine of the 13 sites studied. However, not all UGSs experienced a decrease in weekend attendance. In particular, the number of weekend visitors at @3 Haizhu Lake Park and @5 Guang-xiao Temple increased compared to the pre-pandemic period. The increase in visitors at Haizhu Lake Park may be related to the increase at Liwan Lake Park mentioned above. Haizhu Lake Park has a water area of about 530,000 m2 and forms a water network of a lake and six veins [34] with the surrounding six rivers and sills, including the Shiduigang River, Tai Wai River, Datang River, Shangchong River, Yangwan River, and Xilu River. The separation of the UGS by the lake reduces the density of visitors. The @5 Guangxiao Temple is a Buddhist temple with a history of over 2000 years. According to legend, it is the oldest temple in Guangzhou and the place where the ancestor of Chinese Buddhism, Dharma, came to rest. Since ancient times, the Chinese have visited Buddhist temples during natural disasters and plagues. They go to these temples to pray for peace and hope that the plague will soon disappear. Among the 13 UGSs studied, @1 South Sea Temple and @8 Taoist Temple of the Five Immortals did not show the same trend as @5. This is likely due to the content of the rituals, as @1 is dedicated to a god associated with safe sailing, while @8 is dedicated to a Chinese Taoist deity associated with the idea of “wu wei” (doing nothing). At @5 Guangxiao Temple is the “Washing Bowl Spring” (commonly known as the “Dharma Well”) of Dharma, the founder of Chinese Zen Buddhism and, according to popular belief, the founder of the martial art “Yi Jin Jing” of Shaolin Temple. The practice of Yi Jin Jing is believed to promote lung function, physical activity, quality of life, and self-efficacy in emotion regulation [35]. In Chinese folklore, Dharma is also considered as the Buddha who can bring good health. Therefore, there was an increase in believers on both weekdays and weekends in the context of the pandemic. At Haizhu Lake Park @3, Guangxiao Temple @5, Yuexiu Mountain @6, Liwan Lake Park @10, and Xiqiao Mountain @13, the average number of visitors per day on weekdays exceeded the pre-pandemic level. There are two possible reasons for this phenomenon. First, as shown in Table 1, the study population consisted mostly of young and highly educated people, mainly white-collar workers. During the pandemic, most of them transitioned to online office work, which allowed them to allocate their time for UGS use relatively flexibly, without the strict time constraints of the pre-pandemic period [36]. It also increased the number of time slots in which they could visit UGSs. Second, whereas the visitation of @5 may have been influenced by religious factors, the remainder of these UGS (@3, @6, @10, and @13) have large areas (extensive mountains or bodies of water). This may have influenced visitor expectations of the respective crowd density; users who could easily access these sites were more likely to visit them on days when they expected low visitor density.
The change in UGS users’ emotions pre- and post-pandemic was significant. Generally, they expressed stronger emotions after the outbreak than before. Whether anxious or calm, their maximum absolute values exceeded the pre-epidemic levels. Combined with Figure 2, the higher the number of utilizers, the higher the intensity of their expressions of calmness. This may be because a high number of users likely implies a popular UGS, so citizens who visit here tend to have a comfortable visiting experience. According to Nutsford’s study, a comfortable visiting experience can effectively reduce people’s anxiety levels and increase their activeness [37]. Further, according to Saadat’s study, the pandemic affected people’s lives in various ways (including, but not limited to, reduced job opportunities, lower wages, weaker interpersonal relationships, etc.), and the prolonged outbreak greatly contributed to a prolonged state of mental distress [38]. In this regard, travel restrictions during the pandemic prevented the fulfilment of people’s demand for UGSs. Therefore, when they ultimately visited UGSs, the long-awaited release of their emotions through visiting UGSs is a likely cause of their intense emotional releases.

5. Conclusions

The outbreak of COVID-19 led to significant changes in the behavior of the Chinese population in their use of UGS. During the pandemic, they preferred UGSs with natural water or mountain stands and lower expected population density. They also preferred to visit UGSs on weekdays rather than weekends due to changes in lifestyle, such as offline office work. The religious characteristics of UGSs were also an influential factor, with UGSs with religious facilities that allowed residents to pray for their health being more popular than others. In terms of emotions, UGS users tended to be more positive during the pandemic and more empowered than before the pandemic.
The study confirms a significant relationship between the increase in COVID-19 cases and the number of UGS users. It supports the view that the religious characteristics of UGSs and the expectation of low population density influence UGS use. It also demonstrates that the timing of UGS use changed after COVID-19, as people tended to visit UGSs on weekdays. Finally, positive emotions were found to be associated with UGS use during COVID-19.

Limitations and Future Research

The accuracy of this study relies heavily on the accuracy of the data crawling and text processing algorithms. The development of this part of the algorithm is limited by the author’s heavy reliance on published work in computer science. For example, this method does not provide a clear picture of whether visitors to UGS come alone, with children, or with pets. In addition, crawling data based on a specific website (Weibo in this study) reflects a significantly higher or lower proportion of people in a specific age group due to the limited demographic of the target users. In this study, the proportion of 17–39-year-olds is significantly higher than the proportion of those over 60 years of age.
Admittedly, at this stage, the data crawling and sentiment processing algorithms, which rely on the Chinese text database, may not be fully accurate, thereby leaving room for improvement. Further, the analyses relied on existing reports or studies, and no stable quantitative system has been developed. Future technological advances are hoped to provide a stable and reliable system in this regard.

Author Contributions

Conceptualization, S.L. and J.Z. (Junhua Zhang); methodology, S.L.; software, S.L.; validation, C.S., R.Y. and J.Z. (Jianye Zhao); formal analysis, K.H.; investigation, S.T.; resources, K.L.; data curation, S.L.; writing—original draft preparation, S.L.; writing—review and editing, J.Z. (Junhua Zhang); visualization, S.L.; supervision, J.Z. (Junhua Zhang); project administration, S.T.; funding acquisition, C.S. All authors have read and agreed to the published version of the manuscript.

Funding

This research was funded by JST SPRING, Grant Number JPMJSP2109 (Japan) and the Ministry of education of Humanities and Social Science project (NO. 21YJCZH137, China).

Data Availability Statement

The Sina Weibo check-in data are openly accessible to the public, COVID-19 data were obtained from the Guangzhou Health and Wellness Commission website.

Acknowledgments

The authors thank BuyiXiao for technical support with the Python-based crawler.

Conflicts of Interest

The authors declare no conflict of interest.

Appendix A

This table shows the basic information of the Eight Views of Ram City and the link to the Weibo check-in page.
Table A1. The Eight Views of Ram City and Weibo check-in page.
DynastyEight Views’ NamesName in EnglishConditionLocationCheck-in Page
Song扶胥浴日Fuxu Bathed in Sunlightintact@1https://weibo.com/p/100101B2094654D76AA6FE4493
(accessed on 25 June 2022)
石门返照Reflections of Shimenintact@2https://weibo.com/p/100101B2094452D265A7FC419D
(accessed on 25 June 2022)
珠江秋色Autumn scenery of Pearl Riverintact@3https://weibo.com/p/100101B2094757D06BA5FB439F
(accessed on 25 June 2022)
海山晓霁Haishan Building after dawn showervanish
菊湖云影Reflections of clouds on Juhu Lakevanish
蒲涧濂泉Changpu Creek and Lianquan Springpartial@4https://weibo.com/p/100101B2094654D46CAAF8409C
(accessed on 25 June 2022)
光孝菩提Pipal in Guangxiao Templeintact@5https://weibo.com/p/100101B2094654D46EA3FE4898
(accessed on 25 June 2022)
大通烟雨Datong Temple and Yanyu Wellvanish
Yuan扶胥浴日Fuxu Bathed in Sunlightintact@1https://weibo.com/p/100101B2094654D76AA6FE4493
(accessed on 25 June 2022)
石门返照Reflections of Shimenintact@2
蒲涧濂泉Changpu Creek and Lianquan Springpartial@4https://weibo.com/p/100101B2094654D46CAAF8409C
(accessed on 25 June 2022)
大通烟雨Datong Temple and Yanyu Wellvanish
粤台秋色Autumn sights at Yuewang Platformpartial@6
白云晚望Night View of Baiyun Templeintact@7https://weibo.com/p/100101B2094757D069AAF4419B
(accessed on 25 June 2022)
景泰僧归Monks Returning to Jingtai Templevanish
灵洲鳌负Mount Lingzhou carried by a godly turtlevanish
Ming珠江晴澜Waves of the Pearl River in a clear dayintact@3https://weibo.com/p/100101B2094757D06BA5FB439F
(accessed on 25 June 2022)
粤秀松涛Pines of Yuexiu Mountainpartial@6https://weibo.com/p/100101B2094757D06FA3F9409E
(accessed on 25 June 2022)
穗石洞天Scenes of Sui Rockintact@8https://weibo.com/p/100101B2094654D76DA0F4429D
(accessed on 25 June 2022)
番山云气Mist on Mount Panvanish
药洲春晓Spring dawn on Yaozhou Isletpartial@9
琪琳苏井Jade woods and Su Shi’s wellvanish
象山樵歌Mount Xianggang wood cutters’ songsvanish
荔枝渔唱Lychee Bay fishermen’s songspartial@10https://weibo.com/p/100101B2094757D068A1FD4998
(accessed on 25 June 2022)
Early Qing五仙霞洞Five Immortals Grottointact@8https://weibo.com/p/100101B2094654D76DA0F4429D
(accessed on 25 June 2022)
琶洲砥柱Pazhou Pagoda as an Axial Columnpartial@11https://weibo.com/p/100101B2094654D46EA5FC409E
(accessed on 25 June 2022)
孤兀禺山Lone Towering Yushan Mountainvanish
镇海层楼Zhenhai Towerintact@12https://weibo.com/p/100101B2094757D06AA1FA489E
(accessed on 25 June 2022)
浮丘丹井Fuqiu Reef and Alchemy Wellvanish@9https://weibo.com/p/100101B2094654D664A6F8409A
(accessed on 25 June 2022)
西樵云瀑Waterfall from Clouds on Xiqiao Mountainintact@13https://weibo.com/p/100101B2094653D36FAAFB4698
(accessed on 25 June 2022)
东海鱼珠Yuzhu Reef at East Seavanish
粤秀连峰The Long Sweep of Hills of Yuexiu Mountainpartial@6https://weibo.com/p/100101B2094757D06FA3F9409E
(accessed on 25 June 2022)
Late Qing石门返照Reflections of Shimenintact@2https://weibo.com/p/100101B2094452D265A7FC419D
(accessed on 25 June 2022)
菠萝浴日Boluo Bathed in Sunlightintact@1https://weibo.com/p/100101B2094654D76AA6FE4493
(accessed on 25 June 2022)
珠江夜月Moonlight on Pearl Riverintact@3https://weibo.com/p/100101B2094757D06BA5FB439F
(accessed on 25 June 2022)
金山古寺Jinshan Mountain Ancient Templevanish
大通烟雨Datong Temple and Yanyu Wellvanish
白云晚望Night View of Baiyun Templeintact@7https://weibo.com/p/100101B2094757D069AAF4419B
(accessed on 25 June 2022)
蒲涧濂泉Changpu Creek and Lianquan Springpartial@4https://weibo.com/p/100101B2094654D46CAAF8409C
(accessed on 25 June 2022)
景泰僧归Monks Returning to Jingtai Templevanish

Appendix B

These figures are the numbers of check-in and new cases of COVID-19 classification for each day of the week.
Figure A1. @1–@4 daily data.
Land 11 00990 g0a1
Figure A2. @5–@8 daily data.
Land 11 00990 g0a2
Figure A3. @9–@13 daily data.
Land 11 00990 g0a3

References

  1. Cox, D.T.C.; Shanahan, D.F.; Hudson, H.L.; Plummer, K.E.; Siriwardena, G.M.; Fuller, R.A.; Anderson, K.; Hancock, S.; Gaston, K.J. Doses of Neighborhood Nature: The Benefits for Mental Health of Living with Nature. BioScience 2017, 67, 147–155. [Google Scholar] [CrossRef]
  2. Escobedo, F.J.; Kroeger, T.; Wagner, J.E. Urban forests and pollution mitigation: Analyzing ecosystem services and disservices. Environ. Pollut. 2011, 159, 2078–2087. [Google Scholar] [CrossRef] [PubMed]
  3. Li, D.; Deal, B.; Zhou, X.; Slavenas, M.; Sullivan, W.C. Moving beyond the neighborhood: Daily exposure to nature and adolescents’ mood. Landsc. Urban Plan. 2018, 173, 33–43. [Google Scholar] [CrossRef]
  4. Tyrvaeinen, L.; Ojala, A.; Korpela, K.; Lanki, T.; Tsunetsugu, Y.; Kagawa, T. The influence of urban green environments on stress relief measures: A field experiment. J. Environ. Psychol. 2014, 38, 1–9. [Google Scholar] [CrossRef]
  5. Ugolini, F.; Massetti, L.; Calaza-Martínez, P.; Cariñanos, P.; Dobbs, C.; Ostoić, S.K.; Marin, A.M.; Pearlmutter, D.; Saaroni, H.; Šaulienė, I.; et al. Effects of the COVID-19 pandemic on the use and perceptions of urban green space: An international exploratory study. Urban For. Urban Green. 2020, 56, 126888. [Google Scholar] [CrossRef]
  6. Lopez, B.; Kennedy, C.; Field, C.; McPhearson, T. Who benefits from urban green spaces during times of crisis? Perception and use of urban green spaces in New York City during the COVID-19 pandemic. Urban For. Urban Green. 2021, 65, 127354. [Google Scholar] [CrossRef]
  7. Wolch, J.R.; Byrne, J.A.; Newell, J.P. Urban green space, public health, and environmental justice: The challenge of making cities’ just green enough. Landsc. Urban Plan. 2014, 125, 234–244. [Google Scholar] [CrossRef] [Green Version]
  8. Cornwell, E.Y.; Waite, L.J. Social disconnectedness, perceived isolation, and health among older adults. J. Health Soc. Behav. 2009, 50, 31–48. [Google Scholar] [CrossRef] [Green Version]
  9. Musselwhite, C.; Avineri, E.; Susilo, Y. Editorial JTH 16–The Coronavirus Disease COVID-19 and implications for transport and health. J. Transp. Health 2020, 16, 100853. [Google Scholar] [CrossRef]
  10. Berdejo-Espinola, V.; Suárez-Castro, A.F.; Amano, T.; Fielding, K.S.; Oh, R.R.Y.; Fuller, R.A. Urban green space use during a time of stress: A case study during the COVID-19 pandemic in Brisbane, Australia. People Nat. 2021, 3, 597–609. [Google Scholar] [CrossRef]
  11. Immunization Health Information Code (Guangzhou Municipal People’s Government 2020). Available online: http://www.gz.gov.cn/zt/qlyfdyyqfkyz/gzzxd/content/post_5787460.html (accessed on 17 May 2022).
  12. Houlden, V.; Weich, S.; Albuquerque, J.P.d.; Jarvis, S.; Rees, K. The relationship between greenspace and the mental wellbeing of adults: A systematic review. PLoS ONE 2018, 13, e0203000. [Google Scholar] [CrossRef] [PubMed] [Green Version]
  13. Twohig-Bennett, C.; Jones, A. The health benefits of the great outdoors: A systematic review and meta-analysis of greenspace exposure and health outcomes. Environ. Res. 2018, 166, 628–637. [Google Scholar] [CrossRef] [PubMed]
  14. Van den Berg, A.E.; Maas, J.; Verheij, R.A.; Groenewegen, P.P. Green space as a buffer between stressful life events and health. Soc. Sci. Med. 2010, 70, 1203–1210. [Google Scholar] [CrossRef] [PubMed] [Green Version]
  15. Batty, M. Big data, smart cities and city planning. Dialogues Hum. Geogr. 2013, 3, 274–279. [Google Scholar] [CrossRef] [PubMed]
  16. Rathore, M.M.; Ahmad, A.; Paul, A.; Rho, S. Urban planning and building smart cities based on the Internet of Things using Big Data analytics. Comput. Netw. 2016, 101, 63–80. [Google Scholar] [CrossRef]
  17. Zhu, J.; Xu, C. Sina microblog sentiment in Beijing city parks as measure of demand for urban green space during the COVID-19. Urban For. Urban Green. 2020, 58, 126913. [Google Scholar] [CrossRef]
  18. Sina Weibo User Development Report (2020). Available online: https://data.weibo.com/report/reportDetail?id=456 (accessed on 17 May 2022).
  19. Tong, J.; Zuo, L. Weibo communication and government legitimacy in China: A computer-assisted analysis of Weibo messages on two ‘mass incidents’. Inf. Commun. Soc. 2014, 17, 66–85. [Google Scholar] [CrossRef] [Green Version]
  20. Li, K.; Woudstra, J.; Feng, W. ‘Eight Views’ versus ‘Eight Scenes’: The History of the Bajing Tradition in China. Landsc. Res. 2010, 35, 83–110. [Google Scholar] [CrossRef]
  21. Xin, G.; Junhua, Z. Current situation and trend of research on eight scenery in China. Environ. Inf. Sci. 2008, 37, 60–67. [Google Scholar]
  22. Xia, Z. China’s “eight scenes” tradition and its cultural significance. Planner 2006, 22, 89–91. [Google Scholar]
  23. Zhaoxuan, Z. Eight Views of Yangcheng in the Song Dynasty. Open Times 1987, 4, 60. [Google Scholar]
  24. Jiaying, Z. The characteristics and patterns of the eight scenic spots of Yangcheng from Song Dynasty to the present. J. Guangzhou Univ. Soc. Sci. Ed. 2003, 2, 42–44. [Google Scholar]
  25. Yingxian, D. Study on the Relationship between the Eight Scenes of Yangcheng and the Evolution of Urban Form in Guangzhou. Ph.D. Thesis, South China University of Technology, Guangzhou, China, 2011. [Google Scholar]
  26. Lingling, Z. The Eight Views of Ram City: Symbols of Times and Humanity. Cult. Herit. 2012, 3, 146–151. [Google Scholar]
  27. Xin, G. The Eight Sights of Guangzhou in Different Eras; Lingnan Arts Publishing House: Guangzhou, China, 2015; pp. 21–159. [Google Scholar]
  28. Guangzhou Municipal Health and Wellness Commission. Available online: http://wjw.gz.gov.cn/ztzl/xxfyyqfk/yqtb/ (accessed on 17 May 2022).
  29. Schipperijn, J. Forest & Landscape Research No. 45-2010. In Use of Urban Green Space; Forest & Landscape: Frederiksberg, Denmark, 2010; p. 155. [Google Scholar]
  30. Yuxin, F. Study on the evolution of the relationship between city and mountain in the view of urban historical landscape: The example of Guangzhou ancient city and Yuexiu Mountain. Proc. Annu. China Urban Plan. Conf. 2021, 9, 10–13. [Google Scholar]
  31. Reid, C.E.; Rieves, E.S.; Carlson, K. Perceptions of green space usage, abundance, and quality of green space were associated with better mental health during the COVID-19 pandemic among residents of Denver. PLoS ONE 2022, 17, e0263779. [Google Scholar] [CrossRef] [PubMed]
  32. Wen, J.; Kozak, M.; Yang, S.; Liu, F. COVID-19: Potential effects on Chinese citizens’ lifestyle and travel. Tour. Rev. 2020, 76, 74–87. [Google Scholar] [CrossRef]
  33. Venter, Z.S.; Barton, D.N.; Gundersen, V.; Figari, H.; Nowell, M. Urban nature in a time of crisis: Recreational use of green space increases during the COVID-19 outbreak in Oslo, Norway. Environ. Res. Lett. 2020, 15, 104075. [Google Scholar] [CrossRef]
  34. Lin, P.; Chen, L.; Luo, Z. Analysis of Tourism Experience in Haizhu National Wetland Park Based on Web Text. Sustainability 2022, 14, 3011. [Google Scholar] [CrossRef]
  35. Zhang, M.; Xv, G.; Luo, C.; Meng, D.; Ji, Y. Qigong Yi Jinjing promotes pulmonary function, physical activity, quality of life and emotion regulation self-efficacy in patients with chronic obstructive pulmonary disease: A pilot study. J. Altern. Complement. Med. 2016, 22, 810–817. [Google Scholar] [CrossRef]
  36. Sostero, M.; Milasi, S.; Hurley, J.; Fernandez-Macías, E.; Bisello, M. Teleworkability and the COVID-19 crisis: A new digital divide? In JRC Working Papers Series on Labour, Education and Technology; European Commission, Joint Research Centre: Isprava, Italy, 2020; Available online: http://hdl.handle.net/10419/231337 (accessed on 17 May 2022).
  37. Nutsford, D.; Pearson, A.L.; Kingham, S. An ecological study investigating the association between access to urban green space and mental health. Public Health 2013, 127, 1005–1011. [Google Scholar] [CrossRef]
  38. Saadat, S.; Rawtani, D.; Hussain, C.M. Environmental perspective of COVID-19. Sci. Total Environ. 2020, 728, 138870. [Google Scholar] [CrossRef] [PubMed]
Figure 1. Sina Weibo UGS Check-in map of Guangzhou.
Land 11 00990 g001
Figure 2. UGS users’ emotional trend Note: P-V refers to case value of check-in and COVID-19; E-V refers to emotion value.
Land 11 00990 g002
Table 1. Basic check-in data.
Column@1@2@3@4@5@6@7@8
LocationSouth Sea TempleBeijiang Miniature Three GorgesHaizhu Lake ParkCalamus StreamGuangxiao TempleYuexiu MountainShanding ParkFive Immortals Taoist Temple
DataCollected435288796249791462788235
Valid362196616129553362531113
GenderMale134821915520513620233
Female2281144257434822632980
Age<16971831611173
17–29133501874314710619239
30–3936276395539598
40–49971221511112
50–5910615431
60–6901011100
>7021724450
Unfilled1721033236831018624260
EducationCollege8150137301209012227
High School18141552017284
Unfilled2631324649441325538182
Column@9@10@11@12@13
LocationYaozhou RuinsLiwan Lake ParkPazhou
Pagoda
Zhenhai TowerXiqiao
Mountain
DataCollected195692213113828
Valid16756216377711
GenderMale701636027249
Female9739910350462
Age<1615234333
17–29391844712183
30–391541149110
40–4910111151
50–591016307
60–6901111
>7053214
Unfilled732839150322
EducationCollege341284821181
High School152912752
Unfilled11840510349478
Table 2. The correlation between check-in data and COVID-19 new cases.
ColumnNew case@1@2@3@4@5@6@7@8@9@10@11@12@13
New caser 110.129 **−0.049−0.080 *−0.040−0.020 *−0.059 *−0.058 **−0.056 *−0.019 *0.144 **0.033−0.051 **−0.190 **
D 2731731731731731731731731731731731731731731
@1r0.129 **10.1250.104 **0.0530.092 *0.101 **0.235 **0.079 *0.0040.0450.036*0.0510.064
D731731731731731731731731731731731731731731
@2r−0.0490.12510.1080.086−0.133 **0.0720.063−0.035 *−0.014 **0.0720.004*−0.057*0.087 *
D731731731731731731731731731731731731731731
@3r−0.080 *0.104 **0.10810.0610.282 **0.086 *0.171 **−0.0110.0350.283**0.1140.158**0.349 **
D731731731731731731731731731731731731731731
@4r−0.0400.0530.0860.06110.154 **−0.0200.097 **0.012 *0.091 *0.095−0.024 **−0.0200.068
D731731731731731731731731731731731731731731
@5r−0.020 *0.092 *−0.133 **0.282 **0.154 **10.146 **0.211 **0.0350.132 **0.262 **−0.043 *0.0140.327 **
D731731731731731731731731731731731731731731
@6r−0.059 *0.101 **0.0720.086 *−0.0200.146 **1−0.0580.020−0.0250.080 *−0.067 *−0.0360.077 *
D731731731731731731731731731731731731731731
@7r−0.058 **0.235 **0.0630.171 **0.097 **0.211 **−0.05810.0520.076*0.172 **−0.026 **0.141 **0.268 **
D731731731731731731731731731731731731731731
@8r−0.056 *0.079 *−0.035 *−0.0110.012 *0.0350.0200.05210.0400.0290.0570.057−0.032
D731731731731731731731731731731731731731731
@9r−0.019 *0.004−0.014 **0.0350.091 *0.132 **−0.0250.076 *0.04010.098 **−0.046 *−0.0290.062
D731731731731731731731731731731731731731731
@10r0.144 **0.0450.0720.283 **0.0950.262 **0.080 *0.172 **0.0290.098 **10.0100.111**0.328 **
D731731731731731731731731731731731731731731
@11r0.0330.036 *0.004 *0.114−0.024 **−0.043 *−0.067 *−0.026 **0.057−0.046 *0.01010.0420.045 *
D731731731731731731731731731731731731731731
@12r−0.051 **0.051−0.057 *0.158 **−0.0200.014−0.0360.141 **0.057−0.0290.111 **0.04210.085 *
D731731731731731731731731731731731731731731
@13r−0.190 **0.0640.087 *0.349 **0.0680.327 **0.077 *0.268 **−0.0320.0620.328 **0.045 *0.085 *1
D731731731731731731731731731731731731731731
1 The ‘r’ is short for Pearson product-moment correlation coefficient. 2 The ‘D’ is short for total days of data collection. The number marked by * means test value is less than 0.05, with significant correlation.
Table 3. The weekly check-in data.
Day of WeekColumn@1@2@3@4@5@6@7@8@9@10@11@12@13
Mon.Total39207922675775122380193108
PB 13211238231101
PA 2229561431253110
Tue.Total3920741055295215206317774
PB4112213331211
PA236161171252214
Wed.Total441068667615412236615889
PB7112355121111
PA21715123425125
Thu.Total38106510492656161959231075
PB2113212111332
PA22424103237214
Fri.Total4525628563158162060221170
PB2241323232411
PA21516127227229
Sat.Total6653107431337510521301093616121
PB56397106257656
PA43718106226216
Sun.Total9158161301268313121321253122174
PB3435345325343
PA33925165129228
1 PB refers to the peak check-in number before COVID-19 pandemic. 2 PA refers to the peak check-in number after COVID-19 pandemic.
Publisher’s Note: MDPI stays neutral with regard to jurisdictional claims in published maps and institutional affiliations.

