1. Introduction
Global climate change is one of the greatest challenges of our time. The changes in the global climate are measurable, have been proven in many ways, and have become more evident than ever in recent years. The assessment reports of the Intergovernmental Panel on Climate Change (IPCC) between the years 2007 and 2014 already make clear the ongoing climate change and the associated diverse impacts [
1,
2]. The new Sixth Assessment Report arrives at an even more comprehensive picture. New and enhanced climate models and simulations, new analyses, and methods improve the understanding of the human influence on climate variables. Worldwide, the increasing impacts of global climate change are present and noticeable. Weather extremes, such as heat waves, heavy rainfall events, storms, or floods illustrate the problem [
3].
Impacts of climate and weather-related extremes depend on the magnitude of climate hazards in combination with locational exposure and vulnerability. In Europe, regions and cities are exposed to different climate and weather-related hazards depending on their geographical location and topography, whereas their physical and socio-economic characteristics influence their vulnerability [
4]. The main hazards and impacts of climate change, both current and projected, vary across European regions and cities. In the continental region, where Germany is mainly located, increasing heat extremes are a primary hazard. Together with reduced summer precipitation, they can increase drought risk, risks of forest fires, health risks, and energy demand during the summer. Climate change is also projected to change the river floods regimes in winter and spring because of seasonal precipitation changes [
4,
5,
6,
7].
Metropolitan regions and urban areas are particularly affected by the negative consequences of climate change [
1,
2,
8]. This is where assets, sensitive facilities and vulnerable groups of people are concentrated, so that a considerable potential for damage can unfold because of climatic changes. Furthermore, climatic changes are interrelated with the type and degree of building and land use as well as the existing urban and natural structure and socio-economic conditions [
4,
9]. In any case, there are interrelationships between climate change and other processes/megatrends such as demographic change, land use change or structural change [
10]. The spatial and temporal convergence of those megatrends can unfold different impact relationships and challenges that need to be managed in an integrated approach. Climate change has regional and local impacts on social, ecological, and economic systems. To deal with these challenges, it is necessary to have knowledge about the possible impacts, their causes and the related synergies and trade-offs. An integrated approach to climate adaptation strategies and measures can be promoted through appropriate instruments and structures of policy governance and coordination. Spatial planning in particular offers considerable opportunities for integrated approaches to dealing with climate change, strengthening resilience, reducing emissions, and promoting sustainable development [
1,
4,
9].
The challenges of climate change do not occur detached from other challenges such as structural change. Climate change and structural change are interrelated, as Matsuyama’s definition of the phenomenon of ‘structural change’ illustrates: “It is a complex, intertwined phenomenon, not only because economic growth brings about complementary changes in various aspects of the economy, such as the sector compositions of output and employment, the organization of industry, the financial system, income and wealth distribution, demography, political institutions, and even the society’s value system, but also because these changes can in turn affect the growth processes” [
11] (p. 2). On the one hand, climate change is driving these changes as Bardt shows in his work: “Climate change, climate protection and climate policy must be regarded as drivers of structural change” [
12] (p. 56). Both climate change adaptation and climate protection can lead to structural changes. Companies and their infrastructures must adapt to the climate and changing weather conditions. As a result, some of the previous products, production methods, locations and markets will be questioned. At the same time, adaptation can create opportunities for new markets and products [
12,
13]. On the other hand, structural change can influence climate change and its impacts. Moving the economy from a climate deconstructive, mainly carbon-based economy to a sustainable alternative economy can have positive effects on climate mitigation. The transition from a land-intensive economy to a knowledge-based and service economy can also reveal huge spatial potentials that can be used sustainably. For countries in Europe such as Germany, Greece, Poland, or the Czech Republic, these effects mainly impact the traditional lignite mining areas [
14]. Thus, the energy transition and the associated structural change in the German lignite mining areas in the Rhineland, Lusatia, and Central Germany, which are still heavily dependent on the old energy industry based on fossil fuels, also require an integrated view of the challenges described so that a sustainable transformation process can be designed [
15,
16]. To achieve this sustainability in managing structural change, it is essential that the challenges and impacts of climate change are considered for the areas affected by structural change.
The following explanations and results refer to the project DAZWISCHEN (Future-oriented structural change in the Rhenish lignite mining area). DAZWISCHEN is funded by the Federal Ministry of Education and Research (BMBF) within the framework of the Stadt-Land-Plus funding programme (German BMBF Funding Activity Urban-Rural). From 2020–2023, the project examines the structural changes in the region of the Rhenish lignite mining area and their local characteristics, both currently and in the future. In particular, the interrelationships between structural change, settlement and open space development, the mobility transition, the securing of services of general interest and, finally, impacts of climate change, will be examined. The project considers the spatial effects and changes on the functional interdependencies of the entire region with the surrounding cities (Aachen, Bonn and Cologne). The aim is to develop action strategies for sustainable land management in cooperation with the municipalities, political actors, and stakeholders in the region.
As described, a transformation process in the region should consider the challenges of both structural change and climatic change. An integrated consideration of the local impacts and resulting needs for action and opportunities should be incorporated into sustainable regional development. For this purpose, there is a lack of sound evidence based on the challenges of climate change in the region. Our contribution is therefore guided by the following research questions:
What contribution can a climate impact analysis make to the successful management of structural change?
What is the importance of considering scenario corridors for structural changes such as land use and population change for valid climate impact analyses?
2. Study Area—The Rhenish Lignite Mining Region
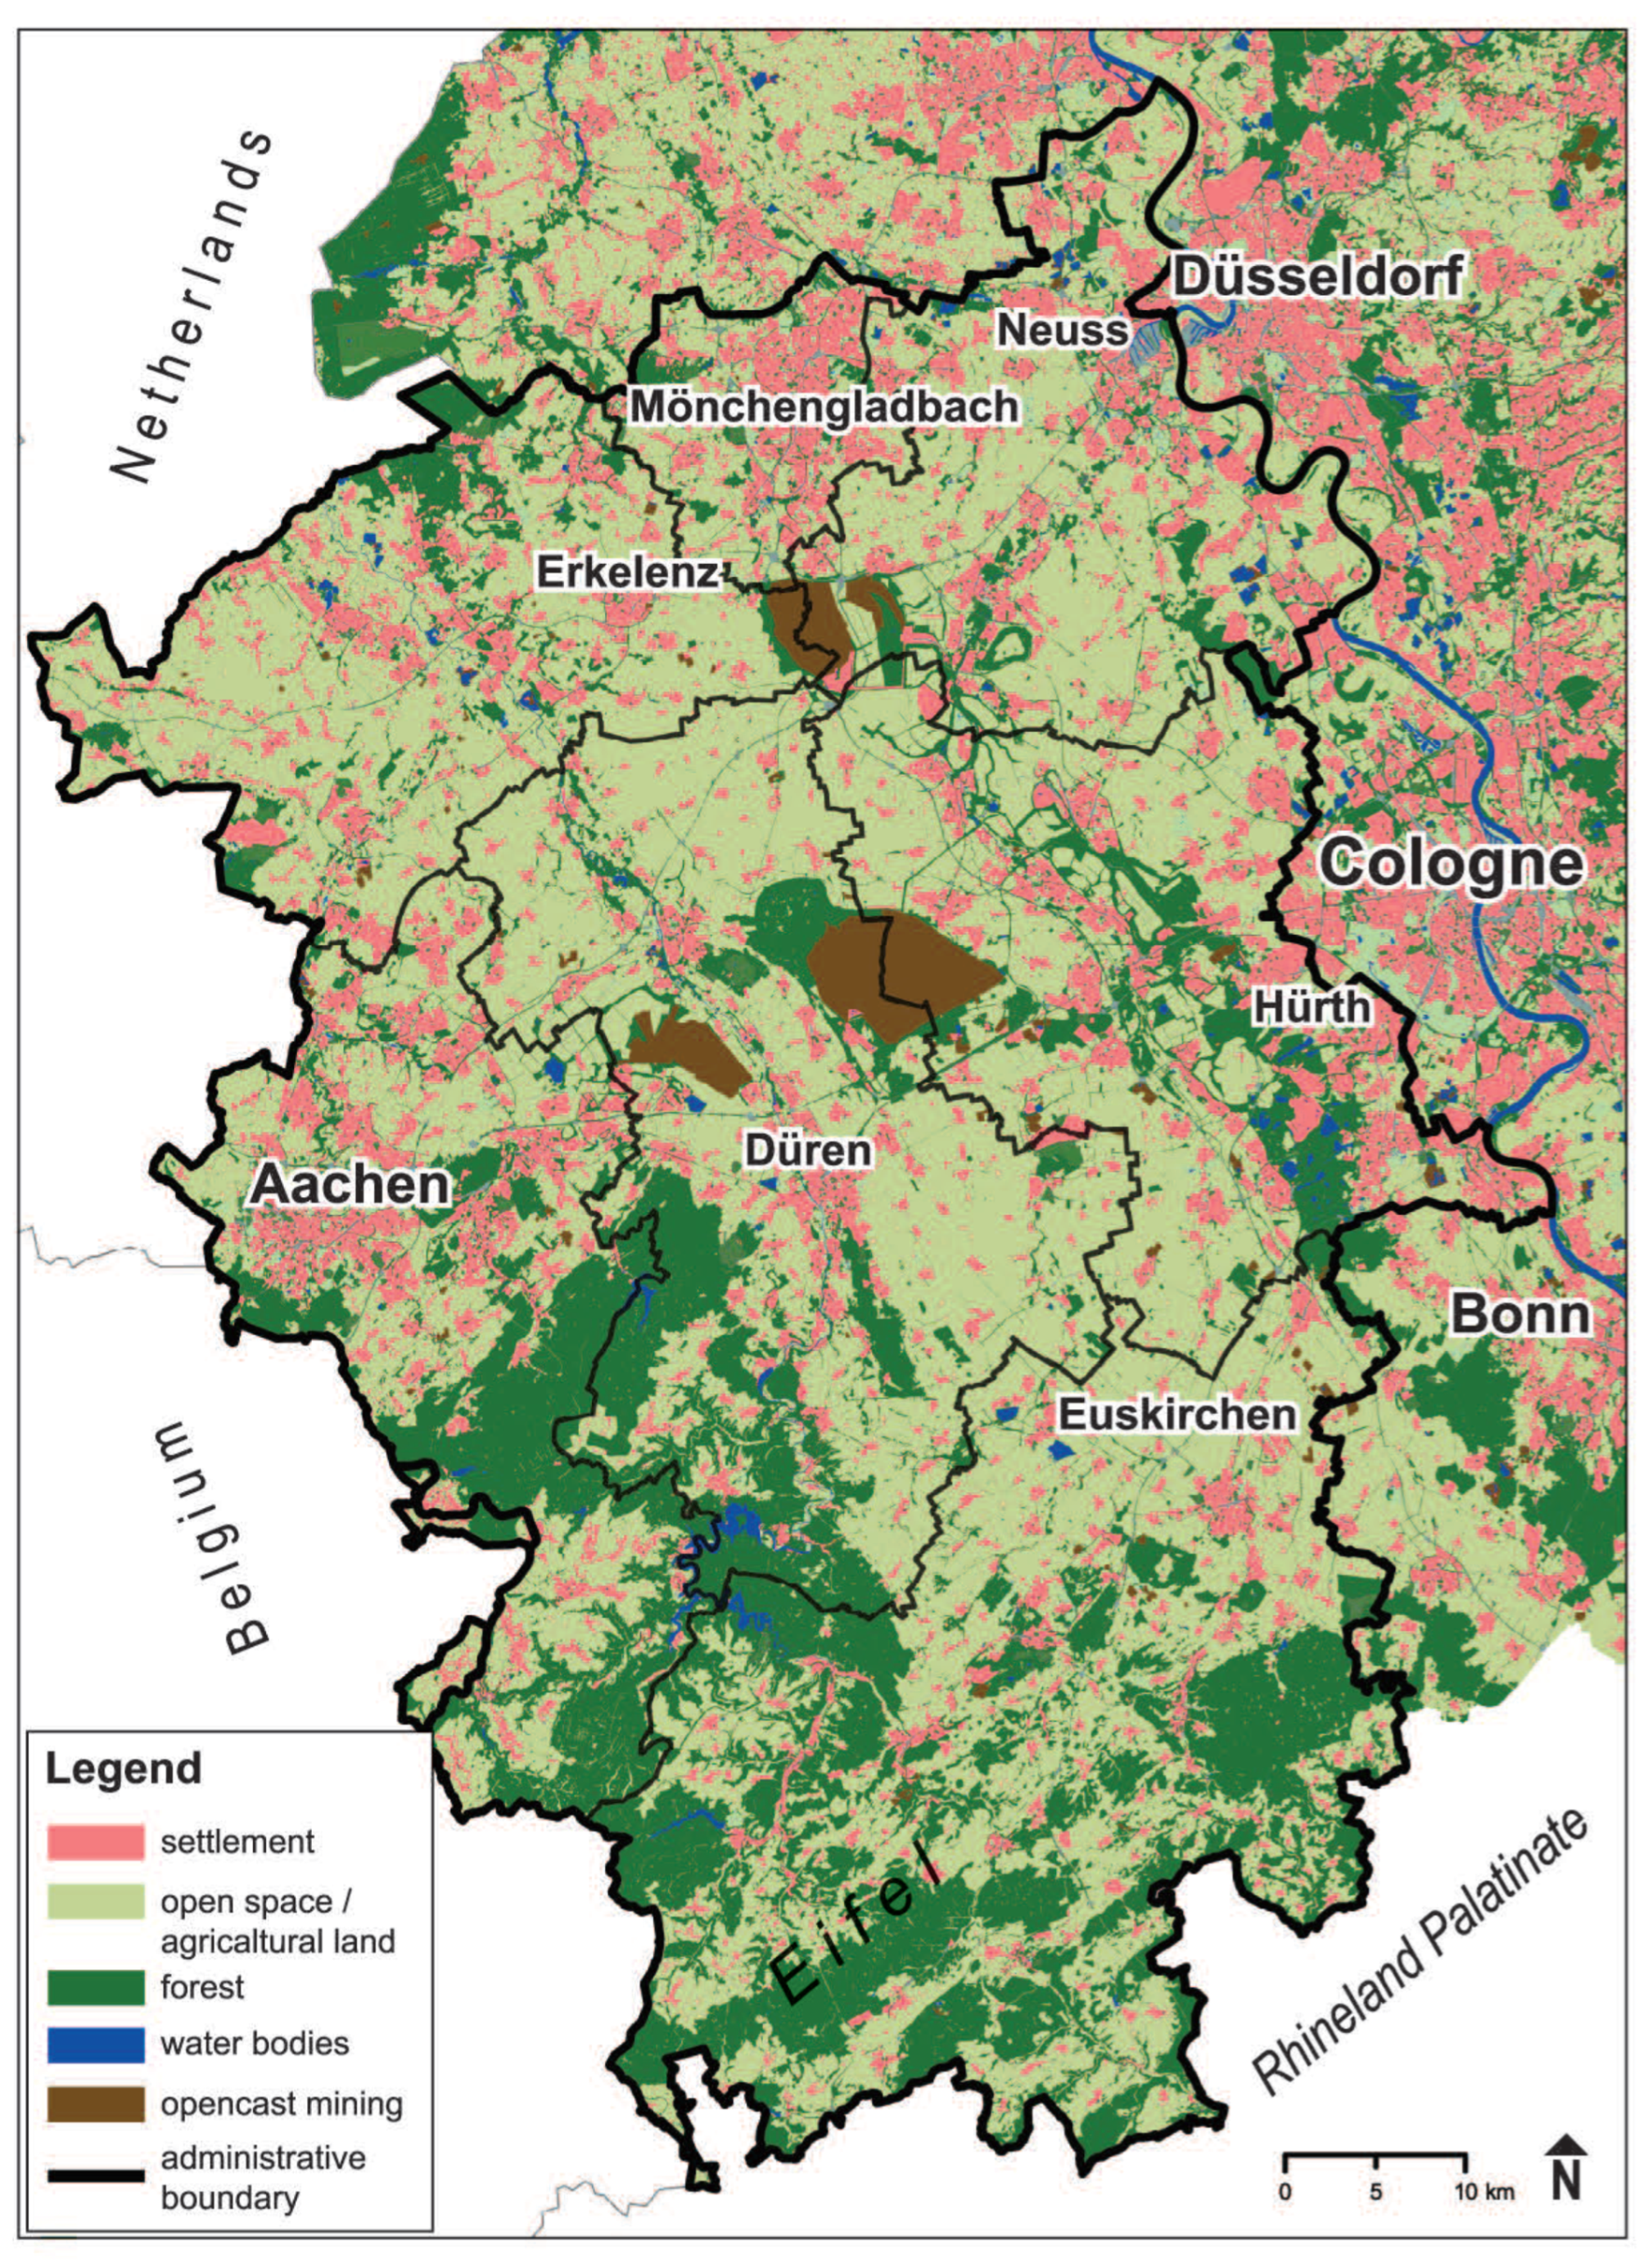
The Rhenish lignite mining region is in the west of Germany in the federal state of North Rhine-Westphalia (NRW), Germany’s largest opencast lignite mining area and one of the largest in Europe. The region is shaped by a few larger cities, medium-sized centres, small towns, and numerous villages (See
Figure 1). Despite the rather small-scale settlement structure the region is not rural at all, but an area formed by the fringe of conurbations, which is coming under pressure from the population growth in the cities (Aachen, Cologne and Bonn). The spatial structural changes in the Rhenish mining region due to surface lignite mining development led to major challenges and opportunities for sustainable village, neighbourhood, open space, and urban development [
17]. As a result of the long-standing coal and lignite mining, many energy-intensive industries have settled in the region, such as the chemical, paper and plastics industries, aluminium, and copper production, as well as the processing and food industries [
16,
17]. The upcoming structural change requires that the jobs lost due to the end of lignite mining be compensated as the demand for high-quality housing and new commercial and industrial areas continues. This is creating land competition that can only be sustainably resolved across the different spatial levels when future trends are considered. The strategic orientation of the Rhenish mining region towards a pioneering role for the initiation of the resource turnaround in Germany offers great opportunities for jobs and value creation in addition to the realisation of ecological sustainability goals [
17]. To govern these challenges, the regional development agency of the Rhenish lignite mining area (Zukunftsagentur Rheinisches Revier, ZRR) has been commissioned which comprises the territorial units of the counties of Düren, Euskirchen, Heinsberg, the Rhein-Erft-Kreis and the Rhein-Kreis-Neuss, the Städteregion Aachen and the City of Mönchengladbach (see
Figure 1).
The challenges of structural change do not occur separately from other challenges within the Rhenish mining region. Thus, a demographic change is taking place which is characterised by a simultaneity of growth impulses radiating from the metropolis of Cologne and shrinkage in the peripheral parts of the region in the Eifel as well as an overall aging society. This not only creates growing problems for the provision of services of general interest, but also demands on space and infrastructures.
The Rhenish lignite mining area has several locational advantages compared to other lignite mining regions. With Aachen and Mönchengladbach, two major centres belong to the region and the proximity to the centres of the neighbouring Rhineland (Bonn, Cologne, and Düsseldorf). Its location within the border triangle with the Netherlands and Belgium also offer opportunities for the region. The infrastructure, supply and transport connections are good, but the upcoming transformation process must also include the new challenges in terms of infrastructure and be adapted accordingly. The region can build on its strong economic structure. In addition to the energy industry and the energy-intensive industries, this includes, for example, companies in the areas of resource efficiency, mobility and logistics, the digital economy and agriculture. There are numerous starting points for creating new innovative, climate-neutral, and resilient structures. These include, for example, the re-use of power plant sites, the creation of new multifunctional landscapes and/or lakescapes, new model neighbourhoods, new value creation in the bioeconomy, digitalisation, suitable transport infrastructures, and the expansion of climate-neutral mobility in rural areas. These developments could help to better connect the region with the surrounding countryside, to overcome distances more easily, to better link urban and rural qualities and, finally, to create climate-adapted and resilient structures for the future [
18].
The landscape and open spaces of the Rhenish mining region each have a different effect on the regional climate conditions and on the urban climate. The extensive agricultural land acts as cold air production areas and can have a positive effect on the climate of the neighbouring settlements. According to the LANUV climate information system and the explanatory technical report [
19], cold air outflows from the Eifel towards the Rur River and from the Jülich-Zülpicher-Börde towards the Erft River are of regional importance. The forest areas of the region act as fresh air production areas. During the day, the forests are cooler than their surroundings and can serve as climatic recreation areas on hot days (days with a maximum air temperature of ≥30 °C). Water areas have a similar function with an overall balancing effect, cooling during the day and releasing heat at night. The numerous smaller and larger watercourses act as cold air channels, which supply fresh and cold air to the settlements and thus contribute to the climatic balance in the settlements. The larger settlement areas in towns and cities are to be regarded as heat islands, because buildings and sealed areas heat up more than vegetated areas, store heat and release it again at night. During climate change, a strong increase in hot days and tropical nights (with a minimum air temperature ≥ 20 °C) is expected, which will further promote inner-city heating and affect previously unaffected settlement areas. Against this background, cold and fresh air production areas gain new importance [
19,
20]. Beside the projected rise in temperature, the region is also affected by other climatic impacts and extremes which pose major challenges for the region, as tragically demonstrated by the heavy rainfall in July 2021, which led to catastrophic flooding [
21]. The rise in temperature will also lead to a higher risk of forest fires and droughts in the Rhineland region and thus increase the need for sustainable use of water resources. This will also affect the major rivers such as the Rhine and the Erft and lead to increasing low water problems and to changed flood regimes [
22,
23]. The region has not only contributed and still contributes with an annual production volume of 90 million tons of lignite coal to climate change for more than a century [
24], but is already and will be affected by the impacts of climate change.
Considering all these challenges in an integrated way is probably one of the greatest strategic challenges for the region. Against the current backdrop of change processes in the region, there is a window of opportunity to address this. Therefore, we follow a concept to promote an integrated approach to climatic and structural change, which is addressed in the present climate impact assessment and its underlying methodology.
3. Methodology
In the following section, the underlying methodology of the climate impact analyses carried out is described. For this purpose, it is necessary to first introduce the essential terminology of the method and to emphasize the role of scenarios as well as the parallel modelling of climate and socioeconomic variables.
3.1. Climate Impact Assessments (CIAs)
Climate change adaptation actions need a reliable data basis. Climate impact assessments (CIA) are therefore important prerequisites for the development of adaptation strategies: they identify which regions or sectors are particularly affected by climate change and where adaptation is especially needed [
9,
25]. To cope with the challenges of climate change, it is important to agree on and define the methodological framework, the key terminology, and the outcome of the assessment which is dealing with the possible impacts [
9,
25]. Corresponding studies show that there are still existing incongruities in vulnerability concepts, analyses, and assessments, both on a terminological and on a conceptual level [
26,
27]. This concerns, for example, the reference to place or scales of analysis, key components of vulnerability, involvement of stakeholders or, for example, dealing with uncertainty [
26]. This is also linked with the evolution of assessments dealing with climate impacts. Within the evolution (see [
27,
28,
29]) the approach and its definitions have been changed from a vulnerability approach [
1,
30] to a risk-based approach as currently used by the IPCC [
2,
3].
The framework of the CIA used within this article follows the IPCC’s understanding of vulnerability and is based on the German Federal Environment Agency’s (FEA) Guidelines for Climate Impact and Vulnerability Assessments [
25] and visualised in
Figure 2.
In contrast to the IPCC’s current risk approach, a vulnerability approach for the present assessment was chosen. This was particularly done because, compared to the risk approach of the IPCC (2014), the application of the vulnerability understanding of the IPCC (2007) avoids the problem of having to determine probabilities of occurrence for climatic and socio-economic developments [
29]. In comparison to the framework of the FEA, the result or output of the CIA is also not the vulnerability but the climate impact, as the adaptive capacity was not considered in the framework of the CIA. This is due to two reasons: First, the identification and especially the projection of adaptive capacity is very complex, and the projection already assumes actions that must first be identified and politically chosen. Second, spatial planning, as a primary actor in climate adaptation, is an essential component of adaptive capacity on its own since the spatial distribution of assets and values by land-use plans also has a direct influence on the (sub-)components ‘exposure’ and ‘sensitivity’.
The climate impact results from the intersection of climate stimuli and sensitivity (
Figure 2). The climate stimuli indicate the expression of a certain climatic parameter at a specific time at a defined location. For example, the average number of hot days per year per grid cell or aggregated on spatial divisions. Sensitivity describes the degree to which a social, ecological or economic system reacts to a specific climate stimulus. This depends on the characteristics of a system as well as its exposure to climate stimuli. Compared to the framework used in the guideline of the FEA there is no distinction between exposure and sensitivity, since both are combined within the sensitivity component.
Two principles are of key relevance in our methodological approach. First, projections are not only used for climate change, but also for the socio-economic changes that have a significant influence on sensitivities. Second, for both components, a future state is not assumed, but rather the possibility range for the future is shown by creating two scenarios and combining them into a scenario corridor of possible futures. These principles are explained in more detail in the following subsections.
3.2. The Parallel Modelling of Climate Stimuli and Sensitivity
The CIA approach follows the so-called ‘Parallel Modelling Approach’ [
10] which emphasises the importance of considering dynamic vulnerabilities or sensitivities. Many current CIAs assume that the climate is changing, but that the vulnerability and sensitivity of the system remains static. The result of these assessments cannot be a reliable basis for adaptation measures since, in addition to climate change as a driver of altered climate stimuli, non-climatic drivers (e.g., land use change, demographic change) can also have an impact on sensitivities, exposures and thus on vulnerabilities, and can significantly influence them [
2,
29,
30,
31]. Therefore, it is unavoidable to take the dynamics of the sensitivity into account. Considering the status quo for the future can lead to maladaptation and failed planning directions [
32]. Trends such as demographic change with its facets of ‘ageing’, ‘shrinking’, and ‘heterogenization’ illustrate very clearly why it is particularly relevant to consider socio-economic changes in the context of climatic changes. Some studies assume that the change in non-climatic factors in the future may even have a greater influence on climate impacts than climate change itself [
2,
33]. The Report on Germany’s Vulnerability to Climate Change in 2015 pointed out quite appropriately that every projection of sensitivity, no matter how uncertain, increases the confidence of the statements on future climate impacts, since they must be wrong if they are based on the status quo of the socio-economic systems [
34,
35], using the example of the German city of Ludwigsburg, that cities and urban planning in general can influence the demographic structure and therefore future vulnerability [
35]. This parallel modelling of climate and socio-economic factors was also published with examples from Germany in [
10]. The mentioned examples also demonstrate quite clearly why it is important to look at the socio-demographic future in the context of climate change on different levels. There may be interactions between the development of climatic parameters and socio-demographic variables, which should be considered to adapt successfully. Ref. [
36] also illustrates well that demographic factors, and in particular their change over time, have a significant influence on the management of natural hazards and thus on the challenges of climate [
36].
The integrated consideration of socio-economic and climatic changes within the framework of a CIA not only leads to an improved knowledge base and thus more well-founded results on which measures can be based, but also to the possibility of considering interactions between the different developments in terms of synergies and conflicts. For example, the ageing of the population leads to an increase in the proportion of particularly sensitive population groups, who are much more sensitive to heat stress, thus increasing vulnerability [
37]. As [
38] stated, “[…] ignoring society aging may lead to underestimated climate change risks” [
38] (p. 1).
3.3. The Role of Scenarios for CIAs
Statements about future climate are associated with great uncertainties, as the results are based on model assumptions that can always change. For example, ref. [
39] note that in the report of Working Group 1 of the 5th IPCC Assessment Report 2013, the word uncertain and its derivatives (e.g., uncertainty) occur more than 2200 times, which corresponds to an average of 1.5 times per printed page [
39].
The fact that climate projections are given in ranges that refer to the representative concentration pathway scenarios (RCPs) lead directly to the assumption that there is no single future state of the climate. Rather, it is common to map the climatic futures using a range of projections, or even to convert them into possible future scenarios that follow an RCP scenario but choose different percentiles. However, as already shown by the parallel modelling approach, it is not only necessary to consider the climate in the future, but also the future characteristics of the system that could be affected by it. Consequently, several possible futures are needed, which are transferred into scenarios along with the climate projections. The consideration of scenarios, especially for non-climatic factors, is significant in the literature and demonstrated not at least by the example of the IPCC’s Shared Socioeconomic Pathways (SSPS) [
33,
40,
41,
42,
43]. The climate projections as output of climate ensembles can be used for scenario-building, since good scenarios include projections [
44]. This is especially the case for socio-economic forecasts, which are known not to provide any punctual information. Again, the use of bandwidths of potential future conditions can promote acceptance and a more targeted selection of interventions. The familiar example of ‘no-regret’ measures is particularly beneficial if they are oriented towards the upper edge of the corridor, i.e., towards the worst case.
In addition to taking socio-economic scenarios into account, it is important to merge them with the climatic scenarios and, on this basis, to indicate a scenario corridor of possible future developments. On this basis, a decision can be made on which edge of the scenario corridor the adaptation options should be oriented. Ref. [
45] has accurately stated that in a scenario-based approach, the objectives of the analysis and the selection of the scenarios are first normatively set to then determine the factual situation. Based on this analysis, a planner can then exercise the assessment prerogative by deciding whether the planning specifications should be based on the upper edge of the possibility space (‘worst case’) or on a moderate development [
45]. In probabilistic risk calculation, a frequency-magnitude function is usually derived from time series, which are often based on observations from the past. In this respect, approaches to managing the consequences of today’s climate can be described as ‘decisions under risk’ (according to [
46]). However, the reaction to a possible future climate change, which can be determined in its concrete spatio-temporal manifestation and not via probability statements, cannot necessarily be grasped in this way. So, the term ‘decisions under deep uncertainty’ (according to [
46]) should be used in the context of a future climate change [
29,
47,
48].
4. Data
The data preparation and analysis were carried out in the ArcGIS programme, to provide the results in descriptive maps as a further working and decision-making basis for the planning processes of local actors and stakeholders.
4.1. Overview of Indicators Used
Since the impacts of climate change affect almost all sectors of society, a set of indicators was developed to cover the diversity of these impacts. The aim was not a comprehensive but an actor-oriented approach, adapted to local challenges. First, a pre-selection of indicators was made based on an internal project discourse with special consideration of the requirements and needs of the joint project partners. In addition, it was possible to refer to the existing climate change prevention strategy of the neighbouring Cologne/Bonn region, which has already been applied as a practical aid regionally since 2019 [
49]. Finally, two workshops were held with selected experts from relevant fields as well as federal and state institutions.
The aforementioned climate impact assessment was applied to the Rhenish lignite mining area with a total of eight indicators, which can be classified into three different fields of action: ‘living’, ‘infrastructures’, and ‘open spaces’.
Table 1 provides an overview of the applied indicators, the assigned field of action, and the proxy indicators used for the components’ climate stimuli and sensitivity. All fields of action are directly related to the challenges of structural change and the associated transformation process in the region.
For each indicator, the current data basis was first collected and then coordinated and completed with the actors and stakeholders involved. This included a review of the existing data to determine whether forecasts and projections were available and whether the data was available for both the present and the future, to enable the creation of scenarios. The premise here was the use of existing and freely available data sets for the climate stimuli and sensitivity components. In the following, the data basis used for the time-consistent determination of the climate impact and its components as well as the underlying calculations are explained using the example indicator for ‘heat stress of the population’. The selected indicator shows hot spots at the municipal level of the Rhenish lignite mining area in which a comparatively high heat stress for the population currently exists and is to be expected in the future by linking the climate stimulus of the hot days with a weighted sensitivity value of the inhabitants.
4.2. Climate Stimuli
In order to determine the climate stimulus, data from the State Office for Environmental and Consumer Protection of the Federal State of North Rhine-Westphalia (LANUV NRW) were used. There, data from the EURO-CORDEX-project [
50], which are available to the German Weather Service (DWD), are processed and made available on request. On this basis, data sets could be used for both the present and the future, including RCP scenarios. From this data set, the number of hot days for the period 1971–2000 could be used as representative of the current situation. It should be noted that the selection of the period 1971–2000 for the present is since the climate data for the future always refer to this reference period at the time of data acquisition. For the future, values from the RCP 8.5 ensemble results were used. The advantage of the climate ensemble results lies in the fact that they are available in different bandwidths or the division into percentiles. For the future, a range of possible climatic changes could be estimated by selecting the 15th and 85th percentiles. The time period of the climate data for the future refers to 2021–2050 in relation to 1971–2000. As a result, the ensemble outcomes for the individual indicators for the 15th percentile could be interpreted as a ‘moderate change’ scenario and for the 85th percentile as a ‘strong change’ scenario.
Initially, the absolute number of hot days was aggregated at grid levels (in the resolution of 1 × 1 km) using an area-weighted approach at the municipality level. An aggregated value of hot days at the municipality level could then be determined for both the present and the two future scenarios. The data were normalised using a min-max normalisation to transfer the values to a scale between 0 and 1 and thus prepare them for linking with the sensitivity. Since the socioeconomic data in this resolution were not available at the raster cell level but at the community level, all data sets had to be transferred to a common scale at municipality level.
On this basis, it is already possible to estimate where in the Rhenish lignite mining area a high degree of this climate stimulus can already be expected today and in the future. To relate the temporal development to the respective expression, a normalisation over the temporal level was carried out for each of the individual components. By normalising across all temporal levels and thus the entire value range, the results of all time periods are transformed to a scale between 0 and 1. This allows the expression of each time period to be put in relation to the others, and thus the temporal changes can be clearly visualised and communicated. Normalisation across all time levels was carried out for all components of the respective indicators.
4.3. Sensitivity
The appropriate representation of sensitivity remains a major challenge in climate impact research. Key questions that must therefore be answered within the framework of a climate impact assessment concern the extent to which each resource/receptor is sensitive to which stimuli and at what point in time. These questions were answered for each indicator within the framework of the assessment presented here. Various population groups are known to respond differently to climate stimuli. When considering heat-related climate impacts, age is often used as a key factor for determining the sensitivity [
51,
52,
53]. For example, older or very young people are more sensitive to heat stress due to their physiological characteristics [
54]. However, the importance of socio-economic status or living and working conditions in general for heat vulnerability, morbidity and mortality should not be negated by our selection (e.g., [
55]).
In the context of determining the sensitivity of the population to heat stress, it was possible to access age-related population data from the statistical office of the federal state of North Rhine-Westphalia. The database provides population data at the level of age years both for the base year 2018 and a population projection for the year 2040 and thus can be used to create own cohorts for each time slice. For the present assessment, the assumption is made that both older and younger people are particularly sensitive to heat stress. Therefore, the total number of inhabitants was transferred into cohorts, which enabled a differentiated representation of sensitivity to be drawn. When spatially calculating population data, not only the absolute number of inhabitants should be used, but this should also be combined with the relative distribution. An exclusive consideration of both absolute and relative statements can lead to significant distortion. Therefore, the calculation also included proportional values of inhabitants per hectare of residential area. The cohorts are weighted for age-related heat sensitivity based on studies of heat stress mortality rates [
53,
56,
57,
58] according to the following formula:
According to this formula, the classic focus is not only on the very young or very old population, but the entire population is considered differently according to its age structure. A special feature, for example, is the explicit consideration of the age group of 6–64-year-olds, who, according to recent surveys, feel particularly affected by heat stress [
59,
60]. As a result, more detailed statements on the sensitivity to heat stress can be visualised at the level of the municipalities, which consider the differentiated sensitivity of certain age cohorts as well as their absolute and relative distribution within residential areas.
For the socio-demographic future, it was not possible to refer directly to generally available projection data. The development of the population at municipal level and differentiated according to different age cohorts based on the population forecast of the State Office for Information and Technology (IT.NRW) could be used [
61]. Since the population projection only provides information on the total population for the target year 2040, a differentiated evaluation was not carried out due to the lack of data. Instead, this data was used to generate assumptions about future land-use development. This was prepared under two different assumptions, so that the future land demand resulting from the population development could be determined quantitatively. The first scenario ‘internal development’ assumes that 50% of the land demand determined from the population development would be covered within existing built-up areas, and the remaining 50% would be allocated in newly designated building areas. The second scenario ‘external development’ assumes that 75% of the demand would be met by new construction and only 25% by existing structures. The scenario of increased internal development is classified as climatically ‘strong change’ and the scenario of increased external development as climatically ‘moderate change’ since a densification of already built-up areas is considered as trigger for urban heat stress. In general, our classification is not to be understood in a judgmental way, as an increased external development must always be considered qualitatively from a climatic point of view (e.g., the obstruction of cold air corridors or reduced retention capacity of the peri-urban areas). As a result, a scenario corridor was created for the sensitivity that considers not only the absolute number of population developments but also their change in age structure and the resulting demand of residential areas. In order to merge the sensitivity component with the climate stimulus component, the calculated values were also normalised across all time levels and scenarios.
4.4. Climate Impact
The climate impact was calculated by linking the normalised values for the sensitivity with the climate stimuli. The linkage was carried out multiplicatively, as we follow the assumption that no climate impact can be assumed if one of the two parameters equals zero. The scenarios for the climate stimuli as well as the sensitivity were then merged for the different indicators so that statements on the climate impact could be made for both the assumptions of a strong and a more moderate change.
5. Results
The results of the climate impact analysis follow the triad of Climate Stimuli, Sensitivity and Climate Impact already described under Data and Methodology.
5.1. Climate Stimuli and Scenarios
The intensity of hot days is differentiated in the Rhenish lignite mining area. For example, the current hot days are much more frequent in the eastern part of the region along the Rhine River than in the more predominantly rural parts of the Eifel. This east-west and north-south gradient will continue to develop in the future, both under the assumptions of a moderate and a strong change. Especially when comparing the status quo with the moderate change, it is obvious that even under the assumptions of a less severe change, there will be a significant increase in hot days in the parts of the region that are already stressed today. This is made very clear by the characteristics under the assumptions of a strong change. In the overall view, it should also be emphasized that the impact along the Rhine, for example, is already greater today than it will be in the southern Eifel region under the assumptions of a strong change (see
Figure 3).
5.2. Sensitivity
The sensitivity component shows a rather differentiated picture of the region. In the present as well as in the future, the densely populated cities of Aachen and Mönchengladbach show the highest sensitivity. The municipalities of the conurbation fringe along the Rhine River are also already significantly more sensitive to the heat stress of the population compared to, for example, the municipalities of the County of Euskirchen except for the city of Euskirchen itself. Viewed over time, two specific effects lead to an increase in sensitivity in parts of the region. On the one hand, demographic change and the associated ageing processes of the population leads to an increased sensitivity to heat stress overall. On the other hand, the projected population increase, especially along the conurbation fringe, also leads to an increased sensitivity. The municipalities along the Rhine can be observed to have a higher sensitivity to heat stress, both in the present and in the future, than, for example, municipalities in the County of Euskirchen (see
Figure 4).
5.3. Climate Impact
The figures of the climate impact complete the image of the differentiated impact in the Rhenish lignite mining area that was already drawn in the description of the stimuli and sensitivity components. At the present time, the impacts are comparatively low; only the larger cities such as Aachen and Mönchengladbach, as well as other large and medium-sized cities along the conurbation fringe such as Neuss and Hürth already have a high impact today. Assuming moderate change in the future, this image will further differentiate. The densely populated cities continue to be strongly affected and some municipalities in the northern part of the region will also be more affected. The City of Düren is also strongly affected in this future scenario. Under the assumptions of a strong change, the north-south and east-west gradients will become even more visible. The most pronounced change across all time periods is expected in the cities of Neuss and Mönchengladbach, followed by Aachen, Hürth and Düren. In contrast, the County of Euskirchen is comparatively less affected due to its rather sparsely populated and rural structures, which barely change over time. Here it should be emphasised that some areas are currently more affected today than others will be in the future scenarios. Consequently, a corresponding need for adaptation and action can already be derived for the present (see
Figure 5).
The results of our study show the clear influence of sensitivity to global warming and increase in heat days on the corresponding climate impact. In terms of negative effects, this also applies to other sectors such as agriculture, forestry, and tourism. Positive effects of climate change on summer tourism or viticulture, for example, are also possible. These results can be used by spatial planning in the management of structural change, particularly to differentiate between action areas and to develop and implement spatially specific adaptation measures accordingly, especially for hotspots.
6. Discussion
Any spatial development strategy should be based on sound evidence [
62]. This is also a truth for local adaptation processes [
52,
63,
64]. In addition, the relevant European framework directives require continuous monitoring of unforeseen environmental impacts [
65,
66]. Structural change is an interdisciplinary topic in the practice of regional and municipal planning that requires the coordination and cooperation of the economy, society, administration, politics, and science. The inclusion and close cooperation of all actors involved makes it possible to integrate the expertise of different disciplines in the transformation process and to achieve balanced goals and strategies for sustainable land management [
67]. The main addressee apart from the DAZWISCHEN project itself is the ZRR which currently prepares a regional development strategy for the entire region [
68]. For this purpose, the results of the CIA qualify the analytical basis for the planning teams currently developing regional spatial visions on behalf of the ZRR. The authors had the opportunity to present their findings to the planning teams and to discuss fields of application. These give more than a mere consideration of areas that are to be kept free of development due to their climatic significance. One field of application is also the differentiated handling of densification from the urban perspective, both in terms of health impacts due to overheating and the need to adapt to heavy precipitation events.
A comprehensive understanding of the relationship between economic, environmental, and social conditions is essential for sustainable structural change. This includes proper knowledge on the interactions between different aspects of structural change and environmental impacts, such as climate change [
12,
69]. Against the background of long planning periods, the persistence of built infrastructures as well as the upcoming complex challenges, structural change must prepare for the expected consequences and impacts of climate change at an early stage and take these into account in the planning and transformation process. The presented paper proves the importance of a parallel modelling approach for identifying the potential range of future conditions and thereby contributes to a better understanding of the interconnected climatic and societal changes. The way climate impacts are communicated must also be tailored to the needs and experiences of stakeholders [
70].
Considering the diverse land capacities that arise from the abandonment of opencast mining sites, the question must not only be asked about the role of these areas for climate protection, but also how these areas can be used to adapt to local climate impacts. The design of new landscape parks and the planned conversion with large water bodies as lakescapes are often promoted as a promising way of enhancing the value of the area and is seen as a motor for positive structural change. However, the development of such a landscape must be planned and implemented against the background of climatic changes. As the results of the climate impact analysis for the Rhenish mining region show, there will be a significant increase in heat stress in the future and thus also a change in the water balance. On the one hand, this raises the question of where the water to fill the new lakes is to come from, when in summer low water levels are already increasingly being observed in the catchment areas. On the other hand, questions arise about ensuring the quality and quantity of the existing and planned water bodies.
Nevertheless, in view of climate change and the associated shifts, the climatic functions of open spaces and water bodies are of great importance. The protection and strengthening of exchange pathways (e.g., significant biotopes, fresh/cold air corridors) and the provision and design of recreation and climatic compensation areas around the heat-affected settlement areas appear to be particularly important. There is a need for action, on the one hand, to secure existing climate-relevant areas and structures, and, on the other hand, to consistently take climate aspects into account in all future land developments. This shows the importance of climate impact analysis in a structural change. In addition to major regional land-related developments, it is also a matter of shaping structural change in the neighbouring and surrounding municipalities in a sustainable way. For example, the temporary loss of jobs and the migration of energy-intensive production and supplier companies for the mining industry are major challenges but also offer opportunities. This is because structural change creates areas of possibilities that can meet the challenges of climate change.
The ecosystem services, which are mainly provided by the rural south of the region, serve particularly to make the urban climate of the urban core areas bearable by securing cold air volume flows. Finally, the protection of cold air production areas and air guiding paths restricts the development of settlements in rural areas to maintain good living conditions in urban areas. In this context, a balancing of burdens and benefits between rural and urban areas should be discussed in the context of a regional development strategy.
7. Conclusions
Regarding research question one, our contribution has demonstrated the relevance of a climate impact analysis for the management of structural change. The interactions between the foreseeable as well the desired land-use changes and the regional climate are evident and are to be seen as an important framework condition for any development strategy. That is why the upcoming informal spatial strategy of the ZRR considers climate change adaptation as an important element and is going to explore the implications of different development pathways.
Using an example indicator on heat stress of the population, we have addressed research question two and shown how important is the consideration of scenario corridors for structural changes such as land use and population change for a consistent climate impact analysis. This fundamental insight is not put in question by the shortcomings of the old and outdated time slice of 1971–2000 as a reference period. Other appropriate data were simply not available at the time of data acquisition. Nonetheless, these scenario corridors enable decision-makers not only to select a certain scenario pathway, but also to take decisions based on the precautionary principle that considers a worst-case scenario.
However, the chosen procedure of making values on different scales comparable by means of a normalization is very suitable for identifying intraregional differences. This evidence base can be used to identify priority areas for adaptation measures within the region and subsequent funding priorities. Moreover, it supports decision-makers to identify eco-system services which are crucial for stabilizing the urban climate.
At the same time, the normalization allows only relative statements of the municipalities among each other. This is also true for all indicator-based approaches in general, as the findings are not easily transferable to other spatial scales. Thus, for intra-municipal decisions, for instance, in urban land use planning, a higher-resolution investigation is required that focuses on the absolute climate impacts and presents the results on a grid cell basis.
The approach we used in this study is in principle transferable to other regions. The fact that we have limited our analysis to free and freely available data sets increases the transferability. In addition, the detailed documentation of the method as well as the
supplementary material allow a step-by-step reproduction of the analysis and its results. Individual improvements could already be identified during the analysis. In order to represent the heat stress indicator more adequately, the number of tropical nights should be taken into account. Even though the probability that a hot day is followed by a tropical night can be considered high, the additional consideration of the proxy indicator leads to an improved data basis. Furthermore, the consideration of an additional population projection can also improve the estimation of future sensitivity and thus the scenarios. Based on this, a moderate and stronger development of the population could also be assumed and then transferred into a differentiated demand for land.
Author Contributions
Conceptualization, D.B. and F.J.O.; methodology, D.B., F.J.O. and S.G.; software, D.B. and F.J.O.; validation, D.B. and F.J.O.; formal analysis, D.B. and F.J.O.; investigation, D.B. and F.J.O.; resources, D.B. and F.J.O.; data curation, D.B. and F.J.O.; writing—original draft preparation, D.B.; writing—review and editing, D.B. and F.J.O.; visualization, D.B. and F.J.O.; supervision, D.B. and F.J.O.; project administration, D.B., F.J.O. and S.G.; funding acquisition, S.G. All authors have read and agreed to the published version of the manuscript.
Funding
This research is funded from 2020–2023 by the Federal Ministry of Education and Research (BMBF) within the framework of the Stadt-Land-Plus funding programme under the grant 033L217 (German BMBF Funding Activity Urban-Rural).
Institutional Review Board Statement
Not applicable.
Informed Consent Statement
Not applicable.
Data Availability Statement
The data presented in this study are available on request from the corresponding author.
Acknowledgments
This paper is based on results of the project DAZWISCHEN (Future-oriented structural change in the Rhenish lignite mining area).
Conflicts of Interest
The authors declare no conflict of interest.
References
- Intergovernmental Panel on Climate Change. Climate Change 2007: Synthesis Report. In Contribution of Working Groups I, II and III to the Fourth Assessment Report of the Intergovernmental Panel on Climate Change; Core Writing Team, Pachauri, R.K., Reisinger, A., Eds.; IPCC: Geneva, Switzerland, 2007. [Google Scholar]
- Intergovernmental Panel on Climate Change. Climate Change 2014: Impacts, Adaptation, and Vulnerability. In Part A: Global and Sectoral Aspects. Contribution of Working Group II to the Fifth Assessment Report of the Intergovernmental Panel on Climate Change; Field, C.B., Barros, V.R., Dokken, D.J., Mach, K.J., Mastrandrea, M.D., Bilir, T.E., Chatterjee, M., Ebi, K.L., Estrada, Y.O., Genova, R.C., et al., Eds.; Cambridge University Press: Cambridge, UK; New York, NY, USA, 2014. [Google Scholar]
- Intergovernmental Panel on Climate Change. Climate Change 2021: The Physical Science Basis. In Contribution of Working Group I to the Sixth Assessment Report of the Intergovernmental Panel on Climate Change; Masson-Delmotte, V., Zhai, P., Pirani, A., Connors, S.L., Péan, C., Berger, S., Caud, N., Chen, Y., Goldfarb, L., Gomis, M.I., et al., Eds.; Cambridge University Press: Cambridge, UK; New York, NY, USA, 2021; in press. [Google Scholar]
- European Environment Agency. Urban Adaptation in Europe: How Cities and Towns Respond to Climate Change; EEA Report 12/2020; Publications Office of the European Union: Luxembourg, 2020. [CrossRef]
- European Environment Agency. Climate Change, Impacts and Vulnerability in Europe 2016: An Indicator-Based Report; EEA Report 01/2017; Publications Office of the European Union: Luxembourg, 2017. [CrossRef]
- Blöschl, G.; Hall, J.; Parajka, J.; Perdigão, R.A.P.; Merz, B.; Arheimer, B.; Aronica, G.T.; Bilibashi, A.; Bonacci, O.; Borga, M.; et al. Changing Climate Shifts Timing of European Floods. Science 2017, 357, 588–590. [Google Scholar] [CrossRef] [Green Version]
- Blöschl, G.; Hall, J.; Viglione, A.; Perdigão, R.A.P.; Parajka, J.; Merz, B.; Lun, D.; Arheimer, B.; Aronica, G.T.; Bilibashi, A.; et al. Changing Climate Both Increases and Decreases European River Floods. Nature 2019, 573, 108–111. [Google Scholar] [CrossRef] [PubMed]
- Bubeck, P.; Klimmer, L.; Albrecht, J. Klimaanpassung in der rechtlichen Rahmensetzung des Bundes und Auswirkungen auf die Praxis im Raumordnungs-, Städtebau- und Wasserrecht. Nat. Recht 2016, 38, 297–307. [Google Scholar] [CrossRef]
- European Environment Agency. National Climate Change Vulnerability and Risk Assessments in Europe, 2018; EEA Report 01/2018; Publications Office of the European Union: Luxembourg, 2018. [CrossRef]
- Greiving, S.; Arens, S.; Becker, D.; Fleischhauer, M.; Hurth, F. Improving the Assessment of Potential and Actual Impacts of Climate Change and Extreme Events Through a Parallel Modeling of Climatic and Societal Changes at Different Scales. J. Extrem. Events 2017, 04, 1850003. [Google Scholar] [CrossRef]
- Matsuyama, K. Structural change. In The New Palgrave Dictionary of Economics, 2nd ed.; Durlauf, S.N., Blume, L.E., Eds.; Palgrave Macmillan: Basingstoke, UK, 2008; ISBN 9780333786765. [Google Scholar]
- Bardt, H. Klima- und Strukturwandel: Chancen und Risiken der deutschen Industrie. In IW-Analysen; Inst. der Dt. Wirtschaft Köln Medien GmbH: Köln, Germany, 2011; p. 69. [Google Scholar]
- Bardt, H.; Hüther, M. Angebotsorientierte Umweltpolitik: Positionsbestimmung und Perspektiven. In IW-Positionen; Deutscher Instituts-Verl: Köln, Germany, 2006; p. 21. [Google Scholar]
- Skoczkowski, T.; Bielecki, S.; Kochański, M.; Katarzyna, K. Climate-change induced uncertainties, risks and opportunities for the coal-based region of Silesia: Stakeholders’ perspectives. Environ. Innov. Soc. Transit. 2020, 35, 460–481. [Google Scholar] [CrossRef]
- Haigh, M.J. Surface mining and the environment in Europe. Int. J. Surf. Min. Reclam. Environ. 1993, 7, 91–104. [Google Scholar] [CrossRef]
- Schulz, S.; Schwartzkopf, J. European Lignite-Mining Regions in Transition. In Challenges in the Czech Republic and Germany; Prague Office of the Heinrich-Böll-Stiftung and Deutsche Umwelthilfe in cooperation with EG3 and Glopolis: Prague, Czech Republic, 2018; ISBN 978-80-88289-04-3. [Google Scholar]
- Zukunftsagentur Rheinisches Revier GmbH (ZRR). Wirtschafts- und Strukturprogramm 1.1 für das Rheinisches Zukunftsrevier; ZRR: Jülich, Germany, 2021. [Google Scholar]
- Bundesministerium für Wirtschaft und Energie (BMWi). Kommission. In Wachstum, Strukturwandel und Beschäftigung. Abschlussbericht; BMWi: Berlin, Germany, 2019. [Google Scholar]
- Landesamt für Natur, Umwelt und Verbraucherschutz Nordrhein-Westfalen (LANUV). Klimaanalyse Nordrhein-Westfalen. LANUV-Fachbericht 86; LANUV: Recklinghausen, Germany, 2018; ISSN 1864-3930.
- Zukunftsagentur Rheinisches Revier GmbH (ZRR). Regionales Freiraumsystem Rheinisches Revier 1.0. Erfassung und Konzeption; ZRR: Jülich, Germany, 2019. [Google Scholar]
- Dietze, M.; Ozturk, U. A flood of disaster response challenges. Science 2021, 373, 1317–1318. [Google Scholar] [CrossRef] [PubMed]
- Umweltbundesamt (UBA). Climate Impact and Risk Assessment 2021 for Germany; Climate Change 27/2021; Umweltbundesamt: Dessau-Roßlau, Germany, 2021.
- Brasseur, Guy, Daniela Jacob, and Susanne Schuck-Zöller. Klimawandel in Deutschland: Entwicklung, Folgen, Risiken und Perspektiven; Springer Spektrum: Berlin, Germany, 2017. [Google Scholar]
- Bertenrath, R.; Bähr, C.; Kleissner, A.; Schaefer, T. IW-Gutachten Folgenabschätzung Klimaschutzplan und Strukturwandel in den Braunkohleregionen; Auftraggeber: Köln, Germany; Deutscher Braunkohlen-Industrie-Verein e.V. (DEBRIV): Köln, Germany, 2018. [Google Scholar]
- Buth, M.; Kahlenborn, W.; Greiving, S.; Fleischhauer, M.; Zebisch, M.; Schneiderbauer, S.; Schauser, I. Guidelines for Climate Impact and Vulnerability Assessments: Recommendations of the Interministerial Working Group on Adaptation to Climate Change of the German Federal Government; Umweltbundesamt: Dessau-Roßlau, Germany, 2017; ISSN 2363-832X.
- Soares, M.B.; Gagnon, A.S.; Doherty, R.M. Conceptual elements of climate change vulnerability assessments: A review. Int. J. Clim. Chang. Strateg. Manag. 2012, 4, S.6–S.35. [Google Scholar] [CrossRef]
- Klopfer, F.; Westerholt, R.; Gruehn, D. Conceptual Frameworks for Assessing Climate Change Effects on Urban Areas: A Scoping Review. Sustainability 2021, 13, 10794. [Google Scholar] [CrossRef]
- Füssel, H.-M.; Klein, R.J.T. Climate Change Vulnerability Assessments: An Evolution of Conceptual Thinking. Clim. Chang. 2006, 75, 301–329. [Google Scholar] [CrossRef]
- Birkmann, J.; Greiving, S.; Serdeczny, O. Das Assessment von Vulnerabilitäten, Risiken und Unsicherheiten. In Klimawandel in Deutschland: Entwicklung, Folgen, Risiken und Perspektiven; Brasseur, G., Jacob, D., Schuck-Zöller, S., Eds.; Springer Spektrum: Berlin, Germany, 2017; Volume 75, pp. 267–276. [Google Scholar] [CrossRef] [Green Version]
- Intergovernmental Panel on Climate Change. Managing the Risks of Extreme Events and Disasters to Advance Climate Change Adaptation. In A Special Report of Working Groups I and II of the Intergovernmental Panel on Climate Change; Field, C.B., Barros, V., Stocker, T.F., Qin, D., Dokken, D.J., Ebi, K.L., Mastrandrea, M.D., Mach, K.J., Plattner, G.-K., Allen, S.K., et al., Eds.; Cambridge University Press: Cambridge, UK; New York, NY, USA, 2012. [Google Scholar]
- Birkmann, J.; Schanze, J.; Müller, P.; Stock, M. Anpassung an den Klimawandel Durch Räumliche Planung: Grundlagen, Strategien, Instrumente; E-Paper der ARL Nr. 13; Akademie für Raumforschung und Landesplanung (ARL): Hannover, Germany, 2012. [Google Scholar]
- Jurgilevich, A.; Räsänen, A.; Juhola, S. Assessing the dynamics of urban vulnerability to climate change: Case of Helsinki, Finland. Environ. Sci. Policy 2021, 125, 32–43. [Google Scholar] [CrossRef]
- Birkmann, J.; Cutter, S.L.; Rothman, D.S.; Welle, T.; Garschagen, M.; van Ruijven, B.; O’Neill, B.; Preston, B.L.; Kienberger, S.; Cardona, O.D.; et al. Scenarios for vulnerability: Opportunities and constraints in the context of climate change and disaster risk. Clim. Chang. 2015, 133, 53–68. [Google Scholar] [CrossRef]
- Umweltbundesamt (UBA). Vulnerabilität Deutschlands Gegenüber dem Klimawandel; Climate Change 24/2015; Umweltbundesamt: Dessau-Roßlau, Germany, 2015; ISSN 1862-4359.
- Birkmann, J.; Sauter, H.; Garschagen, M.; Fleischhauer, M.; Puntub, W.; Klose, C.; Burkhardt, A.; Göttsche, F.; Laranjeira, K.; Müller, J.; et al. New methods for local vulnerability scenarios to heat stress to inform urban planning—Case study City of Ludwigsburg/Germany. Clim. Chang. 2021, 165, 37. [Google Scholar] [CrossRef]
- Clar, C. How demographic developments determine the management of hydrometeorological hazard risks in rural communities: The linkages between demographic and natural hazards research. WIREs Water 2019, 6, 9. [Google Scholar] [CrossRef] [Green Version]
- Haq, G.; Gutman, G. Climate gerontology: Meeting the challenge of population ageing and climate change. Z. Für Gerontol. Geriatr. 2014, 6, 462–467. [Google Scholar] [CrossRef] [PubMed]
- Lee, J.Y.; Kim, H. Projection of Future Temperature-Related Mortality Due to Climate and Demographic Changes. Environ. Int. 2016, 94, 489–494. [Google Scholar] [CrossRef] [PubMed]
- Lewandowsky, S.; Ballard, T.; Pancost, R.D. Uncertainty as Knowledge. Philos. Trans. R. Soc. A 2015, 373, 20140462. [Google Scholar] [CrossRef] [PubMed] [Green Version]
- Kriegler, E.; O’Neill, B.C.; Hallegatte, S.; Kram, T.; Lempert, R.J.; Moss, R.H.; Wilbanks, T. The need for and use of socio-economic scenarios for climate change analysis: A new approach based on shared socio-economic pathways. Glob. Environ. Chang. 2012, 22, 807–822. [Google Scholar] [CrossRef]
- O’Neill, B.C.; Kriegler, E.; Riahi, K.; Ebi, K.L.; Hallegatte, S.; Carter, T.R.; Mathur, R.; van Vuuren, D.P. A new scenario framework for climate change research: The concept of shared socioeconomic pathways. Clim. Chang. 2014, 122, 387–400. [Google Scholar] [CrossRef] [Green Version]
- O’Neill, B.C.; Kriegler, E.; Ebi, K.L.; Kemp-Benedict, E.; Riahi, K.; Rothman, D.S.; van Ruijven, B.J.; van Vuuren, D.P.; Birkmann, J.; Kok, K.; et al. The roads ahead: Narratives for shared socioeconomic pathways describing world futures in the 21st century. Glob. Environ. Chang. 2017, 42, 169–180. [Google Scholar] [CrossRef] [Green Version]
- van Ruijven, B.J.; Levy, M.A.; Agrawal, A.; Biermann, F.; Birkmann, J.; Carter, T.R.; Ebi, K.L.; Garschagen, M.; Jones, B.; Jones, R.; et al. Enhancing the relevance of Shared Socioeconomic Pathways for climate change impacts, adaptation and vulnerability research. Clim. Chang. 2014, 122, 481–494. [Google Scholar] [CrossRef] [Green Version]
- Glenn, J.C.; Gordon, T.J. Futures Research Methodology: Version 3.0; The Millennium Project: Washington, DC, USA, 2009. [Google Scholar]
- Greiving, S. Analyse- und Bewertungskonzepte für Risiken im Vergleich. Inf. Zur Raumentwickl. 2019, 46, 62–73. [Google Scholar]
- Laux, H. Entscheidungstheorie, 7th ed.; Springer-Lehrbuch: Berlin/Heidelberg, Germany, 2007; ISBN 978-3-540-71161-2. [Google Scholar]
- van Asselt, M.B.A. The complex significance of uncertainty in a risk era: Logics, manners and strategies in use. Int. J. Risk Assess. Manag. 2005, 5, 125–158. [Google Scholar] [CrossRef]
- Walker, W.; Haasnoot, M.; Kwakkel, J. Adapt or Perish: A Review of Planning Approaches for Adaptation under Deep Uncertainty. Sustainability 2013, 5, 955–979. [Google Scholar] [CrossRef] [Green Version]
- Region Köln/Bonn e.V. Klimawandelvorsorgestrategie für die Region; Praxishilfe: Köln/Bonn, Germany, 2019. [Google Scholar]
- Jacob, D.; Petersen, J.; Eggert, B.; Alias, A.; Christensen, O.B.; Bouwer, L.M.; Braun, A.; Colette, A.; Déqué, M.; Georgievski, G.; et al. EURO-CORDEX: New high-resolution climate change projections for European impact research. Reg. Environ. Chang. 2014, 14, 563–578. [Google Scholar] [CrossRef]
- Apreda, C.; D’Ambrosio, V.; di Martino, F. A climate vulnerability and impact assessment model for complex urban systems. Environ. Sci. Policy 2019, 93, 11–26. [Google Scholar] [CrossRef]
- Donner, J.; Müller, J.M.; Köppel, J. Urban Heat: Towards Adapted German Cities? J. Environ. Assess. Policy Manag. 2015, 17, 1550020. [Google Scholar] [CrossRef]
- Fouillet, A.; Rey, G.; Laurent, F.; Pavillon, G.; Bellec, S.; Guihenneuc-Jouyaux, C.; Clavel, J.; Jougla, E.; Hémon, D. Excess Mortality Related to the August 2003 Heat Wave in France. Int. Arch. Occup. Environ. Health 2006, 80, 16–24. [Google Scholar] [CrossRef] [PubMed] [Green Version]
- Kenney, W.L.; Craighead, D.H.; Alexander, L.M. Heat waves, aging, and human cardiovascular health. Med. Sci. Sports Exerc. 2014, 46, 1891–1899. [Google Scholar] [CrossRef] [PubMed] [Green Version]
- Reid, C.E.; O’Neill, M.S.; Gronlund, C.J.; Brines, S.J.; Brown, D.G.; Diez-Roux, A.V.; Schwartz, J. Mapping Community Determinants of Heat Vulnerability. Environ. Health Perspect. 2009, 117, 1730–1736. [Google Scholar] [CrossRef] [PubMed]
- D’Ippoliti, D.; Michelozzi, P.; Marino, C.; de’Donato, F.; Menne, B.; Katsouyanni, K.; Kirchmayer, U.; Analitis, A.; Medina-Ramón, M.; Paldy, A.; et al. The Impact of Heat Waves on Mortality in 9 European Cities: Results from the EuroHEAT Project. Environ. Health 2010, 9, 37. [Google Scholar] [CrossRef] [Green Version]
- an der Heiden, M.; Muthers, S.; Niemann, H.; Buchholz, U.; Grabenhenrich, L.; Matzarakis, A. Schätzung hitzebedingter Todesfälle in Deutschland zwischen 2001 und 2015. Bundesgesundheitsblatt Gesundh. Gesundh. 2019, 62, 571–579. [Google Scholar] [CrossRef] [PubMed]
- an der Heiden, M.; Muthers, S.; Niemann, H.; Buchholz, U.; Grabenhenrich, L.; Matzarakis, A. Heat-Related Mortality: An Analysis of the Impact of Heatwaves in Germany Between 1992 and 2017. Dtsch. Ärzteblatt Int. 2020, 117, 603–609. [Google Scholar] [CrossRef]
- Baldin, M.-L.; Sinnig, H. Hitzeresiliente Städte und Quartiere: Sichtweisen von Bewohnern und Experten zur urbanen Transformation in Erfurt und Dresden. Verb. Bundesverb. Wohn. Stadtentwickl. (Vhw) 2019, 5, 244–250. [Google Scholar]
- Sandholz, S.; Sett, D.; Greco, A.; Wannewitz, M.; Garschagen, M. Rethinking urban heat stress: Assessing risk and adaptation options across socioeconomic groups in Bonn, Germany. Urban Clim. 2021, 37, 100857. [Google Scholar] [CrossRef]
- Landesdatenbank NRW. Gemeindemodellrechnung-Basis-2018 bis 2040 nach Altersjahren und Geschlecht-Kreisangehörige Gemeinden -Stichtag. Landesdatenbank NRW Website. 2021. Available online: https://www.landesdatenbank.nrw.de/ldbnrw//online?operation=table&code=12422-02ir&bypass=true&levelindex=1&levelid=1637924177620#abreadcrumb (accessed on 7 May 2021).
- Davoudi, S. Evidence-Based Planning. Disp Plan. Rev. 2006, 42, 14–24. [Google Scholar] [CrossRef]
- Biesbroek, G.R.; Klostermann, J.E.M.; Termeer, C.J.A.M.; Kabat, P. On the nature of barriers to climate change adaptation. Reg. Environ. Chang. 2013, 13, 1119–1129. [Google Scholar] [CrossRef]
- Reckien, D.; Salvia, M.; Heidrich, O.; Church, J.M.; Pietrapertosa, F.; de Gregorio-Hurtado, S.; D’Alonzo, V.; Foley, A.; Simoes, S.; Lorencová, E.K.; et al. How are cities planning to respond to climate change? Assessment of local climate plans from 885 cities in the EU-28. J. Clean. Prod. 2018, 191, 207–219. [Google Scholar] [CrossRef]
- European Commission. Directive 2001/42/EC of the European Parliament and of the Council of 27 June 2001 on the assessment of the effects of certain plans and programmes on the environment. Off. J. Eur. Union 2001, L197/30. Available online: https://eur-lex.europa.eu/legal-content/EN/TXT/PDF/?uri=CELEX:32001L0042&from=EN (accessed on 20 May 2022).
- European Commission. Directive 2014/52/EU of the European Parliament and of the Council of 16 April 2014 amending Directive 2011/92/EU on the assessment of the effects of certain public and private projects on the environment. Off. J. Eur. Union 2014, L124/1. Available online: https://eur-lex.europa.eu/legal-content/EN/TXT/PDF/?uri=CELEX:32014L0052&from=EN (accessed on 20 May 2022).
- Molenveld, A.; van Buuren, A.; Ellen, G.-J. Governance of climate adaptation, which mode? An exploration of stakeholder viewpoints on how to organize adaptation. Clim. Chang. 2020, 162, 233–254. [Google Scholar] [CrossRef]
- Website Raum-Strategie. Available online: https://www.raum-strategie.de (accessed on 20 May 2022).
- Ciarli, T.; Savona, M. Modelling the Evolution of Economic Structure and Climate Change: A Review. Ecol. Econ. 2019, 158, 51–64. [Google Scholar] [CrossRef] [Green Version]
- Mabon, L. Making climate information services accessible to communities: What can we learn from environmental risk communication research? Urban Clim. 2020, 31, 100537. [Google Scholar] [CrossRef] [PubMed]
| Publisher’s Note: MDPI stays neutral with regard to jurisdictional claims in published maps and institutional affiliations. |
© 2022 by the authors. Licensee MDPI, Basel, Switzerland. This article is an open access article distributed under the terms and conditions of the Creative Commons Attribution (CC BY) license (https://creativecommons.org/licenses/by/4.0/).


