The Determination of Priority Areas for the Restoration of Degraded Tropical Peatland Using Hydrological, Topographical, and Remote Sensing Approaches
Abstract
:1. Introduction
2. Materials and Methods
2.1. Study Area
2.2. Materials
2.3. Determination of Streamline and Outlet
2.4. Calculation of Precipitation and Hydrological Data
2.5. Calculation of Water Balance
- Local rainfall intensity (P).
- The evaporation (E) and transpiration (T) that occurred in the sub-PHU.
- Water runoff on the soil surface (SRO).
- Subsurface infiltration and water flow (SSRO).
2.6. Calculation of Wetness and Vegetation Indices
2.7. Identification of Fire History
3. Results
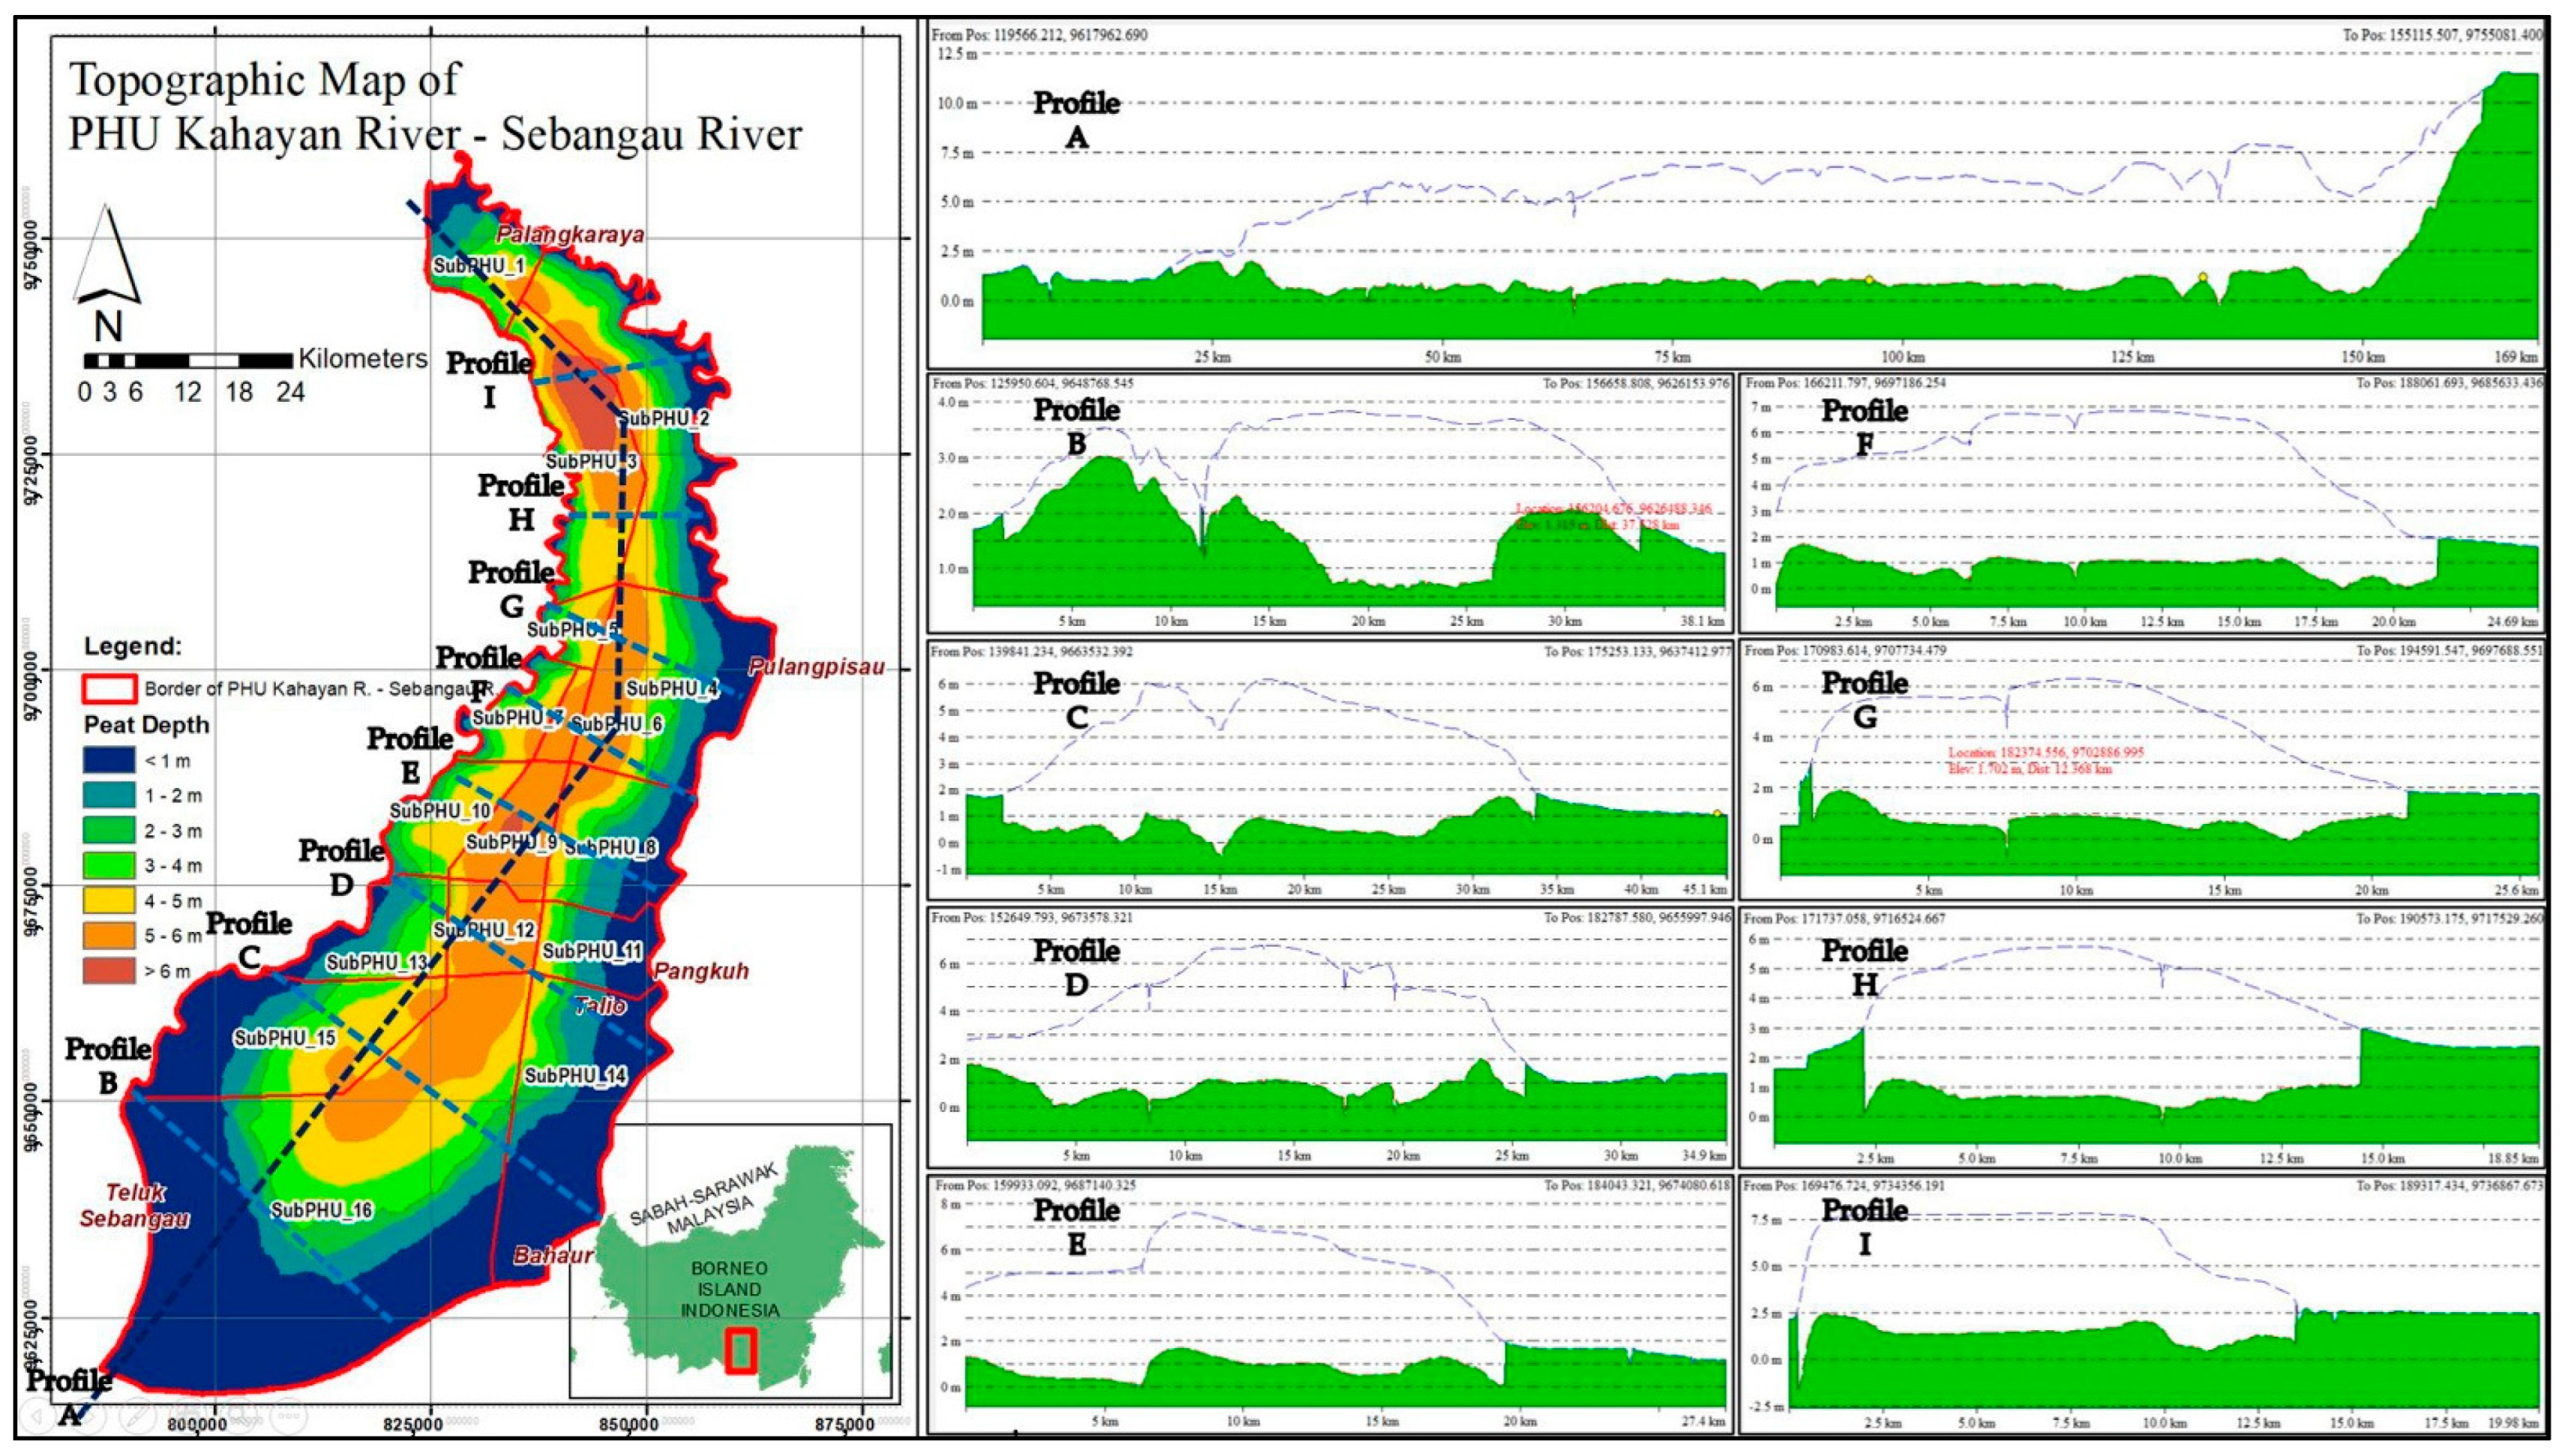
3.1. Sub-PHU Determination
3.2. Water Balance
3.3. Precipitation, and Dry Days
3.4. Wetness and Vegetation Indices
3.5. Fire History and Tidal-Affected Area
3.6. Peat Water Volume and Peat Water Loss
3.7. Determination of the Restoration Priority Areas
4. Discussion
5. Conclusions and Recommendations
5.1. Conclusions
5.2. Recommendation
Author Contributions
Funding
Institutional Review Board Statement
Informed Consent Statement
Data Availability Statement
Acknowledgments
Conflicts of Interest
Appendix A
References
- Osaki, M.; Tsuji, N. Tropical Peatland Ecosystems; Osaki, M., Tsuji, N., Eds.; Springer: Tokyo, Japan, 2016; ISBN 978-4-431-55680-0. [Google Scholar]
- Jaenicke, J.; Englhart, S.; Siegert, F. Monitoring the effect of restoration measures in Indonesian peatlands by radar satellite imagery. J. Environ. Manag. 2011, 92, 630–638. [Google Scholar] [CrossRef] [PubMed]
- Dommain, R.; Couwenberg, J.; Joosten, H. Hydrological self-regulation of domed peatlands in south-east Asia and consequences for conservation and restoration. Mires Peat 2010, 6, 1–17. [Google Scholar]
- Information Centre, Alberta Environment and Sustainable Resource Development. Alberta Government Ecosystem Service Approach Pilot on Wetlands, Assessment of Water Storage and Flood Control Ecosystem Services; Information Centre, Alberta Environment and Sustainable Resource Development: Edmonton, Alberta, 2011. [Google Scholar]
- Posa, M.R.C.; Wijedasa, L.S.; Corlett, R.T. Biodiversity and Conservation of Tropical Peat Swamp Forests. BioScience 2011, 61, 49–57. [Google Scholar] [CrossRef]
- Page, S.; Hosciło, A.; Wösten, H.; Jauhiainen, J.; Silvius, M.; Rieley, J.; Ritzema, H.; Tansey, K.; Graham, L.; Vasander, H.; et al. Restoration ecology of lowland tropical peatlands in Southeast Asia: Current knowledge and future research directions. Ecosystems 2009, 12, 888–905. [Google Scholar] [CrossRef]
- Dohong, A.; Abdul Aziz, A.; Dargusch, P. A Review of Techniques for Effective Tropical Peatland Restoration. Wetlands 2018, 38, 275–292. [Google Scholar] [CrossRef]
- Grand-Clement, E.; Anderson, K.; Smith, D.; Angus, M.; Luscombe, D.J.J.; Gatis, N.; Bray, L.S.S.; Brazier, R.E.E. New approaches to the restoration of shallow marginal peatlands. J. Environ. Manag. 2015, 161, 417–430. [Google Scholar] [CrossRef] [Green Version]
- Afriyanti, D.; Kroeze, C.; Saad, A. Science of the Total Environment Indonesia palm oil production without deforestation and peat conversion by 2050. Sci. Total Environ. 2016, 557, 562–570. [Google Scholar] [CrossRef] [PubMed]
- Evans, C.D.; Williamson, J.M.; Kacaribu, F.; Irawan, D.; Suardiwerianto, Y.; Hidayat, M.F.; Laurén, A.; Page, S.E. Rates and Spatial Variability of Peat Subsidence in Acacia Plantation and Forest Landscapes in Sumatra, Indonesia. Geoderma 2019, 338, 410–421. [Google Scholar] [CrossRef]
- Dohong, A.; Aziz, A.A.; Dargusch, P. A review of the drivers of tropical peatland degradation in South-East Asia. Land Use Policy 2017, 69, 349–360. [Google Scholar] [CrossRef]
- Saputra, E. Beyond Fires and Deforestation: Tackling Land Subsidence in Peatland Areas, a Case Study from Riau, Indonesia. Land 2019, 8, 76. [Google Scholar] [CrossRef] [Green Version]
- Vetrita, Y.; Cochrane, M.A. Fire frequency and related land-use and land-cover changes in Indonesia’s Peatlands. Remote Sens. 2020, 12, 5. [Google Scholar] [CrossRef] [Green Version]
- THOHA, A.S.; SAHARJO, B.H.; BOER, R.; ARDIANSYAH, M. Characteristics and causes of forest and land fires in Kapuas District, Central Kalimantan Province, Indonesia. Biodiversitas J. Biol. Divers. 2018, 20, 110–117. [Google Scholar] [CrossRef] [Green Version]
- Joosten, H.; Tapio-Biström, M.-L.; Tol, S. Peatlands—Guidance for Climate Change Mitigation through Conservation, Rehabilitation, 5th ed.; FAO of the UN and Wetlands International: Rome, Italy, 2012; ISBN 9789251073025. [Google Scholar]
- Minasny, B.; Berglund, Ö.; Connolly, J.; Hedley, C.; de Vries, F.; Gimona, A.; Kempen, B.; Kidd, D.; Lilja, H.; Malone, B.; et al. Digital Mapping of Peatlands—A Critical Review. Earth-Sci. Rev. 2019, 18, 102870. [Google Scholar] [CrossRef]
- Ministry of State Secretariat, Republic of Indonesia. Ministry of State Secretariat, Government Regulation No. 57/2016 Concerning Amendments to the Government Regulation No. 71/2014 on Protection and Management of Peat Ecosystems; Ministry of State Secretariat, Republic of Indonesia: Jakarta, Indonesia, 2016; pp. 1–15. [Google Scholar]
- Ministry of Environment and Forestry of the Republic of Indonesia. MoEF. Ministerial Regulation of the Minister of Environment and Forestry of the Republic of Indonesia Number P.10/MENLHK/SETJEN/KUM.1/3/2019 Concerning Determination, Establishment, and Management of Peat Dome Peaks Based on Peat Hydrological Units; Ministry of Environment and Forestry of the Republic of Indonesia: Jakarta, Indonesia, 2019; pp. 1–57. [Google Scholar]
- NRCS-USDA. Conservation Practice Standard: Wetland Restoration; Natural Resources Conservation Service of the United States Department of Agriculture: Washington, DC, USA, 2010. [Google Scholar]
- Ritzema, H.; Limin, S.; Kusin, K.; Jauhiainen, J.; Wosten, H. Canal Blocking Strategies for Hydrological Restoration of Degraded Tropical Peatlands in Central Kalimantan-Indonesia. Catena 2014, 114, 11–20. [Google Scholar] [CrossRef] [Green Version]
- Lunt, P.; Allot, T.; Anderson, P.; Buckler, M.; Coupar, A.; Jones, P.; Labadz, J.; Worrall, P.; Evans, E.M. Impacts of Peatland Restoration. Sci. Rev. Comm. By IUCN UK Peatl. Programme Comm. Inq. Into Peatl. Restor. 2010, 3, 1–33. [Google Scholar]
- Luna, D.A.; Ocampo, D.V.; Quiñones, S.G.L.; Rivera, E.C.; Sejalbo, C.G.; Zara, P.R.; Hizon, K.B.M.; Reyes, J.A.V.D.; Ticzon, V.S.; Macandog, D.M. Coastal Objects: Mangrove Area Extraction Using Remote Sensing and Aerial LiDAR Data in Roxas, Oriental Mindoro. Environ. Ecol. Res. 2017, 5, 282–288. [Google Scholar] [CrossRef] [Green Version]
- Jaenicke, J.; Wösten, H.; Budiman, A.; Siegert, F. Planning hydrological restoration of peatlands in Indonesia to mitigate carbon dioxide emissions. Mitig. Adapt. Strateg. Glob. Chang. 2010, 15, 223–239. [Google Scholar] [CrossRef] [Green Version]
- Gracz, M.B.; Moffett, M.F.; Siegel, D.I.; Glaser, P.H. Analyzing peatland discharge to streams in an Alaskan watershed: An integration of end-member mixing analysis and a water balance approach. J. Hydrol. 2015, 530, 667–676. [Google Scholar] [CrossRef]
- Bragg, O.; Lindsay, R.; Risager, M.; Silvius, M.; Zingstra, H. Strategy and Action Plan for Mire and Peatland Conservation in Central Europe; Wetland International: Wageningen, The Netherlands, 2003; ISBN 90-5882-018-1. [Google Scholar]
- Minasny, B.; Setiawan, B.I.; Arif, C.; Saptomo, S.K.; Chadirin, Y. Digital mapping for cost-effective and accurate prediction of the depth and carbon stocks in Indonesian peatlands. Geoderma 2016, 272, 20–31. [Google Scholar] [CrossRef]
- Jaenicke, J.; Rieley, J.O.; Mott, C.; Kimman, P.; Siegert, F. Determination of the amount of carbon stored in Indonesian peatlands. Geoderma 2008, 147, 151–158. [Google Scholar] [CrossRef]
- Bonnett, S.A.; Ross, S.; Linstead, C.; Maltby, E. A Review of Techniques for Monitoring the Success of Peatland Restoration; Natural England: Sheffield, UK, 2009. [Google Scholar]
- Mirmanto, E.; Tsuyuzaki, S.; Kohyama, T. Investigation of the Effects of Distance from River and Peat Depth on Tropical Wetland Forest Communities. Tropics 2003, 12, 287–294. [Google Scholar] [CrossRef] [Green Version]
- Talib, A.; Khaidir, M.; Yasufuku, N. An Overview on Japan and Malaysia Peat Relating to Geotechnical Characteristic. Int. J. Integr. Eng. 2014, 6, 1–7. [Google Scholar]
- Kolay, P.K.; Rahman, M.A. Physico-geotechnical properties of peat and its stabilisation. Proc. Inst. Civ. Engl. Gr. Improv. 2016, 169, 206–216. [Google Scholar] [CrossRef]
- Edom, F.; Münch, A.; Dittrich, I.; Keßler, K.; Peters, R. Hydromorphological analysis and water balance modelling of ombro- and mesotrophic peatlands. Adv. Geosci. 2010, 27, 131–137. [Google Scholar] [CrossRef] [Green Version]
- Minasny, B.; Setiawan, B.I.; Saptomo, S.K.; McBratney, A.B. Open digital mapping as a cost-effective method for mapping peat thickness and assessing the carbon stock of tropical peatlands. Geoderma 2018, 313, 25–40. [Google Scholar] [CrossRef]
- Thompson, D.K.; Benscoter, B.W.; Waddington, J.M. Water Balance of a Burned and Unburned Forested Boreal Peatland. Hydrol. Process. 2014, 28, 5954–5964. [Google Scholar] [CrossRef]
- Lukenbach, M.C.; Devito, K.J.; Kettridge, N.; Petrone, R.M.; Waddington, J.M. Hydrogeological controls on post-fire moss recovery in peatlands. J. Hydrol. 2015, 530, 405–418. [Google Scholar] [CrossRef]
- Luscombe, D.J.; Anderson, K.; Grand-Clement, E.; Gatis, N.; Ashe, J.; Benaud, P.; Smith, D.; Brazier, R.E. How does drainage alter the hydrology of shallow degraded peatlands across multiple spatial scales? J. Hydrol. 2016, 541, 1329–1339. [Google Scholar] [CrossRef] [Green Version]
- Page, S.E.; Hooijer, A. In the line of fire: The peatlands of Southeast Asia. Philos. Trans. R. Soc. B Biol. Sci. 2016, 371, 20150176. [Google Scholar] [CrossRef] [Green Version]
- Bourgault, M.A.; Larocque, M.; Garneau, M. How do hydrogeological setting and meteorological conditions influence water table depth and fluctuations in ombrotrophic peatlands? J. Hydrol. X 2019, 4, 100032. [Google Scholar] [CrossRef]
- Giglio, L.; Schroeder, W.; Justice, C.O. The collection 6 MODIS active fire detection algorithm and fire products. Remote Sens. Environ. 2016, 178, 31–41. [Google Scholar] [CrossRef] [PubMed] [Green Version]
- Giglio, L.; Schroeder, W.; Hall, J.V.; Justice, C.O. MODIS Collection 6 Active Fire Product User ’ s Guide Revision C. Sites J. 20th Century Contemp. Fr. Stud. 2020, 2, 44. [Google Scholar]
- ESA. Sentinel-2 User Handbook; Rev-2; European Space Agency: Paris, France, 2015. [Google Scholar]
- Abatzoglou, J.T.; Dobrowski, S.Z.; Parks, S.A.; Hegewisch, K.C. TerraClimate, a high-resolution global dataset of monthly climate and climatic water balance from 1958–2015. Sci. Data 2018, 5, 170191. [Google Scholar] [CrossRef] [PubMed] [Green Version]
- Funk, C.; Peterson, P.; Landsfeld, M.; Pedreros, D.; Verdin, J.; Shukla, S.; Husak, G.; Rowland, J.; Harrison, L.; Hoell, A.; et al. The climate hazards infrared precipitation with stations—A new environmental record for monitoring extremes. Sci. Data 2015, 2, 150066. [Google Scholar] [CrossRef] [Green Version]
- Menberu, M.W.; Haghighi, A.T.; Ronkanen, A.K.; Marttila, H.; Kløve, B. Effects of Drainage and Subsequent Restoration on Peatland Hydrological Processes at Catchment Scale. Water Resour. Res. 2018, 54, 4479–4497. [Google Scholar] [CrossRef] [Green Version]
- Katimon, A.; Khairi, A.; Wahab, A.B.D. Hydrologic Characteristics of a Drained Tropical. J. Teknol. 2007, 38, 39–53. [Google Scholar]
- Buffam, I.; Carpenter, S.R.; Yeck, W.; Hanson, P.C.; Turner, M.G. Filling holes in regional carbon budgets: Predicting peat depth in a north temperate lake district. J. Geophys. Res. 2010, 115, 1–16. [Google Scholar] [CrossRef] [Green Version]
- Akpa, S.I.C.; Odeh, I.O.A.; Bishop, T.F.A.; Hartemink, A.E. Digital Mapping of Soil Particle-Size Fractions for Nigeria. Soil Sci. Soc. Am. J. 2014, 78, 1953–1966. [Google Scholar] [CrossRef] [Green Version]
- Sencaki, D.B.; Muhammad, D.J.; Sumargana, L.; Gandharum, L. Peatland Delineation Using Remote Sensing Data in Sumatera Island. In Proceedings of the 2018 IEEE Asia-Pacific Conference on Geoscience, Electronics and Remote Sensing Technology (AGERS), Bali, Indonesia, 18–19 September 2018; pp. 1–6. [Google Scholar]
- Smith, M.W.; Warburton, J. Microtopography of bare peat: A conceptual model and objective classification from high-resolution topographic survey data. Earth Surf. Process. Landforms 2018, 43, 1557–1574. [Google Scholar] [CrossRef] [Green Version]
- Thomas, K. A New Simplified DSM-to-DTM Algorithm—dsm-to-dtm-step. Preprints 2018, 1–10. [Google Scholar] [CrossRef]
- Karyanto, O.; Aditya, T. Multi-Sensors Remote Sensing for Mapping and Monitoring Canals on Tropical Peatland. In Proceedings of the 2018 4th International Conference on Science and Technology (ICST), Yogyakarta, Indonesia, 7–8 August 2018; Volume 1, pp. 1–5. [Google Scholar]
- Jenson, S.K.; Domingue, J.O. Extracting topographic structure from digital elevation data for geographic information system analysis. Photogramm. Engl. Remote Sens. 1988, 54, 1593–1600. [Google Scholar]
- Cahyono, B.K.; Aditya, T. The Least Square Adjustment for Estimating The Tropical Peat Depth using LiDAR Data. Remote Sens. 2020, 12, 875. [Google Scholar] [CrossRef] [Green Version]
- Golden, H.E.; Lane, C.R.; Amatya, D.M.; Bandilla, K.W.; Raanan Kiperwas, H.; Knightes, C.D.; Ssegane, H. Hydrologic connectivity between geographically isolated wetlands and surface water systems: A review of select modeling methods. Environ. Model. Softw. 2014, 53, 190–206. [Google Scholar] [CrossRef]
- Bevington, A.; Gleason, H.; Giroux-Bougard, X.; De Jong, J.T. A Review of Free Optical Satellite Imagery for Watershed-Scale Landscape Analysis. Conflu. J. Watershed Sci. Manag. 2018, 2, 1–22. [Google Scholar] [CrossRef]
- Phua, M.H.; Tsuyuki, S.; Lee, J.S.; Sasakawa, H. Detection of burned peat swamp forest in a heterogeneous tropical landscape: A case study of the Klias Peninsula, Sabah, Malaysia. Landsc. Urban Plan. 2007, 82, 103–116. [Google Scholar] [CrossRef]
- Vanderhoof, M.K.; Hawbaker, T.J.; Teske, C.; Ku, A.; Noble, J.; Picotte, J. Mapping Wetland Burned Area from Sentinel-2 across the Southeastern United States and Its Contributions Relative to Landsat-8 (2016–2019). Fire 2021, 4, 52. [Google Scholar] [CrossRef]
- Huang, C.; Wylie, B.; Yang, L.; Homer, C.; Zylstra, G. Derivation of a tasselled cap transformation based on Landsat 7 at-satellite reflectance. Int. J. Remote Sens. 2002, 23, 1741–1748. [Google Scholar] [CrossRef]
- Ballhorn, U.; Siegert, F.; Mason, M.; Limin, S. Derivation of burn scar depths and estimation of carbon emissions with LIDAR in Indonesian peatlands. Proc. Natl. Acad. Sci. USA 2009, 106, 21213–21218. [Google Scholar] [CrossRef] [Green Version]
- Hall, J.V.; Loboda, T.V.; Giglio, L.; McCarty, G.W. A MODIS-based burned area assessment for Russian croplands: Mapping requirements and challenges. Remote Sens. Environ. 2016, 184, 506–521. [Google Scholar] [CrossRef] [Green Version]
- Shofiana, D.A.; Sitanggang, I.S. Confidence Analysis of Hotspot as Peat Forest Fire Indicator. J. Phys. Conf. Ser. 2021, 1751, 012035. [Google Scholar] [CrossRef]
- Hawbaker, T.J.; Radeloff, V.C.; Syphard, A.D.; Zhu, Z.; Stewart, S.I. Detection rates of the MODIS active fire product in the United States. Remote Sens. Environ. 2008, 112, 2656–2664. [Google Scholar] [CrossRef]
- Moser, G.; Zerubia, J. Mathematical Models for Remote Sensing Image Processing. In Signals and Communication Technology; Moser, G., Zerubia, J., Eds.; Springer International Publishing: Cham, Switzerland, 2018; ISBN 978-3-319-66328-9. [Google Scholar]
- Tomaszewski, B. Geographic Information Systems (GIS). In A Tool for Disaster Management, 1st ed.; CRC Press: Boca Raton, FL, USA, 2015; ISBN 978-1-4822-1169-6. [Google Scholar]
- Ballard, C.E.; McIntyre, N.; Wheater, H.S.; Holden, J.; Wallage, Z.E. Hydrological modelling of drained blanket peatland. J. Hydrol. 2011, 407, 81–93. [Google Scholar] [CrossRef]
- Schumann, M.; Joosten, H. A Global Peatland Restoration Manual; Draft; UNEP-GEF: Greifswald, Germany, 2006. [Google Scholar]
- Murphy, P.N.; Ogilvie, J.; Meng, F.-R.; Arp, P. Stream Network Modelling using LiDAR and Photogrammetric Digital Elevation Models: A Comparison and Field Verification. Hydrol. Process. 2007, 22, 1747–1754. [Google Scholar] [CrossRef]
- Lang, M.; McDonough, O.; McCarty, G.; Oesterling, R.; Wilen, B. Enhanced detection of wetland-stream connectivity using lidar. Wetlands 2012, 32, 461–473. [Google Scholar] [CrossRef]
- Orság, M.; Fischer, M.; Trnka, M.; Pohanková, E.; Pozníková, G.; Žalud, Z. Role of interception and stem flow in water balance of short rotation poplar coppice. In Proceedings of the Environmental Changes and Adaptation Strategies, Skalica, Slovakia, 9–11 September 2013; pp. 1–4. [Google Scholar]
- Gerrits, A.M.J. The Role of Biodiversity in the Hydrological Cycle; Delft University of Technology: Delft, The Netherlands, 2016. [Google Scholar]
- FGDC. Wetlands Mapping Standard; FGDC: Reston, VA, USA, 2009. [Google Scholar]
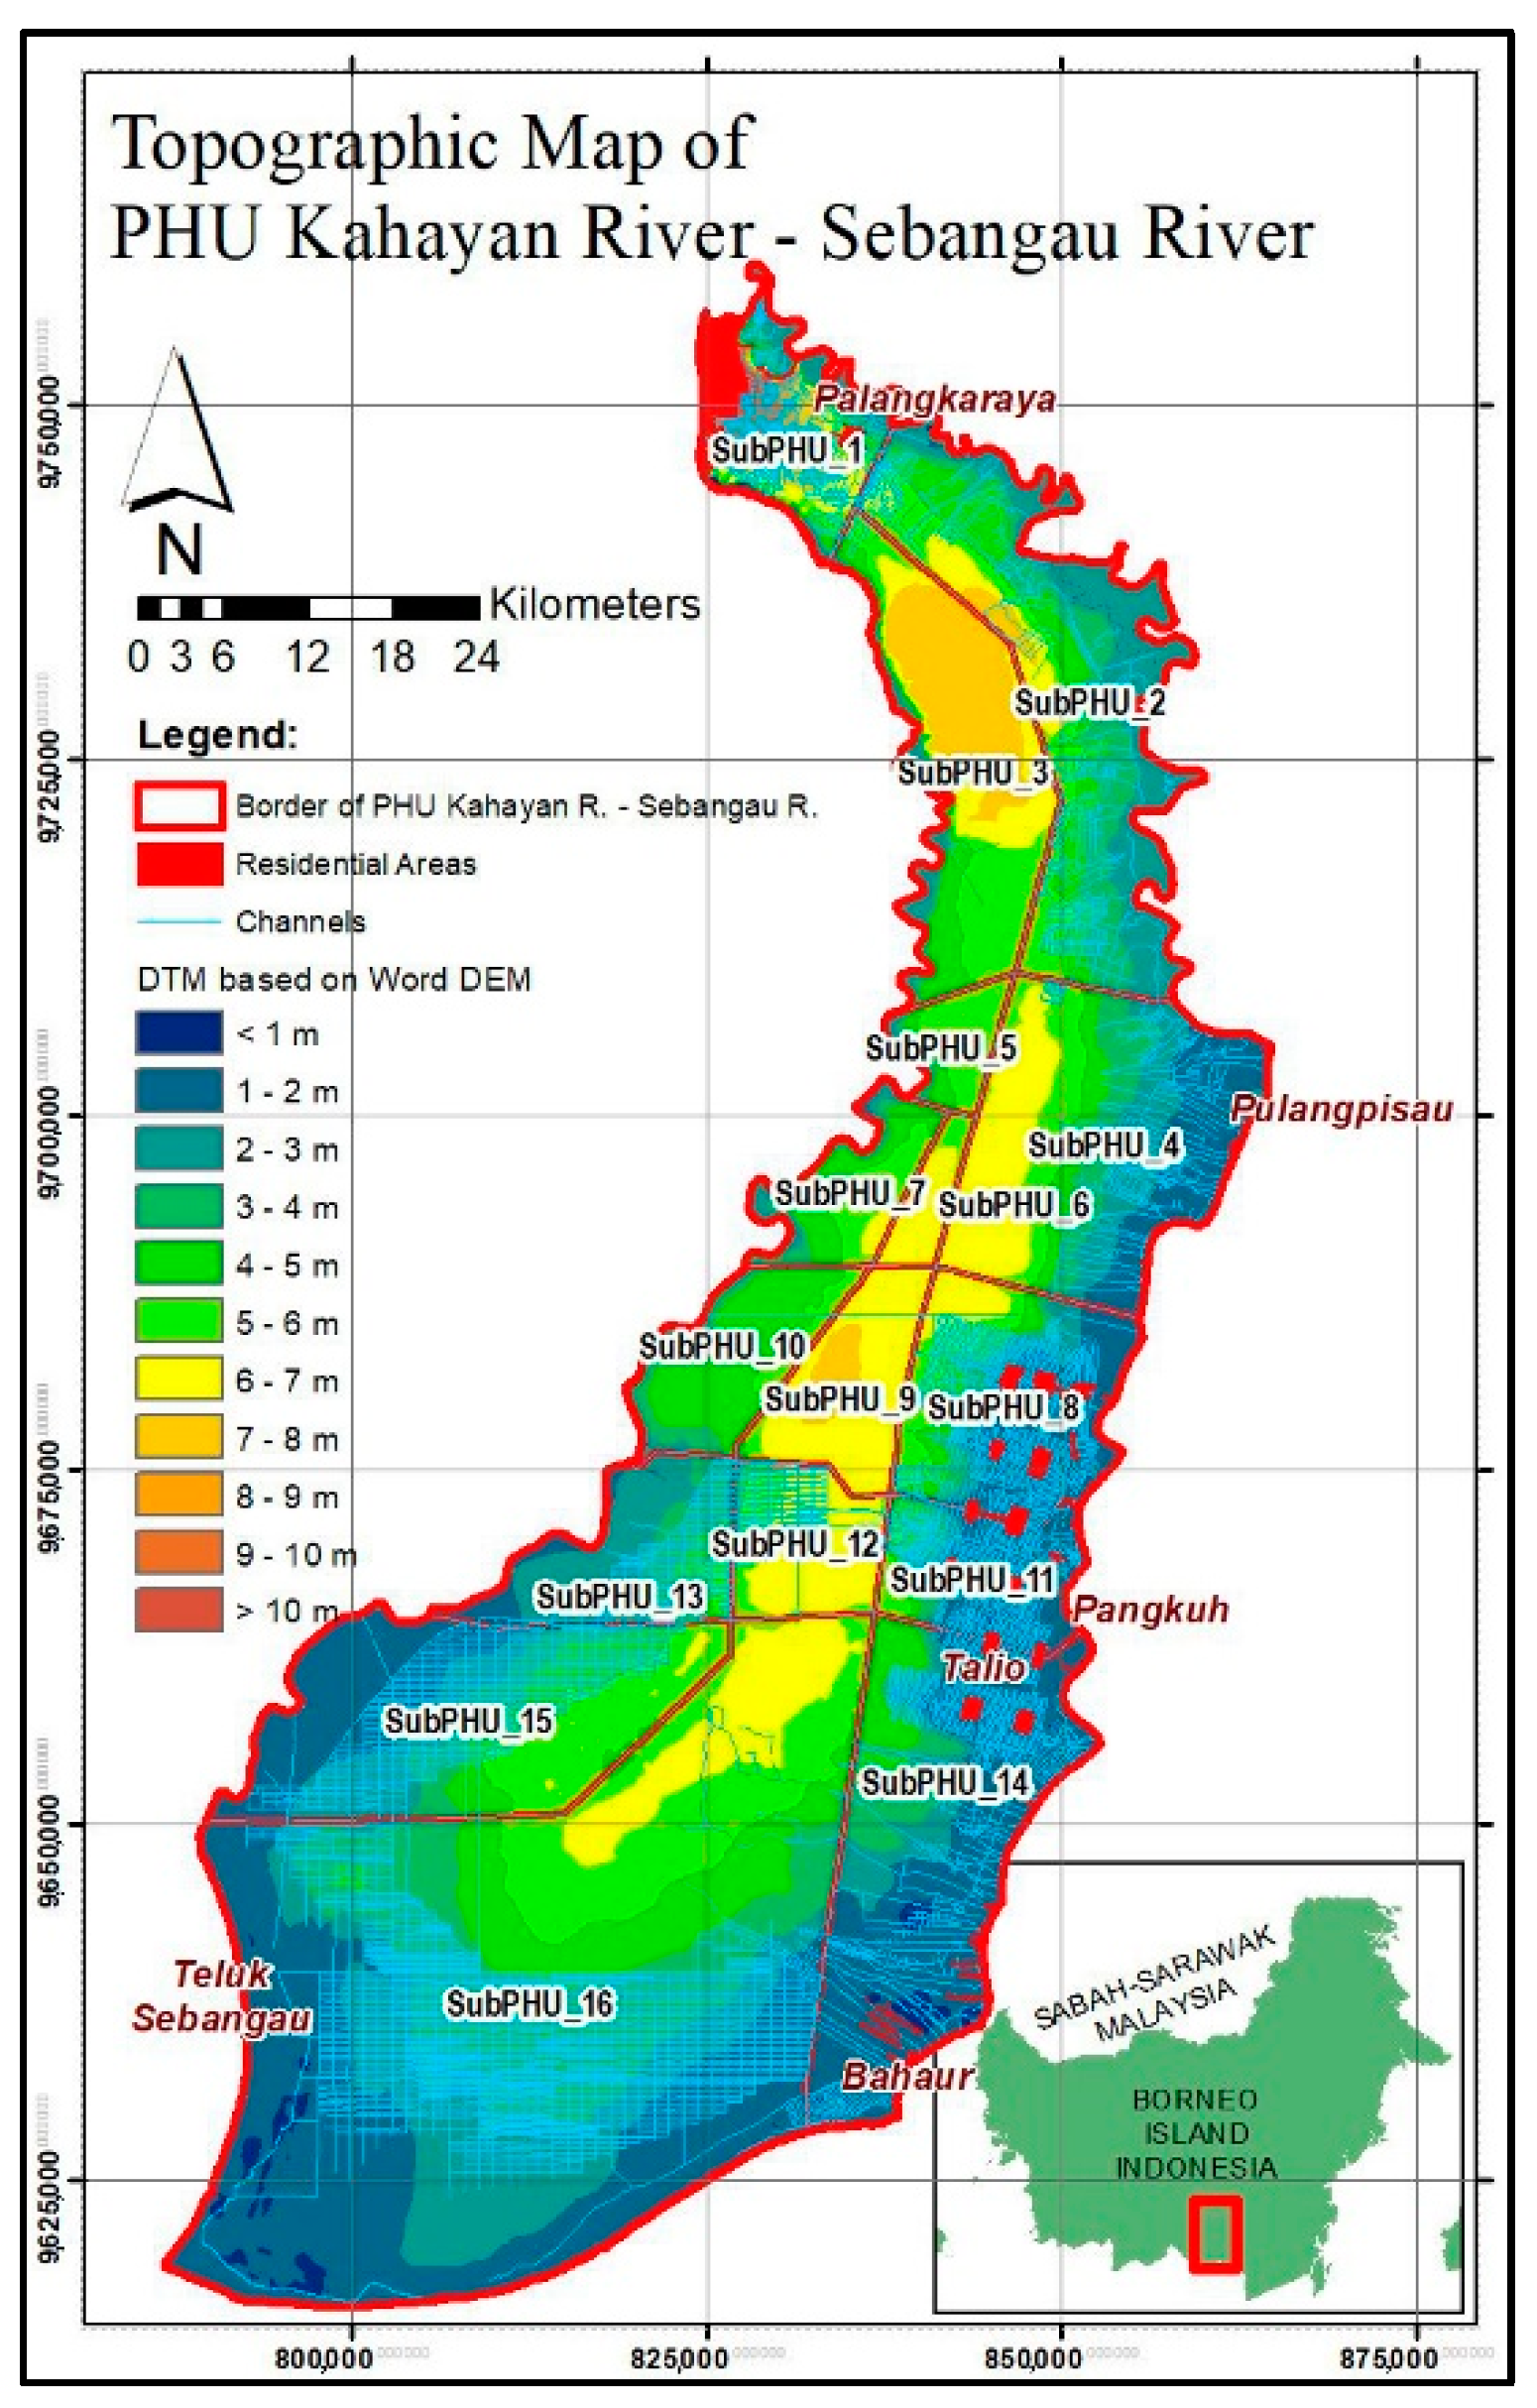
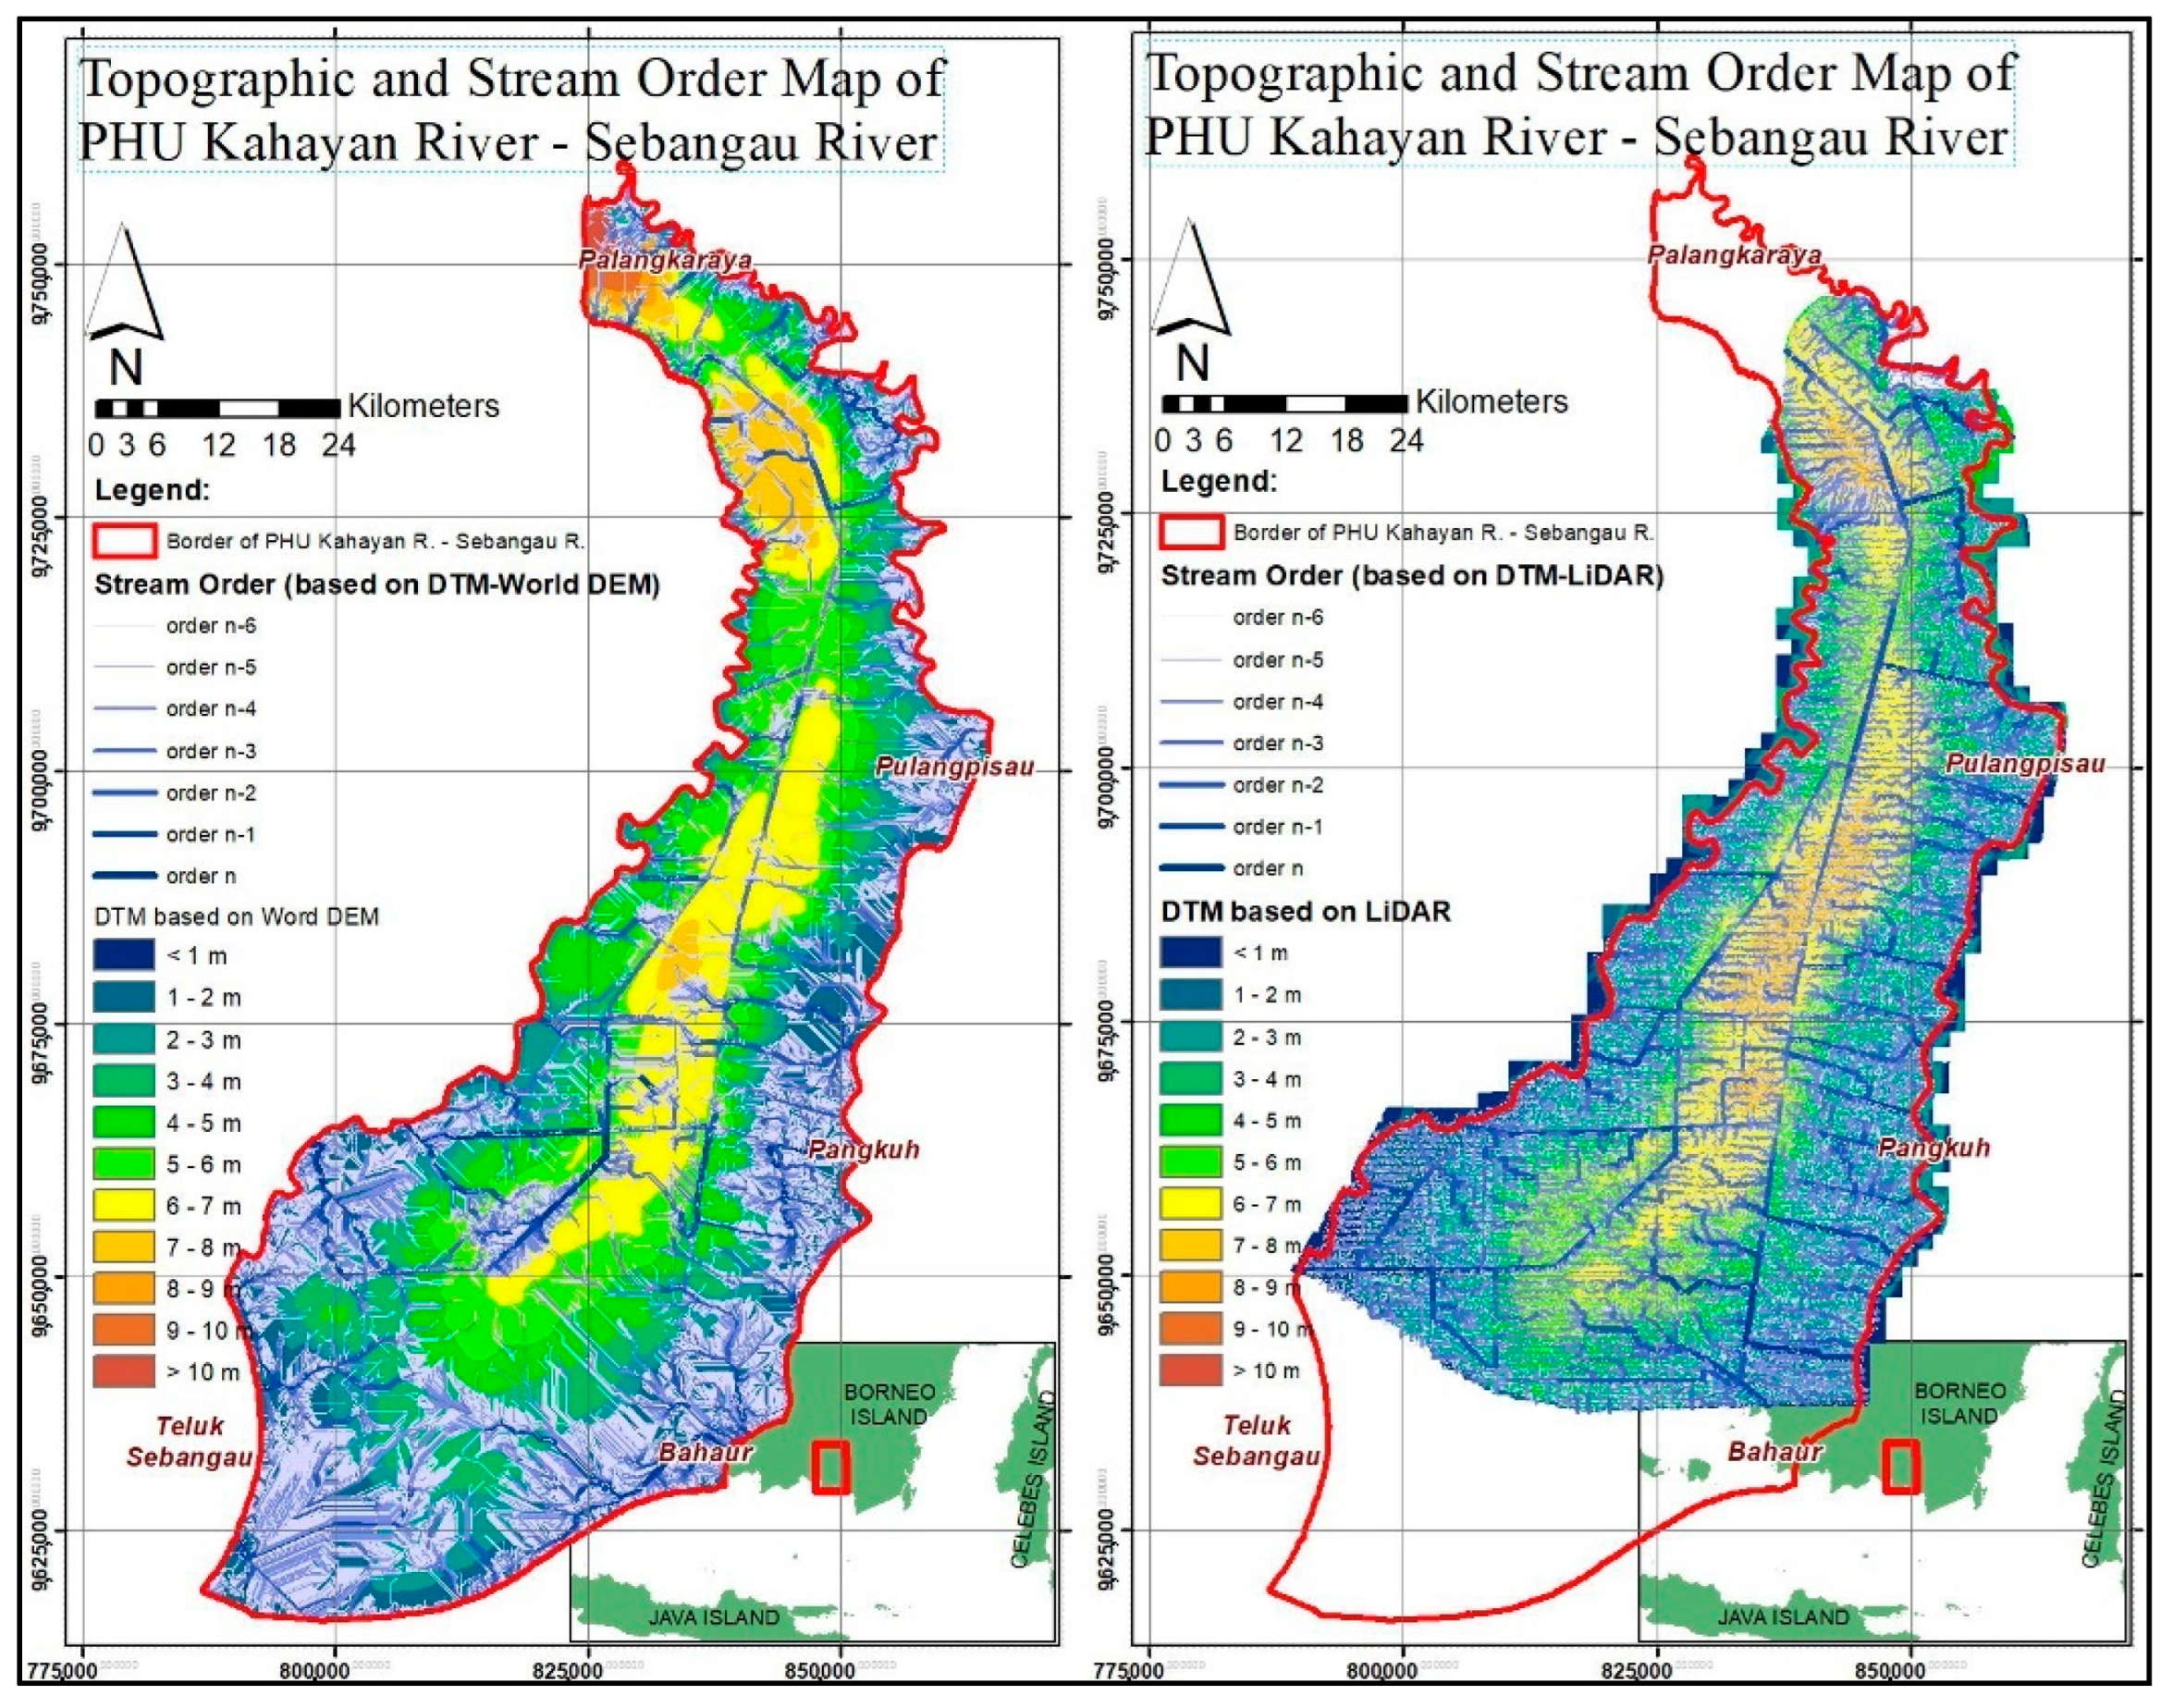
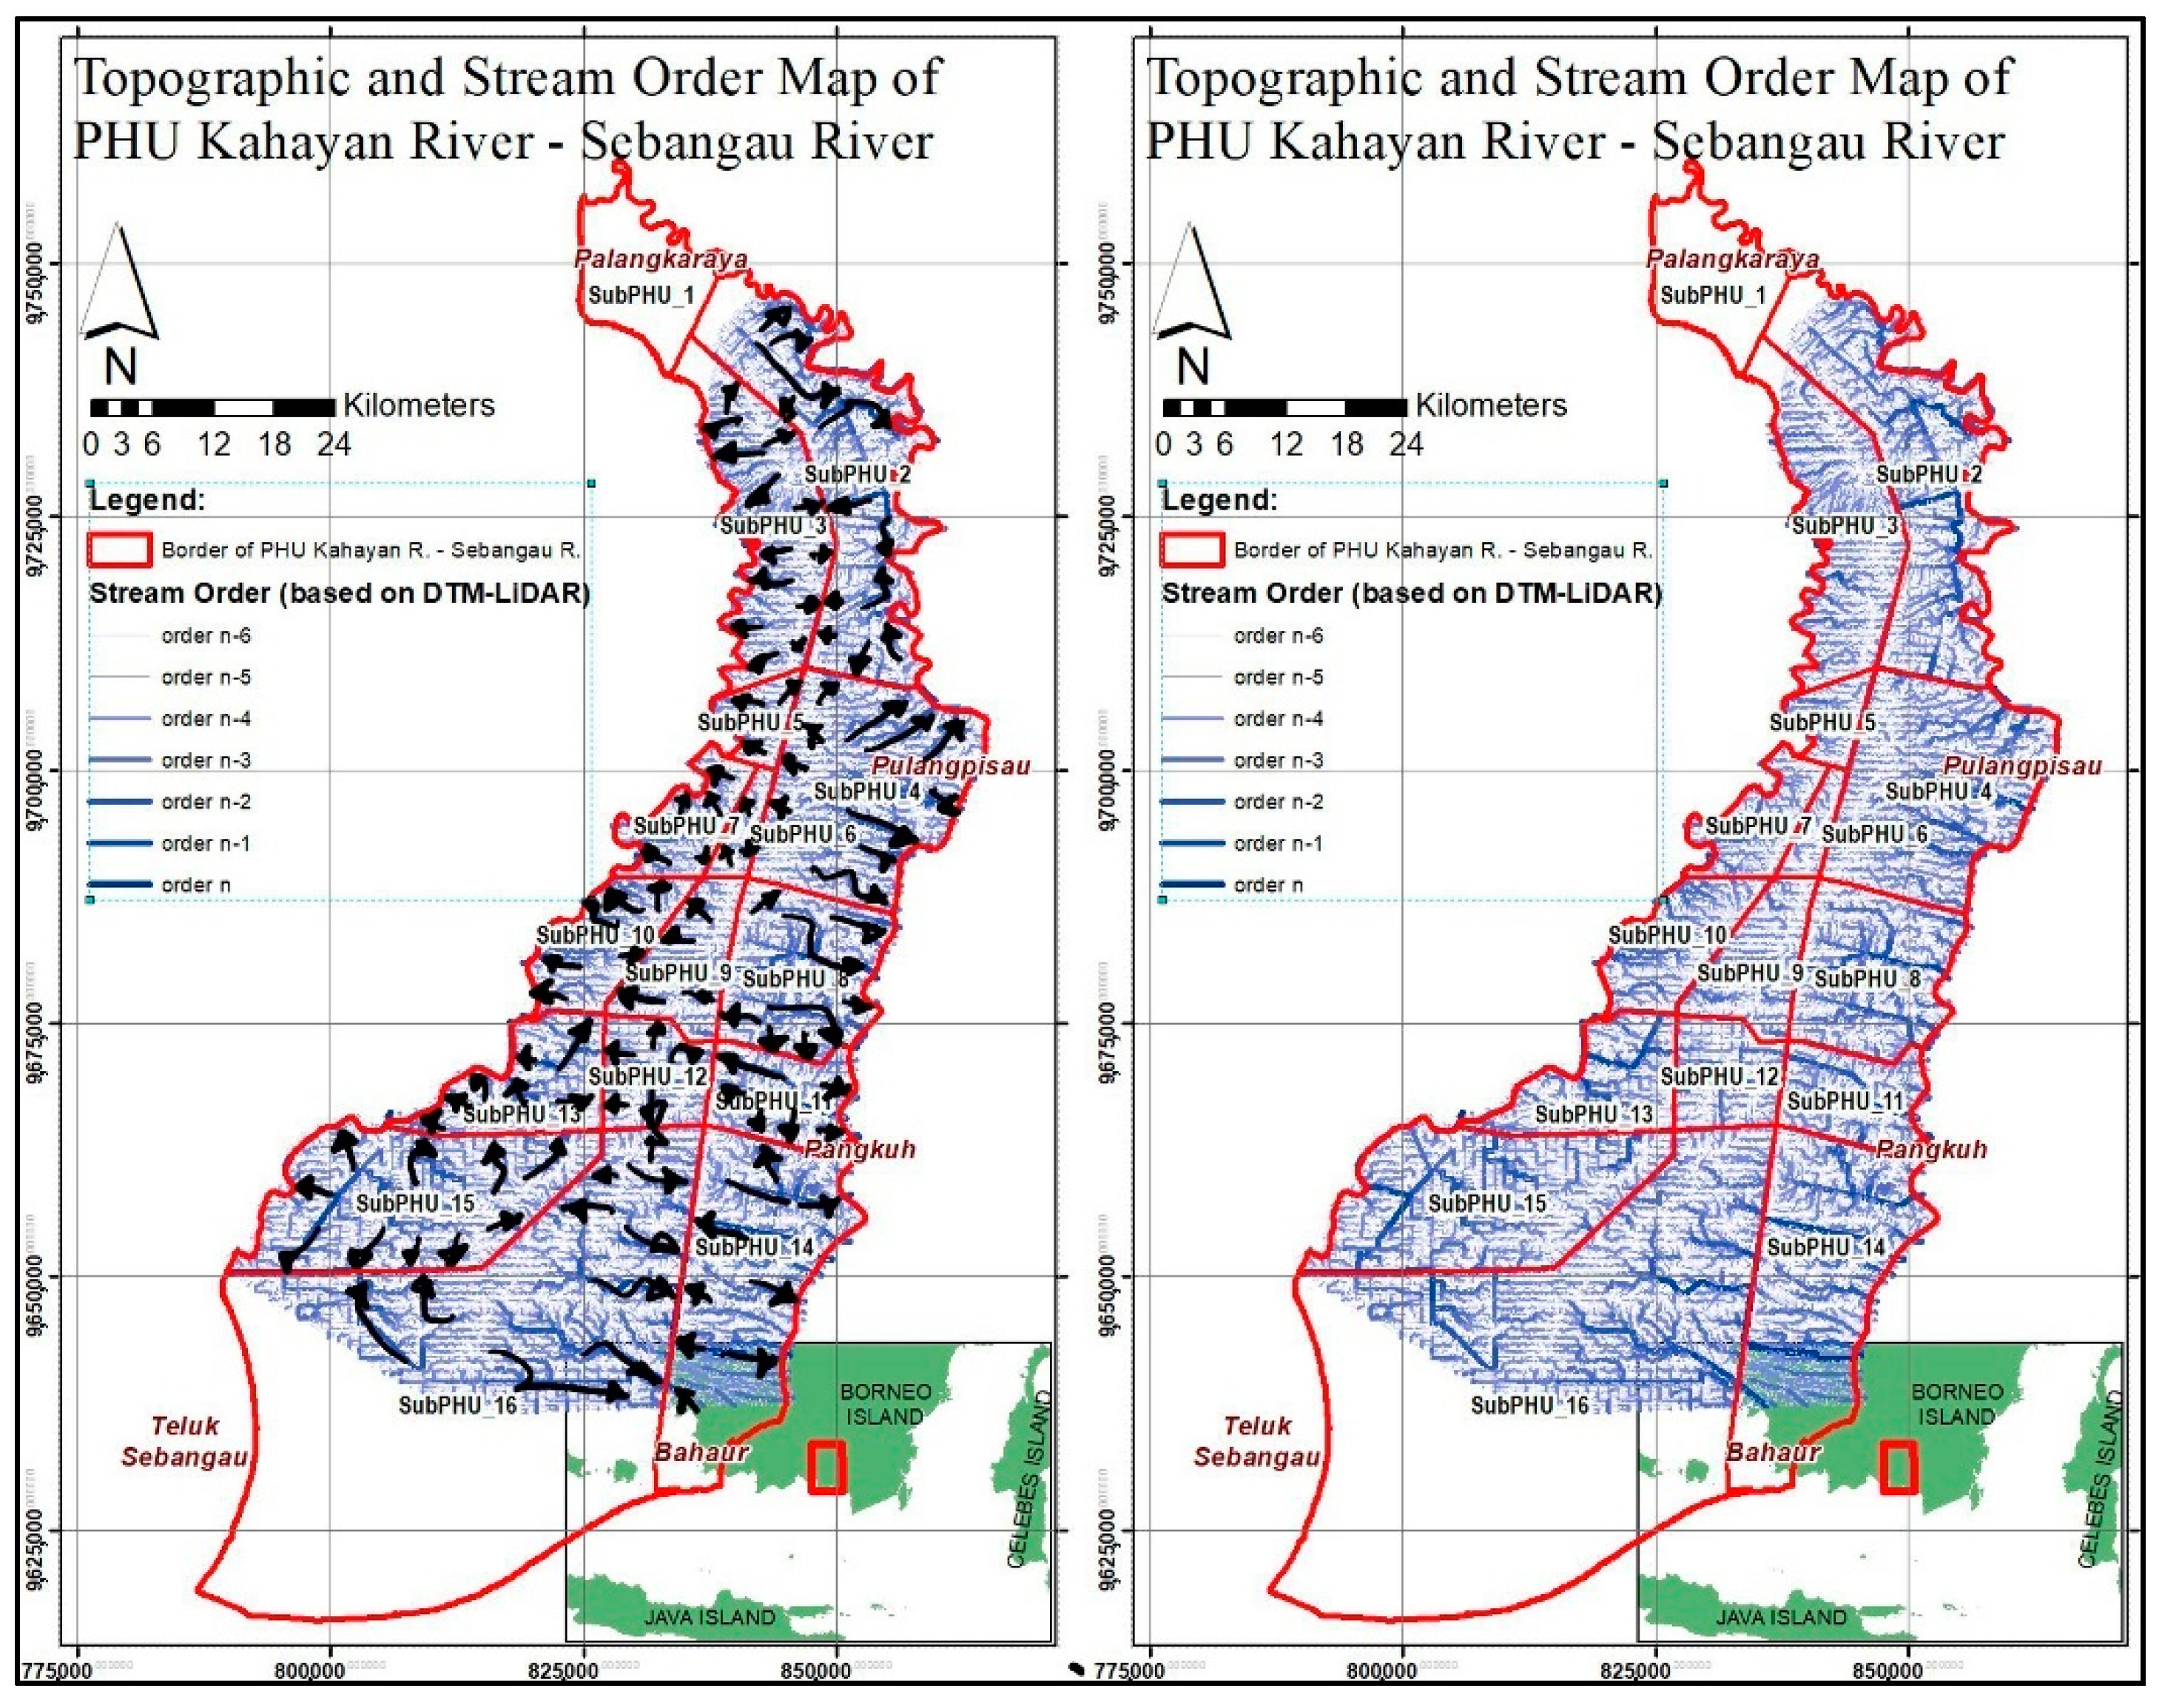



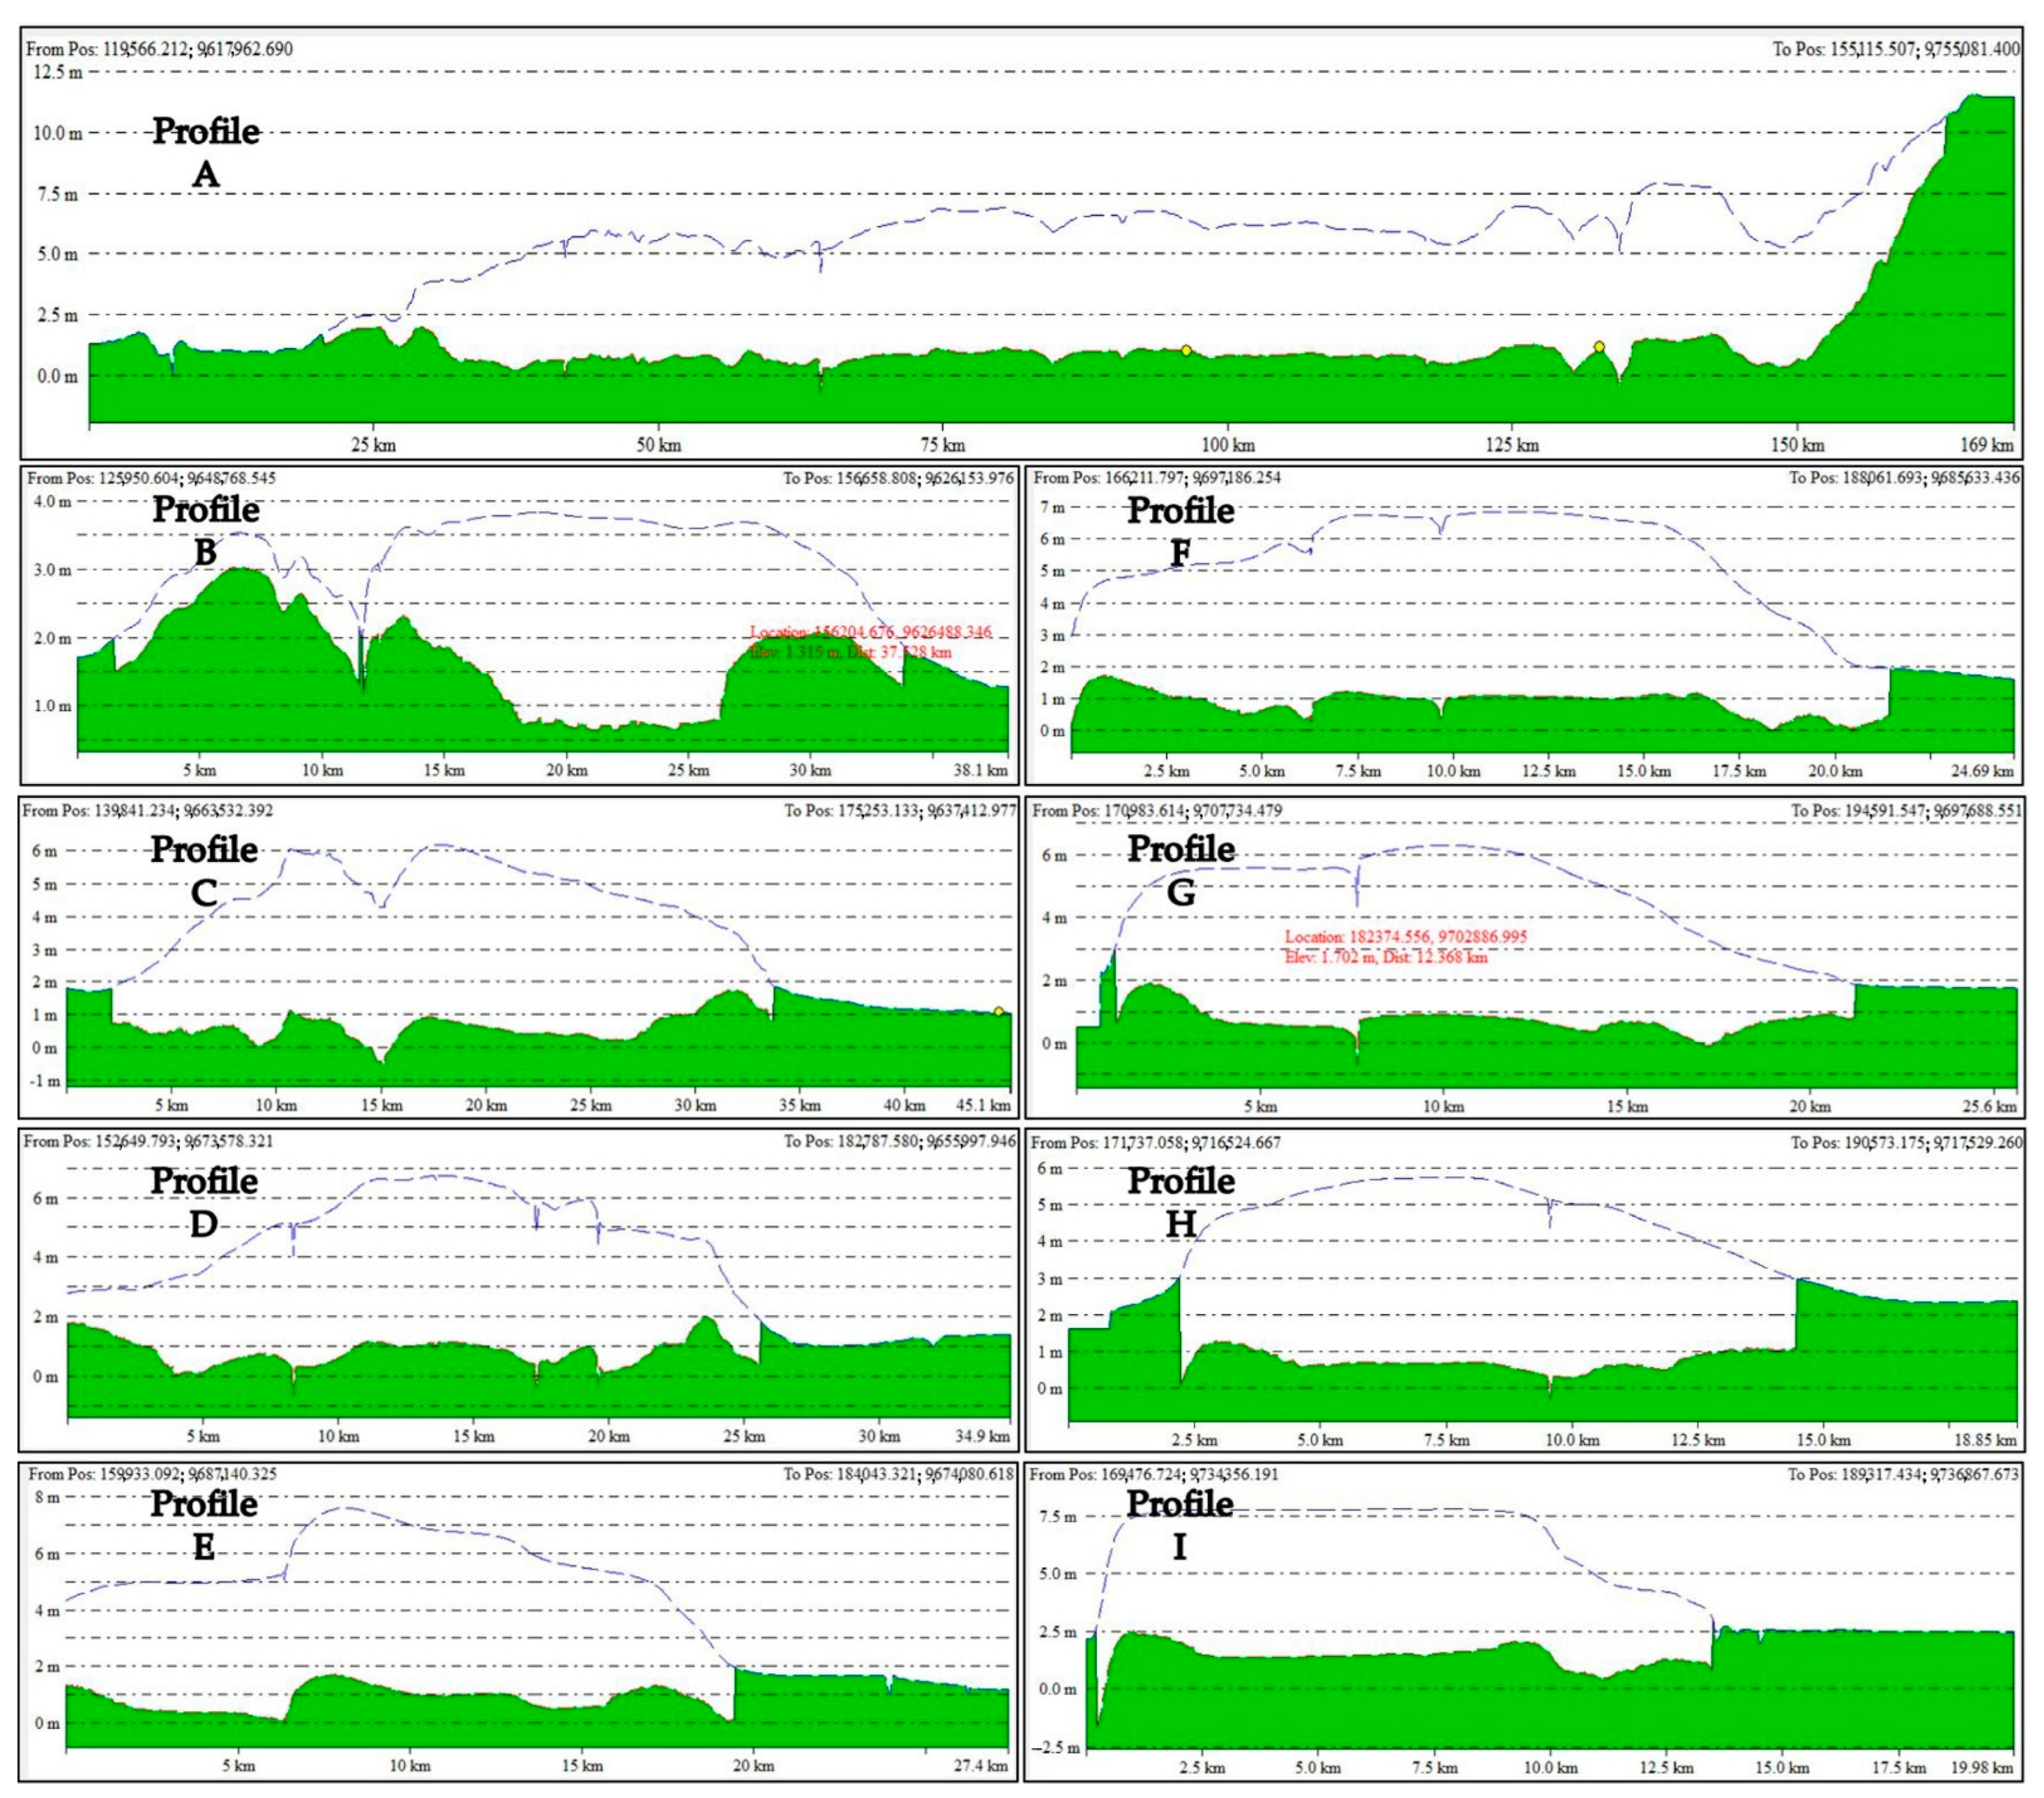
| Sub-PHU | LULC | Area (Hectares) |
|---|---|---|
| Sub-PHU 1 | Settlements and opened agricultural areas (community planting areas) dominate the LULC. | 15,437.02 |
| Sub-PHU 2 | It is dominated by open agricultural areas (rice fields), and some space is a natural peat swamp forest. | 39,436.73 |
| Sub-PHU 3 | The LULC is dominated by the natural peat swamp forest and swampy shrubs. | 26,446.33 |
| Sub-PHU 4 | The LULC in this sub-PHU is dominated by swamp scrub and opened agricultural areas (rice fields). | 37,063.99 |
| Sub-PHU 5 | This sub-PHU is dominated by swamp scrub and opened agricultural areas (rice fields). | 5189.30 |
| Sub-PHU 6 | The LULC in this sub-PHU is dominated by swamp scrub and opened agricultural areas (rice fields). | 3525.88 |
| Sub-PHU 7 | This sub-PHU is also dominated by swamp scrub and opened agricultural areas (rice fields). | 9028.54 |
| Sub-PHU 8 | Settlements and opened agricultural areas (community planting areas) dominate the LULC in this sub-PHU. | 22,929.31 |
| Sub-PHU 9 | Almost all of this sub-PHU is covered by swamp shrubs. | 12,005.23 |
| Sub-PHU 10 | Swamp shrub dominates the LULC in this sub-PHU. A swampy area can still be found near the Sebangau River. | 12,767.64 |
| Sub-PHU 11 | It is dominated by open agricultural areas (rice fields) and residential areas. | 12,337.55 |
| Sub-PHU 12 | The LULC in this sub-PHU is dominated by oil palm plantations concession, swamp shrubs, and opened areas. | 10,646.20 |
| Sub-PHU 13 | This sub-PHU is dominated by oil palm plantation concessions and swamp scrub areas. | 15,474.93 |
| Sub-PHU 14 | Residential areas, opened agricultural areas (rice fields), community planting areas, and swamp shrubs dominate the LULC. | 41,684.13 |
| Sub-PHU 15 | This sub-PHU is dominated by oil palm plantation concessions, swamp scrub, and opened areas. | 38,023.98 |
| Sub-PHU 16 | This sub-PHU is dominated by oil palm plantation concessions and swamp scrub areas. | 149,147.71 |
| The Average of Monthly Water Balance in 2010–2020 for Each Sub-PHU in Kahayan–Sebangau PHU | Month-ly Avg. | Deficit Months | ||||||||||||
|---|---|---|---|---|---|---|---|---|---|---|---|---|---|---|
| Jan | Feb | Mar | Apr | May | Jun | Jul | Aug | Sep | Oct | Nov | Dec | |||
| sub-PHU 1 | 65.7 | 110.9 | 109.9 | 93.8 | 34.7 | 17.1 | −32.5 | −35.0 | −6.5 | −1.8 | 74.8 | 101.0 | 44.34 | 48 |
| sub-PHU 2 | 71.7 | 111.6 | 113.2 | 93.3 | 25.1 | 12.1 | −37.3 | −41.3 | −12.3 | −9.7 | 68.3 | 103.2 | 41.49 | 53 |
| sub-PHU 3 | 98.7 | 145.2 | 148.7 | 123.9 | 45.6 | 30.9 | −27.8 | −32.6 | −0.9 | 5.6 | 94.0 | 132.8 | 63.67 | 43 |
| sub-PHU 4 | 84.6 | 122.7 | 118.7 | 93.0 | 15.3 | 11.5 | −41.3 | −43.9 | −16.2 | −15.1 | 64.2 | 106.5 | 41.66 | 56 |
| sub-PHU 5 | 108.1 | 154.0 | 152.2 | 124.1 | 40.4 | 31.6 | −30.5 | −33.9 | −3.5 | 2.5 | 92.8 | 136.0 | 64.49 | 43 |
| sub-PHU 6 | 115.5 | 159.6 | 154.7 | 125.3 | 38.8 | 32.0 | −31.0 | −34.0 | −5.2 | 0.4 | 91.0 | 137.6 | 65.39 | 45 |
| sub-PHU 7 | 112.5 | 158.4 | 153.6 | 124.6 | 40.2 | 32.3 | −30.3 | −34.3 | −5.5 | 0.4 | 89.9 | 134.8 | 64.72 | 46 |
| sub-PHU 8 | 94.7 | 130.5 | 118.9 | 92.8 | 13.2 | 9.4 | −41.9 | −44.6 | −17.9 | −15.1 | 64.7 | 108.9 | 42.81 | 57 |
| sub-PHU 9 | 123.2 | 164.6 | 153.2 | 124.4 | 37.9 | 29.6 | −31.3 | −35.2 | −7.1 | −2.2 | 90.7 | 139.1 | 65.57 | 47 |
| sub-PHU 10 | 119.3 | 163.9 | 151.9 | 123.4 | 41.2 | 31.3 | −30.0 | −34.7 | −7.4 | −1.4 | 89.7 | 135.7 | 65.24 | 48 |
| sub-PHU 11 | 100.2 | 134.7 | 117.9 | 91.7 | 11.1 | 7.3 | −42.5 | −45.6 | −19.5 | −16.3 | 64.3 | 111.1 | 42.89 | 57 |
| sub-PHU 12 | 98.4 | 134.6 | 116.8 | 91.3 | 16.9 | 11.9 | −39.9 | −44.3 | −19.7 | −16.0 | 64.6 | 109.6 | 43.69 | 57 |
| sub-PHU 13 | 95.3 | 134.5 | 114.1 | 89.6 | 21.3 | 14.4 | −38.2 | −43.9 | −20.3 | −16.1 | 63.7 | 105.6 | 43.33 | 52 |
| sub-PHU 14 | 107.5 | 139.3 | 114.2 | 86.4 | 6.3 | 5.9 | −43.2 | −47.0 | −20.9 | −16.6 | 65.7 | 118.8 | 43.03 | 58 |
| sub-PHU 15 | 98.6 | 137.8 | 109.9 | 86.1 | 24.0 | 15.2 | −35.5 | −43.0 | −20.5 | −13.4 | 64.2 | 109.0 | 44.36 | 52 |
| sub-PHU 16 | 105.8 | 138.4 | 107.2 | 81.9 | 16.9 | 12.6 | −36.9 | −45.1 | −21.3 | −13.4 | 65.8 | 116.1 | 43.99 | 57 |
| The Average of Monthly Consecutive Dry Periods in 2010–2020 for Each Sub-PHU in Kahayan–Sebangau PHU | Monthly Average (Days) | Extreme Dry Days (Days) | ||||||||||||
|---|---|---|---|---|---|---|---|---|---|---|---|---|---|---|
| Jan | Feb | Mar | Apr | May | Jun | Jul | Aug | Sep | Oct | Nov | Dec | |||
| sub-PHU 1 | 2.09 | 2.82 | 1.91 | 2.45 | 3.55 | 7.00 | 8.64 | 9.82 | 7.64 | 3.09 | 2.45 | 1.36 | 4.40 | 23 |
| sub-PHU 2 | 2.00 | 2.27 | 1.64 | 1.91 | 3.55 | 6.45 | 8.09 | 8.27 | 7.64 | 2.82 | 1.91 | 1.36 | 3.99 | 23 |
| sub-PHU 3 | 1.91 | 2.45 | 1.73 | 2.09 | 3.91 | 6.82 | 8.27 | 9.36 | 8.09 | 3.27 | 2.27 | 1.36 | 4.30 | 23 |
| sub-PHU 4 | 1.73 | 2.27 | 1.64 | 1.91 | 3.55 | 8.09 | 9.55 | 11.64 | 9.82 | 2.91 | 2.27 | 1.45 | 4.73 | 20 |
| sub-PHU 5 | 1.91 | 2.27 | 2.00 | 2.55 | 3.82 | 8.18 | 9.55 | 10.45 | 9.82 | 3.64 | 2.55 | 1.55 | 4.86 | 25 |
| sub-PHU 6 | 2.18 | 2.82 | 2.00 | 2.09 | 3.91 | 8.36 | 9.18 | 11.55 | 10.18 | 3.45 | 2.36 | 1.64 | 4.98 | 22 |
| sub-PHU 7 | 1.82 | 2.64 | 1.64 | 2.00 | 3.64 | 8.09 | 8.82 | 11.09 | 10.45 | 3.27 | 2.27 | 1.36 | 4.76 | 24 |
| sub-PHU 8 | 1.82 | 2.27 | 1.55 | 2.18 | 3.73 | 7.36 | 8.64 | 10.45 | 7.91 | 3.18 | 2.18 | 1.55 | 4.40 | 18 |
| sub-PHU 9 | 1.64 | 2.27 | 1.36 | 2.00 | 4.00 | 7.36 | 9.55 | 10.64 | 8.55 | 3.18 | 2.36 | 1.45 | 4.53 | 22 |
| sub-PHU 10 | 1.73 | 2.00 | 1.36 | 1.91 | 3.91 | 7.45 | 8.82 | 11.73 | 8.27 | 3.55 | 2.18 | 1.36 | 4.52 | 21 |
| sub-PHU 11 | 1.36 | 2.09 | 1.73 | 2.27 | 3.73 | 8.36 | 8.73 | 11.27 | 8.18 | 3.36 | 2.18 | 1.73 | 4.58 | 19 |
| sub-PHU 12 | 1.73 | 2.73 | 1.55 | 2.00 | 3.64 | 8.36 | 9.09 | 10.45 | 7.91 | 3.36 | 2.00 | 1.45 | 4.52 | 19 |
| sub-PHU 13 | 1.82 | 2.36 | 1.55 | 1.55 | 3.36 | 7.91 | 9.09 | 10.73 | 7.64 | 3.64 | 2.27 | 1.55 | 4.45 | 19 |
| sub-PHU 14 | 1.55 | 1.36 | 1.64 | 1.91 | 4.36 | 7.27 | 7.73 | 10.18 | 8.18 | 3.27 | 2.00 | 1.18 | 4.22 | 19 |
| sub-PHU 15 | 1.64 | 2.45 | 1.64 | 2.09 | 4.27 | 8.00 | 9.45 | 9.45 | 7.91 | 3.45 | 2.18 | 1.64 | 4.52 | 19 |
| sub-PHU 16 | 1.45 | 1.73 | 1.91 | 1.91 | 4.00 | 8.27 | 7.64 | 10.36 | 9.55 | 3.45 | 2.00 | 1.27 | 4.46 | 24 |
| Average Value of NDMI (Moisture) per Sub-PHU | Average NDMI | Average Value of NDVI (Vegetation) per Sub-PHU | Average NDVI | |||||||||||||
|---|---|---|---|---|---|---|---|---|---|---|---|---|---|---|---|---|
| 2014 | 2015 | 2016 | 2017 | 2018 | 2019 | 2020 | 2014 | 2015 | 2016 | 2017 | 2018 | 2019 | 2020 | |||
| sub-PHU 1 | 0.311 | 0.257 | 0.290 | 0.308 | 0.283 | 0.321 | 0.265 | 0.291 | 0.533 | 0.565 | 0.530 | 0.500 | 0.612 | 0.549 | 0.468 | 0.537 |
| sub-PHU 2 | 0.377 | 0.364 | 0.341 | 0.349 | 0.361 | 0.365 | 0.265 | 0.346 | 0.552 | 0.648 | 0.647 | 0.621 | 0.703 | 0.580 | 0.672 | 0.632 |
| sub-PHU 3 | 0.426 | 0.428 | 0.421 | 0.376 | 0.442 | 0.396 | 0.390 | 0.411 | 0.549 | 0.641 | 0.637 | 0.511 | 0.709 | 0.524 | 0.675 | 0.607 |
| sub-PHU 4 | 0.428 | 0.431 | 0.351 | 0.373 | 0.385 | 0.385 | 0.478 | 0.404 | 0.623 | 0.617 | 0.663 | 0.687 | 0.668 | 0.623 | 0.727 | 0.658 |
| sub-PHU 5 | 0.444 | 0.384 | 0.338 | 0.324 | 0.365 | 0.393 | 0.422 | 0.381 | 0.653 | 0.529 | 0.585 | 0.571 | 0.633 | 0.583 | 0.703 | 0.608 |
| sub-PHU 6 | 0.456 | 0.420 | 0.324 | 0.320 | 0.376 | 0.391 | 0.457 | 0.392 | 0.700 | 0.549 | 0.600 | 0.597 | 0.665 | 0.644 | 0.718 | 0.639 |
| sub-PHU 7 | 0.441 | 0.399 | 0.325 | 0.340 | 0.376 | 0.412 | 0.429 | 0.389 | 0.687 | 0.489 | 0.601 | 0.581 | 0.650 | 0.689 | 0.694 | 0.627 |
| sub-PHU 8 | 0.378 | 0.376 | 0.327 | 0.328 | 0.346 | 0.356 | 0.430 | 0.363 | 0.697 | 0.586 | 0.703 | 0.658 | 0.693 | 0.702 | 0.715 | 0.679 |
| sub-PHU 9 | 0.500 | 0.435 | 0.419 | 0.367 | 0.430 | 0.452 | 0.350 | 0.422 | 0.732 | 0.529 | 0.713 | 0.553 | 0.693 | 0.731 | 0.745 | 0.671 |
| sub-PHU 10 | 0.438 | 0.402 | 0.269 | 0.331 | 0.380 | 0.406 | 0.484 | 0.387 | 0.711 | 0.511 | 0.602 | 0.556 | 0.710 | 0.736 | 0.739 | 0.652 |
| sub-PHU 11 | 0.360 | 0.336 | 0.319 | 0.315 | 0.316 | 0.339 | 0.439 | 0.346 | 0.685 | 0.553 | 0.673 | 0.632 | 0.640 | 0.693 | 0.669 | 0.649 |
| sub-PHU 12 | 0.412 | 0.391 | 0.400 | 0.378 | 0.409 | 0.411 | 0.400 | 0.400 | 0.725 | 0.589 | 0.736 | 0.618 | 0.693 | 0.741 | 0.715 | 0.688 |
| sub-PHU 13 | 0.398 | 0.404 | 0.343 | 0.371 | 0.387 | 0.408 | 0.415 | 0.389 | 0.690 | 0.634 | 0.678 | 0.616 | 0.680 | 0.737 | 0.707 | 0.677 |
| sub-PHU 14 | 0.395 | 0.389 | 0.374 | 0.377 | 0.395 | 0.405 | 0.378 | 0.387 | 0.680 | 0.580 | 0.688 | 0.643 | 0.668 | 0.695 | 0.682 | 0.662 |
| sub-PHU 15 | 0.344 | 0.327 | 0.343 | 0.340 | 0.332 | 0.346 | 0.360 | 0.342 | 0.608 | 0.606 | 0.674 | 0.635 | 0.626 | 0.619 | 0.592 | 0.623 |
| sub-PHU 16 | 0.381 | 0.334 | 0.381 | 0.358 | 0.376 | 0.371 | 0.391 | 0.370 | 0.622 | 0.488 | 0.624 | 0.632 | 0.659 | 0.570 | 0.636 | 0.604 |
| Tide Constituents | Amplitude (cm) of Each Constituent | ||
|---|---|---|---|
| Bahaur | Pangkuh | Talio | |
| M2 | 26.4 | 31.9 | 15.3 |
| S2 | 4.5 | 4.0 | 1.5 |
| N2 | 5.3 | 6.5 | 3.1 |
| K2 | 1.3 | 1.2 | 0.4 |
| K1 | 69.0 | 63.8 | 47.8 |
| O1 | 35.2 | 39.0 | 25.3 |
| P1 | 21.1 | 19.5 | 14.6 |
| M4 | 0.5 | 2.0 | 1.0 |
| MS4 | 2.1 | 2.2 | 0.7 |
| Type of tidal oscillation | Diurnal Tides | ||
| Highest Astronomical Tide | 165.4 | 170.1 | 109.8 |
| Highest Water Spring | 135.1 | 138.7 | 89.9 |
| Fire History (Number of Fires Events Per Year) | Total Fires (2010–2020) | Fires in the Last 3 Years | |||||||||||
|---|---|---|---|---|---|---|---|---|---|---|---|---|---|
| 2010 | 2011 | 2012 | 2013 | 2014 | 2015 | 2016 | 2017 | 2018 | 2019 | 2020 | |||
| sub-PHU 1 | 0 | 8 | 9 | 11 | 26 | 37 | 0 | 0 | 14 | 246 | 0 | 351 | 260 |
| sub-PHU 2 | 0 | 13 | 107 | 19 | 195 | 439 | 2 | 0 | 2 | 121 | 0 | 898 | 123 |
| sub-PHU 3 | 0 | 3 | 8 | 1 | 61 | 84 | 0 | 0 | 0 | 1 | 0 | 158 | 1 |
| sub-PHU 4 | 1 | 20 | 26 | 12 | 21 | 424 | 0 | 0 | 0 | 186 | 0 | 690 | 186 |
| sub-PHU 5 | 0 | 0 | 1 | 0 | 14 | 47 | 0 | 0 | 0 | 0 | 0 | 62 | 0 |
| sub-PHU 6 | 0 | 6 | 0 | 2 | 1 | 105 | 0 | 0 | 0 | 1 | 0 | 115 | 1 |
| sub-PHU 7 | 0 | 1 | 0 | 1 | 1 | 132 | 0 | 0 | 0 | 13 | 0 | 148 | 13 |
| sub-PHU 8 | 0 | 4 | 39 | 13 | 18 | 198 | 0 | 0 | 2 | 123 | 0 | 397 | 125 |
| sub-PHU 9 | 0 | 0 | 11 | 4 | 1 | 89 | 0 | 0 | 0 | 7 | 0 | 112 | 7 |
| sub-PHU 10 | 0 | 0 | 32 | 2 | 0 | 124 | 0 | 0 | 0 | 10 | 0 | 168 | 10 |
| sub-PHU 11 | 0 | 16 | 19 | 17 | 33 | 58 | 0 | 0 | 33 | 85 | 0 | 261 | 118 |
| sub-PHU 12 | 0 | 0 | 27 | 18 | 43 | 86 | 0 | 0 | 103 | 58 | 0 | 335 | 161 |
| sub-PHU 13 | 0 | 0 | 16 | 0 | 2 | 67 | 0 | 0 | 2 | 22 | 0 | 109 | 24 |
| sub-PHU 14 | 0 | 92 | 88 | 14 | 100 | 288 | 2 | 6 | 105 | 466 | 0 | 1161 | 571 |
| sub-PHU 15 | 0 | 70 | 89 | 3 | 84 | 295 | 0 | 1 | 10 | 250 | 0 | 802 | 260 |
| sub-PHU 16 | 0 | 422 | 358 | 108 | 432 | 1037 | 0 | 13 | 298 | 521 | 1 | 3190 | 820 |
| Sub-PHU | Area (Hectares) | Volume (m3) | Average of Peat Depth (m) | Water Volume (m3) | ET (mm/Day) | Water Loss Rate (mm/Day) | Water Loss (%) | Water Loss in 14 Days (cm) | Water Loss in 21 Days (cm) |
|---|---|---|---|---|---|---|---|---|---|
| sub-PHU 1 | 153,858,240 | 355,378,829 | 2.310 | 213,227,297 | 3.523 | −21.918 | −1.7 | −30.685 | −46.028 |
| sub-PHU 2 | 392,962,176 | 1,078,284,951 | 2.744 | 646,970,971 | 3.525 | −21.918 | −1.4 | −30.685 | −46.028 |
| sub-PHU 3 | 263,587,536 | 1,279,229,365 | 4.853 | 1,023,383,492 | 3.519 | −17.191 | −0.5 | −24.068 | −36.102 |
| sub-PHU 4 | 369,821,664 | 1,132,159,582 | 3.061 | 905,727,666 | 3.500 | −17.191 | −0.7 | −24.068 | −36.102 |
| sub-PHU 5 | 51,628,176 | 207,497,443 | 4.019 | 165,997,954 | 3.490 | −17.191 | −0.6 | −24.068 | −36.102 |
| sub-PHU 6 | 35,031,888 | 189,227,217 | 5.402 | 151,381,774 | 3.504 | −17.191 | −0.4 | −24.068 | −36.102 |
| sub-PHU 7 | 89,852,112 | 308,887,697 | 3.438 | 247,110,157 | 3.507 | −17.191 | −0.6 | −24.068 | −36.102 |
| sub-PHU 8 | 228,735,936 | 553,301,934 | 2.419 | 331,981,161 | 3.515 | −16.350 | −1.1 | −22.890 | −34.335 |
| sub-PHU 9 | 119,679,408 | 673,079,440 | 5.624 | 538,463,552 | 3.507 | −17.191 | −0.4 | −24.068 | −36.102 |
| sub-PHU 10 | 127,321,344 | 460,624,008 | 3.618 | 368,499,206 | 3.506 | −17.191 | −0.6 | −24.068 | −36.102 |
| sub-PHU 11 | 122,975,280 | 197,477,408 | 1.606 | 118,486,445 | 3.521 | −16.350 | −1.7 | −22.890 | −34.335 |
| sub-PHU 12 | 106,197,408 | 561,840,767 | 5.291 | 337,104,460 | 3.513 | −21.918 | −0.7 | −30.685 | −46.028 |
| sub-PHU 13 | 154,393,632 | 354,202,566 | 2.294 | 212,521,540 | 3.515 | −21.918 | −1.7 | −30.685 | −46.028 |
| sub-PHU 14 | 415,991,664 | 428,869,867 | 1.031 | 257,321,920 | 3.535 | −16.350 | −2.7 | −22.890 | −34.335 |
| sub-PHU 15 | 379,892,592 | 946,521,344 | 2.492 | 567,912,807 | 3.522 | −21.918 | −1.6 | −30.685 | −46.028 |
| sub-PHU 16 | 1,491,227,856 | 2,955,405,212 | 1.982 | 1,773,243,127 | 3.518 | −21.918 | −2.0 | −30.685 | −46.028 |
| the entire PHU | 4,503,156,912 | 11,681,987,630 | 3.261 | 7,859,333,529 | 3.514 | −18.806 | −1.2 | −26.329 | −39.493 |
| Rank Based on Criteria | Water Balance | Deficit Months | Dry Days Average | Dry Days Extreme | NDMI | NDVI | Recurrent Fires | Fires Last 3 Years | Average Peat Depth | Water Loss | Total Score | Rank | |
|---|---|---|---|---|---|---|---|---|---|---|---|---|---|
| sub-PHU 1 | 8 | 6 | 4 | 11 | 16 | 16 | 10 | 13 | 12 | 12 | 108 | 14 | |
| sub-PHU 2 | 16 | 10 | 1 | 12 | 13 | 10 | 14 | 9 | 9 | 10 | 104 | 11 | |
| sub-PHU 3 | 6 | 1 | 3 | 13 | 2 | 14 | 6 | 2 | 4 | 3 | 54 | 2 | |
| sub-PHU 4 | 15 | 11 | 13 | 7 | 3 | 6 | 12 | 12 | 8 | 7 | 94 | 10 | |
| sub-PHU 5 | 5 | 2 | 15 | 16 | 10 | 13 | 1 | 1 | 5 | 4 | 72 | 5 | |
| sub-PHU 6 | 2 | 3 | 16 | 9 | 5 | 9 | 4 | 3 | 2 | 1 | 54 | 3 | |
| sub-PHU 7 | 4 | 4 | 14 | 14 | 6 | 11 | 5 | 6 | 7 | 5 | 76 | 8 | |
| sub-PHU 8 | 14 | 12 | 5 | 1 | 12 | 2 | 11 | 10 | 11 | 9 | 87 | 9 | |
| sub-PHU 9 | 1 | 5 | 11 | 10 | 1 | 4 | 3 | 4 | 1 | 2 | 42 | 1 | |
| sub-PHU 10 | 3 | 7 | 8 | 8 | 8 | 7 | 7 | 5 | 6 | 6 | 65 | 4 | |
| sub-PHU 11 | 13 | 13 | 12 | 2 | 14 | 8 | 8 | 8 | 15 | 13 | 106 | 12 | |
| sub-PHU 12 | 10 | 14 | 9 | 3 | 4 | 1 | 9 | 11 | 3 | 8 | 72 | 6 | |
| sub-PHU 13 | 11 | 8 | 6 | 4 | 7 | 3 | 2 | 7 | 13 | 14 | 75 | 7 | |
| sub-PHU 14 | 12 | 16 | 2 | 5 | 9 | 5 | 15 | 15 | 16 | 16 | 111 | 15 | |
| sub-PHU 15 | 7 | 9 | 10 | 6 | 15 | 12 | 13 | 14 | 10 | 11 | 107 | 13 | |
| sub-PHU 16 | 9 | 15 | 7 | 15 | 11 | 15 | 16 | 16 | 14 | 15 | 133 | 16 | |
Publisher’s Note: MDPI stays neutral with regard to jurisdictional claims in published maps and institutional affiliations. |
© 2022 by the authors. Licensee MDPI, Basel, Switzerland. This article is an open access article distributed under the terms and conditions of the Creative Commons Attribution (CC BY) license (https://creativecommons.org/licenses/by/4.0/).
Share and Cite
Cahyono, B.K.; Aditya, T.; Istarno. The Determination of Priority Areas for the Restoration of Degraded Tropical Peatland Using Hydrological, Topographical, and Remote Sensing Approaches. Land 2022, 11, 1094. https://doi.org/10.3390/land11071094
Cahyono BK, Aditya T, Istarno. The Determination of Priority Areas for the Restoration of Degraded Tropical Peatland Using Hydrological, Topographical, and Remote Sensing Approaches. Land. 2022; 11(7):1094. https://doi.org/10.3390/land11071094
Chicago/Turabian StyleCahyono, Bambang Kun, Trias Aditya, and Istarno. 2022. "The Determination of Priority Areas for the Restoration of Degraded Tropical Peatland Using Hydrological, Topographical, and Remote Sensing Approaches" Land 11, no. 7: 1094. https://doi.org/10.3390/land11071094
APA StyleCahyono, B. K., Aditya, T., & Istarno. (2022). The Determination of Priority Areas for the Restoration of Degraded Tropical Peatland Using Hydrological, Topographical, and Remote Sensing Approaches. Land, 11(7), 1094. https://doi.org/10.3390/land11071094


