Article

Effects of Land-Use Change on the Pollination Services for Litchi and Longan Orchards: A Case Study of Huizhou, China

1
School of Public Management, South China Agricultural University, Guangzhou 510642, China
2
Key Laboratory of Natural Resources Monitoring in Tropical and Subtropical Area of South China, Ministry of Natural Resources, Guangzhou 510815, China
*
Author to whom correspondence should be addressed.
Land 2022, 11(7), 1073; https://doi.org/10.3390/land11071073
Submission received: 29 May 2022 / Revised: 1 July 2022 / Accepted: 6 July 2022 / Published: 14 July 2022

Abstract

:
Land-use change has a significant impact on the structure and function of ecosystems and is an important reason for the imbalance between the supply and demand of ecosystem services. Pollination services are indispensable functions of ecosystems. In recent years, land-use change has caused a decline in the abundance of pollinators, thereby affecting the supply of pollination services, which has been a major concern for governments and scholars. Currently, there is an insufficient exploration of the impact mechanism of land-use change on pollination services. The application of a pollination service evaluation model based on land-use data uses a large amount of empirical data, which greatly affects the accuracy of regional evaluation results. This study uses Huizhou as a representative example. Remote sensing images from 2015 and 2019 were used to interpret the land-use data of the region, and the spatiotemporal changes in the land use were then analyzed. Due to their high pollination dependence, litchi and longan were selected as the research objects. Basic data such as the main pollinator species of litchi and longan and floral plant species were obtained through field sampling surveys. The InVEST model was used to evaluate the abundance of pollinators in litchi and longan orchards, and the abundance of pollinators was used to represent the value of pollination services in litchi and longan orchards. Then, the Hotspot analysis method was used to analyze the change in the spatial pattern of the pollinator abundance in litchi and longan orchards. The main influencing factors of pollination service in litchi and longan orchards were analyzed by a Geographical detector. Finally, we have explored the impact mechanism of land-use change on pollination services. The following are the results of this research. The pollinator abundance in the orchards of litchi and longan and their buffer zones in Huizhou decreased by 6.64% and 13.94% from 2015 to 2019, respectively. The wild bee abundance in forest land and rainfed cropland decreased by varying degrees. The spatial aggregation characteristics of pollinator abundance in litchi and longan orchards demonstrated an increase in cold spots, whereas the hot spots decreased and were more dispersed. In the study area, the area change and land-use change of natural or semi-natural habitats, such as forest land, rainfed cropland, and grassland, affected the pollination services for litchi and longan orchards. Within the types of changing land-use, the change of forest land has the greatest impact on litchi and longan pollination services. The impact degrees of Forest land area, rainfed cropland area, area under litchi and longan orchards, and forest landscape fragmentation on the pollination services for litchi and longan orchards were 0.20, 0.16, 0.21, and 0.26, respectively.

1. Introduction

Ecosystem services are the benefits obtained by human beings from ecosystems, and they form the basis of human survival. They are also closely related to human well-being [1,2,3]. The results of the Millennium Ecosystem Assessment [4] showed that the Earth’s natural ecosystems provide services worth approximately 15 trillion pounds per year to humans. Pollination is a basic ecosystem service that plays an important role in crop yields and food security [5]. Globally, 85% of flowering plants require animal pollination [6]. Pollinator-dependent crop production in global agriculture has increased by 300% in the last 50 years, making human survival more reliant on the food supply brought about by pollination [7].
In recent years, an increasing number of international organizations and scholars have begun to study the impact of land use and its changes on pollination services. Globally, numerous cases have demonstrated that land-use change, intensive agricultural management, pesticide use, environmental pollution, invasive alien species, pathogens, and climate change have the most negative impacts on pollinators [8]. In response to the decline in the number of pollinators and the loss of pollination services, the Intergovernmental Science-Policy Platform on Biodiversity and Ecosystem Services (IPBES), a follow-up to the Millennium Ecosystem Assessment (MEA) and a policy driven by the United Nations Environment Programme (UNEP), have taken up ‘pollinator, pollination, and food production assessment’ as a top priority for rapid assessments in the program of work from 2014–2018, with ‘multiple threats, drivers, and mitigation measures such as land-use change’ as the main component in 2013.
Studies have found that the habitat loss and fragmentation caused by land-use change are the most important factors driving the decline of pollinators [9,10,11]. In terms of the impact of land-use change on pollination services, some scholars have emphasized habitat factors and studied pollination services from the perspective of habitat isolation [12] and habitat fragmentation [13]. For example, Ricketts et al. conducted a meta-analysis of 23 studies on 17 crops across five continents [12]. The results showed that habitat isolation had a significantly negative impact on the abundance of wild bees. Tscharntke et al. found that habitat allocation in broken landscapes only affected populations in simple landscapes, but not those in complex landscapes [13]. Other scholars have studied the impacts of landscape heterogeneity, habitat type, habitat loss, and different degrees of disturbance on pollinators in forest land, and have proposed countermeasures such as improving the diversity of the habitat types of pollinators, adopting low-intensity habitat management methods, and planning the landscape heterogeneity of different geomorphologic types [14,15,16,17].
Using the concept model of land-use and pollination service evaluation proposed by Kremen et al. [18], the pollination module of the Integrated Valuation of Ecosystem Services and Trade-offs (InVEST) model has been widely used. The research focus has shifted from land-use change and the spatialization of pollination services to a quantitative relationship between land-use change and pollination services [11,19,20,21]. Based on the land-use map, this module derives an index of the abundance of wild bees in the region by using the nesting preference of wild bees for different land-use types, the availability of floral resources for different land-use types, and the foraging distances of wild bees. The index of the abundance of wild bees was used to represent the value of pollination services in litchi and longan orchards.
Currently, there are some shortcomings with respect to the impact of land-use changes on pollination services. For example, when relevant data, such as the pollinator species and floral plant species, are applied to different regions using large amounts of empirical data, the accuracy of calculating the pollinator abundance index is reduced, which will cause the evaluation results of land-use change on pollination service to be inconsistent with reality. Additionally, research on the influence mechanism of land-use change on pollination services is currently insufficient. Based on land-use and related biophysical data, this study used the InVEST model to evaluate the regional pollination services quantitatively and spatially. Furthermore, this study explored the influence mechanism of land use and its change on the pollination services for longan and litchi. Through remote sensing interpretation and field investigation, further basic data, such as litchi and longan orchard patches, the pollinator species of litchi and longan, and the number of pollinators and flowering plants with different land-use types, were obtained to improve the accuracy of the evaluation of the pollination services.

2. Materials and Methods

2.1. Study Area

Huizhou is located between 22°24′–23°57′ N and 113°51′–115°28′ E and belongs to the subtropical monsoon humid climate zone in South China (Figure 1). The annual average temperature is 22 °C, the annual average precipitation is 1770 mm, and the frost-free period lasts up to 350 days. Forest land accounts for 63.67% of the area of Huizhou, with a forest coverage rate of 90.4%, and is mainly distributed in the eastern and northwestern regions. Irrigated cropland and rainfed cropland are more contiguous, accounting for 16.01% and 7.29% of the area, respectively. Construction land accounted for 7.5% and is primarily distributed in the southwest and central areas. Various land types in the region are conducive to the development of agriculture and forestry. Litchi and longan are highly dependent on pollination. In this study, the relevant biophysical parameters of pollination service evaluations of longan and litchi orchards in the villages, such as the species and number of pollinators for litchi and longan as well as the species of flowering plants and their vegetation coverage, were obtained from a field sampling survey of four typical villages. The villages are located in the town of Jimei, Boluo County. The land-use types and planting structure of the villages are consistent with the overall scenario of Huizhou.

2.2. Data Sources

2.2.1. Remote Sensing Interpretation of Longan and Litchi Orchards

According to the data released by Huizhou Natural Resources Department, litchi and longan orchards accounted for 22.54% of all orchards in Huizhou in 2019. The dependence of litchi and longan on insect pollination was 0.97 and 0.81, respectively [22]. Therefore, the pollination services of insects have an important impact on the yield of litchi and longan. We could more effectively study the impact of land-use change on pollination services in litchi and longan orchards in across a large-scale area. Referring to Wang et al. [23], this study used Sentinel-2A optical images to identify the samples of litchi and longan orchards (Table S1) in Huizhou. Sentinel-1A radar images were used to calculate the backscattering and coherence coefficient of the land class to improve its classification accuracy. Images were obtained from the Copernicus Open Access Hub (previously known as Sentinel Scientific Data Hub) (https://scihub.copernicus.eu/, accessed from May to December 2015 and from March to December 2019). The preprocessed images were first fused, and the classification and information extraction of litchi and longan orchards in Huizhou was realized using the support vector machine (SVM) classification according to the number of samples and their attribute characteristics (Figure 2). The overall accuracy of the classification in 2015 and 2019 was 92.61% and 93%, respectively, and the Kappa coefficients were 0.88 and 0.89, respectively. The classification accuracies for the litchi and longan orchards were 79.79% and 83.72%, respectively, and the classification accuracy for other land types was more than 70%.

2.2.2. Biophysical Data for the Evaluation of Pollination Services

The population data of pollinators for litchi and longan were obtained by field surveys using the sweeping net method [24,25]. The biophysical parameters of wild bees, such as the body length of wild bees, the activity of wild bees in different seasons, and the preference of wild bees for nesting in different land-use types, come from the literature, books [26,27], and the China Bee Database, Institute of Zoology, Chinese Academy of Sciences (http://www.zoology.csdb.cn/dba/cnbee, accessed on 29 May 2022).
The nesting suitability of the land-use types was expressed by the diversity of pollinators within the land-use types. The diversity data of pollinators in the land-use types were obtained using the trap method through field sampling surveys [28]. The data on species and vegetation coverage of floral plants were obtained using the two-point sampling method and five-point sampling method [29]. Data on the ability of the plants to provide nectar and pollen were obtained from relevant books [30].

2.2.3. Land-Use Data

The data for remote sensing interpretation of the land use were obtained from the Resource and Environment Science and Data Center, Chinese Academy of Sciences (http://www.resdc.cn/, accessed in 2015 and 2020), with an accuracy of 30 × 30 m. In this study, five first-class classifications were reserved for forest land, grassland, water bodies, construction land, and unutilized land, and two second-class classifications for irrigated cropland and rainfed cropland.

2.3. Methods

2.3.1. InVEST-Pollination Module

The Pollination module of the InVEST model first simulates the nesting suitability and availability of floral resources of land-use types in the landscape by using the nesting preference of wild bees, the abundance of flowering plants, and the biophysical parameters of wild bees such as in different land uses. The biophysical parameters are the activity of wild bees in different seasons, their foraging distance, and the relative abundance of wild bees. The module then estimates the abundance index of wild bees. The abundance index is between 0 and 1, and a higher value, which means closer to 1, indicated higher wild bee abundance. The abundance index of wild bees is used to represent the value of pollination services, to quantitatively evaluate the regional pollination service [31]. The abundance index of wild bees is expressed by the following equation [32]:
P x β = N j m = 1 M F j m e D m x α β m = 1 M e D m x α β
In this equation, P x β is the abundance index of wild bees; N j is the nesting suitability of land-use type j, and F j is the availability of floral resources of land-use type j; D m x is the Euclidean distance between the grid unit m and x; and α β is the expected foraging distance of wild bee β.
In this study, the main pollinators of litchi and longan referred to the results of field sampling surveys, as shown in Table S2 in the Supplementary Materials, including 16 pollinators. The Pollination module sets wild bees as important pollinators, without considering cultivated bees. Therefore, this paper only studies the pollination services of litchi and longan of six main wild bees.
Foraging distance, the seasonal activity of the six main wild bees, and the proportion of wild bees are shown in Table S5 in the Supplementary Materials. The foraging distance of the pollinators was calculated according to Gathmann [33]. The seasonal activity index of wild bees was found to be between 0 and 1, and a higher value indicated stronger activity. The proportion of wild bees was obtained from field sampling surveys.
Table S6 in the Supplementary Materials shows the nesting suitability and availability of floral resources of land-use types. The nesting suitability index ranged from 0 to 1, and the larger the value, the more suitable it was for wild bee nesting. The availability index of floral resources ranges from 0 to 1, and the greater the value, the more floral resources.

2.3.2. Hotspot Analyses

Hotspot analyses are widely applied in ecological analyses, and they were used to identify the locations of statistically significant hotspots and cold spots. Hotspots and cold spots are statistically significant spatial clusters of high values and low values, respectively [34]. The G i   index is the coefficient for Hotspot analyses. It is based on partial spatial autocorrelation using a distance weighted matrix, which can detect aggregates of high-value areas and low-value areas [20]. The G i   can be standardized to Z G i . The G i and Z G i   index are expressed by the following equation [35]:
G i = j n w i j x j j n x j
Z G i = G i E G i V A R G i
In these two equations, n is the total amount of the spatial unit, x j is the attribute value of the spatial unit in a partial spatial area, w i j is the distance weight between units i and j, E G i   is the mathematical expectation of G i , and V A R G i is the variance of G i [20].
In addition, <−1.65 or >+1.65, <−1.96 or >+1.96, and <−2.58 or >+2.58 are critical Z G i -scores for 90, 95, and 99% confidence levels, respectively.

2.3.3. Geographical Detector (Geodetector)

Geodetector (http://www.geodetector.org/, accessed in 2015) was created by Wang et al. [36] and used in this study to detect the main influencing factors of the pollination services for litchi and longan orchards and to reveal the underlying driving mechanism. The Geodetector uses q-statistics to measure the impact degree of independent variable X (influencing factors) on dependent variable Y (pollination service). Q-statistic was calculated as follows [37]:
q = 1 h = 1 L N h σ h 2 N σ 2
where h = 1, 2, …, L is a given class (stratum) of an independent variable; L is the number of classes; N h and N are the numbers of samples in class h and entire study area, respectively; and σ h 2 and σ 2 are the variance of dependent variable in class h and the entire study area, respectively. Ranging from 0 to 1, the higher the q value is, the stronger the influence of this factor on the dependent variable. Otherwise, the influence is weaker [38]. By estimating the value of q-statistic corresponding to the interaction of two independent variables, Geodetector can also quantify the degree of the interactive impact of each pair of conditioning factors on the dependent variable [39]. As is shown in Table 1, based on the comparison of this value with the individually estimated values, the type of interaction can be then determined.

3. Results

3.1. Land Use and Its Change in Huizhou

3.1.1. Characteristics of Land-Use Changes

During 2015–2019, the area of the land-use types suitable for nesting by pollinators and that of the land-use types with floral resources demonstrated a downward trend. Specifically, the irrigated cropland area decreased by 22.11 km2, and the forest land and rainfed cropland decreased by 16.9 km2 and 15.42 km2, respectively (Table 2, Figure 3). Forest land was still dominant in Huizhou, whereas the construction land area exceeded that of rainfed cropland, increasing by 65.48 km2 (8.39%). The increased area of construction land is primarily attributed to the transfer of forest land, irrigated cropland, and rained cropland (the transferred areas are 25.20 km2, 24.35 km2, and 18.40 km2, respectively), which are concentrated in the central and southwestern regions of the study area. The area of the constructed land converted to forest land was 8.85 km2, which was distributed in the central region. Due to the implementation of ecological restoration in large quarries, the forest land resources have increased to some extent.

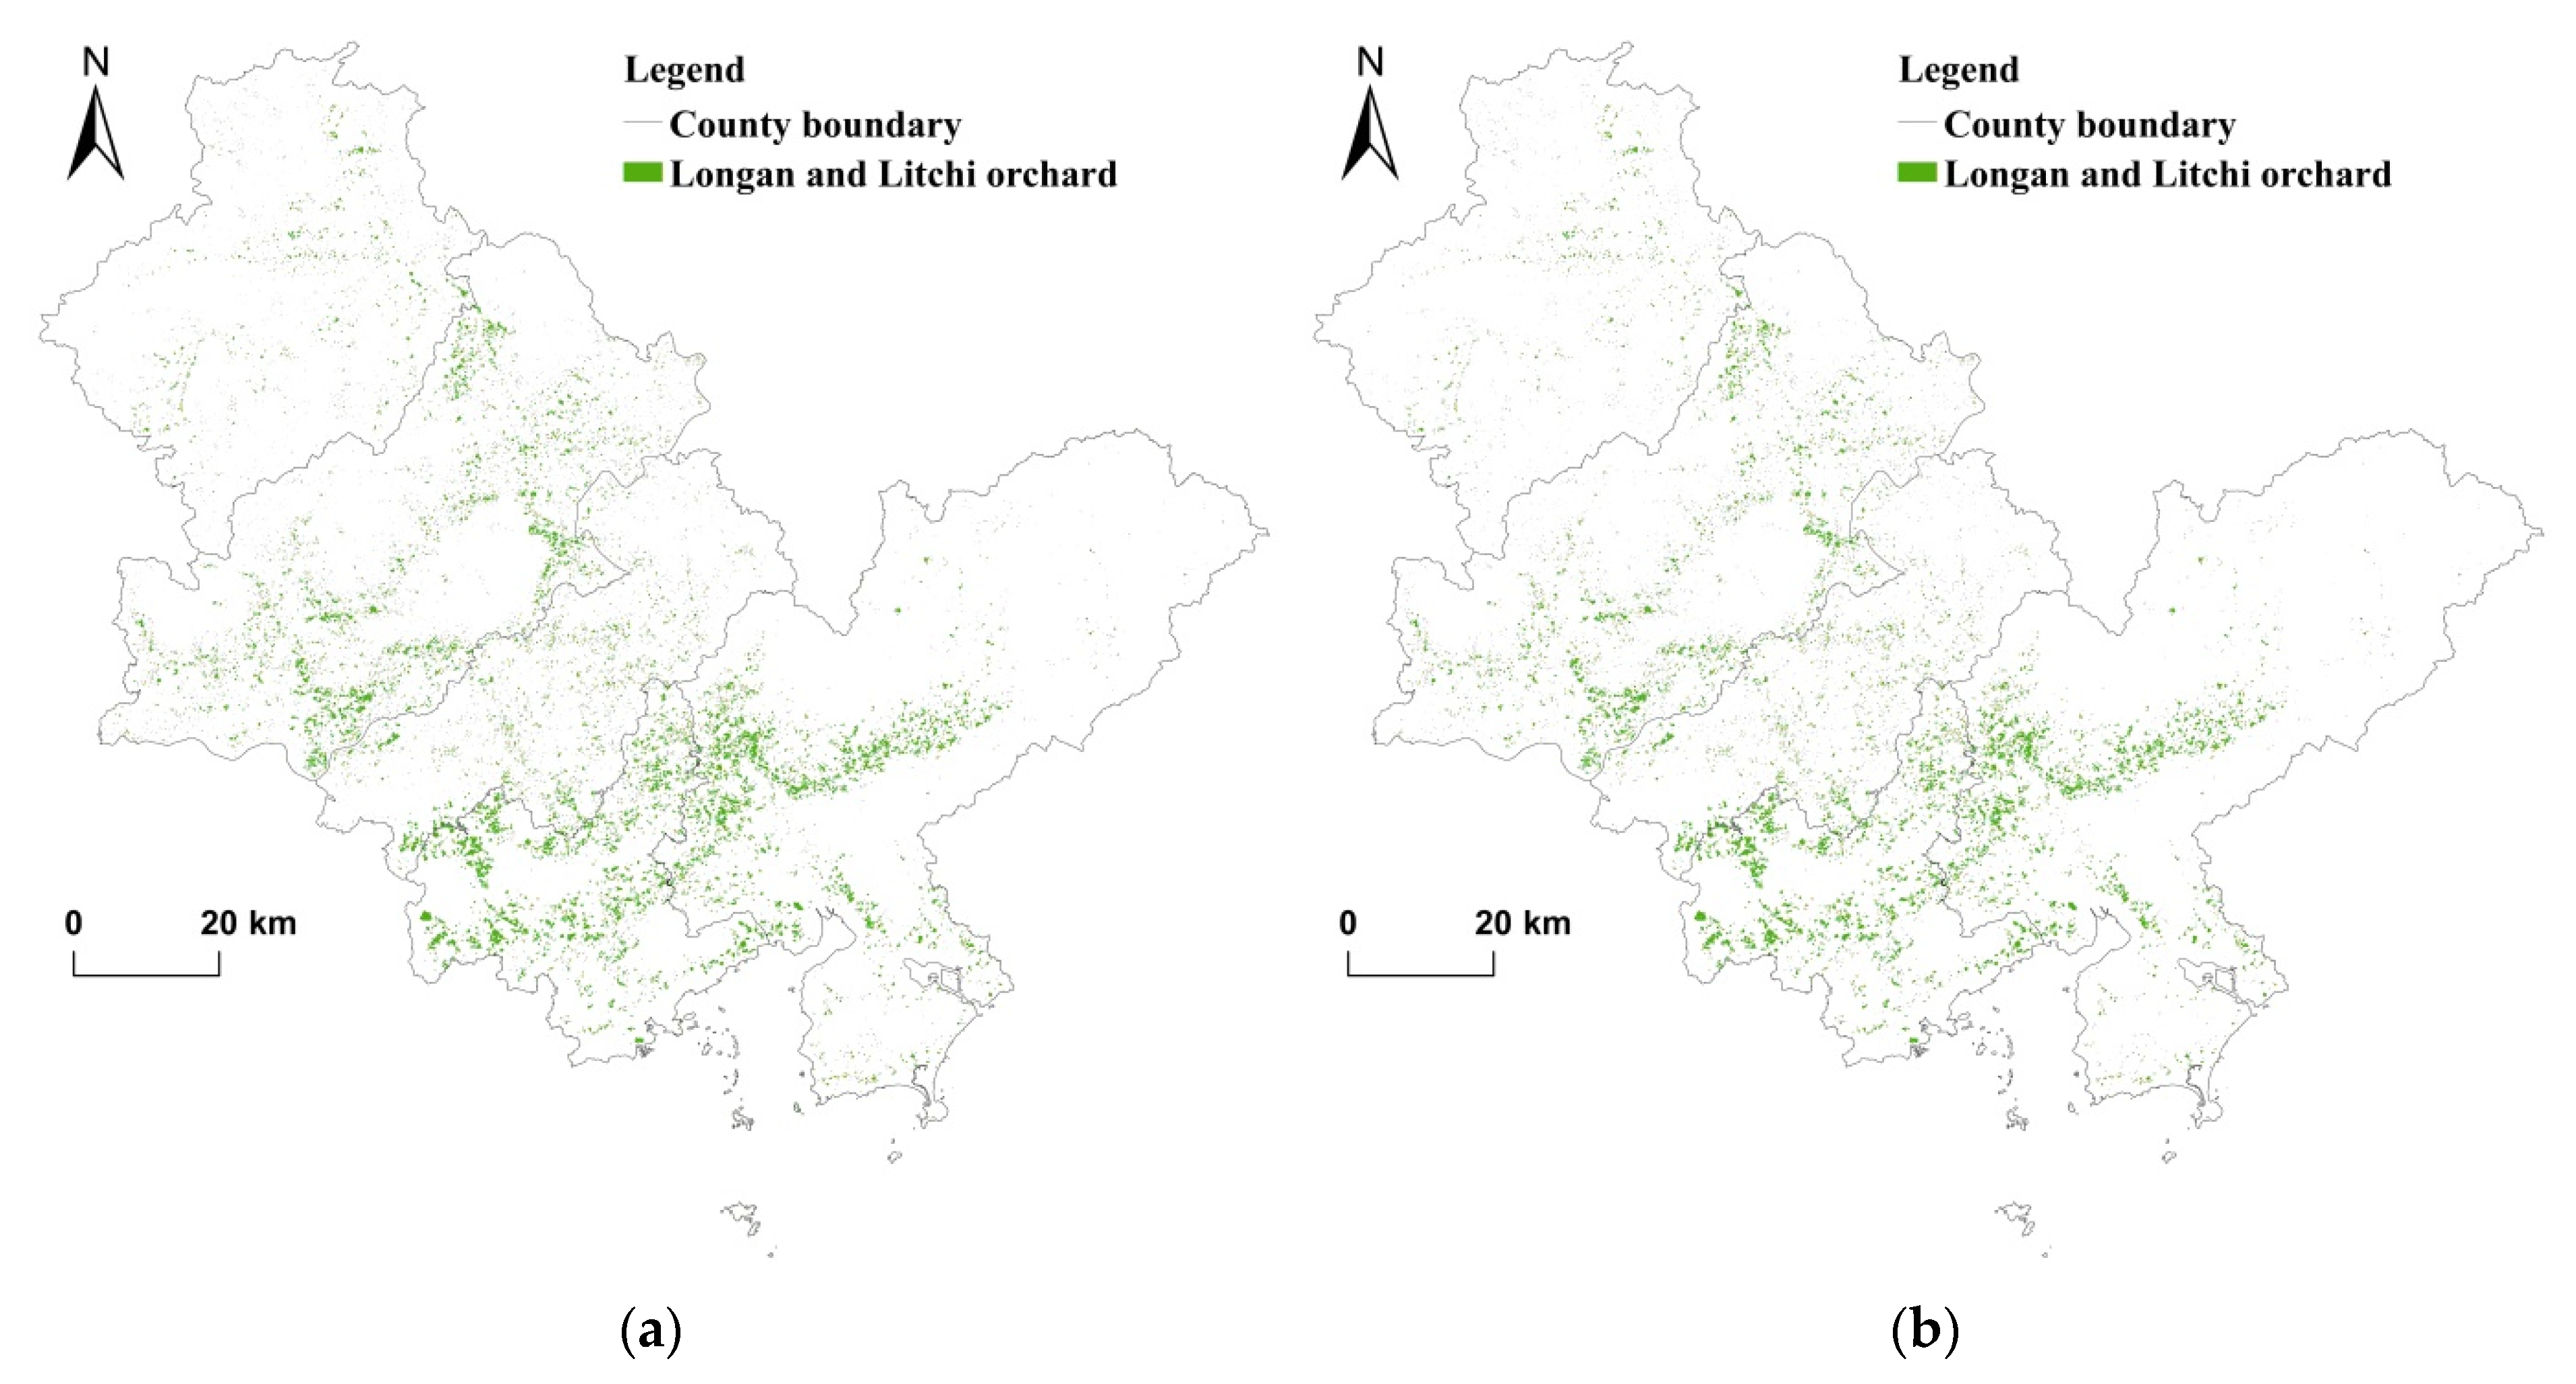
3.1.2. Longan and Litchi Orchards and Their Characteristics

Longan and litchi orchards in Huizhou are mainly distributed in the low-altitude areas. Along with the rural residential areas and farming areas, they have a zonal distribution, which is widely dispersed and fragmented (Figure 4). The orchards are densely distributed in the central, western, and southwestern regions, and are rarely distributed in the northern Luofu and Nankun Mountains, the central Xiangtou Mountain, and the eastern Lianhua Mountain.
In terms of quantity, during 2015–2019, the area of the orchards decreased by 31.72 km2, which is a reduction of 12.22%. In terms of spatial distribution, the decreasing areas of the orchards were concentrated in the central, western, and southwestern regions. The overlap ratio of the reduction in the area of the orchards and that of rural expansion reached 33.86%, which was primarily distributed in the western and urban regions of the study area, and adjacent to the economically developed areas. The overlap area between the area of reduction of the orchards and the planting area of cultivated land was as high as 15.06 km2, and the scale ratio was as high as 47.48%. This is primarily distributed in the agricultural counties of the study area.

3.2. Characteristics of the Spatiotemporal Change of Wild Bee Abundance of Litchi and Longan in Huizhou

3.2.1. Characteristics of Quantitative Change of the Wild Bee Abundance of Litchi and Longan

Since the foraging distance of wild bees is 1000 m, the research scope was set to litchi and longan orchards and their outward extension area (buffer zone). Then, the abundance of wild bees in litchi and longan orchards and their buffer zone was counted. As is shown in Table 3, the results demonstrated that the total wild bee abundance in the buffer zone decreased by 13.94% between 2015 and 2019, whereas the abundance decreased by 6.64% in the litchi and longan orchards. The wild bee abundance in forest land or rainfed cropland in the buffer zone and the entire region decreased by varying degrees. However, the rate of change of wild bee abundance in forest land in the buffer zone was greater than that in the whole region, and that in rainfed croplands in the whole region was greater than that in the buffer zone.

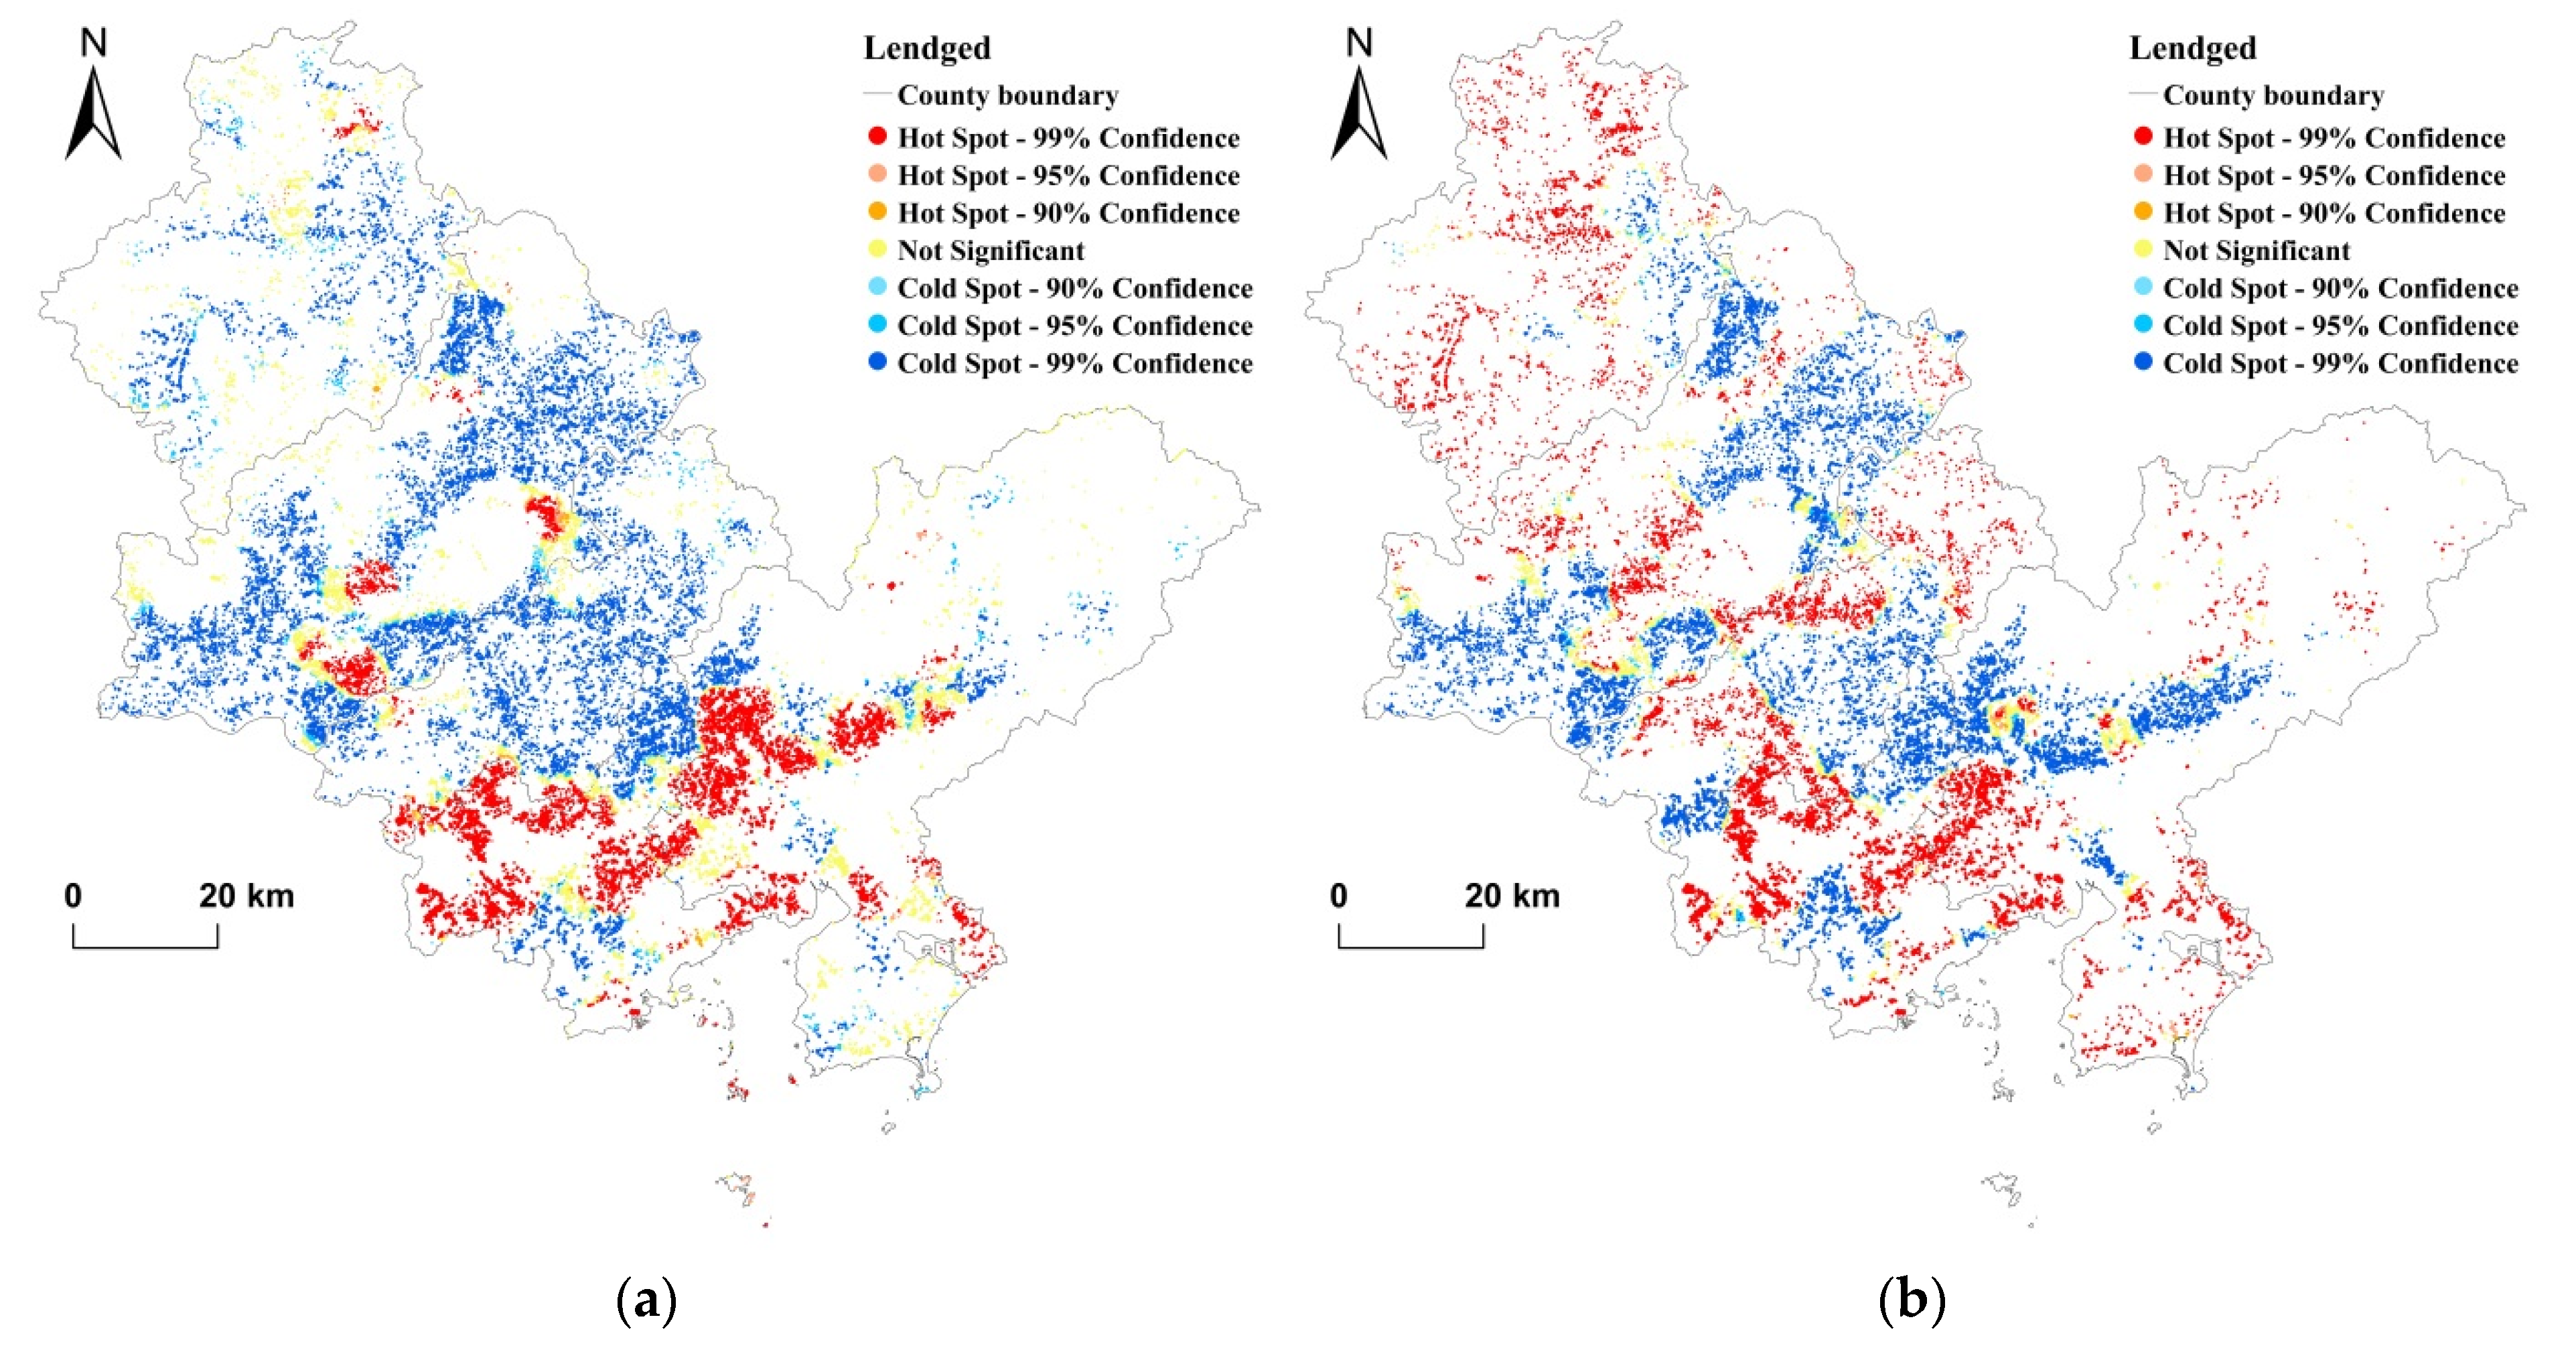
3.2.2. Changes in the Spatial Pattern of Wild Bee Abundance for Litchi and Longan Orchards in Huizhou

As is shown in Figure 5, the hotspots of wild bee abundance decreased significantly from 2015 to 2019, whereas the cold spots increased slightly. From the perspective of spatial distribution, the hotspots are closely related to the distribution of litchi and longan orchards. These orchards were mostly located at the foot of the mountain and adjacent to the forest land, which provided suitable nesting sites. The cold spot areas were mainly distributed in farming and built-up areas. The hotspots of wild bee abundance become dispersed in the midwestern and southwestern regions. In the central region, some cold spots were converted to hot spots.

3.2.3. Influencing Factors Analysis of Pollination Service for Litchi and Longan Orchards

The results of the Geodetector analyses are shown in Table 4. The forest land area, rainfed cropland area, litchi and longan orchards area, and forest landscape fragmentation were the dominant influencing factors of the pollination services for litchi and longan orchards, whose impact degrees on the pollination services were 0.20, 0.16, 0.21, and 0.26, respectively. Other Influencing factors did not have a significant effect on the pollination services. Forest land area and litchi and longan orchards area jointly affected the pollination services for litchi and longan orchards, and the degree of the interactive impact of these two factors on the pollination services was 0.50, which was the maximum interactive impact degree.

3.3. Effects of Land-Use Change on the Pollination Services for Litchi and Longan Orchards

As shown in Table 5, the abundance index of wild bees in forest land decreased by 2.03 as the forest land area decreased by 16.90 km2. As shown in Table 6, the conversion of forest land to irrigated cropland per 1 km2 reduced the abundance index of wild bees by 1.55. The reasons for the decrease in wild bee abundance in the orchards may be summarized as follows. First, the large-scale decrease in the litchi and longan orchards led to a reduction in the nectar-pollen resources in the region. Second, a large amount of construction land occupied suitable nesting sites for wild bees and floral resources. The superposition of the two reasons resulted in a decrease in the wild bee abundance of litchi and longan in forestland. Moreover, the litchi and longan orchards are primarily distributed along the foot of the mountain, and the decrease in their area has a greater impact on the wild bee abundance in the adjacent forest land. Therefore, the rate of change in the wild bee abundance of litchi and longan in the buffer zone was greater than that in the whole region (Table 3).
From the perspective of spatial distribution (Figure 5), the hotspots are closely related to the distribution of litchi and longan orchards. These orchards were mostly located at the foot of the mountain and adjacent to the forest land, which provided suitable nesting sites. The abundance of wild bees was extremely high considering the large number of nectar-pollen resources in the orchards. The cold spot areas were mainly distributed in farming and built-up areas. Here, the wild bee abundance of the litchi and longan orchards was low due to the flat terrain, the cross-distribution of cultivated and construction lands, and the penetration of water areas. The hotspots of wild bee abundance become dispersed in the midwestern and southwestern regions. These two regions were the main areas with a reduction in the litchi and longan orchards, and the main areas where forestland and rainfed cropland were converted to construction land. The primary reasons for this may be a reduction in the nectar-pollen plant resources and habitat fragmentation. In the central region, some cold spots were converted to hot spots because of the ecological restoration carried out in this region. Construction land was converted to forest land, resulting in an increased habitat for wild bees, thereby increasing the abundance of the wild bees of the litchi and longan orchards.
A summary of this section is as follows: The areas where the pollination services decreased and increased significantly were mainly concentrated in the central, southwestern, and southeastern parts of the study area. The reason for the decrease was that forest land and rainfed cropland were converted to construction land, and the reason for the increase was that construction land was converted to forestland and rainfed cropland. Among the forest land, grassland, and rainfed cropland, the wild bee abundance for litchi and longan orchards decreased in forest land and was the highest for every unit reduction.

3.4. Influence Mechanism of Land-Use Change on the Pollination Services for Litchi and Longan Orchards

The Pollination module of the InVEST model estimates the abundance index of wild bees by using the nesting preference of wild bees, the abundance of flowering plants in different land uses, and the foraging distances of wild bees. The abundance index of wild bees was used to represent the value of pollination services for litchi and longan orchards. Therefore, the change in land-use types will directly affect the results of the abundance index of wild bees. In the study area, the land-use types with a high nesting suitability and availability of floral resources are converted to the land-use types with low nesting suitability and availability of floral resources, such as forest land converted to construction land, which will reduce the nesting suitability and availability of floral resources. The results will reduce the abundance of wild bees. In the study area, the area change and land-use change of natural or semi-natural habitats, such as forest land, rainfed cropland, and grassland, affected the pollination services for litchi and longan orchards. The reduction of forest land area and the conversion of forest land to construction land have the greatest impact on the pollination service of litchi and longan orchards (Table 5 and Table 6). In the study area, the impact degrees of forest land area and forest landscape fragmentation on the pollination services of litchi and longan orchards were 0.20 and 0.26, respectively (Figure 6). The degree of the interactive impact of forest land area and litchi and longan orchards area on the pollination services was 0.50 and that of forest fragmentation degree and litchi and longan orchards area on the pollination services was 0.44. It is again confirmed that in the change of land-use types, the change of forest land had the greatest impact on the pollination service of litchi and longan orchards in the study area.

4. Discussion

4.1. Comparison of the Results with Other Studies

Our research shows that the change of forest land has the greatest impact on the pollination service of litchi and longan orchards in the study area. However, Groff et al. suggested that the proportion of deciduous/mixed forest was positively correlated with bee abundance, while the proportion of coniferous forest was negatively correlated with bee abundance [40]. This paper did not consider that the effects of different types of forest land on pollination services in litchi and longan orchards might be different. In future studies, the assessment results of pollinator abundance can be more comprehensive by refining the land classification.
This paper shows that area change and land-use change of natural or semi-natural habitats affect the pollination services for litchi and longan orchards in the study area, which is consistent with the research results of many scholars [18,21,41,42]. However, our research does not consider the climatic factors. According to the research results of Polce et al. [43], the climate is one of the most important factors affecting the distribution of the pollinators. Therefore, the determination of a method for incorporating climate factors into the assessment system based on the InVEST model is an important research direction. Another analysis result of this paper is that landscape fragmentation has a great impact on the pollination services in the study area, which is consistent with the research results of Garibaldi et al. [44] and Tscharntke et al. [13]. However, Kennedy et al. found that the effects of landscape configuration on bee abundance were weak [42]. The difference between the results of this study and that of Kennedy et al. may be related to the scale of the study area.

4.2. Methods Application and Improvement

In this study, further basic data for the pollination service evaluation were obtained through remote sensing interpretation and field investigation, and the accuracy of the pollination service evaluation was improved. This study used the InVEST model to evaluate the regional pollination services quantitatively and spatially. Furthermore, the influence of land use and its change on the pollination services for litchi and longan was discussed using the Geodetector. However, a limitation of this study is that although some important parameters (such as the population data of pollinators in litchi and longan orchards) were derived from the survey, several parameters (such as the foraging distance of the pollinators) were derived from empirical values, which require further validation. Groff et al. evaluated the InVEST Crop Pollination model performance with parameters informed by four approaches and found that uninformed optimization improved model performance by 29% compared to an expert opinion-informed model, while a sensitivity-analysis informed optimization improved model performance by 54% [40]. In future studies, we can learn from their proposed methods to obtain these parameters and improve the credibility of pollination service assessment results. Polce et al. integrated a species distribution model (SDM) with a pollination service model (PSM) to derive the availability of pollinators for crop pollination and combined the Lonsdorf model [32] to derive the pollination services [43]. One of the innovations in their approach was the application of pollinator records data rather than expert knowledge to predict the pollinator occurrence [43], which can improve the accuracy of pollination service evaluations. In this study, further basic data—such as the pollinator species of litchi and longan, and the number of pollinators and flowering plants with different land-use types—for the pollination service evaluation were obtained through the field sampling survey, and the accuracy of the pollination service evaluation was improved. When there is a lack of pollinator records, the field sampling survey method used in this paper is of reference value for other studies. Another innovation in their methods is their inclusion of the managed pollinator supply. In contrast, our study only considers the pollination services of wild bees for litchi and longan orchards and not those of domesticated bees, which will inevitably affect the authenticity of the pollination service assessment results. The impact of managed honeybees on pollination services in litchi and longan orchards should be considered in future research. Local farm management and landscape structure are two drivers which influence wild bee abundance [18]. This paper does not include agricultural management in the assessment of the pollination services for litchi and longan orchards. In the future, we must consider the influence of field type and field diversity [42] on pollination services in litchi and longan orchards.
The InVEST-pollination module represents pollination services based on the abundance of pollinators and has not yet been able to evaluate the quantity of the supply capacity of pollination services. Future research may further realize the conversion from assessments of pollinator abundance to assessments of the quantity of pollination services. At the same time, due to the lack of influencing factors outside the study area on pollination services, pollination services around the region may be underestimated. Future research may address this issue by expanding the study area outward (buffer zone) and incorporating it into the assessment.

5. Conclusions

(1)
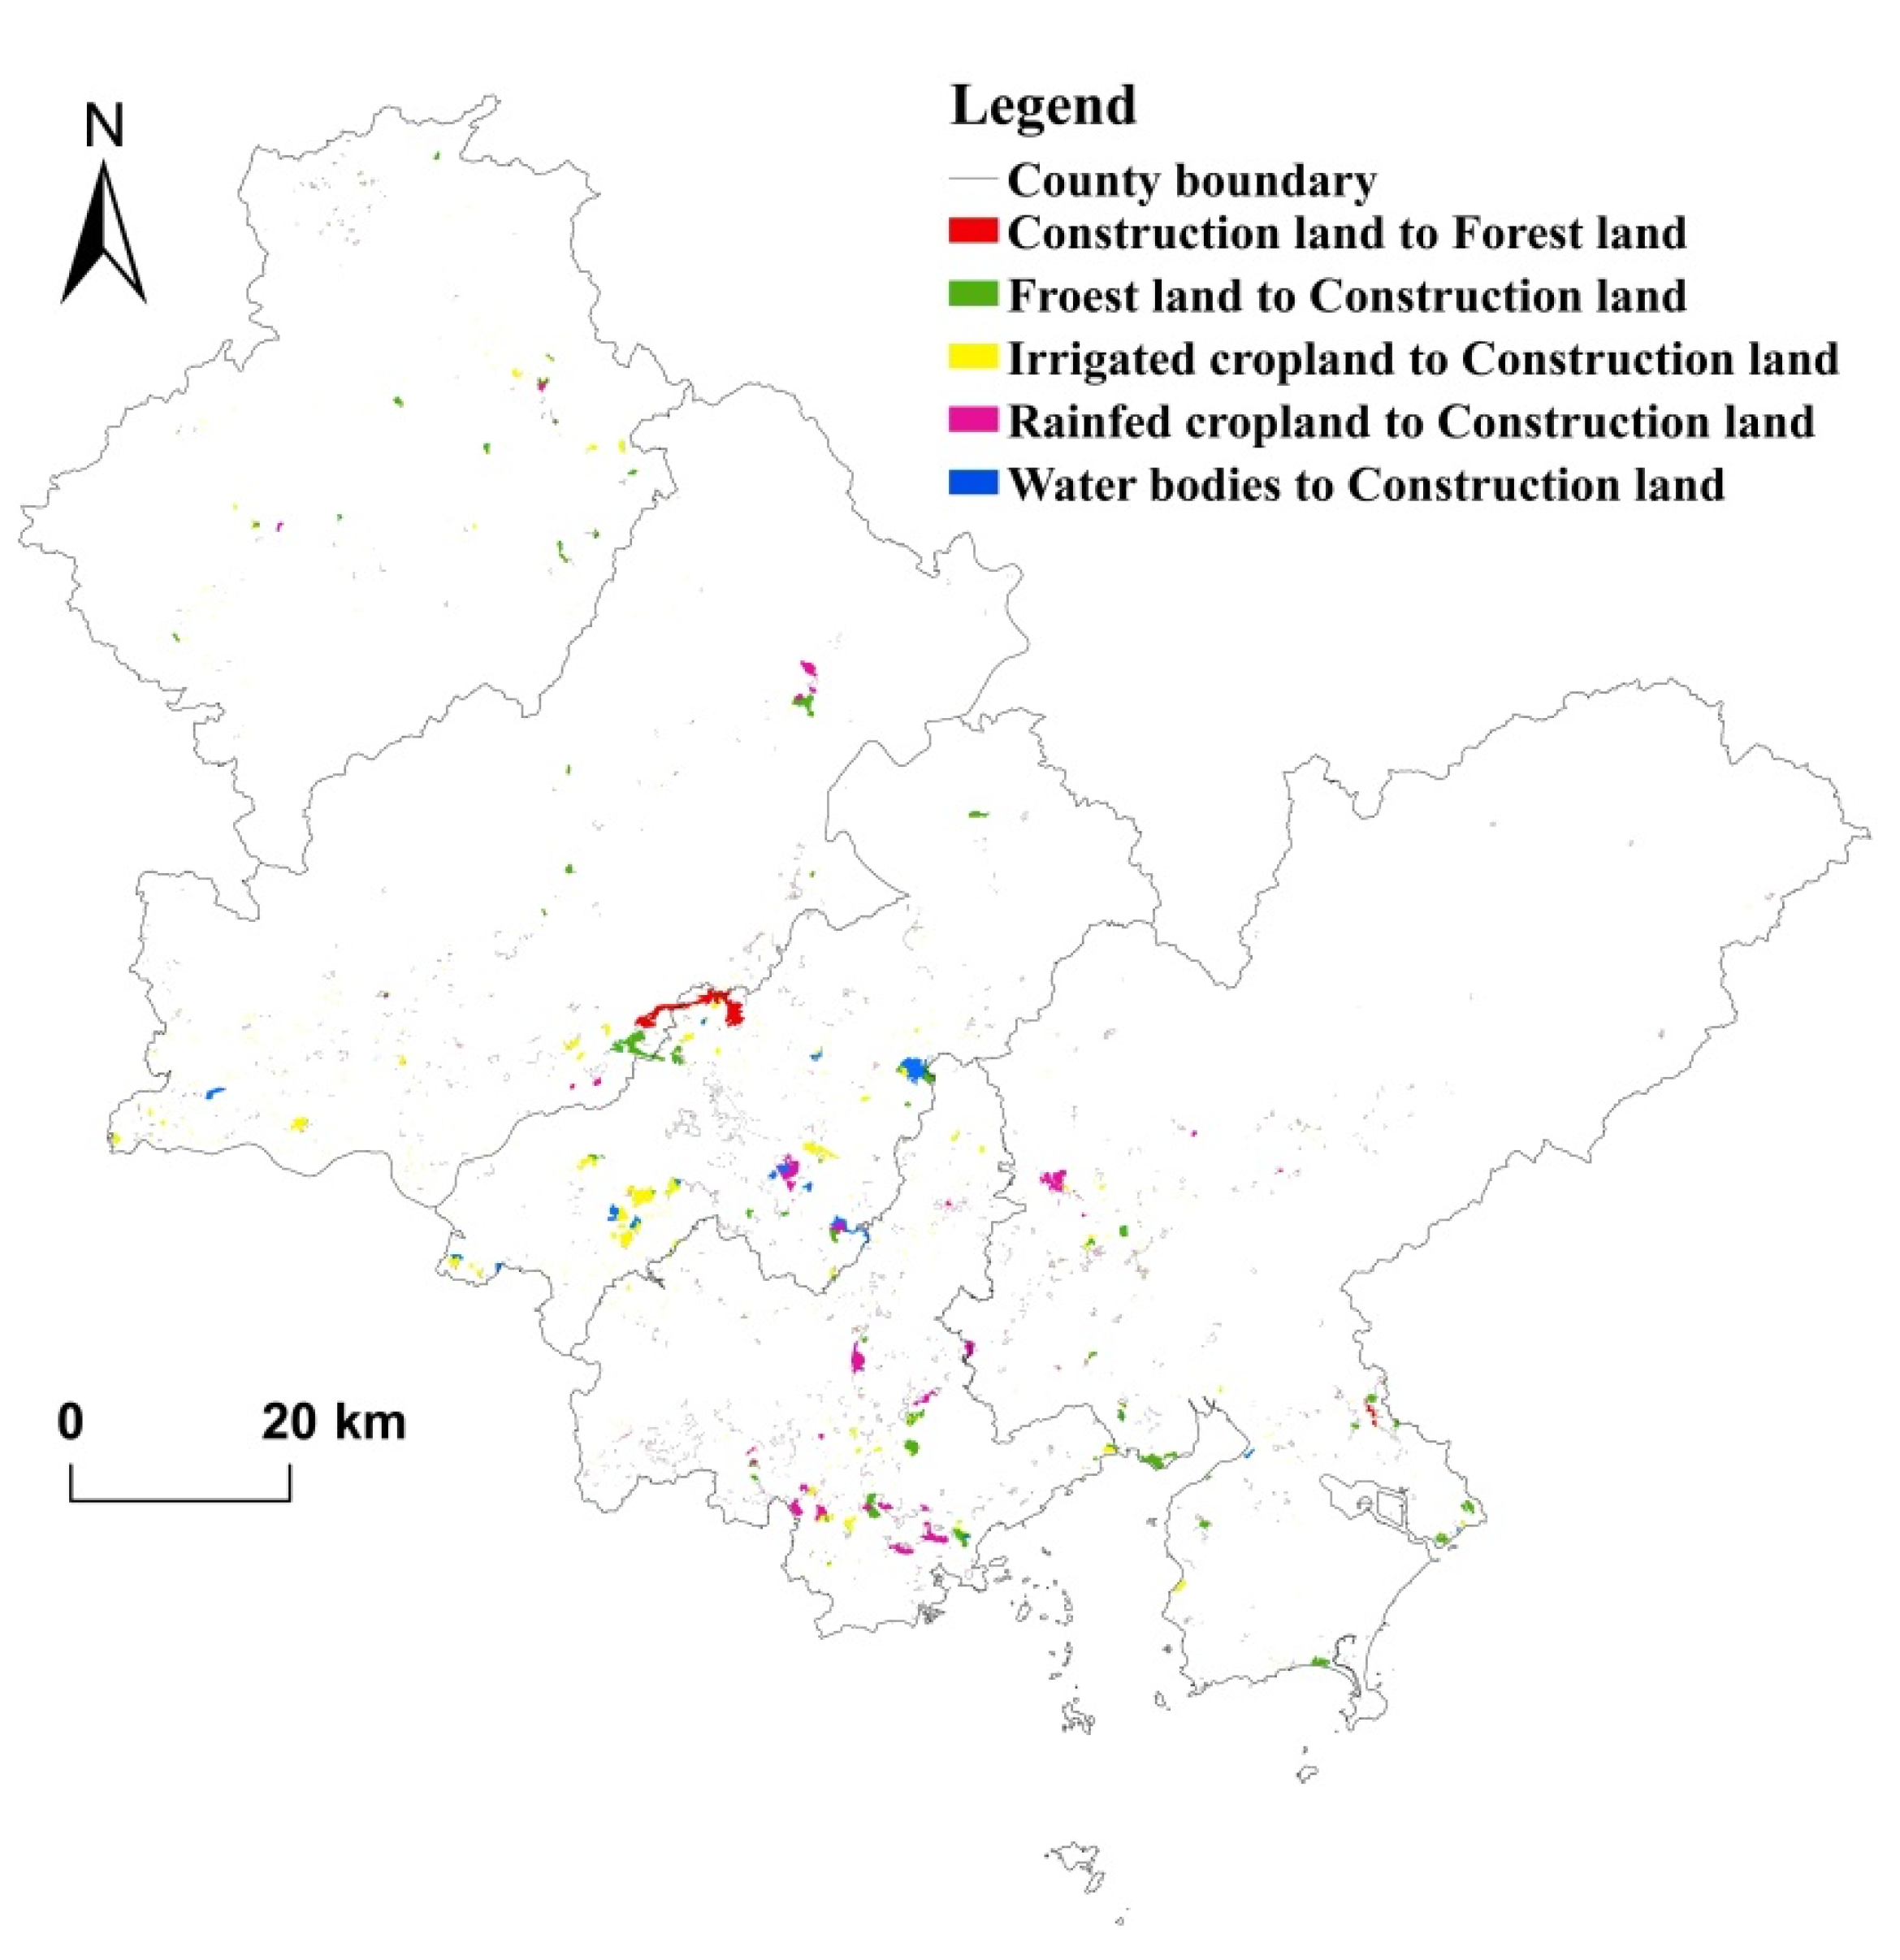
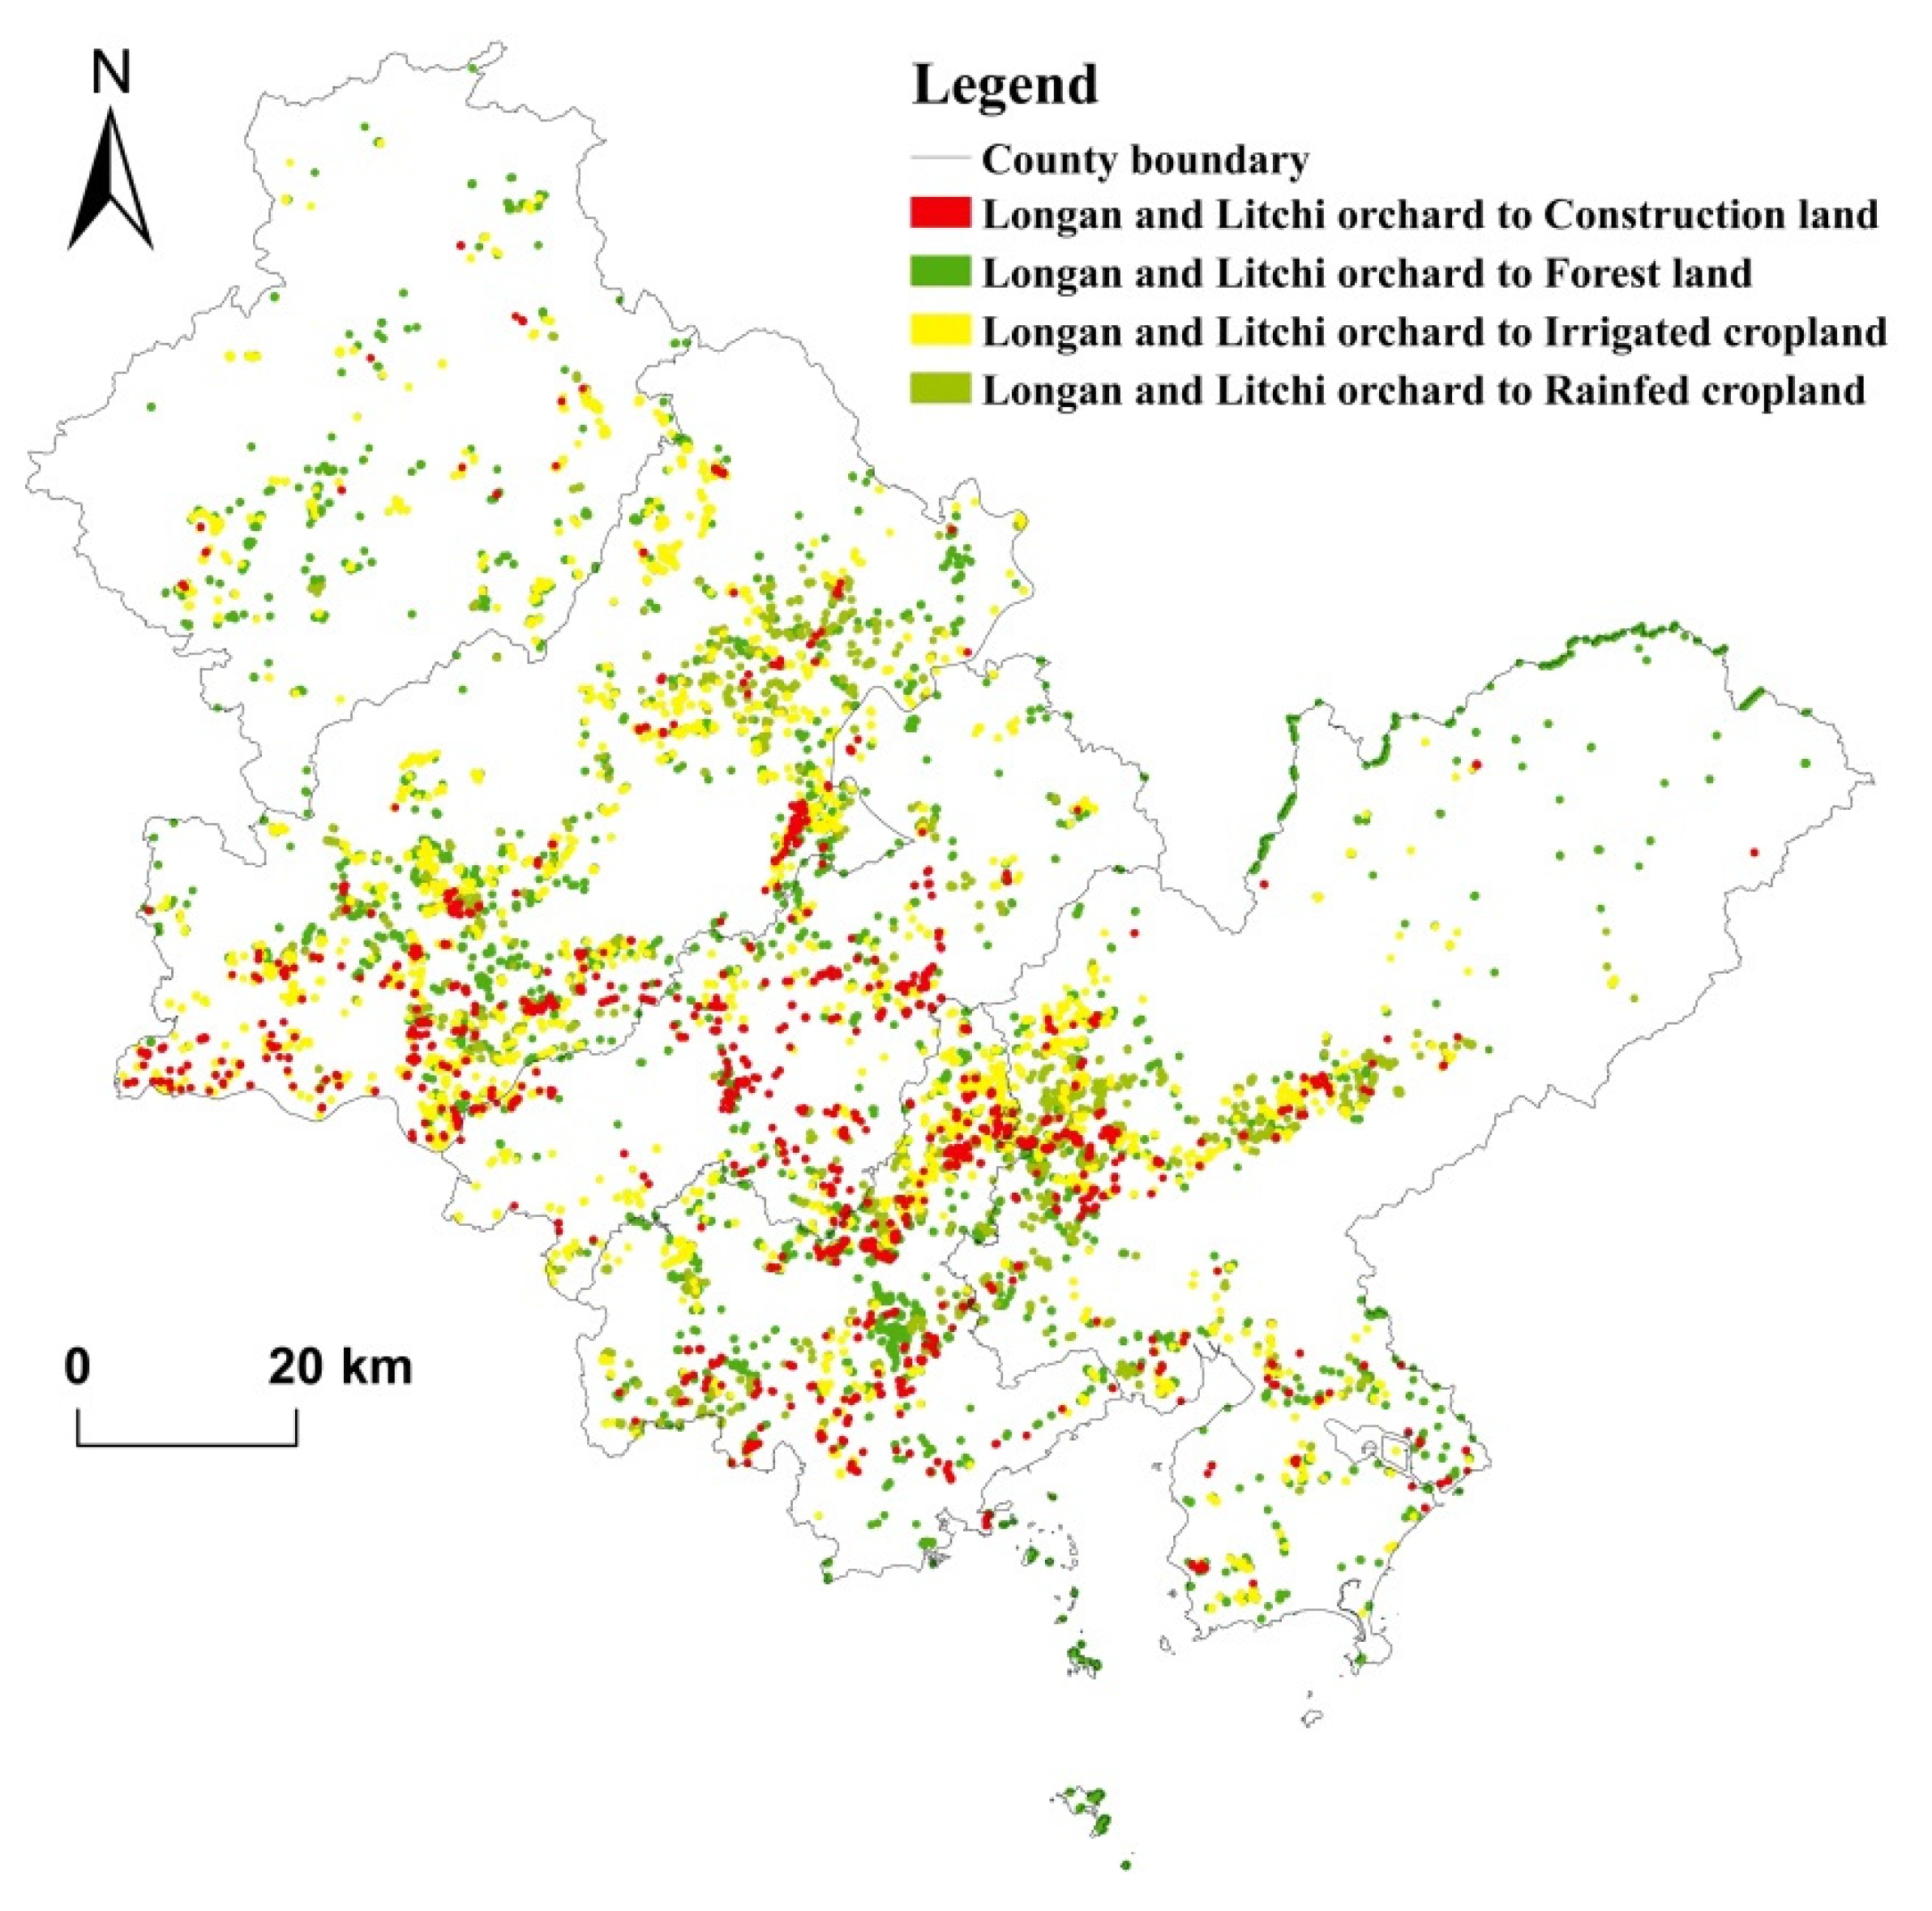
The area of land use types suitable for nesting by pollinators and the area of land-use types with nectar-pollen plant resources demonstrated a downward trend from 2015 to 2019. Forest land and rainfed cropland were reduced by 16.9 km2 and 15.42 km2, respectively, primarily due to the conversion of these lands to construction land. The reduced area was concentrated in the central and southwest regions. Owing to ecological restorations, 8.848 km2 of construction land was converted to forest land. The area of litchi and longan orchards decreased by 31.72 km2, which is a reduction of 12.22%. The reduction areas were primarily concentrated in the central, western, and southwestern regions.
(2)
The pollinator abundance in the litchi and longan orchards and their buffer zones decreased by 6.64% and 13.94%, respectively, between 2015 and 2019. The pollinator abundance in forest land and rainfed cropland decreased to varying degrees. The cold spots increased in space, whereas the hot spots decreased in size and became more dispersed. The decrease in the pollinator abundance was mainly concentrated in the midwestern and southwestern regions. The main reasons for this may be the decrease in the area of litchi and longan orchards, forest lands, and rainfed croplands, as well as landscape fragmentation.
(3)
Forest land area, rainfed cropland area, litchi and longan orchards area, and forest landscape fragmentation were the dominant Influencing factors of the pollination services for litchi and longan orchards, whose impact degrees on the pollination services were 0.20, 0.16, 0.21, and 0.26, respectively. Forest land area and litchi and longan orchards area will jointly affect the pollination services for litchi and longan orchards, and the degree of the interactive impact of these two factors on the pollination services is 0.50, which is the maximum interactive impact degree. In the study area, the area change and land-use change of natural or semi-natural habitats, such as forest land, rainfed cropland, and grassland, affected the pollination services for litchi and longan orchards. The reduction of forest land area and the conversion of forest land to construction land have the greatest impact on the pollination services of litchi and longan orchards.

Supplementary Materials

The following supporting information can be downloaded at: https://www.mdpi.com/article/10.3390/land11071073/s1, Table S1: Samples of litchi and longan orchards; Table S2: Main pollinators species of litchi and longan; Table S3: The ability of plants to provide pollen and nectar and Vegetation survey results in flowering period of litchi and longan; Table S4: Richness of pollinators in land-use types; Table S5: Biophysical parameters and relative abundance of wild bees in Huizhou, 2015–2019; Table S6: Nested suitability and availability of nectar-pollen plant resources of the land-use types in Huizhou, 2015–2019.

Author Contributions

All authors listed have made a substantial, direct, and intellectual contribution to the work and approved it for publication. All authors have read and agreed to the published version of the manuscript.

Funding

This research was funded by National Social Sciences Foundation of China, grant number 20CGL063.

Data Availability Statement

The data presented in this study are available on request from the authors.

Acknowledgments

Thanks to anonymous experts for their suggestions.

Conflicts of Interest

The authors declare no conflict of interest.

References

  1. Costanza, R.; d’Arge, R.; de Groot, R.; Farber, S.; Grasso, M.; Hannon, B.; Limburg, K.; Naeem, S.; O’Neill, R.V.; Paruelo, J.; et al. The value of the world’s ecosystem services and natural capital. Ecol. Econ. 1998, 25, 3–15. [Google Scholar] [CrossRef]
  2. Daily, G.C. Nature’s Services: Societal Dependence on Natural Ecosystems (1997). In The Future of Nature: Documents of Global Change, 1st ed.; Robin, L., Sörlin, S., Warde, P., Eds.; Yale University Press: New Haven, CT, USA, 2003; pp. 454–464. [Google Scholar]
  3. Assessment, M.E. Ecosystems and Human Well-Being: Wetlands and Water, 1st ed.; World Resources Institute: Washington, DC, USA, 2005; 80p. [Google Scholar]
  4. Assessment, M.E. Ecosystems and Human Well-Being: A Framework for Assessment, 1st ed.; Island Press: Washington, DC, USA, 2003; 245p. [Google Scholar]
  5. Otieno, M.; Steffan-Dewenter, I.; Potts, S.G.; Kinuthia, W.; Garratt, M. Enhancing legume crop pollination and natural pest regulation for improved food security in changing African landscapes. Glob. Food Secur. 2020, 26, 100394. [Google Scholar] [CrossRef]
  6. Ollerton, J.; Winfree, R.; Tarrant, S. How many flowering plants are pollinated by animals? Oikos 2011, 120, 321–326. [Google Scholar] [CrossRef]
  7. Tian, Y.; Lan, C.; Xu, J.; Li, X.; Li, J. Assessment of pollination and China’s implementation strategies within the IPBES framework. Biodivers. Sci. 2016, 24, 1084. [Google Scholar] [CrossRef] [Green Version]
  8. Potts, S.G.; Biesmeijer, J.C.; Kremen, C.; Neumann, P.; Schweiger, O.; Kunin, W.E. Global pollinator declines: Trends, impacts and drivers. Trends Ecol. Evol. 2010, 25, 345–353. [Google Scholar] [CrossRef] [PubMed]
  9. Betts, M.G.; Hadley, A.S.; Kormann, U. The Landscape Ecology of Pollination; Springer: New York, NY, USA, 2019; Volume 34, pp. 961–966. [Google Scholar]
  10. Dalsgaard, B. Land-use and climate impacts on plant–pollinator interactions and pollination services. Diversity 2020, 12, 168. [Google Scholar] [CrossRef]
  11. Rahimi, E.; Barghjelveh, S.; Dong, P. Using the Lonsdorf model for estimating habitat loss and fragmentation effects on pollination service. Ecol. Process. 2021, 10, 22. [Google Scholar] [CrossRef]
  12. Ricketts, T.H.; Regetz, J.; Steffan-Dewenter, I.; Cunningham, S.A.; Kremen, C.; Bogdanski, A.; Gemmill-Herren, B.; Greenleaf, S.S.; Klein, A.M.; Mayfield, M.M. Landscape effects on crop pollination services: Are there general patterns? Ecol. Lett. 2008, 11, 499–515. [Google Scholar] [CrossRef]
  13. Tscharntke, T.; Klein, A.M.; Kruess, A.; Steffan-Dewenter, I.; Thies, C. Landscape perspectives on agricultural intensification and biodiversity–ecosystem service management. Ecol. Lett. 2005, 8, 857–874. [Google Scholar] [CrossRef]
  14. Lázaro, A.; Fuster, F.; Alomar, D.; Totland, Ø. Disentangling direct and indirect effects of habitat fragmentation on wild plants’ pollinator visits and seed production. Ecol. Appl. 2020, 30, e02099. [Google Scholar] [CrossRef]
  15. Olynyk, M.; Westwood, A.R.; Koper, N. Effects of natural habitat loss and edge effects on wild bees and pollination services in remnant prairies. Environ. Entomol. 2021, 50, 732–743. [Google Scholar] [CrossRef] [PubMed]
  16. Wu, P.; Song, X.; Xia, B.; Xu, H.; Liu, Y. Temporal-spatial dynamics of wild bee diversity in agricultural landscapes in Changping District, Beijing. Chin. J. Eco-Agric. 2018, 26, 357–366. [Google Scholar]
  17. Wang, M.; Lu, X.; Cui, Y.; Wang, M.; Ding, S. Effects of woodland types with different levels of human disturbance on pollinators: A case study in Gongyi, Henan, China. Acta Ecol. Sin. 2018, 38, 464–474. [Google Scholar]
  18. Kremen, C.; Williams, N.M.; Aizen, M.A.; Gemmill-Herren, B.; LeBuhn, G.; Minckley, R.; Packer, L.; Potts, S.G.; Roulston, T.a.; Steffan-Dewenter, I. Pollination and other ecosystem services produced by mobile organisms: A conceptual framework for the effects of land-use change. Ecol. Lett. 2007, 10, 299–314. [Google Scholar] [CrossRef]
  19. Zhang, R.; Wang, D.; Zhou, M.; Cai, Y. Pollination service analysis of Chongming wild bee based on InVEST model. J. Anhui Agric. Univ. 2018, 45, 37–44. [Google Scholar]
  20. Sun, C.; Zhen, L.; Wang, C.; Hu, J.; Du, B. Biodiversity simulation of Poyang Lake wetlands by InVEST model under different scenarios. Resour. Environ. Yangtze Basin 2015, 24, 1119–1125. [Google Scholar]
  21. Zulian, G.; Maes, J.; Paracchini, M.L. Linking land cover data and crop yields for mapping and assessment of pollination services in Europe. Land 2013, 2, 472–492. [Google Scholar] [CrossRef] [Green Version]
  22. Liu, P.; Wu, J.; Li, H.; Lin, S. Evaluation of economic value of agricultural bee pollination in China. Sci. Agric. Sin. 2011, 24, 5117–5123. [Google Scholar]
  23. Wang, C.; Li, B.; Zhu, R.; Chang, S. Study on tree species identification by combining Sentinel-1 and JL101A images. For. Eng. 2020, 36, 40–48. [Google Scholar]
  24. Fang, W.; Zen, J.; Jiang, B. Compare the Pollination effects of Litchi chinensis and Dimocarpus longan by Apis mellifera Hgustica and A. cerana cerana. Apic. China 2011, 62, 51–53. [Google Scholar]
  25. Zhong, Y.; Zhao, D.; Gao, J.; Wang, Y.; Liu, J. Study of Pollinating Insect of Dimocarpus longana. Apic. China 2014, 65, 61–63. [Google Scholar]
  26. Zhang, W.; Li, Y. Insect Ecology in China, 2nd ed.; Chongqing University Press: Chongqing, China, 2019; 692p. [Google Scholar]
  27. Michener, C.D. The Bees of the World, 2nd ed.; JHU Press: Baltimore, MD, USA, 2007; 953p. [Google Scholar]
  28. Vrdoljak, S.M.; Samways, M.J. Optimising coloured pan traps to survey flower visiting insects. J. Insect Conserv. 2012, 16, 345–354. [Google Scholar] [CrossRef]
  29. Fang, J.; Wang, X.; Shen, Z.; Tang, Z.; He, J.; Yu, D.; Jiang, Y.; Wang, Z.; Zheng, C.; Zhu, J.; et al. The main contents, methods and technical specifications of plant community investigation. J. Biodivers. 2009, 6, 533–548. [Google Scholar]
  30. Ke, X. Botany of Nectar Plants, 1st ed.; China Agricultural Press: Beijing, China, 1995; 226p. [Google Scholar]
  31. InVEST. Natural Capital Project. Available online: https://naturalcapitalproject.stanford.edu/software/invest (accessed on 17 June 2022).
  32. Lonsdorf, E.; Kremen, C.; Ricketts, T.; Winfree, R.; Williams, N.; Greenleaf, S. Modelling pollination services across agricultural landscapes. Ann. Bot. 2009, 103, 1589–1600. [Google Scholar] [CrossRef] [Green Version]
  33. Gathmann, A.; Tscharntke, T. Foraging ranges of solitary bees. J. Anim. Ecol. 2002, 71, 757–764. [Google Scholar] [CrossRef]
  34. Li, G.; Fang, C.; Wang, S. Exploring spatiotemporal changes in ecosystem-service values and hotspots in China. Sci. Total Environ. 2016, 545–546, 609–620. [Google Scholar] [CrossRef]
  35. Getis, A.; Ord, K. The Analysis of Spatial Association by Use of Distance Statistics. Geogr. Anal. 1992, 24, 189–206. [Google Scholar] [CrossRef]
  36. Wang, J.; Zhang, T.; Fu, B. A measure of spatial stratified heterogeneity. Ecol. Indic. 2016, 67, 250–256. [Google Scholar] [CrossRef]
  37. Wang, J.; Xu, C. Geodetector: Principle and prospective. Acta Geogr. Sin. 2017, 72, 116–134. [Google Scholar]
  38. Zhang, X.; Liao, L.; Xu, Z.; Zhang, J.; Chi, M.; Lan, S.; Gan, Q. Interactive Effects on Habitat Quality Using InVEST and GeoDetector Models in Wenzhou, China. Land 2022, 11, 630. [Google Scholar] [CrossRef]
  39. Polykretis, C.a.C.; Grillakis, M.G.a.C.; Argyriou, A.V.a.C.; Papadopoulos, N.G.a.C.; Alexakis, D.D.a.C. Integrating multivariate (Geodetector) and bivariate (iv) statistics for hybrid landslide susceptibility modeling: A case of the vicinity of pinios artificial lake, ilia, greece. Land 2021, 10, 973. [Google Scholar] [CrossRef]
  40. Groff, S.C.; Loftin, C.S.; Drummond, F.; Bushmann, S.; McGill, B. Parameterization of the InVEST Crop Pollination Model to spatially predict abundance of wild blueberry (Vaccinium angustifolium Aiton) native bee pollinators in Maine, USA. Environ. Model. Softw. 2016, 79, 1–9. [Google Scholar] [CrossRef] [Green Version]
  41. Steffan-Dewenter, I.; Munzenberg, U.; Burger, C.T.; Tscharntke, T. Scale-dependent effects of landscape context on three pollinator guilds. Ecology 2002, 83, 1421–1432. [Google Scholar] [CrossRef]
  42. Kennedy, C.M.; Lonsdorf, E.; Neel, M.C.; Williams, N.M.; Ricketts, T.H.; Winfree, R.; Bommarco, R.; Brittain, C.; Burley, A.L.; Cariveau, D.; et al. A global quantitative synthesis of local and landscape effects on wild bee pollinators in agroecosystems. Ecol. Lett. 2013, 16, 584–599. [Google Scholar] [CrossRef] [PubMed]
  43. Polce, C.; Termansen, M.; Aguirre-Gutiérrez, J.; Boatman, N.D.; Budge, G.E.; Crowe, A.; Garratt, M.P.; Pietravalle, S.; Potts, S.G.; Ramirez, J.; et al. Species Distribution Models for Crop Pollination: A Modelling Framework Applied to Great Britain. PLoS ONE 2013, 8, e76308. [Google Scholar] [CrossRef]
  44. Garibaldi, L.A.; Steffan-Dewenter, I.; Kremen, C.; Morales, J.M.; Bommarco, R.; Cunningham, S.A.; Carvalheiro, L.s.G.; Chacoff, N.P.; Dudenhoffer, J.H.; Greenleaf, S.S.; et al. Stability of pollination services decreases with isolation from natural areas despite honey bee visits. Ecol. Lett. 2011, 14, 1062–1072. [Google Scholar] [CrossRef]
Figure 1. Location of the study area.
Land 11 01073 g001
Figure 2. Spatial distribution of longan and litchi orchards in the study region in 2015–2019. (a) 2015; (b) 2019.
Land 11 01073 g002
Figure 3. Spatiotemporal distribution of the main land-use conversions in the study region from 2015 to 2019.
Land 11 01073 g003
Figure 4. Spatiotemporal distribution of the main conversions of the longan and litchi orchards in the study region from 2015 to 2019.
Land 11 01073 g004
Figure 5. Spatial distribution of hotspots of the wild bees of longan and litchi in the study region in 2015–2019. (a) 2015; (b) 2019.
Land 11 01073 g005
Figure 6. Influence mechanism of land use and its change on the pollination services for litchi and longan orchards. (Note: the influencing factors of the two types shown in the figure are the area of land use type and the landscape fragmentation of land use type. Numbers indicate their respective impact degrees on the pollination services of litchi and longan orchards, ranging from 0 to 1. (+) indicates positive impact, and (−) indicates negative impact).
Land 11 01073 g006
Table 1. Types of interaction between independent variables.
DescriptionInteraction Type
q(X1∩X2) < Min[q(X1), q(X2)]Nonlinear-weaken
Min[q(X1), q(X2)] < q(X1∩X2) < Max[q(X1), q(X2)]Univariate-weaken
q(X1∩X2) > Max[q(X1), q(X2)]Bivariate-enhanced
q(X1∩X2) = q(X1) + q(X2)Independent
q(X1∩X2) > q(X1) + q(X2)Nonlinear-enhanced
Table 2. Land-use Areas and their Proportions in Huizhou, 2015–2019.
Land-Use Types201520192015–2019
Area (km2)Proportion (%)Area (km2)Proportion (%)Changing Range (km2)
Irrigated cropland1827.7716.211805.6616.01−22.11
Rainfed cropland837.417.43821.997.29−15.42
Forest land7197.4663.827180.5663.67−16.90
Grassland265.452.35263.742.34−1.71
Water bodies367.073.25357.723.17−9.35
Construction land780.736.92846.217.5065.48
Unutilized land1.510.011.520.010.01
Table 3. Abundance of wild bee in litchi and longan orchards and their buffer zones in Huizhou, 2015–2019.
20152019Rate of Change
Total in the buffer zone116,830.28100,530.53−13.94%
Total in litchi and longan orchards442.33412.93−6.64%
Average in rainfed cropland of the buffer zone0.00630.0057−9.52%
Standard deviation in rainfed cropland of the buffer zone0.00260.0024−0.08%
Average in rainfed cropland of the whole region0.00590.0053−10.17%
Standard deviation in rainfed cropland of the whole region0.00280.0026−0.07%
Average in the forest land of the buffer zone0.02140.0196−8.41%
Standard deviation in the forest land of the buffer zone0.00380.0036−0.05%
Average in the forest land of the whole region0.02180.0202−7.34%
Standard deviation in the forest land of the whole region0.00390.0037−0.05%
Unit: pixel 900 m2.
Table 4. Interaction between influencing factors on the pollination services for litchi and longan.
Influencing FactorsForest Land AreaGrassland AreaRainfed Cropland AreaLitchi and Longan Orchards AreaForest Fragmentation
Degree
Grass
Fragmentation
Degree
Rainfed Cropland
Fragmentation Degree
Forest land area0.20
Grassland area0.34 *0.02
Rainfed cropland area0.39 *0.190.16
Litchi and longan orchards area0.50 *0.25 *0.270.21
Forest fragmentation degree0.360.32 *0.370.440.26
Grass fragmentation degree0.29 *0.050.190.230.300.03
Rainfed cropland fragmentation degree0.300.120.220.260.320.140.10
* indicates that the interaction between the factors is a nonlinear enhancement type, while the others are a double-factor enhancement type.
Table 5. Land-use types and wild bee abundance index for litchi and longan in the buffer zone of Huizhou, 2015–2019.
Land-Use TypesArea Change
2015–2019 (km2)
Wild Bee Abundance Index (sum) in Land-Use Types
20152019Abundance Index Change of Wild Bee
Irrigated cropland−22.110.000.000.00
Rainfed cropland−15.427.046.32−0.72
Forest land−16.9023.8221.78−2.03
Grassland−1.7110.639.60−1.03
Water bodies−9.350.000.000.00
Construction land65.480.000.000.00
Unutilized land0.010.000.000.00
Litchi and longan orchards31.721.701.840.14
Table 6. Correlation between land-use conversion and the change in wild bee abundance index for litchi and longan in the buffer zone from 2015 to 2019.
Types of Land-Use
Conversion
Area Change (km2)Abundance
Index Change of Wild Bee
Abundance
Index Change of Wild Bee per Unit Area
Construction land to Rainfed cropland14.6811.930.81
Forest land to Construction land20.95−18.40−0.88
Rainfed cropland to Construction land16.94−5.56−0.33
Forest land to Irrigated cropland3.19−4.95−1.55
Irrigated cropland to Forest land3.082.920.95
Irrigated cropland to Construction land19.29−0.12−0.01
Water bodies to Construction land7.59−0.08−0.01
Publisher’s Note: MDPI stays neutral with regard to jurisdictional claims in published maps and institutional affiliations.

