Article

Assessment of Forest Cover Changes in Vavuniya District, Sri Lanka: Implications for the Establishment of Subnational Forest Reference Emission Level

by
Sharaniya Vijitharan
1,2,
Nophea Sasaki
1,*,
Manjunatha Venkatappa
1,3,
Nitin Kumar Tripathi
4,
Issei Abe
5 and
Takuji W. Tsusaka
1
1
Natural Resources Management, School of Environment, Resources, and Management, Asian Institute of Technology, Pathum Thani 12120, Thailand
2
Department of Bio-Science, Faculty of Applied Science, University of Vavuniya, Vavuniya 43000, Sri Lanka
3
LEET Intelligence Co., Ltd., Pathum Thani 12120, Thailand
4
School of Engineering and Technology, Asian Institute of Technology, Pathum Thani 12120, Thailand
5
Faculty of Career Development, Kyoto Koka Women’s University, 38 Kadono-cho, Nishikyogoku, Ukyo-ku, Kyoto 615-0882, Japan
*
Author to whom correspondence should be addressed.
Land 2022, 11(7), 1061; https://doi.org/10.3390/land11071061
Submission received: 9 June 2022 / Revised: 6 July 2022 / Accepted: 8 July 2022 / Published: 12 July 2022

Abstract

:
Assessment of forest cover changes is required to establish the forest reference emission level (FREL) at any scale. Due to civil conflict, such assessments have not yet been undertaken in Sri Lanka, especially in the conflict zone. Here, we assessed the forest cover changes in Vavuniya District, Sri Lanka, from 2001 to 2020, using a combination of the Google Earth Engine (GEE) platform and the phenology-based threshold classification (PBTC) method. Landsat 5 TM data for 2001, 2006, and 2010, and Landsat 8 OLI data for 2016 and 2020 were used to classify forest cover by categories, and their related changes could be assessed by four categories, namely dry monsoon forest, open forest, other lands, and water bodies. With an overall average accuracy of 87% and an average kappa coefficient of 0.83, forest cover was estimated at 57.6% of the total land area in 2020. There was an increase of 0.46% per annum for the entire district between 2001 and 2010, but a drastic loss of 0.60% per year was observed between 2010 and 2020. Specifically, the dry monsoon forest lost 0.30%, but open forest gained 3.62% annually over the same period. Loss and gain of forest cover resulted in carbon emissions and removals of 165,306.6 MgCO2 and 24,064.5 MgCO2 annually, respectively, over the same period. Our findings could be used to set the baseline trend of deforestation, based on which, a subnational forest reference emission level can be established as an emission benchmark, against which comparisons of carbon emissions following the implementation of REDD+ activities can be made, and result-based payment can be claimed under the Paris Agreement.

1. Introduction

Forest ecosystems act as a natural remedy to combat climate change and provide ecosystem services to meet the basic needs of global human survival [1,2]. Forest cover is an important indicator in understanding the extent of forest loss or gain, and related carbon stocks in the locations in question [3]; however, its assessment is still challenging. The local circumstance of forests and their characteristics can determine the different roles of forests, from being carbon sources or carbon sinks. Therefore, forest cover is a crucial metric for measuring the performance of implemented activities to obtain result-based financial incentives for “Reducing Emissions from Deforestation and forest Degradation (REDD), conservation of forests, sustainable management of forests, and enhancement of forest carbon stocks” (REDD+) in developing countries; i.e., the REDD+ scheme [4]. The United Nations Framework Convention on Climate Change (UNFCCC) adopted this international framework in 2007, with the aim of carbon-based financial incentives to reduce carbon emissions in developing nations. At the 26th Conference of the Parties (COP26) of the UNFCCC in 2021, world leaders under the “Action on Forests and Land Use” theme committed to halt and reverse forest loss and land degradation by 2030 [5]. To achieve this under the Paris Agreement’s Warsaw Framework for the REDD+, parties (annexed and non-annexed countries) need to submit a national action plan, national forest monitoring system (NFMS), forest reference emission level (FREL), and safeguard information system (SIS) in order to benefit from the REDD+ scheme during the Paris Agreement period from 2020 to 2030 [4,6].
Among these four essential elements, the FREL is a benchmark to measure the performance of implemented REDD+ activities under the business-as-usual scenario, and is defined as the amount of carbon emissions from deforestation and forest degradation in a geographical area in the absence of the project’s activities [7,8,9]. To be eligible for the result-based financial incentives, developing counties need to establish a national or subnational FREL to compare future carbon emissions against historical reference levels [10,11]. According to the recent update by the Food and Agriculture Organization of the United Nations (FAO) in 2020, about 80% of the FRELs were nationwide in scope, using the historical average of carbon emissions. To measure the performance as required by the UNFCCC, the subnational FREL can be used as an interim measure [12,13]. However, previous studies suggest that starting FREL at the subnational level would be a more precise procedure for obtaining reliable data and reducing uncertainty than a national-level generalization [14]. Until recently, only four Latin American and two African countries submitted their subnational FRELs, followed by the national FRELs [13].
FREL at national and subnational levels can be developed using retrospective and prospective approaches [15]. The retrospective approach uses the historical emissions to project future emissions [16]. Development of the subnational FREL is required for monitoring the performance of subnational REDD+ activities. Subnational monitoring can also play a key role in countries’ long-term REDD+ and low-emissions development strategies. According to the United Nations Development Programme (UNDP), research conducted in 2009 estimated that 50–80% of mitigation and up to 100% of adaptation to climate change could be influenced by decisions made at the subnational- and local-level implementation of REDD+ [17]. Apart from national-level preparedness initiatives, such as improving data collection, developing FREL and operational frameworks, and evaluating REDD+ policy options, the majority of REDD+ demonstration activities and project investments are currently concentrated at the subnational and local levels. However, the REDD+ activities and project investments often disregard the crucial role of subnational governments and agencies in forest and land use policy to accomplish REDD+ and sustainable development goals. Pointedly, subnational FRELs and monitoring are recognized by the UNFCCC as a provisional solution; these solutions will also be significant as a permanent measure to enable REDD+ to be implemented under different existing governance frameworks [18].
To establish FRELs using a retrospective approach, developing countries are required to have reliable and consistent long-term forest cover data, because such data are important for establishing baseline carbon emissions. Nevertheless, not every developing country has such data. Recent studies have developed subnational and national FRELs with two data points of forest cover data due to limitations in forest inventory [10,16]. Previous studies indicate that more data points of historical forest cover can reduce the bias and uncertainty in the development of FRELs at different levels [19]. Due to the lack of such data, the inaccurate estimation of historical carbon emissions could result in unnecessary biases in predicting future emissions as part of the requirements for implementing the REDD+ and for receiving carbon benefits. Fortunately, as more satellite images and the latest cloud computing technologies become increasingly available, the use of remote sensing approaches for obtaining historical forest cover data make it possible to assess forest cover changes for countries with otherwise limited data coverage, at any scale [20].
Sri Lanka is a small tropical island in the Asia-Pacific region of the Indian ocean, with a diversity of flora and fauna and different types of natural forests [21]. Based on national statistics, the total forest cover was reduced by 14.5% between 1956 and 2010. Fernando et al. [22] reported that forests covered 29.7% of the total land area in 2010. Therefore, determining FRELs is necessary to reduce deforestation and carbon emissions at subnational and national levels. In fact, Sri Lanka submitted their national FREL and removals to the UNFCCC in 2017 as a benchmark for monitoring and measuring the performance in the forest sector [21]. To develop a subnational FREL, two important variables, forest cover (activity data) and emission factor, are needed [10]. Sri Lanka has forest cover data at the national level. However, there is a lack of forest cover data and inconsistencies in national forest inventories at the subnational level [23]. Chokkalingam and Vanniarachchy [24] stated that Sri Lanka has limited information about the precise extent and nature of existing forests, and recent trends in these forests. The northern and eastern provinces of Sri Lanka were severely affected by the Sri Lankan civil war, and the districts belonging to these provinces lack updated forest cover data [25]. Due to the lack of forest cover data, REDD+ implementation at the subnational level is challenging. However, there is a need to evaluate baseline deforestation to obtain financial incentives under the Paris Agreement by estimating and comparing carbon emissions. A recent technological advancement, Google Earth Engine (GEE), is a cloud-based alternative geospatial platform that can be used for acquiring more than 40 years of historical and current global forest cover data using satellite images [26,27,28]. Thus, we used this platform to derive the past and recent Landsat satellite images to obtain the long-term forest cover data required to overcome the aforementioned challenges at the subnational level. Importantly, a subnational FREL can convey the REDD+ activities and benefits into practical reality with less uncertainty. Therefore, our study focused on assessing the forest cover changes in Vavuniya District, Sri Lanka, between 2001 and 2020, using a combination of the phenology-based threshold classification (PBTC) method and multitemporal Landsat collections available in GEE to establish the subnational FREL.

2. Materials and Methods

2.1. Study Area

Our study was carried out in the Vavuniya district, Northern Province, Sri Lanka. This district is categorized as a dry zone (rainfall < 1750 mm) based on the rainfall pattern. Its geographical coordinates are 8°45′0″ N and 80°30′0″ E. This district has four Divisional Secretariat (DS) divisions, namely Vavuniya, Vavuniya North, Vavuniya South, and Vengalacheddikulam (Figure 1). The climate is tropical, with an average temperature of 28 °C. Sri Lanka receives rainfall during two monsoon periods. In this study area, the highest rainfall occurs during the Northeast monsoon (December to February). The dry season, experienced from May to September, is defined as the Southwest monsoon [29]. In summer, the mean temperature is high, while the minimum temperature is recorded in winter. The annual rainfall received in this district is 1400 mm. Surface wind circulations influence the seasonal variation in rainfall of the climatic zones, causing differences in monsoonal patterns [30]. Persistent year-round cloud cover significantly affects the availability of remotely sensed data. In this district, the dry monsoon forest (semi-deciduous vegetation) is the dominant type, with a considerable proportion of the open forest. This is one of the war-affected districts in the Northern Province. The internal civil conflict has badly impacted vast areas of the forest cover in the northern part of the district. This district is one of the most important districts in the Northern Province, and the town of Vavuniya serves as a regional transit hub. The district’s economy is mainly based on agriculture, and has been highly developed over the last decade. However, the rural community still strongly relies on the forest to obtain products and services to enhance their livelihood.

2.2. Satellite Remote Sensing Data and Pre-Processing

We acquired satellite remote sensing data to assess the changes in forest cover from 2001 to 2020. GEE is an effective processing tool of global-scale satellite imagery dating back 40 years [26]. The required data were freely collected from the Landsat collections on the GEE platform [27]. The selected Landsat image collections were available from the Landsat 5 and Landsat 8 satellites. Landsat 5 is the longest operating earth observation satellites among the current Landsat series. It was launched in 1989, and was decommissioned, after its 28-year mission, in 2012. Meanwhile, Landsat 8 was launched in 2013, and the latest data were obtained through the operational land imager (OLI) and thematic infrared sensor [32]. In particular, Landsat 5 thematic mapper (TM) top of atmosphere (TOA) and Landsat 8 OLI TOA reflectance image collections with 30 m moderate spatial resolution were obtained for land cover classification [28,33,34] to estimate the forest cover changes [35]. Landsat TOA reflectance refers to the reflectance measured by a sensor from space flying above the earth’s atmosphere. Landsat TOA reflectance data has significant potential to determine threshold values and perform PBTC of land cover categories with greater accuracy due to its higher reflectance-based EVI values [32]. Due to climatological variations, the dry season is a suitable time to collect Landsat images as there is less cloud cover [28,36] for EVI-based land cover assessments. Thus, we collected Landsat 5 TM data for 2001, 2006, and 2010, while Landsat 8 OLI data were obtained for 2016 and 2020 during the dry season, covering the whole district. Therefore, the entire study area was covered by two Landsat 5 collection pathways and three paths of Landsat 8 collections. In total, we gathered 150 images from the Landsat 5 TM and Landsat 8 OLI collections.
Image pre-processing is an important step to produce good-quality maps before performing classification. Initially, the research area’s boundary shapefile was imported as an asset to perform this pre-processing. Then, GEE’s image collection feature was applied to gather the Landsat TM TOA and OLI TOA reflectance collections, and the filter function was employed to obtain the dry season collections. Next, GEE algorithms were applied on Landsat composites to reduce the imagery to median pixel values [37]. Subsequently, the cloud mask function was executed to reduce the cloud cover by less than 50% on all Landsat collections in GEE [38,39,40] to reduce the probability of acquiring bad images [33,41,42]. Subsequently, we applied the image compositing and reducer functions to choose the recent pixel in the Landsat collections. The median reducer function estimated the median value for all collections. This function helps to remove the high-value and low-value clouds and cloud shadows. Finally, the clip function was applied to remove the unnecessary portions of outsized images other than the study area.

2.3. Methodology for Phenology-Based Threshold Classification

2.3.1. Enhanced Vegetation Index (EVI)

Subsequently, our study applied the EVI function on the median Landsat TOA reflectance collections (Landsat 5 TM and Landsat 8 OLI) obtained for 2001, 2006, 2010, 2016, and 2020 [43,44]. This index resembles the normalized difference vegetation index (NDVI); however, it can overcome the saturation problems in dense vegetation cover [45], and can minimize the effects of atmosphere, soil, and solar irradiance [46] due to the use of the blue reflectance region. In addition, research by Gao and Mas [47] showed that the EVI is a good indicator for phenology classification of land cover types. Consequently, Landsat EVI time series data were used to classify the selected land cover categories [45]. The EVI calculation formula is shown below [48,49]:
EVI = G × NIR R NIR + C 1 R C 2 B + L
where G = 2.5 (gain factor), L = value to adjust for canopy background, C1 = 6, and C2 = 7.5 (aerosol correction factors) [50]. NIR, near-infrared; R, red band; B, blue band.
For Landsat 8: Band 5—NIR, Band 4—R, and Band 2—B;
For Landsat 5: Band 4—NIR, Band 3—R, and Band 1—B.

2.3.2. Enhanced Vegetation Index Threshold Values to Classify Land Cover Categories Using PBTC

The PBTC method plays a significant role in land cover mapping because it can differentiate the phenological behaviors of plants throughout the year [28]. This method is sensitive to climatological variation, but it is a powerful tool for acquiring information regarding land cover types using EVI threshold values. Recently, the application of PBTC in forest cover mapping has drawn significant attention. This method has shown a high level of accuracy and higher reliability for classifying and mapping croplands, forest cover, and land cover to assess changes and estimate forest carbon stocks during recent decades, due to many technological challenges being resolved in the GEE [28,35,36].
This study applied the PBTC method to classify four land cover categories, namely, dry monsoon forest, open forest, other lands, and water bodies (Table 1 and Figure 2). However, our research mainly focused on forest cover classes (dry monsoon and open forest). We modified a PBTC model developed by Venkatappa et al. [51] to classify the land cover as per the climatological characteristics and the phenological behavior of vegetation of our study area. Landsat collections were obtained during the dry season in Sri Lanka, from May to September, to differentiate each land cover category from other categories. The collection of images for the dry season was performed because the dry season is the period during which plants behave differently; thus, the satellite technology can capture the EVI, with less non-overlapping values, of the selected land cover categories, thereby avoiding the misclassification of the EVI if wet season Landsat images are collected. The land cover categories during the wet season can appear as green, and yield overlapped EVI threshold values. Note that our study identified new EVI minimum and maximum threshold values for each land cover category during the dry season in Sri Lanka. Table 2 shows the EVI threshold values for land cover categories. After the image pre-processing stage mentioned in Section 2.2, all image collections from 2001 to 2020 were processed using the EVI function for the median Landsat collections. Thereafter, to perform the PBTC, the identified minimum and maximum threshold values were applied for each land cover (Table 2). Land cover classification and spatial mapping were performed by executing the PBTC function in GEE using the minimum and maximum EVI threshold values [28,51]. Different colors were assigned for the different land categories in the layer palette to visualize the land cover categories in GEE. Finally, our research yielded five land cover maps from which to analyze forest cover changes.

2.4. Estimation of Forest Cover Changes

Multitemporal datasets were used to distinguish areas of land cover changes between remote sensing imaging dates [52,53]. After an accuracy assessment, we applied the following formulas to assess the annual, and rate of, forest cover changes [54,55] during 2001–2006, 2006–2010, 2010–2016, 2016–2020, and 2001–2020. In addition to these time frames, the rate of change in forest cover was assessed from 2001–2010 and 2010–2020 based on the pattern of change. The annual rates of forest cover changes were calculated by comparing the area of forest cover at different time points.
Forest   cover   change   in   % = FAt 1 FAt 0   FAt 0 × 100
FCC n = FAt 1 FAt 0 t 1 t 0
R n = FCC n FAt 0 × 100
where FCCn = annual forest cover change (ha/y) in nth period, FAt1 and FAt0 = forest area (ha) at final year (t1) and initial year (t0), Rn = annual rate of forest cover change in each period n (%/y)

2.5. Accuracy Assessment and Validation

Accuracy assessment reveals discrepancies between the classified maps and reference data [56,57]. Therefore, the accuracy assessment and validation were considered as a foundation [58]. In this accuracy assessment, the Google Earth Pro platform was used to provide reference data to validate the land cover maps [59]. This platform regularly updates when new data are available. Google Earth’s timelapse function was accessed to obtain zoomable historical images from 2001 to 2020 to visualize and monitor land cover changes using GEE [60]. In this study, we acquired, from Google Earth, very high-resolution time series images to validate the accuracy of land cover maps by applying standard protocols recommended by Olofsson et al. [61]. The results must be quantitative to determine their classification accuracy. Therefore, a stratified random sampling technique was applied to validate the maps [51]. We considered each land cover category as a stratum for this sampling.
Consequently, the generated maps were exported to Google Drive using the export function to carry out the accuracy assessment. The ArcGIS Pro is a professional single-desktop geographic information system (GIS) application with a feature-packed software that has replaced ArcMap software [62]. We used the generated PBTC maps in the latest ArcGIS Pro software to transform the land cover labels into accuracy points. The sampling points were created using the stratified random sampling technique tool “create accuracy assessment points” in ArcGIS Pro. A total of 1000 accuracy assessment points were generated, and we then converted the sampling point files into a “keyhole markup language” (kml) file, which visualizes the geographic data of created accuracy assessment points on the Google Earth Pro. Later, the converted kml files were imported to Google Earth Pro for validation. Subsequently, sampling points were visually analyzed using the Google Earth “time slider” tool to compare and validate the maps with reference data. An error matrix is a contingency table used to show the frequency of discrepancies between classified maps and reference data. The classification accuracy of remotely sensed images is widely assessed using the error matrix [63]. Finally, the following equations were used to calculate producer accuracy, user accuracy, overall accuracy, and the kappa coefficient [63,64] using the error matrix method in Microsoft Excel.
Producer   accuracy = Number   of   accurately   identified   points   in   an   individual   land   cover   category Total   reference   points   of   respective   land   cover   category × 100
User   accuracy = Number   of   accurately   identified   points   in   an   individual   land   cover   category Total   number   of   classified   reference   points × 100
Overall   accuracy = Total   number   of   correctly   classified   land   cover   categories   reference   points Total   number   of   reference   points × 100
Kappa   ( K ) = Overall   accuracy random   accuracy 100 random   accuracy
The kappa coefficient is a measurement used to determine the agreement between classification accuracy and the reference data [49,65]. The parameter reflects the difference between actual agreement and the agreement expected by chance. Values of K range from 0 to 1, where 1 denotes perfect agreement, while 0 indicates poor or no agreement in the classification [66]. This indicates how well the categorized map corresponds to the reference data. When compared to a random classification, the kappa coefficient reflects the proportionate reduction in classification error.
In addition, ground truth data were used to validate the PBTC map for 2020. In total, we collected 350 ground truth field points (dry monsoon forest: 139 points; open forest: 68 points; other lands: 84 points; and water bodies: 57 points) randomly, during the dry season in 2021, using the Global Positioning System (GPS) and SW maps. The SW map is a freely available application on Android for recoding data through GPS [67]. The collected points were imported into ArcMap, and the spatial analyst tool was used to extract the values to points on classified maps to compute the error matrix.

3. Results and Discussion

3.1. Land Cover Pattern of the District

We assessed land cover changes using multispectral images from Landsat 5 TM and 8 OLI collections with 30 m moderate spatial resolution from 2001 to 2020. Figure 3 represents the land cover maps for different time frames, and indicates that the classified maps consist of four land cover categories; dry monsoon forests, open forests, other lands, and water bodies. The produced maps are a noteworthy finding in terms of understanding their dynamic pattern for the different periods. Pointedly, in all PBTC maps, dry monsoon forest was the predominant land cover category, followed by other lands, open forest, and water bodies. Over the study period, the extent of other lands increased, while that of the dry monsoon forest declined. The open forest fluctuated, and other lands developed along the road networks. The maps show a considerable degree of variation in the area coverage of these land cover categories during the study period (Figure 3).

3.2. Forest Cover at District Level

The changes in forest area over the 19 years studied are shown in Table 3. The total district area was around 200,390 ha; however, more than half of the total land area was occupied by natural forests. In 2020, 52.2% and 5.3% of land area were occupied by dry monsoon and open forests, respectively. The maps describe the spatiotemporal distribution, and its changes, of the district’s forest cover (Figure 3). Overall, the dry monsoon forest was the most dominant and widely distributed forest type in the study area. In contrast, open forest covered a lower proportion of the land area. The open forest was scattered within the dry monsoon forest, and fluctuated throughout the study, as a result of drivers of deforestation and forest degradation looming towards the dry monsoon forest. Specifically, in recent decades, other lands have started to occupy areas that were once dry monsoon forest. Although dry monsoon forests are enriched in the northern part of this district, the forest area in this region declined in 2020, while the southern region gained forest cover. Remarkably, the highest percentage of total district land area was covered by dry monsoon forest.

3.2.1. Trend in District Forest Cover

Figure 4 represents the overall trend in forest cover concerning the total district area from 2001 to 2020. The data show an overall increasing tendency between 2001 and 2010; however, a significant reduction was observed after 2010 [68]. About 58.5% of the total geographic area of Vavuniya District was sheltered by forest in 2001. In 2006, this started to gradually increase, peaking at 61.3% by 2010, and then rapidly reduced to 57.6% in 2020. However, a sudden decline was noted between 2010 to 2016, which slightly improved thereafter. Our findings indicate that forest loss occurred at a low rate over the study period; however, the loss accelerated after 2010.
In contrast to these results, the latest global forest resource assessment from the FAO [69] reported that 178 million ha of the world’s forest has been lost since 1990. Worldwide forest cover declined to 3999 million ha from 4128 million ha between the years 1990 and 2015. Thus, about 420 million ha of forest has vanished worldwide due to deforestation since 1990, with the yearly rate of deforestation estimated at 10 million ha between 2015 and 2020, down from 12 million ha in 2010–2015. In South Asia, 29.62% of forest has been lost in the eight decades since 1930, with annual net deforestation rates of 0.06% and 0.04% during 1995–2005 and 2005–2014, respectively [70]. Gunawardane et al. stated that forest cover in five districts in the Northern Province, including Vavuniya, increased by 3% between 1999 and 2008 due to limited human access and disturbance to the forests. From national statistics, the total forest cover in Sri Lanka reduced by 14.5% between 1956 and 2010, with forests covering 29.7% of the total land area in 2010 [23]. From 2005 to 2014, the annual rate of deforestation was 0.01%, while a high rate of deforestation was recorded between 1976 and 1994 [71]. The deforestation hotspots were discovered in Sri Lanka’s southeast and northern regions [72]. Deforestation is a major driver of forest cover loss in the tropical region [72,73]; our results indicate that this is also a common problem in Sri Lanka. Therefore, smart conservation and management strategies are required to safeguard remaining resources. However, forest cover change assessments in Sri Lanka are complex due to land use transitions that have occurred throughout the country’s history [74,75].

3.2.2. Annual Rates of District Forest Cover Change

We divide the study period into two time frames based on pattern variation (Figure 4), 2001–2010 and 2010–2020, to explain the rate of forest cover change. During the first time frame, the district’s forest area increased by 4.62% (5420 ha). However, a substantial rapid decline of 6.04% (7419 ha) was observed between 2010 and 2020. As shown in Figure 4, considerable deforestation occurred during this later period. Specifically, during 2010–2016, other lands increased in cover (Figure 3) due to rehabilitation, housing settlements, agricultural expansion, and development activities implicated soon after the internal civil war in 2009. It is important to note the forest loss in this period. Fernando et al. [23] noted rapid economic development in the northern part of Sri Lanka in 2009. After 2016, post-war resettlements and advancements in rural areas and infrastructure slightly increased the forest area [23,76].
Comparisons based on spatial extent revealed significant changes observed during 2001–2010 and 2010–2020. Remarkably, a striking turning point was noted in 2010. Importantly, forest cover expanded in the initial time frame, and then rapidly declined during the recent decade. Previous research in the dry zone conducted by Ranagalage et al. [68] demonstrated that forest cover in the Vavuniya District declined by 8.7% in 2019, from 122,325 ha in 2010. In addition, all districts in the Northern Province resembled an increasing and decreasing pattern of forest cover change from 1999 to 2010 and 2010 to 2019, respectively. We also observed a similar result in this study site. From our statistics, the pattern of the district’s forest cover trend was consistent with this previous study. Moreover, the annual rates of forest cover changes were estimated (Table 4) in the period from 2001–2006 (0.49%), followed by 2006–2010 (0.53%), 2010–2016 (−1.08%), and 2016–2020 (0.12%). In the last 19 years, the annual change in the district’s forest cover was −105.18 ha/year, with an annual rate of change of −0.09% (i.e., forest decreased at a rate of 0.09%). The annual deforestation rate was high from 2010–2016. Although forest cover dynamics in Sri Lanka’s dry zone are complex, non-deterministic, and non-uniform, with decadal changes in deforestation and afforestation. In the dry zone, human resettlement, agricultural encroachment, and infrastructure development have induced forest cover loss in recent decades [23,77].

3.2.3. Forest Cover Changes by Type

Figure 5 illustrates the trend in dry monsoon forest and open forest cover change in different time frames. Our findings reveal that, in 2001, 55.4% (110,990 ha) and 3.2% (6338 ha) of the total land area was covered by dry monsoon and open forest, respectively. In 2020, the coverage of dry monsoons decreased to 52.2% (104,627 ha), and that of open forests increased to 5.3% (10,702 ha). Statistical analysis shows a considerable scale of negative change in dry monsoon forest compared to open forest. During the period 2001–2020, the dry monsoon decreased by 6.13%.

3.2.4. Annual Rate of Dry Monsoon and Open Forest Cover Change

We estimated the annual rates of dry monsoon and open forest changes over different time frames (Table 4). The annual deforestation rates of dry monsoon forest were 0.26% per annum from 2001 to 2006, and −0.06% per annum from 2006 to 2010. We computed that the highest annual rate of forest loss was from 2010–2016 (0.41%) and 2016–2020 (0.47%), compared to the previous decade. Between 2010 and 2020, it declined by −0.88% per year. However, from 2001–2020, the annual change in dry monsoon forest area was −334.90 ha/year, with a rate of change of −0.30% per year.
In contrast, the open forest cover increased by 28.95% over the study period. The annual rates of open forest cover changes were 13.50%, 6.68%, −6.58%, and 7.85% for the periods 2001–2006, 2006–2010, 2010–2016, and 2016–2020, respectively. In addition, open forest showed a rising trend of 229.71 ha/year, with an annual rate of change of 3.62% between 2001 and 2020. Overall, the open forest area showed an increasing trend, with fluctuations and dry monsoon forest area, followed by a continuous decreasing trend. Thus, our analysis reveals the conversion of dense forests to open forests and other lands, when deforestation accelerated, at different scales (Figure 3).
The dry monsoon forest plays a crucial role in long-term forest cover dynamics. Interestingly, Sri Lanka has the larger extent of monsoon forests [78], with dry monsoon forests covering over 55.3% of the total land area in 2010 [22]. Noticeably, this forest is widely distributed throughout the dry zones, and can offer a diverse range of products and environmental services [79]. Meanwhile, the open forest can be subjected to land encroachment for various purposes [68]. In the dry zone, illegal extraction of timber, firewood, non-timber product collection, cattle foraging, and mining for gravel and granite, are localized drivers of deforestation [80]. If major forest reduction continues, the area in the dry zone could be further subjected to negative consequences of prolonged drought due to lack of rainfall [81], soil erosion, extreme heat, agriculture loss, human and wildlife conflict, forest fires, and climate shifts [79,82,83,84]. In the Nationally Determined Contributions (NDCs) report in 2021, Sri Lanka declared to increase forest cover to 32% by 2030. To support this, our analysis indicated that open forest in Vavuniya District contributes about 3.62% annually towards achieving the NDCs target. In developing nations such as Sri Lanka, limitations to obtaining forest inventory data and lack of historical records are the fundamental barriers to determining multidecade changes in forest area. The satellite-based inventory using GEE can provide long-term information on forest cover for the REDD+ implementation, FREL development, national-level decision making, policy re-enforcement, and monitoring and planning for forestry and other sectors, at the subnational and local levels [85,86].

3.3. Forest Cover Changes at the Divisional Secretariat (DS) Level

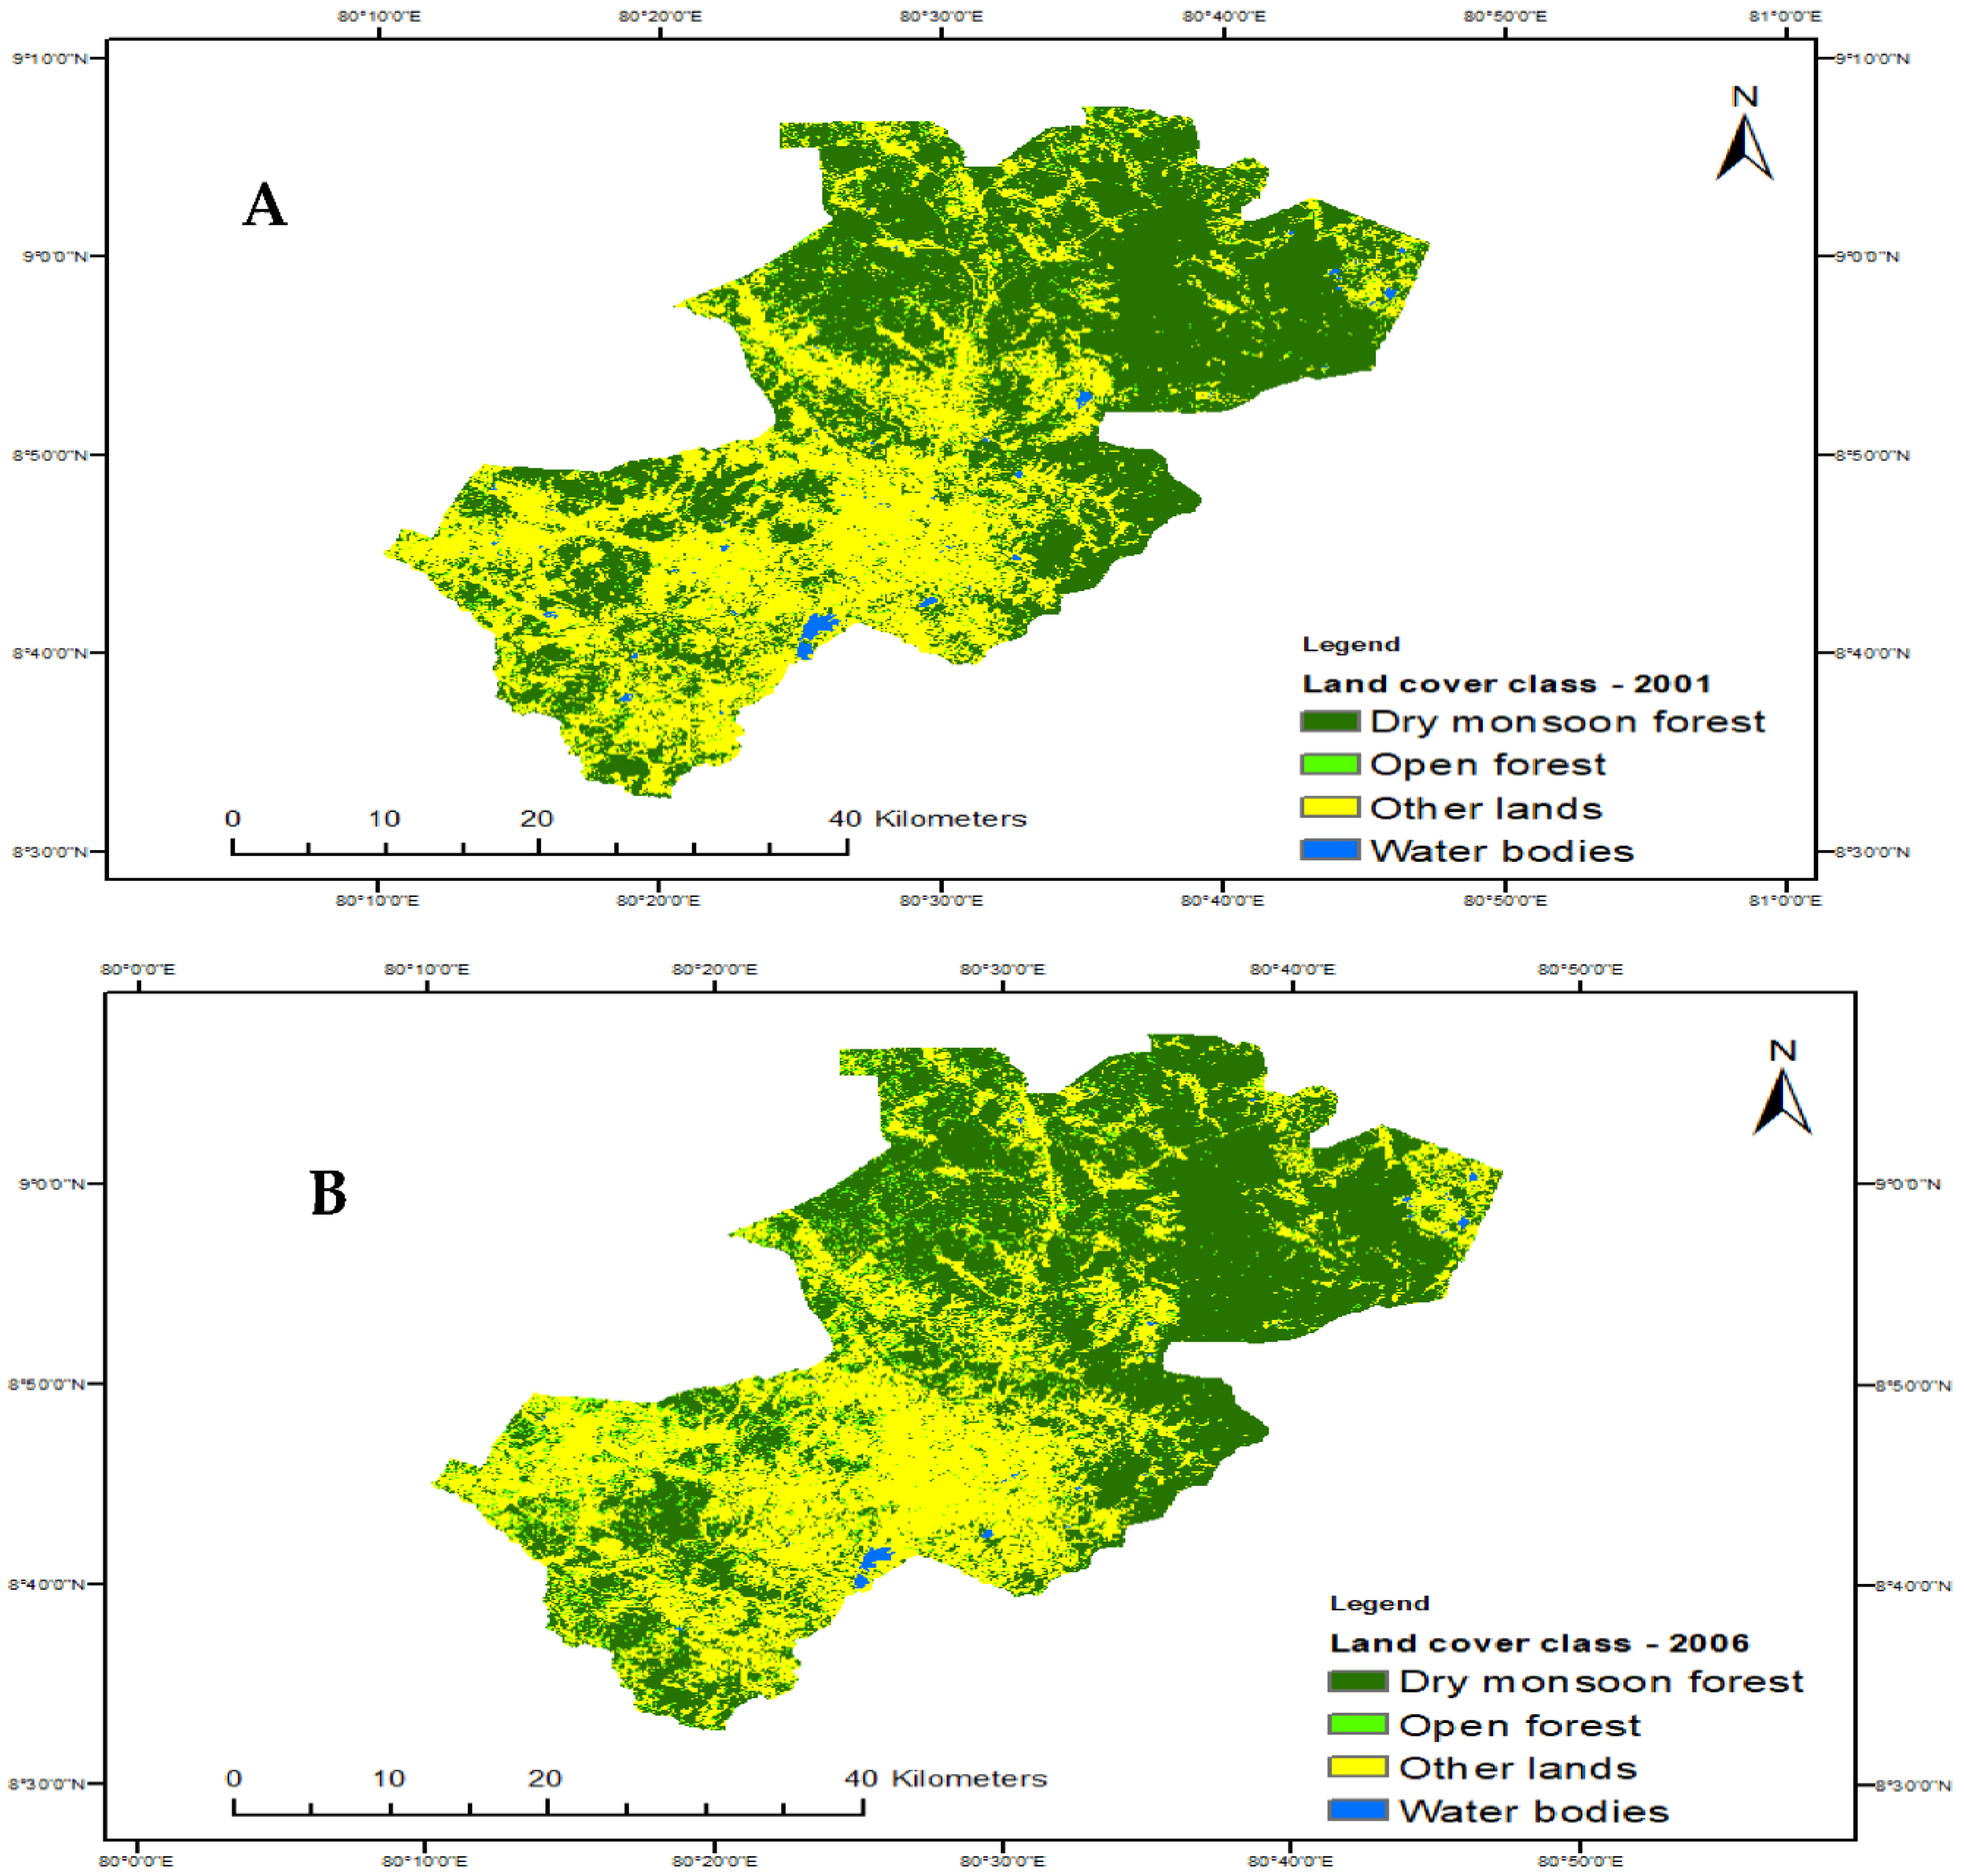
We assessed the proportion of forest area with respect to the total land area of each DS division. Thus, this study identified the overall forest cover reduction and enhancement on different DS divisions of the district. In 2001, forest covered about 42.5%, 51.67%, and 40.34% of the Vavuniya, Vavuniya South, and Vengalacheddikulam divisions’ land area, respectively, increasing to 45.50%, 56.37%, and 57.83% in 2020, respectively. In contrast, 83.78% of the Vavuniya North division was covered with forest in 2001. However, this declined to 67.69% over the same period. Notably, an earlier study by Pathmanandakumar and Thasarathan [87] mentioned that forest cover change in the Vavuniya DS division increased by 8% in 2017 from 39% in 1997. However, we found a slight forest cover increase in this division’s land area. Noticeably, the categorization of our land cover classes differs from that of this previous study. We categorized open and dry monsoon forests, while grasslands and shrubs were included in the land cover class referred to as other lands. Figure 6 presents the annual changes in forest cover by DS division. We observe forest area expansion in the Vavuniya, Vavuniya South, and Vengalacheddikulam divisions. In contrast, the Vavuniya North division underwent a severe reduction of 19.2%. Between 2001 and 2020, the annual rates of forest cover gain were 0.42%, 0.48%, and 2.28% in Vavuniya, Vavuniya South, and Vengalacheddikulam DS divisions, respectively. Meanwhile, the deforestation in Vavuniya North division was 1.01% per annum. Significantly, we observed a dramatic decreasing trend in forest cover in Vavuniya North, while the Vengalacheddikulam division showed a gradual increase because of the expansion and reduction in other land areas.

Annual Rate of Dry Monsoon and Open Forest Changes by DS Division

We further examined the dry monsoon forest cover gain and loss in DS (Table 5). Overall, the Vavuniya North division contained the highest dry monsoon forest area in the entire district, Vavuniya division had the second highest forest area, followed by the Vengalacheddikulam and Vavuniya South divisions. Among the four DS divisions, about 14,168 ha (23%) of dry monsoon forest was significantly deforested in Vavuniya North due to post-war rehabilitation and ongoing development projects. This would have produced a great impact on carbon stocks. Conversely, a substantial rise in forest cover by 43% was observed in Vengalacheddikulam between 2001 and 2020, while Vavuniya and Vavuniya South divisions showed a slight rising trend of 3.5% and 5.7%, respectively.
Between 2001 and 2020, the annual forest cover change rates were 0.18%, 0.003%, 0.02%, and −0.01% in Vavuniya, Vavuniya South, Vengalacheddikulam, and Vavuniya North divisions, respectively. Conversely, a growing trend in open forest areas was noted in all DS divisions. Annual rates of open forest cover gain in DS divisions were 3.36% in the Vavuniya division, 3.49% in Vavuniya South, 2.43% in Vengalacheddikulam, and 4.95% in the Vavuniya North division. We observed the highest percentage of open forest gain per annum in the Vavuniya North division.
In Sri Lanka, a civil war begun in 1989 between the Government of Sri Lanka (GOSL) and the Liberation Tigers of Tamil Eelam (LTTE); this war ended in 2009. The Northern and Eastern Provinces of Sri Lanka were hard hit by this conflict. The several districts in the Northern Province, namely, Kilinochchi, Mullaitivu, Mannar, and Vavuniya districts, collectively called “Vanni”, were captured and controlled by the LTTE [88]. Cultural, economic, and environmental impacts were caused by this civil war at national and international scales [88]. Remarkably, Chardran [89] mentioned that this district suffered several repetitive displacements throughout the conflict, until 2009. The district was divided into two parts, namely, cleared (under the control of Sri Lankan government) and uncleared area (the civil administration was fully controlled by the Liberation Tigers of Tamil Eelam (LTTE)). These two areas were separated by the Omanthai Sri Lankan Army checkpoint [90]. The uncleared area was mainly the entire area of the Vavuniya North division. The whole of the Vavuniya North division, and parts of the Vavuniya and Vengalacheddikulam divisions, were affected during the conflict, and resettlement and rehabilitation programs were implemented in this district. However, during the past decades, large portions of the forest cover in the northern part of the country had been severely affected by the civil war and post-war consequences. In addition, Sri Lankan forest cover is fragmented; therefore, maintenance and management are challenging. Furthermore, after the end of the civil war, regions in the north and east have been rapidly altering [91]. Previous studies identified that the underlying deforestation drivers for land use and land cover change were population growth and high demand for urban land, urbanization, development projects, and rehabilitation during the post-civil war situation in the northern part of Sri Lanka. This situation has increased agricultural expansion, encroachment of forest lands for human settlements and agriculture, and illegal logging [87,92]. The rate of deforestation and pressure on forests in developing countries are directly and indirectly determined by human population density and the economic crisis [93,94,95,96].
Notably, the number of abandoned lands for agricultural and settlements was high in Vengalacheddikulam, followed by Vavuniya, Vavuniya North, and Vavuniya South divisions; due to the previous conflict, landowners migrated to foreign countries, water scarcity, and threat from wild animals [97]. The abandoned lands became forest areas due to lack of accessibility. As a result, forest cover may increase in Vengalacheddikulam and Vavuniya divisions. Based on the Sri Lanka United Nations Reducing Emissions from Deforestation and forest Degradation (UN-REDD) report in 2016, internally displaced citizens and refugees were returned to the districts of Mannar, Jaffna, Vavuniya, Mullaitivu, and Kilinochchi in 2015. In certain situations, people have encroached and claimed the ownership of Forest Department lands without following the legal processes. Additionally, misappropriation by local officials and infrastructure development are further reasons for forest destruction in the northeast, with overexploitation of forest resources within reserved areas. A noticeable malfunction was observed, that the forest sector is not included in the Climate Change Secretariat activities, since it is not considered a significant component of Sri Lanka’s climate change mitigation and adaptation plan [25]. This exemplifies the poor coordination between sectors in Sri Lanka to conserve forest resources and mitigate climate change. To overcome the insufficiencies at the national level, subnational-level studies can provide the forest cover data and carbon storage potential of forests, which may develop the interest in forest conservation and sustainable management through the collaboration of various organizations. These types of studies can help to achieve the REDD+ goals and receive result-based financial incentives through the policies and measures in the National REDD+ Investment Framework and Action Plan (NRIFAP).

3.4. Accuracy of Land Cover Maps and Significance of PBTC Mapping

Table 6 shows the producer accuracy, user accuracy, overall accuracy, and kappa statistics of the subsequent land cover maps. The overall accuracy of the generated land cover maps for the years 2001, 2006, 2010, 2016, and 2020 were 86%, 87%, 86%, 88%, and 88%, respectively. The kappa coefficients for the selected years were 0.81, 0.83, 0.81, 0.83, and 0.83, respectively. Our study obtained acceptable accuracy and average kappa values, with strong agreement, above 80% [72,98]. The average overall accuracy of the PBTC maps was 87%, while the average kappa coefficient was 0.82. The overall accuracy and kappa coefficient for the 2020 map using ground truth points were 86% and 0.80, respectively. The accuracy assessment findings revealed that there was an almost acceptable agreement between phenology-based land cover maps and reference data. The overall accuracy and kappa coefficient of maps showed higher reliability and accuracy, as this method primarily relied on the seasonal phenological behavior of vegetation.
We attempted to compare accuracy assessment results of PBTC maps with the findings of earlier studies. For example, a similar study concluded that the average accuracy and kappa coefficient of bamboo mapping in Cambodia from 2015 to 2018 were 89.4% and 0.82, respectively [36]. Similarly, the accuracy of mangrove forest mapping in Brazil from 1985 to 2018 was 87% [99], while another study reported the average accuracy and kappa coefficient of forest cover mapping in Ethiopia during 1991–2019 were 82.2% and 0.89 [2]. Another study also yielded an accuracy range from 86.6% to 89.80% for the long-term deforestation assessment in Sri Lanka between 1976 and 2005 [71]. Remarkably, it can be concluded that the classification performance was highly accurate and in line with previous studies [2,66,100]. Therefore, these results are valid for assessing forest cover changes, and are considered as a best-fit model for our study.
The accuracy assessment for land cover classification can be validated by different methods, such as cross-validation approaches and bootstrapping [101]. In the cross-validation, the independent references were used to validate the generated maps. Different training and validation partitions of the data are used in different cross-validation procedures. The final accuracy results are then provided as the average or best fit of all iterations or folds in the cross-validation approach [101]. For example, a previous study from the eastern part of South Africa investigated the accuracy of classification methods in support vector machines and random forests using bootstrapping and k-fold cross-validation methods. The support vector machine with k-fold cross-validation yielded producer and user accuracies above 80% [102]. However, the k-fold cross-validation and bootstrapping methods have many merits and demerits in terms of sampling size, time consumption, linearity, and randomness. In our study, we classified the land cover categories using EVI threshold values, and then validated them using reference data. The selection of the validation approach depends on the objectives and methods applied in a particular study.
The present study confirms that the dry season is more suitable for land cover classification owing to less cloud cover and unique EVI values for each land cover class; these key characteristics can improve accuracy by avoiding overlap among land cover categories. In contrast, the rainy season or wet season is not suitable due to the possibility of high cloud cover. All land cover categories can appear green during the wet season. Therefore, it is difficult to distinguish one land cover type from another. Due to this, the overlapping of EVI values can result in misclassification among the land cover categories. The possibility of misclassification can be reduced using high-resolution satellite images, field-based reference points, and drone technology. A similar study also mapped Cambodia’s 12 land cover categories using the PBTC method during the leaf shedding season [36]. Therefore, phenology-based classification can be the most prominent method for land cover classification. This method could help clearly differentiate land cover classes with minimum errors to obtain improved results. Our study delivers significantly better results due to the selection of a suitable time for collecting Landsat images. Additionally, the time consumption for producing maps in GEE was shorter than for other classification methods. Our findings clarify the importance of the PBTC method for land cover mapping, and confirm that this is a good and sensitive method based on seasonal variations.
However, open forest classification is quite challenging, and is a limitation of our study, because open forest coverage was smaller and mixed with croplands. Furthermore, there is also the possibility of misclassification due to soil reflectivity. As we obtained the Landsat collection during the dry season, the temperature was high. This temperature increment can cause the shedding of leaves and drying out of vegetation. As a result, the soil becomes exposed to sunlight, and this may affect the EVI thresholds, leading to misclassification [33]. In dry zones, the distinction between trees and shrubs is critical for land use and land cover classification [103,104]. In particular, climatological factors play a significant role in determining the phenological cycles of vegetation throughout the year [104,105]. Our analysis highlights the fact that increases in spatial resolution from moderate to high can improve the classification performance and differentiation of permanent trees from seasonal vegetation.
GEE, like most commercial image processing tools, provides user help in the form of readily available online documentation and tutorials, with a discussion forum to learn, clarify user questions, and share experiences. Unlike most commercial image processing applications, GEE does not require any special hardware. It does, however, necessitate a constant internet connection, which may not always be available [106]. Despite this, remote sensing has become more accessible through this open-access platform. Remarkably, GEE has made it feasible to interpret large amounts of satellite images quickly and reliably, for various purposes, including forest cover mapping and assessment.
Although GEE is a cloud-computing platform, it has a wide range of applications incorporating the monitoring and management of natural resources. However, this platform is highly beneficial for developing countries to collect required historical data where data are lacking. The combination of GEE and PBTC can be used to perform meaningful spatial data analysis. It has many advanced features to process big data for spatial assessments. The forest cover change assessment can be used to estimate the carbon stocks, baseline carbon emissions, and removals needed for measuring and monitoring the performance of REDD+ and obtaining result-based financial incentives. Furthermore, estimating forest cover change can be used to better understand the proximate and underlying drivers of deforestation and forest degradation at the district level. The trends in forest cover changes found in this study can be utilized to quantify baseline forest loss and carbon stocks, and compare carbon emissions with project actions, and are also beneficial for conserving and sustainably managing forests at various levels. Our findings can greatly help existing policies and measures (the national forest policy, national climate change policy, forest planting and restoration, and NRIFAP) to achieve their goals to obtain carbon-based incentives with the reality of subnational level consideration [107].

3.5. Carbon Loss or Gain Due to Forest Cover Change

Using an average carbon stock (aboveground, belowground, and litter were incorporated in this assessment) of 134.6 MgC ha−1 for dry monsoon forest and 28.6 MgC ha−1 for open forest [22,108], total carbon stocks in dry monsoon forest were estimated at 14,941,360.9 MgC in 2001, but declined to 14,084,772.1 MgC in 2020, representing a loss of 45,083.6 MgC/year, or about 165,306.6 MgCO2/year (=45,083.6 × (44/12), the molecular weight ratio of CO2 to carbon) (Table 7) . The dry monsoon forest occupied a higher area in land extent than open forest, and this forest type is a major carbon reservoir in this district. Surprisingly, the carbon stocks stored in dry monsoon forest gradually decreased, with an annual reduction of 5.7%. Our findings clearly show that this forest type becomes a carbon source. There was a more than two-fold reduction in carbon stocks in dry monsoon forest and discharged carbon emissions between 2010 and 2020, compared to the loss in carbon stocks from 2001 to 2010. If a retrospective approach is adopted for establishing the subnational FREL, the FREL for Vavuniya District is equivalent to 165,306.6 MgCO2/year. Between 2001 and 2020, carbon stocks in dry monsoon forest showed a continuous decline due to forest cover loss. This result shows a need for appropriate conservation and management strategies through the implementation of REDD+ to reduce the loss in carbon stocks and emissions due to the changes in dry monsoon forest cover. These strategies under the REDD+ can yield reductions in carbon emissions, and could also contribute towards developing countries receiving economic incentives under the element of reducing emissions from deforestation as part of the REDD+ scheme.
In contrast, total carbon stocks in open forest were estimated at 181,065.3 MgC in 2001, but increased to 305,763.0 MgC in 2020, representing a gain of 6563.0 MgC/year, or sequestering (removal) about 24,064.5 MgCO2 annually. This gain in carbon removal could be eligible for financing support under the element of enhancement of forest carbon stocks of the REDD+ scheme of the UNFCCC. In total, open forest lost about 731,891.1 MgC (0.3%/year), causing net emissions of 2,683,600.8 MgCO2 between 2001 and 2020, or about 141,242.1 MgCO2/year (Table 7). Overall, the district’s forests were a source of carbon emissions. The net emissions and annual emissions were about 6.9% and 0.36% of Sri Lanka’s total emissions in 2018, reported in the climate analysis indicators tool [109], indicating that reducing emissions from deforestation and enhancing forest carbon stocks through forest restoration could have an important role in achieving the national emission reduction target in Sri Lanka.

3.6. EVI Thresholds and their Impact on Land Cover Assessment and Carbon Stocks

In addition to the EVI thresholds in Table 2, we applied three different EVI threshold values (Model 1 (M1), Model 2 (M2), and Model 3 (M3)) for each land cover category, except water bodies (Table 8), to show the impacts of different EVI threshold applications on the land cover assessment. Notably, the overall average accuracy and kappa coefficient of M1, M2, and M3 were less than 80% and 0.80, respectively. However, we reinstate that the land cover maps produced using the Table 2 EVI thresholds yielded overall accuracy and kappa coefficient above 80% and 0.8, considered as the best-fit model for this study. There was a misclassification among the land cover classes due to the different threshold values of M1, M2, and M3. By applying different EVI threshold values, a range of biases in dry monsoon and open forest cover and carbon stocks occur, as shown in Table 8, when compared with our best-fit model (Table 3) results. Similarly, the percentage bias of each model was estimated for both forest covers (Figure 7). The EVI threshold range for open forest was narrower than for dry monsoon forest. Therefore, the selection of EVI range for open forest cover estimation is challenging because the EVI range was comparatively narrow. The highest percentage of bias range was observed in M1, while the lowest percentage was in M3, for open and dry monsoon forest covers, respectively (Figure 7). Additionally, this study estimated that the root mean square errors (RMSEs) of M1, M2, and M3 for open forest cover were 31,738 ha, 15,901 ha, and 14,709 ha, while RMSEs for dry monsoon forest cover were 22,199 ha, 6715 ha, and 929 ha, respectively. These three models incorporating EVI thresholds resulted in higher error, and also did not satisfy the overall accuracy above 80%. Overall, the dry monsoon and open forest covers, and carbon stocks, were either underestimated or overestimated, depending on the chosen EVI values. Accordingly, these biases can lead to a significant change in the degree of carbon emission and removal (Table 9).
The following previous studies found similar results to ours. For example, the variability in EVI thresholds underestimated the soybean cultivation area by 11.4%, while areas of rice field and silviculture were overestimated by 12.8% and 14.3%, respectively [110]. Similarly, three EVI values (0.400, 0.450, and 0.500) used for classifying forests in Guyana, produced biases of 10.0% to 30.0% from lower to higher EVI thresholds [111]. These studies support the notion that, if threshold values are changed, biases can occur in land cover classification and assessment.

4. Conclusions

This study is the first to attempt to classify forest cover categories using the PBTC method. We used multitemporal Landsat 5 TM images for land cover mapping in 2001, 2006, and 2010, while Landsat 8 OLI collections were acquired in 2016 and 2020, with 30 m spatial resolution. This is the first study to have found EVI minimum and maximum threshold values for dry monsoon and open forests for PBTC classification in GEE to classify the land cover classes during the dry season. This season is preferable due to the low cloud cover, and an appropriate selection of EVI threshold values for each land cover class can reduce bias in the land cover classification. Notably, the average accuracy and kappa coefficient of land cover maps were 87% and 0.83, respectively. This shows that a combined method of PBTC and GEE can be used to assess the forest cover changes with higher accuracy, which is especially important in regions with limited historical data, mainly in developing countries. The annual forest cover change was −105.18 ha, and forest area decreased by 0.09% per annum between 2001 and 2020. From 2001 to 2010, forest cover increased by 4.62%, and district forest declined by 6.04% during 2010–2020. The annual rate of loss and gain in dry monsoon and open forest were 0.3% and 3.62%, respectively. Among four DS divisions, we observed the highest forest loss in the Vavuniya North division, at 19.2%. This can hasten negative consequences because of the continuous loss of dry monsoon forests. Changes in forest cover resulted in carbon emissions of 165,306.6 MgCO2, and removals of 24,064.5 MgCO2 annually, between 2001 and 2020.
To the best of our knowledge, this study is the first to develop a subnational FREL in Sri Lanka. Developing countries such as Sri Lanka, where data limitations occur, can utilize the satellite-based inventory through GEE to obtain long-term forest cover data. Therefore, the information on district-level forest cover, and carbon emissions and removals could provide the basis for the Sri Lankan government to determine the subnational FREL, against which, activity-based emission performance during the implementation period of the Paris Agreement between 2020 and 2030 can be compared, and the emission reductions could be claimed for financial support in future under the result-based payment of the REDD+ scheme of the UNFCCC. This study could provide support to environmentalists, forest conservationists and scientists, and decision and policymakers, to integrate the forest sector into future climate change plans to maximize the benefits. Appropriate strategies could provide a district-level contribution to achieving the NDC targets, while gaining benefits for national development.

Author Contributions

Conceptualization, S.V.; methodology, M.V.; validation, S.V.; formal analysis, S.V.; writing—original draft preparation, S.V.; writing—review and editing, N.S.; visualization, N.S., M.V., N.K.T. and T.W.T.; supervision, N.S., M.V., N.K.T. and T.W.T.; funding acquisition, I.A. All authors have read and agreed to the published version of the manuscript.

Funding

This research was funded by the Accelerating Higher Education Expansion and Development (AHEAD) project, World Bank, Sri Lanka, and the Asian Institute of Technology, Thailand.

Institutional Review Board Statement

Not applicable.

Informed Consent Statement

Not applicable.

Data Availability Statement

All relevant data sets in this study are described in the manuscript.

Acknowledgments

We would like to acknowledge the sponsors of the Accelerating Higher Education Expansion and Development (AHEAD) project, Sri Lanka, and the Asian Institute of Technology, Thailand.

Conflicts of Interest

The authors declare no conflict of interest.

References

  1. Wang, D.; Yang, X.; Xing, W.; Liu, C.; Chang, H. Ecosystem health and forest ecosystem management. In Proceedings of the IOP Conference Series: Earth and Environmental Science, Jeju Island, Korea, 25–27 August 2020; Volume 598, p. 012028. [Google Scholar]
  2. Negassa, M.D.; Mallie, D.T.; Gemeda, D.O. Forest cover change detection using geographic information systems and remote sensing techniques: A spatio-temporal study on Komto Protected forest priority area, East Wollega Zone, Ethiopia. Environ. Syst. Res. 2020, 9, 1–14. [Google Scholar] [CrossRef]
  3. Fadli, A.H.; Kosugo, A.; Ichii, K.; Ramli, R. Satellite-based monitoring of forest cover change in indonesia using google earth engine from 2000 to 2016. J. Phys. Conf. Ser. 2019, 1317, 012046. [Google Scholar] [CrossRef]
  4. United nation Convention Framework on Climate Change (UNFCCC). Report of the Conference of the Parties on Its Sixteenth Session, Held in Cancun from 29 November to 10 December 2010. Addendum; Part Two: Action Taken by the Conference of the Parties at Its Sixteenth Session. Available online: https://unfccc.int/documents/6527 (accessed on 20 May 2022).
  5. UNFCCC. COP26: Pivotal Progress Made on Sustainable Forest Management and Conservation. Available online: https://unfccc.int/news/cop26-pivotal-progress-made-on-sustainable-forest-management-and-conservation (accessed on 20 May 2022).
  6. FRA Platform. Available online: https://fra-platform.herokuapp.com/LKA/fra2020/home (accessed on 20 May 2022).
  7. Gizachew, B.; Duguma, L.A. Forest carbon monitoring and reporting for REDD+: What future for Africa? Environ. Manag. 2016, 58, 922–930. [Google Scholar] [CrossRef] [PubMed]
  8. FAO UN-REDD Programme Secretariat Emerging approaches to Forest Reference Emission Levels and Forest Reference Levels for REDD+. Available online: https://www.fao.org/3/i4846e/i4846e.pdf (accessed on 1 June 2022).
  9. Report on South-South Learning: The Forest Reference Level (FRL) Assessment Process in Asia and the Pacific April 2017, Pokhara, Nepal; ICIMOD Workshop Report; International Centre for Integrated Mountain Development (ICIMOD): Kathmandu, Nepal, 2018. [CrossRef]
  10. Sasaki, N.; Chheng, K.; Mizoue, N.; Abe, I.; Lowe, A.J. Forest reference emission level and carbon sequestration in Cambodia. Glob. Ecol. Conserv. 2016, 7, 82–96. [Google Scholar] [CrossRef] [Green Version]
  11. Goslee, K.M.; Pearson, T.R.H.; Bernal, B.; Simon, S.L.; Sukhdeo, H. Comprehensive accounting for REDD+ programs: Apragmatic approach as exemplified in Guyana. Forest 2020, 11, 1265. [Google Scholar] [CrossRef]
  12. UNFCCC. Report of the Conference of the Parties on Its Sixteenth Session, Held in Cancun from 29 November to 10 December 2010. Part One: Proceedings. Available online: https://unfccc.int/documents/6525 (accessed on 20 May 2022).
  13. FAO. From Reference Levels to Results Reporting: REDD+ under the United Nations Framework Convention on Climate Change 2020 Update Food and Agriculture Organization of the United Nations Rome; FAO: Rome, Italy, 2020. [Google Scholar] [CrossRef]
  14. Technical Considerations for Forest Reference Emission Level and/or Forest Reference Level Construction for REDD+ under the UNFCCC-UN-REDD Programme Collaborative Online Workspace. Available online: https://www.unredd.net/documents/global-programme-191/mrv-and-monitoring-296/frl/14118-technical-considerations-for-forest-reference-emission-level-andor-forest-reference-level-construction-for-redd-under-the-unfccc.html?path=global-programme-191/mrv-and-monitoring-296/frl (accessed on 20 May 2022).
  15. Huettner, M.; Leemans, R.; Kok, K.; Ebeling, J. A comparison of baseline methodologies for “reducing emissions from deforestation and degradation”. Carbon Balance Manag. 2009, 4, 1–12. [Google Scholar] [CrossRef] [Green Version]
  16. Teimoory, N.; Sasaki, N.; Abe, I. Estimation of baseline emissions, forest reference emission level, and carbon removals due to forest area changes in Afghanistan between 1993 and 2030. Clean. Prod. Lett. 2022, 2, 100003. [Google Scholar] [CrossRef]
  17. United Nations Development Programme. Charting A New Low-Carbon Route to Development a Primer on Integrated Climate Change Planning for Regional Governments; United Nations Development Programme Environment & Energy Group, BDP: New York, NY, USA, 2009. [Google Scholar]
  18. Climate Focus. The Why and How of Subnational REDD+ What Does “Subnational” Mean? 2013. Available online: https://gcftf.org/wp-content/uploads/2020/12/The_Why_and_How_of_Subnational_REDD.pdf (accessed on 20 May 2022).
  19. Bhan, M.; Gingrich, S.; Roux, N.; Le Noë, J.; Kastner, T.; Matej, S.; Schwarzmueller, F.; Erb, K.H. Quantifying and attributing land use-induced carbon emissions to biomass consumption: A critical assessment of existing approaches. J. Environ. Manag. 2021, 286, 112228. [Google Scholar] [CrossRef]
  20. Zhang, X.; Long, T.; He, G.; Guo, Y. Gobal forest cover mapping using landsat and google earth engine cloud computing. In Proceedings of the 2019 8th International Conference Agro-Geoinformatics, Agro-Geoinformatics, Istanbul, Turkey, 16–19 July 2019. [Google Scholar] [CrossRef]
  21. UN-REDD Program. Programme. Sri Lanka’s Forest Reference Level Submission to the UNFCCC; Sri Lanka UN-REDD Programme: Colombo, Sri Lanke, 2017. [Google Scholar]
  22. Food and Agriculture Organization of the United Nations. Global Forest Resources Assessment (FRA) 2020: Sri Lanka-Report, Sri Lanka; FAO: Rome, Italy, 2020. [Google Scholar]
  23. Fernando, S.; Senaratna, N.; Pallewatta, E.; Lokupitiya, L.; Manawadu, L.; Imbulana, I.D.S.; Ranwala, S. Assessment of Key Policies and Measures to Address the Drivers of Deforestation and Forest Degradation in Sri Lanka; The United Nations Development Programme for the Sri Lanka UN-REDD Programme: Colombo, Sri Langka, 2015. [Google Scholar]
  24. Mattsson, E.; Persson, M.; Ostwald, M.; Nissanka, S.P.; Persson, U.M. REDD plus readiness implications for Sri Lanka in terms of reducing deforestation REDD+ readiness implications for Sri Lanka in terms of reducing deforestation. J. Environ. Manag. 2008, 100, 29–40. [Google Scholar] [CrossRef] [Green Version]
  25. Chokkalingam, U.; Anuradha Vanniarachchy, S. Sri Lanka’s REDD+ Potential: Myth or Reality? Forest Carbon Asia: Colombo, Sri Lanka, 2011. [Google Scholar]
  26. Google Earth Engine. Available online: https://earthengine.google.com/ (accessed on 20 May 2022).
  27. Gorelick, N.; Hancher, M.; Dixon, M.; Ilyushchenko, S.; Thau, D.; Moore, R. Google Earth Engine: Planetary-scale geospatial analysis for everyone. Remote Sens. Environ. 2017, 202, 18–27. [Google Scholar] [CrossRef]
  28. Simonetti, D.; Simonetti, E.; Szantoi, Z.; Lupi, A.; Eva, H.D. First results from the Phenology-Based Synthesis classifier using Landsat 8 imagery. IEEE Geosci. Remote Sens. Lett. 2015, 12, 1496–1500. [Google Scholar] [CrossRef]
  29. Marambe, B.; Punyawardena, R.; Silva, P.; Premalal, S.; Rathnabharathie, V.; Kekulandala, B.; Nidumolu, U.; Howden, M. Climate, climate risk, and food security in sri lanka: Need for strengthening adaptation strategies. In Handbook of Climate Change Adaptation; Leal, W., Ed.; Springer: Berlin/Heidelberg, Germany, 2015. [Google Scholar]
  30. Burt, T.P.; Weerasinghe, K.D.N. Rainfall distributions in Sri Lanka in time and space: An analysis based on daily rainfall data. Climate 2014, 2, 242–263. [Google Scholar] [CrossRef] [Green Version]
  31. Forest Department. 2011; Forest Cover 2010, Sri Lanka. Available online: https://redd.unfccc.int/files/sri_lanka___s_forest_reference_level_submission_to_the_unfccc-06jan2017.pdf (accessed on 1 June 2022).
  32. Landsat 8|U.S. Geological Survey. Available online: https://www.usgs.gov/landsat-missions/landsat-8 (accessed on 27 June 2022).
  33. Dong, J.; Xiao, X.; Menarguez, M.A.; Zhang, G.; Qin, Y.; Thau, D.; Biradar, C.; Moore, B. Mapping paddy rice planting area in northeastern Asia with Landsat 8 images, phenology-based algorithm and Google Earth Engine. Remote Sens. Environ. 2016, 185, 142. [Google Scholar] [CrossRef] [PubMed] [Green Version]
  34. Zhou, Y.; Xiao, X.; Qin, Y.; Dong, J.; Zhang, G.; Kou, W.; Jin, C.; Wang, J.; Li, X. Mapping paddy rice planting area in rice-wetland coexistent areas through analysis of Landsat 8 OLI and MODIS images. Int. J. Appl. Earth Obs. Geoinf. 2016, 46, 1. [Google Scholar] [CrossRef] [Green Version]
  35. Schwieder, M.; Leitão, P.J.; Pinto, J.R.R.; Teixeira, A.M.C.; Pedroni, F.; Sanchez, M.; Bustamante, M.M.; Hostert, P. Landsat phenological metrics and their relation to aboveground carbon in the Brazilian Savanna. Carbon Balance Manag. 2018, 13. [Google Scholar] [CrossRef] [PubMed] [Green Version]
  36. Venkatappa, M.; Sasaki, N.; Anantsuksomsri, S.; Smith, B. Applications of the Google Earth Engine and phenology-based threshold classification method for mapping forest cover and carbon stock changes in Siem Reap Province, Cambodia. Remote Sens. 2020, 12, 3110. [Google Scholar] [CrossRef]
  37. Hansen, M.C.; Potapov, P.V.; Moore, R.; Hancher, M.; Turubanova, S.A.; Tyukavina, A.; Thau, D.; Stehman, S.V.; Goetz, S.J.; Loveland, T.R.; et al. High-resolution global maps of 21-st-century forest cover change|GLAD. Science 2013, 342, 850–853. [Google Scholar] [CrossRef] [PubMed] [Green Version]
  38. Chen, G.; Hay, G.J.; Carvalho, L.M.T.; Wulder, M.A.; Gang, C. Object-based change detection. Int. J. Remote Sens. 2012, 33, 4434–4457. [Google Scholar] [CrossRef]
  39. White, M.A.; de Beurs, K.M.; Didan, K.; Inouye, D.W.; Richardson, A.D.; Jensen, O.P.; O’Keefe, J.; Zhang, G.; Nemani, R.R.; van Leeuwen, W.J.D.; et al. Intercomparison, interpretation, and assessment of spring phenology in North America estimated from remote sensing for 1982–2006. Glob. Chang. Biol. 2009, 15, 2335–2359. [Google Scholar] [CrossRef]
  40. Zhou, L.; Tucker, C.J.; Kaufmann, R.K.; Slayback, D.; Shabanov, N.V.; Myneni, R.B. Variations in northern vegetation activity inferred from satellite data of vegetation index during 1981 to 1999. J. Geophys. Res. Atmos. 2001, 106, 20069–20083. [Google Scholar] [CrossRef]
  41. Kumar, L.; Mutanga, O. Google Earth Engine applications since inception: Usage, trends, and potential. Remote Sens. 2018, 10, 1509. [Google Scholar] [CrossRef] [Green Version]
  42. Huang, H.; Chen, Y.; Clinton, N.; Wang, J.; Wang, X.; Liu, C.; Gong, P.; Yang, J.; Bai, Y.; Zheng, Y.; et al. Mapping major land cover dynamics in Beijing using all landsat images in Google Earth Engine. Remote Sens. Environ. 2017, 202, 166–176. [Google Scholar] [CrossRef]
  43. Ramirez-Reyes, C.; Brauman, K.A.; Chaplin-Kramer, R.; Galford, G.L.; Adamo, S.B.; Anderson, C.B.; Anderson, C.; Allington, G.R.H.; Bagstad, K.J.; Coe, M.T.; et al. Reimagining the potential of Earth observations for ecosystem service assessments. Sci. Total Environ. 2019, 665, 1053–1063. [Google Scholar] [CrossRef] [PubMed]
  44. Kou, W.; Liang, C.; Wei, L.; Hernandez, A.J.; Yang, X. Phenology-based method for mapping tropical evergreen forests by integrating of MODIS and landsat imagery. Forest 2017, 8, 34. [Google Scholar] [CrossRef]
  45. Huete, A.; Didan, K.; Miura, T.; Rodriguez, E.P.; Gao, X.; Ferreira, L.G. Overview of the radiometric and biophysical performance of the MODIS vegetation indices. Remote Sens. Environ. 2002, 83, 195–213. [Google Scholar] [CrossRef]
  46. Jackson, R.D.; Huete, A.R. Interpreting vegetation indices. Prev. Vet. Med. 1991, 11, 185–200. [Google Scholar] [CrossRef]
  47. Gao, Y.; Mas, J.F. A Comparison Of The Performance Of Pixel-Based And Object-Based Classifications Over Images With Various Spatial Resolutions. Online J. Earth Sci. 2008, 2, 27–35. [Google Scholar]
  48. Vermote, E.; Justice, C.; Claverie, M.; Franch, B. Preliminary analysis of the performance of the Landsat 8/OLI land surface reflectance product. Remote Sens. Environ. 2016, 85, 46. [Google Scholar] [CrossRef]
  49. Wang, J.; Xiao, X.; Qin, Y.; Dong, J.; Zhang, G.; Kou, W.; Jin, C.; Zhou, Y.; Zhang, Y. Mapping paddy rice planting area in wheat-rice double-cropped areas through integration of Landsat-8 OLI, MODIS and PALSAR images. Sci. Rep. 2015, 5, 1–11. [Google Scholar] [CrossRef] [Green Version]
  50. Adole, T.; Dash, J.; Atkinson, P.M. Characterising the land surface phenology of Africa using 500 m MODIS EVI. Appl. Geogr. 2018, 90, 187–199. [Google Scholar] [CrossRef] [Green Version]
  51. Venkatappa, M.; Sasaki, N.; Shrestha, R.P.; Tripathi, N.K.; Ma, H.O. Determination of vegetation thresholds for assessing land use and land use changes in Cambodia using the Google Earth Engine cloud-computing platform. Remote Sens. 2019, 11, 1514. [Google Scholar] [CrossRef] [Green Version]
  52. Dalmiya, C.P.; Santhi, N.; Sathyabama, B. A novel feature descriptor for automatic change detection in remote sensing images. Egypt J. Remote Sens. Sp. Sci. 2019, 22, 183–192. [Google Scholar] [CrossRef]
  53. Stehman, S.V.; Foody, G.M. Key issues in rigorous accuracy assessment of land cover products. Remote Sens. Environ. 2019, 231, 111199. [Google Scholar] [CrossRef]
  54. Elhag, M.; Boteva, S.; Al-Amri, N. Forest cover assessment using remote-sensing techniques in Crete Island, Greece. Open Geosci. 2021, 13, 345–358. [Google Scholar] [CrossRef]
  55. Situmorang, J.P.; Situmorang, J.P.; Sugianto, S.; Darusman, D. Estimation of carbon stock stands using EVI and NDVI vegetation index in production forest of Lembah Seulawah sub-district, Aceh Indonesia. Aceh Int. J. Sci. Technol. 2016, 5, 126–139. [Google Scholar] [CrossRef] [Green Version]
  56. Tsutsumida, N.; Comber, A.J. Measures of spatio-temporal accuracy for time series land cover data. Int. J. Appl. Earth Obs. Geoinf. 2015, 41, 46–55. [Google Scholar] [CrossRef]
  57. Disperati, L.; Virdis, S.G.P. Assessment of land-use and land-cover changes from 1965 to 2014 in Tam Giang-Cau Hai Lagoon, central Vietnam. Appl. Geogr. 2015, 58, 48–64. [Google Scholar] [CrossRef]
  58. Campbell, J.B.; Wynne, R.H. Introduction to Remote Sensing; Guilford Press: New York, NY, USA, 2011. [Google Scholar]
  59. Potere, D. Horizontal positional accuracy of Google Earth’s high-resolution imagery archive. Sensors 2008, 8, 7973–7981. [Google Scholar] [CrossRef]
  60. Tilahun, A. Accuracy assessment of land use land cover classification using Google Earth. Am. J. Environ. Prot. 2015, 4, 193. [Google Scholar] [CrossRef]
  61. Olofsson, P.; Foody, G.M.; Herold, M.; Stehman, S.V.; Woodcock, C.E.; Wulder, M.A. Good practices for estimating area and assessing accuracy of land change. Remote Sens. Environ. 2014, 148, 42–57. [Google Scholar] [CrossRef]
  62. Esri 2D, 3D & 4D GIS Mapping Software|ArcGIS Pro. Available online: https://www.esri.com/en-us/arcgis/products/arcgis-pro/overview (accessed on 25 June 2022).
  63. Foody, G.M. Explaining the unsuitability of the kappa coefficient in the assessment and comparison of the accuracy of thematic maps obtained by image classification. Remote Sens. Environ. 2020, 239, 111630. [Google Scholar] [CrossRef]
  64. Zhao, X.; Chen, X.; Tian, L.; Wang, T.; Stein, A. Assessment of extensional uncertainty modeled by random sets on segmented objects from remote sensing images. Remote Sens. Spat. Inf. Sci. 2010, 38. Available online: https://pdfs.semanticscholar.org/f06f/082bfa11a2502dffbe644eaed01492f3b2a7.pdf (accessed on 6 July 2022).
  65. Mishra, P.K.; Rai, A.; Rai, S.C. Land use and land cover change detection using geospatial techniques in the Sikkim Himalaya, India. Egypt. J. Remote Sens. Sp. Sci. 2020, 23, 133–143. [Google Scholar] [CrossRef]
  66. Congalton, R.G.; Green, K. Assessing the Accuracy of Remotely Sensed Data Principles and Practices, 2nd ed.; Lewis Publishers: Boca Raton, FL, USA, 2009. [Google Scholar]
  67. Nowak, M.M.; Dziób, K.; Ludwisiak, Ł.; Chmiel, J. Mobile GIS applications for environmental field surveys: A state of the art. Glob. Ecol. Conserv. 2020, 23, e01089. [Google Scholar] [CrossRef]
  68. Ranagalage, M.; Gunarathna, M.H.J.P.; Surasinghe, T.D.; Dissanayake, D.; Simwanda, M.; Murayama, Y.; Morimoto, T.; Phiri, D.; Nyirenda, V.R.; Premakantha, K.T.; et al. Multi-decadal forest-cover dynamics in the tropical realm: Past trends and policy insights for forest conservation in dry zone of Sri Lanka. Forest 2020, 11, 836. [Google Scholar] [CrossRef]
  69. FAO. Global Forest Resources Assessment 2020 Key Findings; FAO: Rome, Italy, 2020. [Google Scholar] [CrossRef]
  70. Sudhakar Reddy, C.; Saranya, K.R.L.; Vazeed Pasha, S.; Satish, K.V.; Jha, C.S.; Diwakar, P.G.; Dadhwal, V.K.; Rao, P.V.N.; Krishna Murthy, Y.V.N. Assessment and monitoring of deforestation and forest fragmentation in South Asia since the 1930s. Glob. Planet. Chang. 2018, 161, 132–148. [Google Scholar] [CrossRef]
  71. Sudhakar Reddy, C.; Manaswini, G.; Jha, C.S.; Diwakar, P.G.; Dadhwal, V.K. Development of national database on long-term deforestation in Sri Lanka. J. Indian Soc. Remote Sens. 2017, 45, 825–836. [Google Scholar] [CrossRef]
  72. Reddy, C.S.; Jha, C.S.; Dadhwal, V.K. Assessment and monitoring of long-term forest cover changes (1920–2013) in Western Ghats biodiversity hotspot. J. Earth Syst. Sci. 2016, 125, 103–114. [Google Scholar] [CrossRef]
  73. Armenteras, D.; Espelta, J.M.; Rodríguez, N.; Retana, J. Deforestation dynamics and drivers in different forest types in Latin America: Three decades of studies (1980–2010). Glob. Environ. Chang. 2017, 46, 139–147. [Google Scholar] [CrossRef]
  74. Eedelen, W. Conservation of biodiversity in a hotspot: Sri Lanka’s amphibians and reptiles. Amphib. Reptile Conserv. 2012, 5, 33–51. [Google Scholar]
  75. Wickramagamage, P. Large-scale deforestation for plantation agriculture in the hill country of Sri Lanka and its impacts. Hydrol. Processes 1998, 12, 2015–2028. [Google Scholar] [CrossRef]
  76. Fernando, G.M.T.; Edussuriya, C. Identification of forest cover changes in Polonnaruwa District of Sri Lanka. In Proceedings of the 37th Asian Conference Remote Sensing (ACRS 2016), Colombo, Sri Lanka, 17–21 October 2016; pp. 224–228. [Google Scholar]
  77. Nissanka, S.; Fernando, H.S.; Mapa, R. Natural Vegetation Types in Dry Zone of Sri Lanka and Their Characteristics; Mapa, R., Somasiri, A., Dassanayake, A., Eds.; Survodaya Vishva Lekha: Colombo, Sri Lanka, 2010. [Google Scholar]
  78. Nair, K.K.N. Monsoon forests (Southern and Southeast Asia). In Tropical Forests/Monsoon Forests (Southern and Southeast Asia); Elsevier Ltd.: Amsterdam, The Netherlands, 2004. [Google Scholar]
  79. Todorov, V.; Dimov, I.; Ostromsky, T.; Apostolov, S.; Georgieva, R.; Dimitrov, Y.; Zlatev, Z. Advanced stochastic approaches for Sobol’ sensitivity indices evaluation. Neural Comput. Appl. 2021, 33, 1999–2014. [Google Scholar] [CrossRef]
  80. Miththapala, S. Conservation revisited. Ceylon J. Sci. Biol. Sci. 2016, 44, 1. [Google Scholar] [CrossRef]
  81. Understanding Provincial-Level Climate Vulnerabilities in Sri Lanka-Blog-Knowledge Hub. Available online: https://www.slycantrust.org/blog-posts-knowledge/understanding-provincial-level-climate-vulnerabilities-in-sri-lanka (accessed on 21 May 2022).
  82. Ellis, S.; Taylor, D.; Masood, K. Soil formation and erosion in the Murree Hills, northeast Pakistan. Catena 1994, 22, 69–78. [Google Scholar] [CrossRef]
  83. Siddiqui, K. The forest and climate changes in Pakistan. Pak. J. 1991, 41, 6–13. [Google Scholar]
  84. Gery, M.W.; Whitten, G.Z.; Killus, J.P.; Dodge, M.C. A photochemical kinetics mechanism for urban and regional scale computer modeling. J. Geophys. Res. Atmos. 1989, 94, 12925–12956. [Google Scholar] [CrossRef]
  85. Kleinn, C. New technologies and methodologies for national forest inventories. Unasylva 2002, 210, 10–15. [Google Scholar]
  86. Sasaki, N.; Abe, I.; Khun, V.; Chan, S.; Ninomiya, H.; Chheng, K. Reducing carbon emissions through improved forest management in cambodia. Low Carbon Econ. 2013, 4, 55–67. [Google Scholar] [CrossRef] [Green Version]
  87. Pathmanandakumar, V.; Thasarathan, N. Mapping and analysis of land cover/land use change in vavuniya ds division of vavuniya district. Sri Lanka J. South Asian Stud. 2017, 3, 61–74. [Google Scholar]
  88. Johnson, S.A. The cost of war on public health: An exploratory method for understanding the impact of conflict on public health in Sri Lanka. PLoS ONE 2017, 12, 166674. [Google Scholar] [CrossRef]
  89. Chandran, S. Challenges of IDP resettlement in Sri Lanka: An examination of north spring program in Vavuniya district. J. Dev. Coop. 2012, 18, 65–82. [Google Scholar]
  90. Situation Report. Available online: https://www.sundaytimes.lk/030921/columns/sitrep.html (accessed on 21 May 2022).
  91. UN-REDD Programme. Land Tenure Considerations in Sri Lanka’s Proposed National REDD+ Strategy; Sri Lanka UN-REDD Programme: Battaramulla, Sri Lanka, 2016. [Google Scholar]
  92. Tripathi, S.; Subedi, R.; Adhikari, H. Forest cover change pattern after the intervention of community forestry management system in the mid-hill of Nepal: A case study. Remote Sens. 2020, 12, 2756. [Google Scholar] [CrossRef]
  93. Allen, J.C.; Barnes, D.F. The causes of deforestation in developing countries. Ann. Assoc. Am. Geogr. 1985, 75, 163–184. [Google Scholar] [CrossRef]
  94. Pahari, K.; Murai, S. Modelling for prediction of global deforestation based on the growth of human population. ISPRS J. Photogramm. Remote Sens. 1999, 54, 317–324. [Google Scholar] [CrossRef]
  95. Paranage, K. The Mahaweli development project and the “rendering technical” of agrarian development in Sri Lanka. Heliyon 2019, 5. [Google Scholar] [CrossRef] [PubMed] [Green Version]
  96. Sri Lanka’s Environmentalists Brace for Economic Meltdown’s Toll on Nature. Available online: https://news.mongabay.com/2022/05/sri-lankas-environmentalists-brace-for-economic-meltdowns-toll-on-nature/ (accessed on 21 May 2022).
  97. Land Use Policy Planning Department. Land Use Plan Vauniya District Prepared on the Recommendations Given by the Lessons Learnt and Reconciliation Commission (LLRC); Land Use Policy Planning Department: Vavuniya, Sri Lanka, 2016.
  98. McHugh, M.L. Interrater reliability: The kappa statistic. Biochem. Med. 2012, 22, 276. [Google Scholar] [CrossRef]
  99. Diniz, C.; Cortinhas, L.; Nerino, G.; Rodrigues, J.; Sadeck, L.; Adami, M.; Souza-Filho, P.W.M. Brazilian mangrove status: Three decades of satellite data analysis. Remote Sens. 2019, 11, 808. [Google Scholar] [CrossRef] [Green Version]
  100. Noi Phan, T.; Kuch, V.; Lehnert, L.W. Land cover classification using Google Earth Engine and random forest classifier—The role of image composition. Remote Sens. 2020, 12, 2411. [Google Scholar] [CrossRef]
  101. Champagne, C.; McNairn, H.; Daneshfar, B.; Shang, J. A bootstrap method for assessing classification accuracy and confidence for agricultural land use mapping in Canada. Int. J. Appl. Earth Obs. Geoinf. 2014, 29, 44–52. [Google Scholar] [CrossRef] [Green Version]
  102. Phinzi, K.; Abriha, D.; Szabó, S. Classification efficacy using k-fold cross-validation and bootstrapping resampling techniques on the example of mapping complex gully systems. Remote Sens. 2021, 13, 2980. [Google Scholar] [CrossRef]
  103. Seddon, A.W.R.; Macias-Fauria, M.; Long, P.R.; Benz, D.; Willis, K.J. Sensitivity of global terrestrial ecosystems to climate variability. Nature 2016, 531, 229–232. [Google Scholar] [CrossRef] [PubMed] [Green Version]
  104. Ahlström, A.; Raupach, M.R.; Schurgers, G.; Smith, B.; Arneth, A.; Jung, M.; Reichstein, M.; Canadell, J.G.; Friedlingstein, P.; Jain, A.K.; et al. The dominant role of semi-arid ecosystems in the trend and variability of the land CO2 sink. Science 2015, 348, 895–899. [Google Scholar] [CrossRef] [PubMed] [Green Version]
  105. Moulin, S.; Kergoat, L.; Viovy, N.; Dedieu, G. Global-scale assessment of vegetation phenology using NOAA/AVHRR satellite measurements. J. Clim. 1997, 10, 1154–1170. [Google Scholar] [CrossRef]
  106. Tang, G.; Iii, J.A.A.; Verburg, P.S.J.; Jasoni, R.L.; Sun, L. Trends and climatic sensitivities of vegetation phenology in semiarid and arid ecosystems in the US Great Basin during 1982–2011. Biogeosciences 2015, 12, 6985–6997. [Google Scholar] [CrossRef] [Green Version]
  107. The Ministry of Mahaweli Development and Environment. Sri Lanka National REDD+ Investment Framework and Action Plan (NRIFAP). 1/2-UN-REDD Programme Collaborative Online Workspace; REDD+Sri Lanka: Battaramulla, Sri Lanka, 2017.
  108. Mattsson, E.; Ostwald, M.; Wallin, G.; Nissanka, S.P. Heterogeneity and assessment uncertainties in forest characteristics and biomass carbon stocks: Important considerations for climate mitigation policies. Land Use Policy 2016, 59, 84–94. [Google Scholar] [CrossRef]
  109. World|Total Including LUCF|Greenhouse Gas (GHG) Emissions|Climate Watch. Available online: https://www.climatewatchdata.org/ghg-emissions (accessed on 21 May 2022).
  110. Mengue, V.P.; Fontana, D.C.; Da Silva, T.S.; Zanotta, D.; Scottá, F.C. Methodology for classification of land use and vegetation cover using MODIS-EVI data. Rev. Bras. Eng. Agríc. Ambient. 2019, 23, 812–818. [Google Scholar] [CrossRef]
  111. Guyana Forestry Commission. Guyana REDD+ Monitoring Reporting & Verification System (MRVS) Interim Measures Report; The Guyana Forestry: Georgetown, Guyana, 2010.
Figure 1. Maps showing the location of the study area in Sri Lanka and its DS divisions, and the forest cover [31] of Sri Lanka in 2010 used to visualize only the forest resources across the country.
Land 11 01061 g001
Figure 2. Visualization of land cover categories as shown both on Google Earth Pro and in the field.
Land 11 01061 g002
Figure 3. Land cover maps of Vavuniya District, Sri Lanka, in 2001 (A), 2006 (B), 2010 (C), 2016 (D), and 2020 (E).
Land 11 01061 g003aLand 11 01061 g003b
Figure 4. Overall trend in forest cover change in the study area.
Land 11 01061 g004
Figure 5. Dry monsoon and open forest cover changes between 2001 and 2020.
Land 11 01061 g005
Figure 6. Forest cover change in DS divisions, 2001–2020.
Land 11 01061 g006
Figure 7. Range of bias percentage in the M1, M2, and M3 models for open and dry monsoon forest covers from 2001 to 2020, compared with best-fit model for forest cover.
Land 11 01061 g007
Table 1. Description of land cover categories.
Land Cover CategoriesDescription
Dry monsoon forestAltitude 0–500 m, rainfall 1250–1900 mm, areas influenced by the summer monsoon, with less rainfall, 4–5 dry months, and canopy cover above 40% [22]
Open forestLand spanning more than 5 hectares, tree canopy cover between 10% and 40% [22]
Other landsCroplands, barren lands, shrubs, and settlements
Water bodiesAreas with fresh water
Table 2. Vegetation thresholds to classify the land cover categories.
Land Cover CategoriesEVI Threshold Values
Landsat 5 TMLandsat 8 OLI
MinimumMaximumMinimumMaximum
Dry monsoon forest 0.50270.7760.6500.882
Open forest0.48450.5010.6310.648
Other lands0.1100.4210.2100.556
Water bodies−0.130.105−0.130.209
Land cover categories 1 and 2 are considered as forest and the remaining are non-forest.
Table 3. Forest cover areas and their percentages for the total district.
Forest Cover ClassForest Cover Area (ha) between 2001 and 2020
2001%2006%2010%2016%2020%
Dry monsoon forest110,99055.4109,56054.7109,29554.5106,62153.2104,62752.2
Open forest63383.210,6175.313,4536.781454.0610,7025.3
Total forest area117,327120,177122,748114,766115,329
District area200,390 ha
Table 4. Annual rate of forest cover changes.
Annual Rates of Forest Cover Changes
Time FrameTotal ForestDry Monsoon ForestOpen Forest
ha/year%/yearsha/year%/yearsha/year%/years
2001–2006569.940.49−285.88−0.26855.8113.50
2006–2010642.680.53−66.45−0.06709.126.68
2010–2016−1330.27−1.08−445.54−0.41−884.74−6.58
2016–2020140.690.12−498.67−0.47639.367.85
2001–2020−105.18−0.09−334.90−0.30229.713.62
Table 5. Annual rates of dry monsoon and open forest cover changes, from 2001–2020, by DS division.
DS DivisionDry Monsoon ForestOpen Forest
Vavuniya0.183.36
Vavuniya South0.0033.49
Vengalacheddikulam0.022.43
Vavuniya North−0.014.95
Table 6. Summary of accuracy assessment for dry monsoon and open forests.
YearDry Monsoon ForestOpen ForestOverall AccuracyKappa Coefficient
Produce AccuracyUser AccuracyProduce AccuracyUser Accuracy
2001100%83%66%94%86%0.81
200688%90%73%88%87%0.83
201086%86%80%87%86%0.81
201690%88%80%82%88%0.83
202084%91%78%80%88%0.83
Table 7. Changes in forest carbon stocks by forest type between 2001–2020.
Forest Cover ClassTotal Forest Carbon Stocks (MgC)Loss or Gain (2001–2020)
(MgCO2)
TotalAnnual
20012006201020162020
Dry monsoon14,941,360.914,748,936.914,713,157.314,353,291.814,084,772.1+3,140,827.7+165,306.6
Open forest181,065.3303,320.1384,359.6232,696.1305,763.0−457,224.9−24,064.5
Total15,122,426.215,052,257.015,097,516.914,585,987.914,390,535.1+2,683,600.8+141,242.1
Note: Plus (+) represents carbon loss or emissions and minus (−) represents gain or removals.
Table 8. M1, M2, and M3 EVI threshold values.
Land Cover CategoriesEVI Threshold Values
Landsat 5 TMLandsat 8 OLI
M1M2M3M1M2M3
Min–MaxMin–MaxMin–MaxMin–MaxMin–MaxMin–Max
Dry monsoon forest0.502–0.7760.503–07760.515–0.7760.648–0.8820.652–0.8820.666–0.882
Open forest0.485–0.4930.460–0.5020.435–0.5010.569–0.6150.581–0.6500.615–0.627
Other lands0.110–0.4600.110–0.4050.11–0.4210.210–0.5160.210–0.5690.210–0.461
Table 9. Range the estimated forest cover and carbon stocks affected by the chosen M1, M2, and M3 models by comparing with the best-fit model for forest cover and carbon stocks.
YearRange of Bias in Forest Cover (ha)Range of Bias in Carbon Stocks (MgC)
Open forestDry monsoon forestOpen forestDry monsoon forest
2001−323 to +2265 −45,889 to +340−9048.9 to +64,8016.1−6,178,856.4 to +43,652.3
2006−540 to +35,258−9989 to +562−15,144.0 to +100,8694.6−1,346,584.8 to +73,497.4
2010+373 to +44,575−15,930 to +1382+11,080.2 to +127,5251.0−2,146,234.3 to +188,154.3
2016+15,989 to +20,785−9328 to +1420+457,535.0 to +594,684.0−1,257,540.4 to +189,098.3
2020+20,863 to +29,346−11,571 to +1574+596,984.7 to +839,621.5−1,559,399.3 to +209,824.0
Note: Minus (−) represents an underestimation and plus (+) represents an overestimation in forest cover and carbon stocks.
Publisher’s Note: MDPI stays neutral with regard to jurisdictional claims in published maps and institutional affiliations.

