Article

City-Level Determinants of Household CO2 Emissions per Person: An Empirical Study Based on a Large Survey in China

1
Northwest Institute of Eco–Environment and Resources, Chinese Academy of Sciences, Lanzhou 730000, China
2
Chengdu Library and Information Center, Chinese Academy of Sciences, Chengdu 610041, China
3
College of Earth and Environmental Sciences, Lanzhou University, Lanzhou 730000, China
4
Centre for Sustainable Agricultural Systems, University of Southern Queensland, Toowoomba, QLD 4350, Australia
*
Author to whom correspondence should be addressed.
Land 2022, 11(6), 925; https://doi.org/10.3390/land11060925
Submission received: 16 May 2022 / Revised: 5 June 2022 / Accepted: 11 June 2022 / Published: 16 June 2022
(This article belongs to the Special Issue The Eco-Environmental Effects of Urban Land Use)

Abstract

:
Studies have shown that household consumption accounts for more than 60% of global greenhouse gas (GHG) emissions. Reducing household CO2 emissions (HCEs) can help combat climate change globally and can provide a wide range of environmental, financial and public health benefits. Here, we present data from a large survey on 14,928 households in eighty-eight Chinese cities to investigate the spatial patterns in HCEs per person (PHCEs) and the drivers behind these patterns based on a multi-scale geographically weighted regression (MGWR) model. We found that higher PHCEs were mainly in northern cities with a severe and cold climate. Our findings suggest that PHCEs could be modeled as a function of household size, education level, income level, consumption tendency and HCEs intensity. HCEs intensity was identified as the most important determinant, and its effect increased from eastern cities to central and western cities in China. The quantification of city-level PHCEs and their drivers help policy makers to make fair and equitable GHG mitigation polices, and they help achieve many of the United Nations Sustainable Development Goals, including affordable and clean energy, sustainable cities and communities, and climate action.

1. Introduction

At the Climate Ambition Summit on 12 December 2020, President Xi Jinping announced that China will lower its carbon intensity (CO2 emissions per unit of GDP) by over 65% by 2030 compared with the 2005 level and that it will achieve carbon neutrality before 2060 [1]. To achieve this national low-carbon goal, it is paramount to pose an optimum path of household consumption, because household consumption plays a dominant role in global greenhouse gas (GHG) emissions. For example, on average, more than 60% of global GHG emissions in 2007 were emitted from the household sector [2]. The household sector accounted for 70–80% of total CO2 emissions in the United States of America [3,4], 69% in the United Kingdom [4], and 17–40% in China [4,5,6,7]. Residents were the end consumers of goods and social services, and their consumption activities consumed energy directly or indirectly, thereby directly or indirectly causing massive CO2 emissions [5,8,9]. According to previous studies, HCEs were classified based on different consumption behaviors, including clothing, food, residence, transportation, and service HCEs, respectively [3,10,11]. With rapid urbanization and economic development in the near future, this trend will further deteriorate due to the increased needs of life and consumption levels. For example, it may lead to changes in life and consumption behavior, thereby resulting in greater uncertainty in CO2 emissions [12,13,14]. To change and optimize these household consumption behaviors, it is critical to better understand the current state of HCEs, their drivers, and their underlying mechanisms for achieving the goals of the United Nations Climate Action [7,15], which could therefore provide key data and decision-making support for the implementation of global emission reduction policies and carbon neutrality [16,17,18].
Cities play a central role in mitigating global warming and carbon neutrality because nearly two-thirds of global energy usage and more than 70% of GHG emissions occur in cities [19]. Understanding the characteristics of city-level HCEs is central to develop fair and equitable mitigation policies and to realize climate stabilization goals. Previous studies have focused mainly on discovering macro-level patterns and the driving forces of HCEs based on national or state/provincial data [5,6,7], with only a few of them focusing on city-level case analysis [20,21,22]. For example, studies focusing on national-scale surveys across Chinese cities have rarely been documented. For instance, to develop China’s Nationally Determined Contributions (NDCs), CO2 emissions within various administrative boundaries (not down to the city level) were considered [23,24]. Understanding city-level characteristics and drivers of CO2 emissions could support efforts to achieve the sustainable development goals (SDGs) of the country as well as provide a reference for policy formation [25,26,27]. Moreover, climate characteristics, household size, educational level, economic level, consumption structure and consumption concept varied in different cities, resulting in different levels of household energy usage, efficiency, and related HCEs [17,27]. Hence, large-scale surveys on city-level determinants of HCEs, using an integrated model to quantitatively assess their impacts, are still lacking. Therefore, our ability was restricted from gaining insight into the issues of HCEs and effectively evaluating the related climate action policies.
In cities throughout China, HCEs have been growing, along with improvements in living standards [5,6,7]. Similar upward trends were observed in many developing countries [2,15], which nearly accounted for more than 50% of the global population. HCEs per person (PHCEs) are an indicator that calculate HCEs on a per person basis. PHCEs in developing countries do not follow the same conventional emission trends as major developed countries, owing to the renovation of low-carbon technologies and green development concepts. Hence, from the perspective of household consumption, analyzing the spatial characteristics of PHCEs and establishing a quantitative model of their determinants would provide meaningful information for policymakers to supplement the design of a sustainable low-carbon model.
The research on the determinants of carbon emissions is relatively early, and the analysis technique is relatively mature. From the perspective of a research review, scholars systematically sort out the influence mechanisms from six aspects, including demographic, economic, social, technological, policy and natural [11]. Based on time sequential analysis, an extended LMDI explores the influence of factors such as consumption structure, economic development, and regional income, etc., on carbon emissions [6,28]. From a geospatial perspective, a spatial econometric model, such as the Spatial Leg Model (SLM), Spatial Error Model (SEM), or geographically weighted regression (GWR) are used to analyze the determinants of carbon emissions from energy combustion or carbon emission intensity in China from the provincial level or city level [20,29,30]. From the view of the quantitative analysis, the influence mechanisms of total and per person HCEs was explored using mixed models and semi-parametric mixed models [31]. With the analysis of carbon emission impact mechanisms, the multi-scale geographically weighted regression (MGWR) model was slowly introduced. MGWR is a generalized geographically weighted regression method that loosens the constant bandwidth assumption and allows each predictor to have a different optimized bandwidth. MGWR could be thought of as a geographically weighted regression (GWR) and a generalized additive model [32,33,34,35].
Due to the vast size of China, different cities are divergent in green and low carbon policies when coping with climate change and achieving the Sustainable Development Goals, which should be taken into account. Thus, in this study, our research focus is on the cities in the largest developing country, China. We conducted a national-scale survey of 14,928 households in eighty-eight Chinese prefecture-level cities (city or cities) and quantified the city-level determinants of PHCEs. We first explored the spatial characteristics of PHCEs and found the disparities in the contributions across different emission structures and consumption behaviors. Then, we introduced a hypothesis that PHCEs could be modeled as a function of household size, education level, income level, consumption tendency, and HCEs intensity. Finally, we analyzed the determinants of PHCEs by using a multi-scale geographically weighted regression (MGWR) model based on the data from eighty-eight Chinese city surveys. The work design has two advantages: (1) multi-city studies based on large scale surveys extending the research scale, which better reflects the reality of spatial spillover effects; (2) MGWR improves the traditional GWR model by allowing for different bandwidths of the individual influencing factors, which leads to more plausible results and gives the scale of influence of the different variables. The results provided an in-depth insight into the city-level determinants of PHCEs in China. For these reasons, an understanding of city-level household consumption patterns would be important to construct a low-carbon society and to achieve carbon neutrality.

2. Materials and Methods
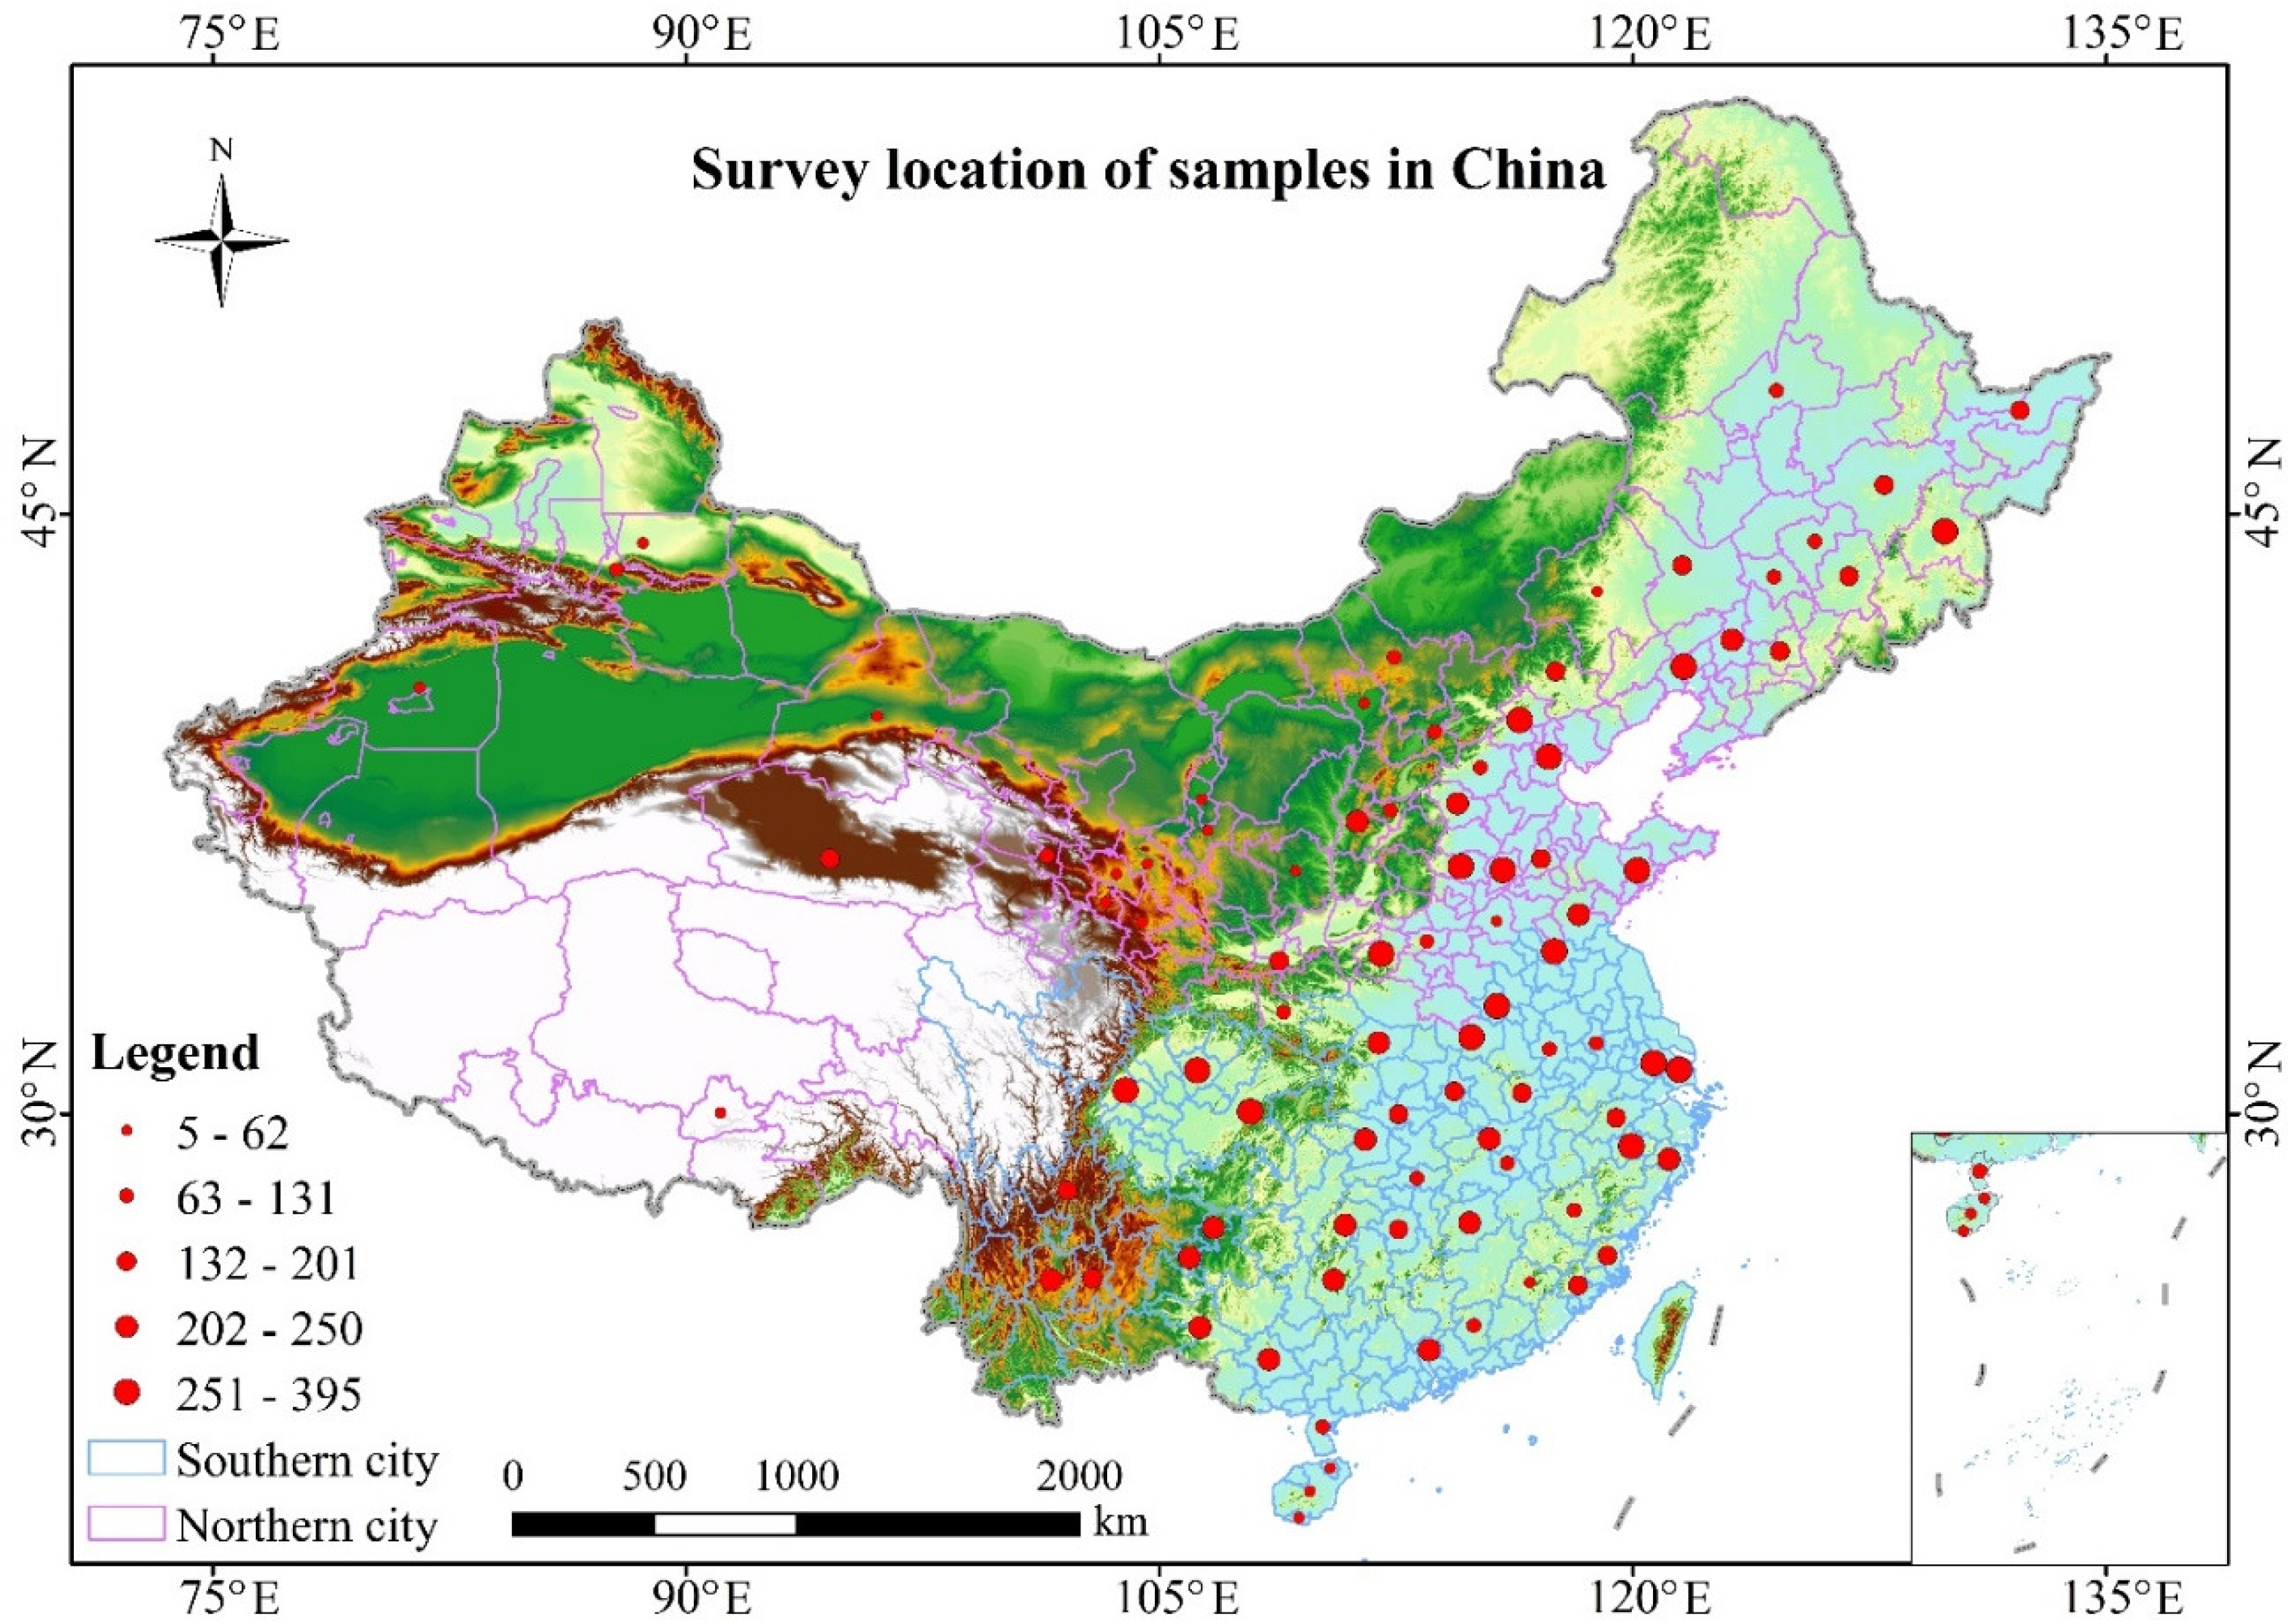
2.1. Data Survey

To facilitate basic and systematic research on HCEs, a survey titled “Chinese Household CO2 Emissions Assessment (CHCEA)” was launched by the Climate Policy Group at the Chinese Academy of Sciences, Lanzhou in 2011. This survey aimed to discover the characteristics, disparities, and spatial patterns of HCEs against a dynamic socioeconomic backgrounds. Four types of basic information, consisting of applicant information, basic household information, direct household energy usage, and indirect household consumption, were included in the questionnaire (Table 1). Then, the survey was implemented by experienced and trained investigators from the Chinese Academy of Sciences at Lanzhou, Lanzhou University, and other cooperating organizations in China between September 2011 and May 2013. Thus, the data were obtained between the second half of 2011 and the first half of 2013. Here, we assumed that there was little difference in the change of the average price index during this period, and most of the survey was conducted in 2012; hence, we took 2012 as the base year of the study.
Following standard statistical procedures, survey samples were randomly selected from households in both urban areas and rural areas in 4 different climate zones, encompassing eighty-eight cities of mainland China (Figure 1), and then, a total of 14,928 households (the number of people in each household varied, and ultimately, these 14,928 households included 52,161 person) were interviewed, with a sampling ratio of 38:1 million. Most of these eighty-eight cities were in the eastern half of China (southeast of the Hu Line) where more than 90% of the population of China lives. Our survey was conducted in accordance with the definition of permanent population by the National Bureau of Statistics of China. Here, urban refers to people living in towns stipulated by the organizational system of towns and administrative divisions during the study period, rural refers to people living in other areas except urban areas during the study period, and whole area refers to people living in both urban and rural areas during the study period.
All original survey questionnaires were in paper form, which were entered into Excel form first. Then, we checked several times according to the integrity of the questionnaires and the experience of experts, such as questionnaires with missing demographic and consumption information were considered invalid, questionnaires that did not add up to the total population of each age structure were considered invalid, etc. After removing all invalid questionnaires, we obtained 14,928 valid questionnaires above. There were some unavoidable limitations in the survey. For example, some of the respondents were sensitive to sharing basic information such as household income and consumption expenditure. To overcome this problem, we provided special training to the above investigators, such as making the investigators’ attitude, language, etc., as consistent as possible during the survey. Finally, we obtained reliability and validity tests based on the SPSS Software (IBM SPSS Statistics 26), with the Cronbach’s α, KMO, and the Bartlett test at 0.751, 0.708, <0.001, respectively.

2.2. Estimation of PHCEs

HCEs from direct household energy usage were calculated based on the IPCC reference approach [5,10,24,36].
H C E D i = F i × N C V i × C C i × O F i × 44 12
where Fi is consumption from the ith type of energy usage (104 t or 108 m3); i represents the ith type of energy usage, including anthracite, bituminous, honeycomb, gasoline from motor, gasoline from car, diesel, kerosene, liquefied petroleum gas (LPG), coal gas, and natural gas; NCVi is the net calorific value of the ith type energy (TJ/104 t or TJ/108 m3); CCi denotes the carbon emission factor of the ith type energy (t C/TJ); OFi expresses the fraction of carbon oxidized for the ith type energy; and 44/12 represents the ratio of molecular weight of CO2/C [5,10,11].
HCEs from electricity were calculated using
H C E E l e c = F Elec × C Elec
where FElec is the electricity consumption (MWh), and CElec is the CO2 emission factor of electricity (t CO2/MWh).
HCEs from centralized heating were calculated using
H C E H e a t = F Heat × M H e a t × C Heat × 10 3 = F H e a t × C H e a t
where FHeat is the heating area (m2). C H e a t = M H e a t × C Heat × 10 3 represents the CO2 emission factor of centralized heating (tCO2/m2).
HCEs from indirect household consumption were calculated by input–output analysis and the consumer lifestyle approach [3,5,10,11].
H C E H C j = F H C j × E j O j × I A 1 = F H C j × C H C j
where FHCj is the jth type of household consumption (104 RMB), CHCj is the CO2 emissions factor of the jth type of household consumption (t CO2/104 RMB), and j represents the jth type of household consumption, including water, food, clothing, commodity, health, education, recreation, transportation, and communication consumption.
Total HCEs were than calculated by
HCEs = HCEDi + HCEElec + HCEHeat + HCEHCj
where HCEs represent total household CO2 emissions.
PHCEsk = HCEsk/Pk
where PHCEsk represents HCEs per person in kth area; Pk is the population in kth area; HCEsk is the HCEs in kth area; k represents urban, rural, whole area or each of surveyed Cities.
PHCEs can be divided into six types in terms of different carbon emission structure (including PHCEs from coal, oil, gas, household consumption, electric, and heating) and five categories from the perspective of different consumption behaviors (including PHCEs from clothing, food, residence, transportation, and services) [5,10,11].

2.3. The Multiscale Geographically Weighted Regression (MGWR)

We first verified the relationship between PHCEs and each of the determinants using a generalized additive model (GAM). The variance inflation factor (VIF) was calculated before the modeling analysis. Step by step, we examined the potential interaction among these five different determinants (including household size, education level, income level, consumption tendency, and HCEs intensity) and PHCEs to detect any possible collinearity between them (Table 2). Finally, all five determinants were retained in MGWR due to their AIC (62.993), R2 (0.913), Adj.R2 (0.897). A typical GAM can be expressed as:
y = i = 1 k f i + ε
where fi is a smooth function applied on the jth predictor variable. In the context of MGWR, each smooth function fi was a spatial MGWR parameter surface calibrated using a known bandwidth. This bandwidth varied over i in MGWR.
MGWR can be expressed as [32,33,34,35]:
y i = j = 1 k β j u i , v i x i j + ε i
where yi represents PHCEs in the city i; βj represents the spatial distribution of coefficients; xij represents j influence factors in city i; and ε i represents the error term. All data analyses were conducted using the software MGWR, Version 2.2.1 [35].

3. Results

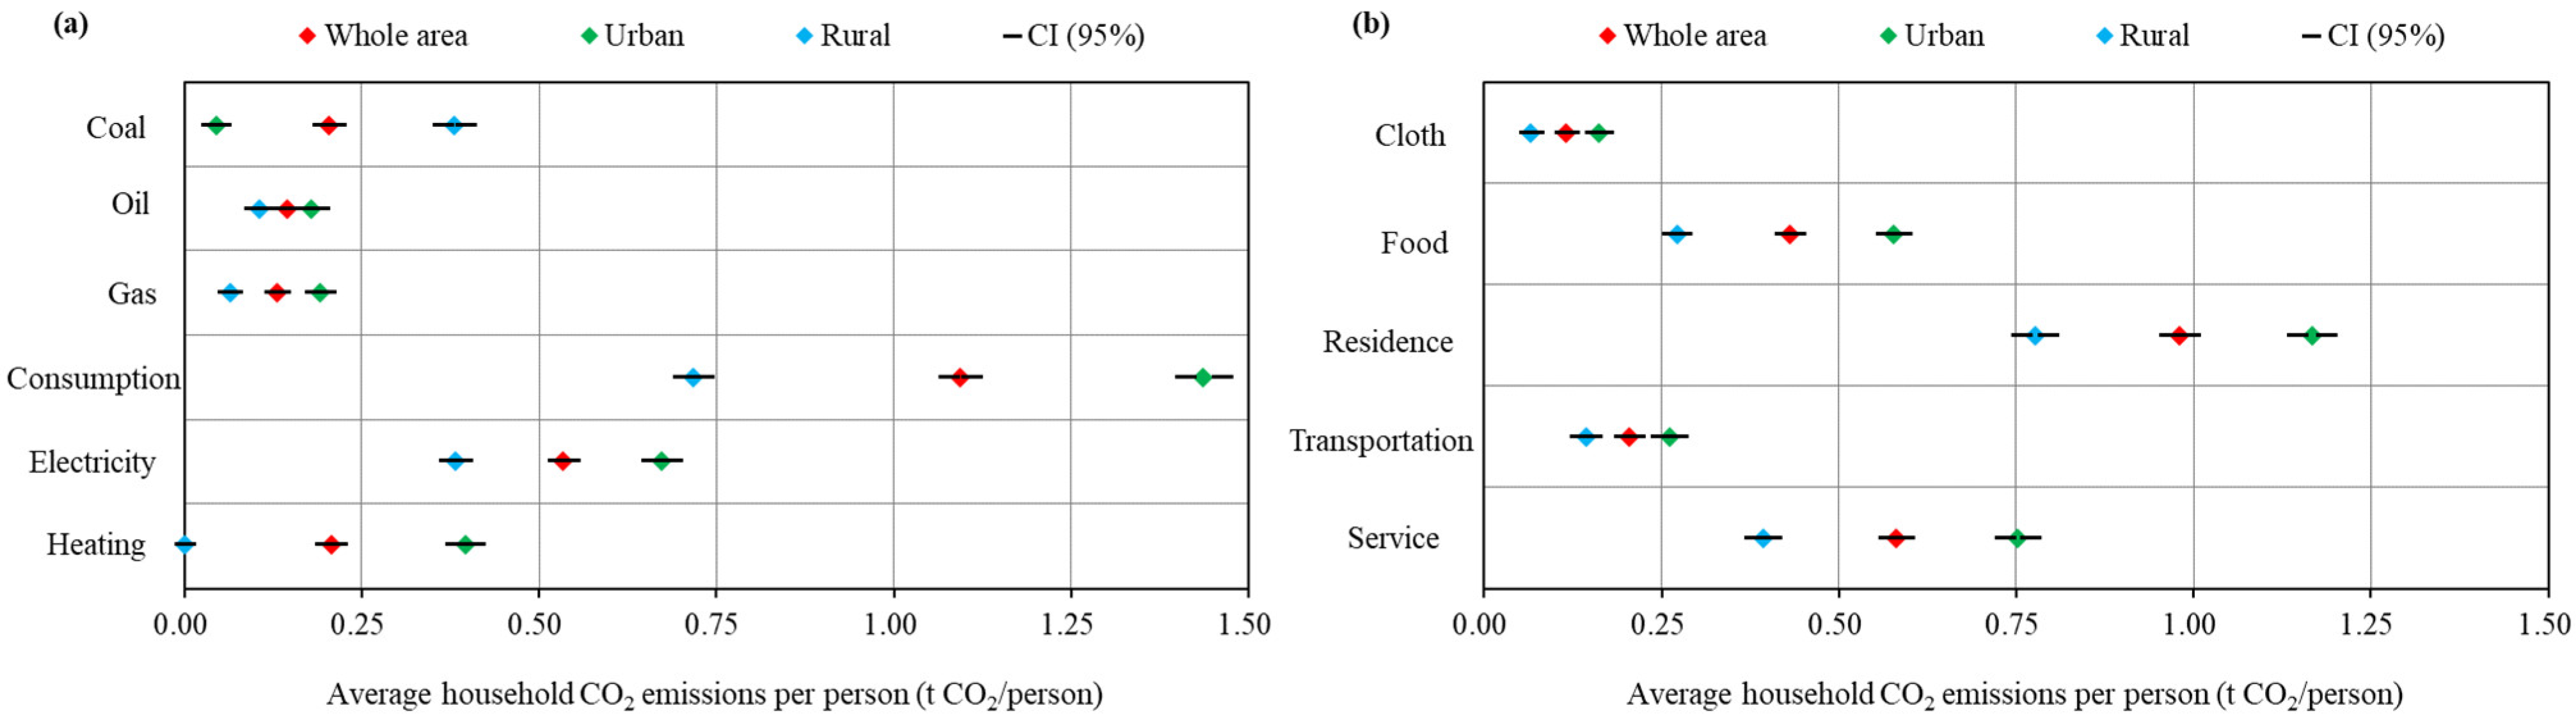
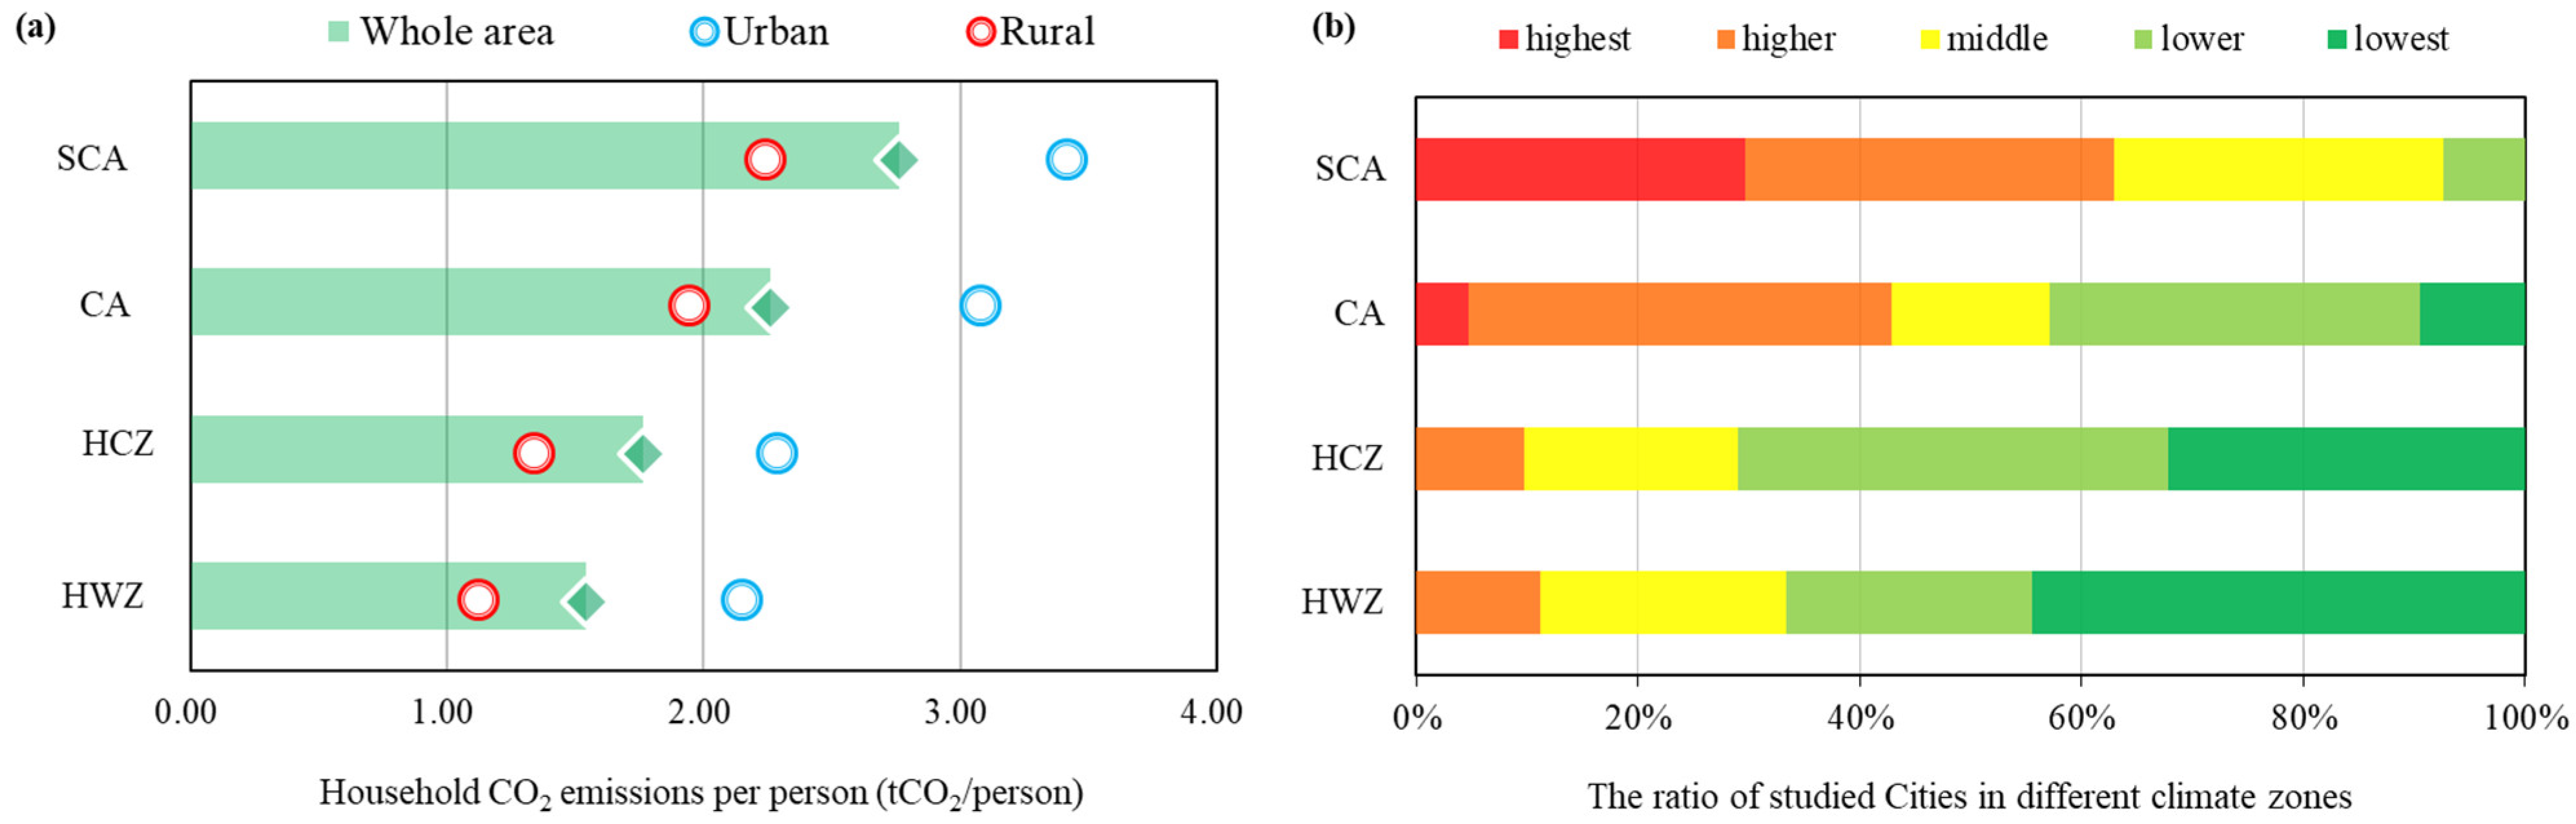
3.1. Overall Characteristics of PHCEs

The average PHCE was estimated at 2.31 tCO2/person in 2012 in the whole area that was studied in China; it was 1.77 times higher in urban than in rural areas (Figure 2). In terms of carbon emission structures, household consumption and electricity consumption were the two most important parts, corresponding to PHCEs of 0.38 to 1.41 tCO2/person (23.04% to 49.21%) (Figure 2a). Coal usage for heating was responsible for 0.38 tCO2/person in rural areas and 0.44 tCO2/person in urban areas. In terms of household consumption behaviors, residence consumption behavior and service consumption behavior were the two most important parts, corresponding to PHCEs of 0.39 to 1.17 tCO2/person (Figure 2b). Similarly, clothing consumption behavior, transportation consumption behavior, and food consumption behavior collectively shared 4.01% to 19.77% of the average PHCEs.

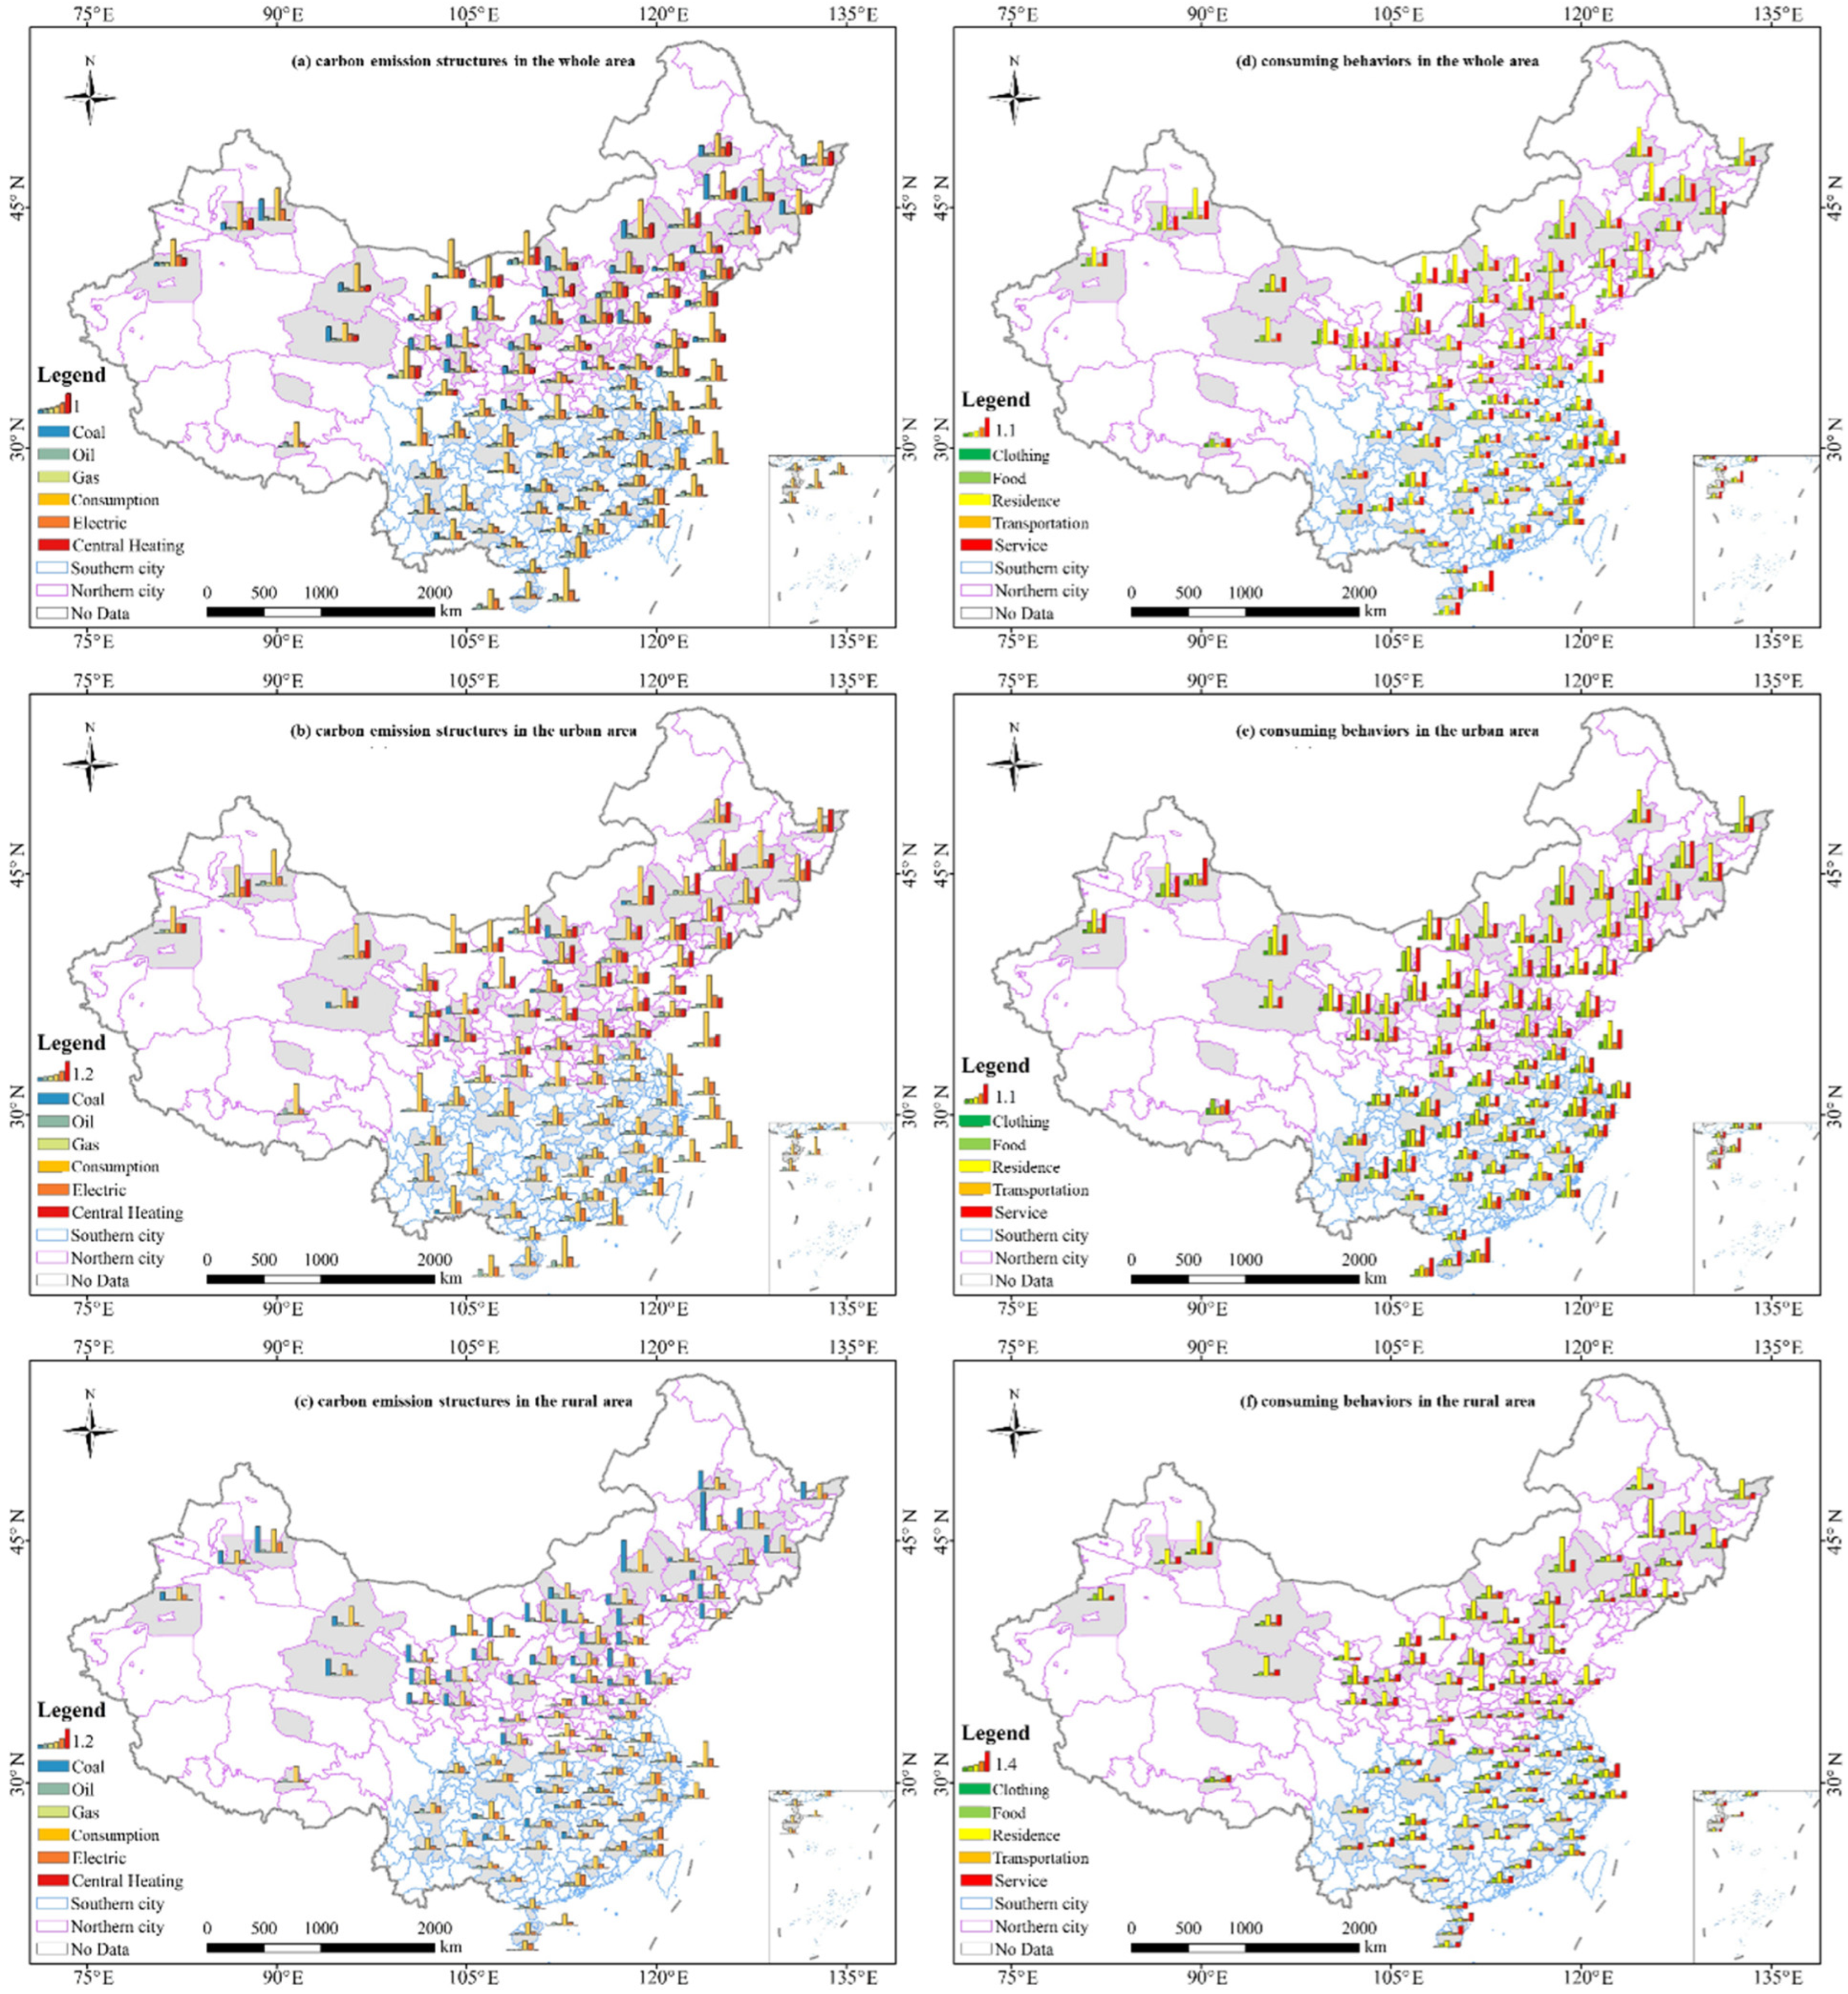
3.2. Spatial Patterns in PHCEs

Overall, in each of the cities, the urban area contributed much to PHCEs versus the rural area (Figure 3). We observed significant city-level differences, with the PHCEs ranging from 0.78 to 4.74 tCO2/person. Notably, the highest (red color) and higher (orange color) PHCEs were mainly in northern cities, which were classified as severely cold and cold areas, and many of them were energy-producing cities (such as Chifeng, Changchun, Hohhot, Changji, and Xining). PHCEs varied markedly between northern and southern cities as well as between coastal and less developed inland cities. PHCEs reduced from northern cities with cold and severe cold climates to southern cities with hot summer and cold winter and hot summer and warm winter climates. Overall, PHCEs in severely cold areas were much higher than those in other areas. For example, the proportion of prefecture-level cities with the highest and higher PHCEs in cold areas (42.86%) and severely cold areas (62.96%) was much higher than those in hot summer and cold winter zones (9.86%) and hot summer and warm winter zones (11.11%) (Figure 4).
We also found that the contribution of different carbon emission structures and consuming behaviors varied across different Chinese cities. In the whole area, household consumption made up the largest share (25% to 75%) of PHCEs in each city, especially resulting from residence, service, and food consumption behavior (Figure 5a,d). In addition, PHCEs from electricity consumption accounted for 25% to 46% of total PHCEs in southern cities, and centralized heating accounted for 25% to 44% in northern cities. In urban areas, household consumption (30% to 76%) was the most important contributor to PHCEs in each city. Residence and service consumption behavior were two major contributors to PHCEs in southern cities, while residence and food consumption behavior were major contributors in northern cities (Figure 5b,e). In rural areas, household consumption (30% to 76%) was the most important contributor to PHCEs. In addition, coal usage and household consumption were major contributors to PHCEs, with most of the value mainly related to residence and food consumption behaviors (Figure 5c,f). In summary, it was found that PHCEs related to household consumption and residence consumption behavior were higher than other carbon emission structures and consumption behaviors in almost all cities.

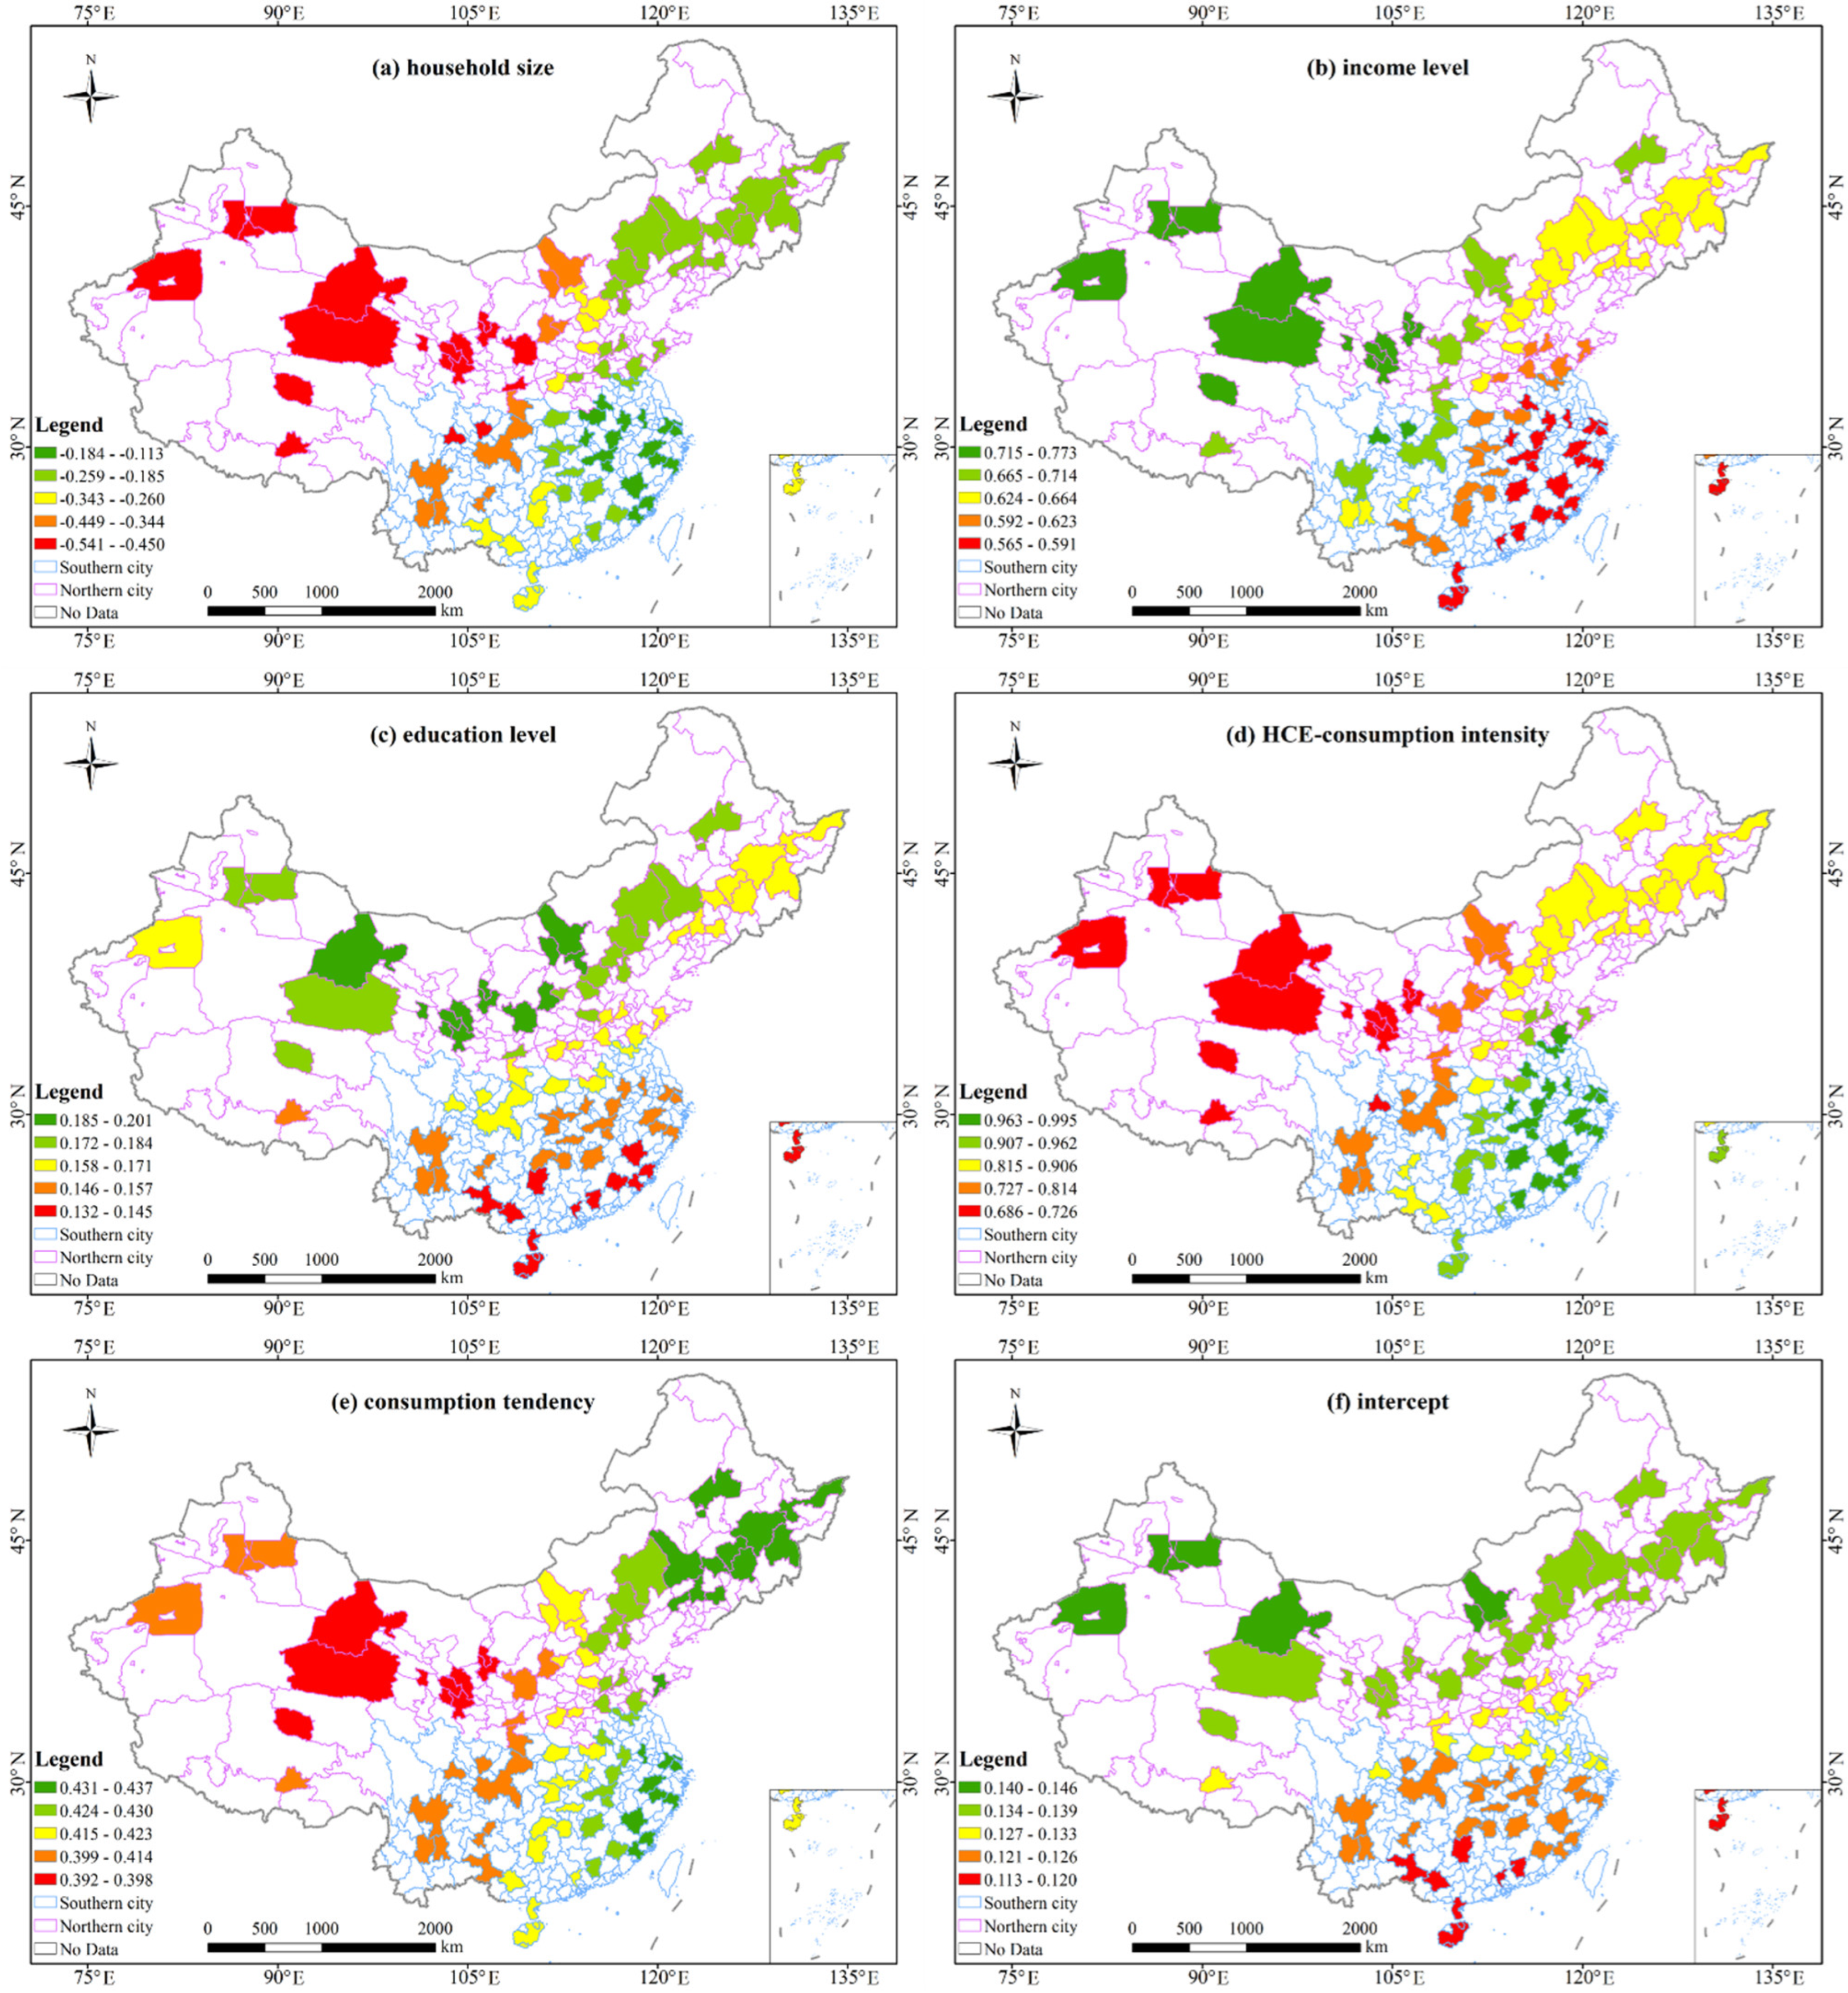
3.3. Results of the Multiscale Geographically Weighted Regression (MGWR)

There were huge differences in energy usage, household consumption and related PHCEs among the eighty-eight cities, due to the variations in household lifestyles, consuming behaviors and economic development. Therefore, significant differences in the related determinants of PHCEs were found across different cities. The MGWR model performs well to distinguish the contribution of each factor to PHCEs in each city. Based on this model, R2 values ranged from 0.84 to 0.94 (Supplementary Table S1) in each of the cities in China, indicating that we were able to model PHCEs as a function of household size, income level, education level, consumption carbon intensity, and consumption tendency.
According to the factor of household size, we found that the coefficient was negative, indicating that household size was negatively associated with PHCEs. The effect of household size on PHCEs increased from eastern prefecture-level cities to western prefecture-level cities in China (Figure 6a). The coefficients of income level and education level in relation to PHCEs were positive, indicating that an increase in these determinants had a positive effect on PHCEs (Figure 6b,c). In addition, the results showed that the influence of income level on PHCEs was greater in coastal cities than in inland cities, and the influence of education level on PHCEs was greater in southern cities than in northern cities in China. In line with the coefficients, HCEs intensity and consumption tendency in relation to PHCEs were also positive, indicating that a decrease in these two factors had an important influence on the decrease in PHCEs (Figure 6d,e). The contribution of HCEs intensity toward PHCEs showed an increasing trend from southeast cities (particularly located in the Yangtze River) to northwest cities, while the importance of consumption tendency on PHCEs showed an increasing trend from eastern prefecture-level cities to central and western cities in China. Finally, the intercepts from the MGWR reflected the effects of geographical and climatic factors, such as geographical location, climate characteristics, and altitude gradient, on PHCEs. The intercept for geographical and climatic factors was positive, indicating that this factor had a significant influence on PHCEs (Figure 6f), with an increasing trend from northern cities to southern cities in China.

4. Discussion and Conclusions

Given that the household sector was a major source of national CO2 emissions, without changing people’s lifestyles and consumption behaviors, GHG mitigation and climate stabilization targets cannot be realized. Based on a nationwide survey of HCEs in eighty-eight Chinese cities, we assessed HCEs patterns and their drivers at different spatial scales. We found that PHCEs in northern cities in winter were significantly higher than those in southern cities. The impact of HCEs intensity on HCEs increased from eastern cities to western cities over spatial scale. Our results provide vital information for developing climate policy and achieving Global Climate Action and carbon neutrality.

4.1. Discussion

The spatial characteristics of PHCEs in China reflect the climatic variations between cities. The higher PHCEs found in northern cities were due to these areas being located mainly in colder regions where centralized heating or coal-fired heating in winter is necessary. In these cold areas, coal-powered heating for homes and offices was common, but such heating systems did not exist in southern China [16]. Some research results showed that household heating stoves were commonly used for heating in rural China during winter, which brought not only CO2 emissions but also pollutant emissions, resulting in health loss [37,38]. Taking Beijing as an example, Chen et al. (2019) pointed out that a large difference between urban and rural areas in energy consumption and the related CO2 emissions is related to the difference between energy structure and energy behaviors [39]. Additionally, the spatial patterns of PHCEs between urban and rural areas reflect the differences between urban–rural structures in different cities. PHCEs in urban areas mainly result from household consumption, electricity and centralized heating systems, whereas in rural areas, they mainly originate from food consumption and coal usage. This is why PHCEs display notable disparities between urban and rural areas across the carbon emission structures and consumption behaviors of people. When we reviewed the trend over the last 20 years, the basic HCEs in rural China increased more rapidly than those in urban areas [18]. Mi et al. (2020) also noted that the difference in HCEs between urban and rural areas is a huge challenge for sustainable development in China [4].
An analysis of PHCEs caused by direct energy usage and indirect household consumption provided useful insights for developing city-level carbon neutrality strategies. We found significant city-level differences in PHCEs, indicating that the different low-carbon-development strategies in the built-up and newly built districts in cities need to be considered. For example, in built-up areas, more low-carbon policies such as increasing technological innovation and improving household consumption patterns are needed. In the newly built districts, advanced urban planning, including but not limited to low-carbon construction and transportation, should be precisely designed and then efficiently implemented, such as the adoption of efficient household appliances and the low carbon private and public transportations, which can improve energy savings [39,40]. In addition, in the new normal era of China’s economy, the residents’ green consumption awareness and sustainable consumption patterns will be widely promoted, which would further accelerate the development of a low-carbon society. For this to happen, the role of civil society, the media and the right (government) fiscal policy are instrumental [39].
Considering the spatial heterogeneity in relationships between determinants and PHCEs in each of the cities, a suitable MGWR model for this work was established that can operate at various spatial scales [32,33,34,35,41]. PHCEs showed an increasing trend from eastern cities to western cities because of a general trend of increasing household size from west to east in the survey data. Although economic development increased from west to east, household size played an important role in the reduction of household carbon emissions in the less-developed northwestern cities. This result showed the phenomenon that many large households living together in China (especially in the less developed western regions) and their resulting lifestyle resulted in PHCE reductions and energy conservation. A possible explanation was that where older people and young families live together, the elderly help young people with childcare and participate in some family tasks efficiently and effectively, thus indirectly promoting energy conservation. In terms of the coefficient of HCEs intensity, the contribution of this impact on PHCEs increased from eastern cities to western cities. From the perspective of spatial patterns, PHCEs in western cities of severely cold areas and cold areas were much higher than those in eastern cities of hot summer and cold winter zones and hot summer and warm winter zones. Meanwhile, coal usage and centralized heating systems were the main contributors of PHCEs in western cities, whereas electricity consumption was the major contributor in eastern cities. This is why cities with high consumption and high emissions or low consumption and high emissions played a greater role in the increase in PHCEs and cities with low consumption and low emissions and high consumption and low emissions played a greater role in the decrease in PHCEs [16]. It further indicated that the transformation of cities with low consumption and high emissions to cities with low consumption and low emissions or of cities with high consumption and high emissions to cities with high consumption and low emissions plays a key role in the decrease in PHCEs.
Considering that HCEs intensity has the greatest impact on PHCEs, it is necessary to formulate efficient emission reduction policies based on local conditions in the future. People have been facing challenges in improving their livelihood through consumption growth while reducing household carbon footprints. For this to happen, producing more household goods and services with less resources (or renewable resources) should be given top priority [39]. Therefore, we should find a smart roadmap that entails a nice life with low HCEs in the future [39,40]. It is necessary to vigorously improve technology and strengthen innovation to reduce carbon intensity of the household sector. Moreover, each and every individual should think and act as a global citizen to achieve zero waste and to reduce GHGs.

4.2. Conclusions

Within the context of climate change, CO2 emissions reduction is the key to mitigating climate warming. The household sector plays an important role in carbon emissions, as about 60% of the global GHG emissions comes from the household sector. In this study, we identified the key determinants of PHCEs based on a large-scale national survey and assessed PHCEs at different spatial scales in China. Our extensive dataset allowed for quantitative modeling of PHCEs as a function of household size, income level, education level, HCEs intensity, and consumption tendency, suing MGWR modeling approaches. These models were also used to assess the relative importance of these determinants as predictors of PHCEs. Due to increasing urbanization and living standards in China, PHCEs from household consumption and residence consumption behavior are still in an increasing channel. Optimizing the household energy structure and changing consumption behaviors is a direct option to coordinate the management aims of PHCEs. Conversely, measures such as establishing green city pilots, improving R&D (research and development) innovations, as well as improving energy efficiency to reduce consumption of carbon intensity, are the indirect systemic schemes that will promote the implementation of low-carbon household styles.
Our research is beneficial on several fronts: (1) the created extensive databases (and the relevant modeling frameworks) can be used for setting benchmarks/references for future research ambitions, especially to influence future strategic policy; (2) these databases can also be used to develop household carbon calculators in China; and (3) our methodological approach and PHCEs accounting rules can be used in different parts of the world. This may also foster unified coordinated actions among other countries to reduce HCEs.

Supplementary Materials

The following supporting information can be downloaded at: https://www.mdpi.com/article/10.3390/land11060925/s1. Table S1. Statistics of MGWR.

Author Contributions

J.Q., Z.Z. and J.Z. conceived and designed the research; J.Q., L.L., J.Z. and Z.Z. participated in the field survey; all authors discussed the paper framework and data analysis scheme; J.Q. and L.L. prepared the manuscript; J.Q., L.L. and T.N.M. revised the manuscript. All authors have read and agreed to the published version of the manuscript.

Funding

This work was funded by the National Natural Sciences Foundation of China (grant no. 42171300), National Key Research and Development Program (grant no. 2016YFA0602803) and the Natural Science Foundation of Gansu Province, China (grant no. 20JR10RA026). We also appreciate the editors and the anonymous reviewers for their constructive comments and suggestions on this manuscript.

Institutional Review Board Statement

Not applicable.

Informed Consent Statement

Not applicable.

Data Availability Statement

Not applicable.

Acknowledgments

The authors thank Yan Li, Xumei Li, Julong Qiu, Li Wang, Xia Tang, Jianbao Li, Jidong Zhao, and others investigators who come from Lanzhou University, Chinese Academy of Sciences, and other universities, for their hard work participating in the questionnaire survey. The authors also would like to thank the anonymous referees and the editors for their helpful suggestions on the earlier draft of our paper.

Conflicts of Interest

The authors declare no conflict of interest.

References

  1. Statement by H.E. Xi Jinping President of the People’s Republic of China at the General Debate of the 75th Session of the United Nations General Assembly. Available online: https://journal.un.org/en/meeting/officials/e6d6ab5e-c0de-ea11-9114-0050569e8b67/2020-09-22/statements (accessed on 22 September 2020).
  2. Ivanova, D.; Stadler, K.; Steen-Olsen, K.; Wood, R.; Vita, G.; Tukker, A.; Hertwich, E.G. Environmental impact assessment of household consumption. J. Ind. Ecol. 2016, 20, 526–536. [Google Scholar] [CrossRef]
  3. Shui, B.; Dowlatabadi, H. Consumer lifestyle approach to US energy use and the related CO2 emissions. Energy Policy 2005, 33, 197–208. [Google Scholar]
  4. Mi, Z.F.; Zheng, J.L.; Meng, J.; Qu, J.; Hubacek, K.; Liu, Z.; Coffman, D.M.; Stern, N.; Liang, S.; Wei, Y.M. Economic development and converging household carbon footprints in China. Nat. Sustain. 2020, 3, 529–537. [Google Scholar] [CrossRef]
  5. Liu, L.C.; Wu, G.; Wang, J.N.; Wei, Y.M. China’s carbon emissions from urban and rural households during 1992–2007. J. Clean. Prod. 2011, 19, 1754–1762. [Google Scholar] [CrossRef]
  6. Tian, X.; Chang, M.; Lin, C.; Tanikawa, H. China’s carbon footprint: A regional perspective on the effect of transitions in consumption and production patterns. Appl. Energy 2014, 123, 19–28. [Google Scholar] [CrossRef]
  7. Wiedenhofer, D.; Guan, D.B.; Liu, Z.; Meng, J.; Zhang, N.; Wei, Y.M. Unequal household carbon footprints in China. Nat. Clim. Chang. 2017, 7, 75–80. [Google Scholar] [CrossRef] [Green Version]
  8. Lin, B.B.; Jia, Z.J. Transfer payments in emission trading markets: A perspective of rural and urban residents in China. J. Clean. Prod. 2018, 204, 753–766. [Google Scholar] [CrossRef]
  9. Qu, J.S.; Liu, L.N.; Zeng, J.J.; Zhang, Z.Q.; Wang, J.P.; Pei, H.J.; Dong, L.P.; Liao, Q.; Maraseni, T.N. The impact of income on household CO2 emissions in China based on a large sample survey. Sci. Bull. 2019, 64, 351–353. [Google Scholar] [CrossRef] [Green Version]
  10. Liu, L.N.; Qu, J.S.; Zhang, Z.Q.; Zeng, J.J.; Wang, J.P.; Dong, L.P.; Pei, H.J.; Liao, Q. Assessment and determinants of per capita household CO2 emissions (PHCEs) based on capital city level in China. J. Geogr. Sci. 2018, 28, 1467–1484. [Google Scholar] [CrossRef] [Green Version]
  11. Liu, L.N.; Qu, J.S.; Maraseni, T.N.; Niu, Y.B.; Zeng, J.J.; Zhang, L.H.; Xu, L. Household CO2 emissions: Current status and future perspectives. Int. J. Environ. Res. Public Health 2020, 17, 7077. [Google Scholar] [CrossRef]
  12. Feng, K.S.; Davis, S.J.; Sun, L.X.; Hubacek, K. Drivers of the US CO2 emissions 1997–2013. Nat. Commun. 2015, 6, 7714. [Google Scholar] [CrossRef] [Green Version]
  13. C40 Cities. The Future of Urban Consumption in a 1.5 °C World. 2019. Available online: https://www.arup.com/perspectives/publications/research/section/the-future-of-urban-consumption-in-a-1-5c-world (accessed on 24 January 2022).
  14. Institute for Global Environmental Strategies (IGES). 1.5-Degree Lifestyles: Targets and Options for Reducing Lifestyle Carbon Footprints. 2019. Available online: https://pub.iges.or.jp/pub/15-degrees-lifestyles-2019 (accessed on 24 January 2022).
  15. Rao, N.D.; Min, J.; Mastrucci, A. Energy requirements for decent living in India, Brazil and South Africa. Nat. Energy 2019, 4, 1025–1031. [Google Scholar] [CrossRef]
  16. Maraseni, T.N.; Qu, J.S.; Bian, Y.; Zeng, J.J.; Maroulis, J. Dynamism of household carbon emissions (HCEs) from rural and urban regions of northern and southern China. Environ. Sci. Pollut. Res. Int. 2016, 23, 20553–20566. [Google Scholar] [CrossRef]
  17. Qu, J.S.; Zeng, J.J.; Li, Y.; Wang, Q.; Maraseni, T.N.; Zhang, L.H.; Zhang, Z.Q.; Clarke-Sather, A. Household carbon dioxide emissions from peasants and herdsmen in northwestern arid-alpine regions, China. Energy Policy 2013, 57, 133–140. [Google Scholar] [CrossRef]
  18. Liu, L.N.; Qu, J.S.; Clarke-Sather, A.; Maraseni, T.N.; Pang, J.X. Spatial variations and determinants of per capita household CO2 emissions (PHCEs) in China. Sustainability 2017, 9, 1277. [Google Scholar] [CrossRef] [Green Version]
  19. World Bank. 3 Big Ideas to Achieve Sustainable Cities and Communities. 2018. Available online: http://www.worldbank.org/en/news/immersive-story/2018/01/31/3-big-ideas-to-achieve-sustainable-cities-and-communities (accessed on 24 January 2022).
  20. Wang, S.J.; Shi, C.Y.; Fang, C.L.; Feng, K.S. Examining the spatial variations of determinants of energy-related CO2 emissions in China at the city level using Geographically Weighted Regression Model. Appl. Energy 2019, 235, 95–105. [Google Scholar] [CrossRef]
  21. Wang, S.J.; Wang, J.Y.; Fang, C.L.; Feng, K.S. Inequalities in carbon intensity in China: A multi-scalar and multi-mechanism analysis. Appl. Energy 2019, 254, 113720. [Google Scholar] [CrossRef]
  22. Cathy, C.W.H.; Shu-Chien, H.; Kuang-Ly, C. Quantifying city-scale carbon emissions of the construction sector based on multi-regional input-output analysis. Resour. Conserv. Recycl. 2019, 149, 75–85. [Google Scholar]
  23. The Chinese Government. Enhanced Actions on Climate Change: China’s Intended Nationally Determined Contributions. 2016. Available online: http://www.scio.gov.cn/xwfbh/xwbfbh/wqfbh/33978/35364/xgzc35370/Document/1514539/1514539.htm (accessed on 24 January 2022).
  24. Shan, Y.L.; Guan, D.B.; Hubacek, K.; Zheng, B.; Davis, S.J.; Jia, L.C.; Liu, J.H.; Fromer, N.; Mi, Z.F.; Meng, J.; et al. City-level climate change mitigation in China. Sci. Adv. 2018, 4, eaaq0390. [Google Scholar] [CrossRef] [Green Version]
  25. Cheng, S.L.; Chen, Y.T.; Meng, F.X.; Chen, J.D.; Liu, G.Y.; Song, M.L. Impacts of local public expenditure on CO2 emissions in Chinese cities: A spatial cluster decomposition analysis. Resour. Conserv. Recycl. 2021, 164, 105217. [Google Scholar] [CrossRef]
  26. Shan, Y.L.; Huang, Q.; Guan, D.B.; Hubacek, K. China CO2 emission accounts 2016–2017. Sci. Data 2018, 7, 54. [Google Scholar] [CrossRef] [PubMed] [Green Version]
  27. Le Quéré, C.; Korsbakken, J.I.; Wilson, C.; Tosun, J.; Andrew, R.; Andres, R.J.; Ganadell, J.G.; Jordan, A.; Peters, G.P.; Vuuren, D.P. Drivers of declining CO2 emissions in 18 developed economies. Nat. Clim. Chang. 2019, 9, 213–217. [Google Scholar] [CrossRef] [Green Version]
  28. Huang, Q.; Hu, Y.R.; Luo, L.Q. Spatial analysis of carbon dioxide emissions from producer services: An empirical analysis based on panel data from China. Environ. Sci. Pollut. Res. 2022. [Google Scholar] [CrossRef] [PubMed]
  29. Repkine, A.; Min, D. Foreign-funded enterprises and pollution halo hypothesis: A spatial econometric analysis of thirty Chinese regions. Sustainability 2020, 12, 5048. [Google Scholar] [CrossRef]
  30. Chuai, X.W.; Huang, X.J.; Wang, W.J.; Wen, J.Q.; Chen, Q.; Peng, J.W. Spatial econometric analysis of carbon emissions from energy consumption in China. J. Geogr. Sci. 2012, 22, 630–642. [Google Scholar] [CrossRef]
  31. Qu, J.S.; Qin, S.S.; Liu, L.N.; Zeng, J.J.; Bian, Y. A hybrid study of multiple contributors to per capita household CO2 emissions (HCEs) in China. Environ. Sci. Pollut. Res. 2016, 23, 6430–6442. [Google Scholar] [CrossRef] [Green Version]
  32. Fotheringham, A.S.; Yang, W.; Kang, W. Multiscale Geographically Weighted Regression (MGWR). Ann. Am. Assoc. Geogr. 2017, 107, 1247–1265. [Google Scholar] [CrossRef]
  33. Oshan, T.M.; Li, Z.Q.; Kang, W.; Wolf, L.J.; Fotherigham, A.S. MGWR: A Python implementation of multiscale geographically weighted regression for investigating process spatial heterogeneity and scale. ISPRS Int. J. Geo–Inf. 2019, 8, 269. [Google Scholar] [CrossRef] [Green Version]
  34. Shabrina, Z.; Buyuklieva, B.; Ng, M.K.M. Short-term rental platform in the urban tourism context: A geographically weighted regression (GWR) and a multiscale GWR (MGWR) approaches. Geogr. Anal. 2020, 53, 686–707. [Google Scholar] [CrossRef]
  35. Yu, H.C.; Fotheringham, A.S.; Li, Z.Q.; Oshan, T.; Kang, W.; Wolf, L.J. Inference in Multiscale Geographically Weighted Regression. Geogr. Anal. 2020, 52, 87–106. [Google Scholar] [CrossRef]
  36. Intergovernmental Panel on Climate Change, IPCC. IPCC Guidelines for National Greenhouse Gas Inventories. 2006. Available online: http://www.ipcc-nggip.iges.or.jp/publi,c/2006gl/ (accessed on 24 January 2022).
  37. Li, C.; Ye, K.; Zhang, W.T.; Xu, Y.H.; Xu, J.D.; Li, J.; Mawusi, S.K.; Shrestha, P.; Xue, C.Y.; Liu, G.G. User behavior, influence factors, and impacts on real-world pollutant emissions from the household heating stoves in rural China. Sci. Total Environ. 2022, 823, 153718. [Google Scholar] [CrossRef]
  38. Chen, Y.L.; Shen, H.Z.; Smith, K.R.; Guan, D.B.; Chen, Y.C.; Shen, G.F.; Liu, J.F.; Cheng, H.F.; Zeng, E.Y.; Tao, S. Estimating household air pollution exposures and health impacts from space heating in rural China. Environ. Int. 2018, 119, 117–124. [Google Scholar] [CrossRef] [Green Version]
  39. Chen, C.C.; Liu, G.Y.; Meng, F.X.; Hao, Y.; Zhang, Y.; Casazza, M. Energy consumption and carbon footprint accounting of urban and rural residents in Beijing through Consumer Lifestyle Approach. Ecol. Indic. 2019, 98, 575–586. [Google Scholar] [CrossRef]
  40. Meng, F.X.; Liu, G.Y.; Yang, Z.F.; Casazza, M.; Cui, S.H.; Ulgiati, S. Energy efficiency of urban transportation system in Xiamen, China. Appl. Energy 2017, 186, 234–248. [Google Scholar] [CrossRef]
  41. Han, L.Y.; Xu, X.K.; Han, L. Applying quantile regression and Shapley decomposition to analyzing the determinants of household embedded carbon emissions: Evidence from urban China. J. Clean. Prod. 2015, 103, 219–230. [Google Scholar] [CrossRef]
Figure 1. Survey location of samples in this work.
Land 11 00925 g001
Figure 2. Average household CO2 emissions per person (tCO2/person) of studied areas in China in 2012 for different (a) carbon emission structures and (b) consumption behaviors. Dashed line represents standard error (SE). Coal, HCEs from coal; Oil, HCEs from oil; Gas, HCEs from gas; Consumption, HCEs from household consumption; Electric, HCEs from electricity; Heating, HCEs from central heating; Clothing, HCEs from clothing consumption behavior; Food, HCEs from food consumption behavior; Residence, HCEs from residence consumption behavior; Transport, HCEs from transportation consumption behavior; Service, HCEs from service consumption behavior.
Land 11 00925 g002
Figure 3. Spatial distribution of household CO2 emissions per person (tCO2/person) in 2012 in (a) the whole area, (b) urban area, and (c) rural area of surveyed cities. The colors on the map indicate the categories of the eighty-eight cities based on the Jenks methods with five groups, including highest level (red), higher level (orange), middle level (yellow), lower level (light green), and lowest level (dark green).
Land 11 00925 g003
Figure 4. (a) Household CO2 emissions (tCO2/person) and (b) the ratio of studied cities in different climate zones. Whole area, the whole area studied; Urban, the urban areas studied; Rural, the rural areas studied; CA, cold areas; HCZ, hot summer and cold winter zones; HWZ, hot summer and warm winter zones; SCA, severely cold areas; highest level (red), higher level (orange), middle level (yellow), lower level (light green), and lowest level (dark green).
Land 11 00925 g004
Figure 5. Spatial distribution of household CO2 emissions per person (tCO2/person) from different carbon emission structures in the (a) whole, (b) urban, and (c) rural areas; and from different consuming behaviors in the (d) whole, (e) urban, and (f) rural areas. Coal, PPHCEs from coal; Oil, PHCEs from oil; Gas, PHCEs from gas; Consumption, PHCEs from household consumption; Electric, HCEs from electricity; Heating, HCEs from central heating; Clothing, HCEs from clothing consumption behavior; Food, HCEs from food consumption behavior; Residence, HCEs from residence consumption behavior; Transportation, HCEs from transportation consumption behavior; Service, HCEs from service consumption behavior.
Land 11 00925 g005
Figure 6. Spatial distribution of the MGWR intercepts and coefficients of determinants of PHCEs in eighty-eight studied cities in China: (a) household size; (b) income level; (c) education level; (d) HCEs intensity; (e) consumption tendency; (f) intercept. Colors on the map indicate the categorization of the eighty-eight studied Chinese prefecture-level cities into five groups based on quartile methods.
Land 11 00925 g006
Table 1. Basic information table of survey questionnaire in HCEs.
Basic InformationResearch CategoryNumber
Applicant informationOccupation, Education, Gender, Age4
Household basic informationHome address, Nation, Household size, Household structure, Household income, Sources of income6
Direct household energy usageAnthracite, Bituminous, Honeycomb, Gasoline form motor, Gasoline form car, Diesel, Kerosene, LPG, Coal Gas, Nature Gas10
Indirect household consumptionWater, Electricity, Heating, Food, Clothing, Commodity, Health, Education, Recreation, Transportation, Communication11
Table 2. The factors influencing PHCEs in this work.
VariablesImplicationUnit
PHCEsHousehold CO2 emissions per persont CO2/person
household sizeTotal population per householdperson
income levelIncome per person104 RMB/person
education levelThe proportion of population with high school education and above%
HCEs intensitySimilar to the carbon emission intensity, represents the intensity of HCEst CO2/104 RMB
consumption tendencyThe ratio of consumption to income%
Publisher’s Note: MDPI stays neutral with regard to jurisdictional claims in published maps and institutional affiliations.

