Abstract
The Chinese environment is experiencing the “U-Type” course from sharp deterioration to significant improvement. In order to achieve the fundamental improvement of the ecological environment, China has implemented several relevant policies and strategies. Among them, the development of urban rail transit, as an essential measure to improve the ecological environment in China, has attracted more and more attention, but the research on the interactive coercion relationship between rail transit and the ecological environment is minimal. Therefore, this study selected ten cities opening urban rail transit before 2005 in mainland China as research objects and established an urban rail transit and ecological environment comprehensive evaluation index system. Then, the interactive coercing model and coupling coordination model were used, and the dynamic relationship between urban rail transit and the ecological environment was explored. The research results in this study showed that (1) there is an apparent interactive coercion relationship between urban rail transit and the ecological environment, and the evolution trajectory conforms to a double exponential curve. (2) From 2006 to 2019, Wuhan’s ecological environment pressure index showed a continuous downward trend. The ecological environment improved the fastest. The rest of the cities showed a trend of first rising and then falling. (3) The type of coupling coordination degree of urban rail transit and ecological environment showed a changing coordination trend from severe incoordination—slight to incoordination—basic to coordination—good. Beijing has the highest degree of overall coordinated development in urban rail transit and the ecological environment. The results of this study can provide a theoretical reference for the realisation of the virtuous circle development of rail transit and the ecological environment.
1. Introduction
With the increasing environmental problems and improving environmental protection understanding, environmental pollution caused by urban development has gradually become the focus of concern in various countries [1]. Urban transportation is an essential factor exacerbating environmental pollution [2,3,4]. Transportation needs to consume a large amount of fossil energy and emissions many air pollutants. Previous studies show that 14% of PM2.5 pollution changes are caused by transportation [5]. In addition, transportation also produces a large amount of traffic noise. Research proves that transportation will lead to 65% of regions increasing traffic noise pollution by 1.7 decibels per decade [6]. In the environment related to traffic-related health, long-term living in an environment related to transportation-related air pollution and noise contamination causes enormous damage to the human cardiovascular system and nervous system [7,8,9]. Therefore, various countries urgently need to solve the problem of environmental pollution caused by urban transportation to achieve sustainable development of urban traffic and the ecological environment [10]. Exploring urban transportation’s impact on ecological environments helps deepen understanding of environmental governance and has important scientific and practical significance.
Aware that urban transportation is harmful to residents’ health, many countries began to focus on developing public transport systems to alleviate environmental pollution caused by transportation [11,12]. In 2020, the Ministry of Transport of China and the National Development and Reform Commission issued the “Green Travel Creation Action Plan”, which emphasised the need to guide the public to choose green travel modes such as public transportation, walking, and cycling. Urban rail transit, as the primary mode of public transportation, has the most significant effect on the control of air pollution and noise pollution and is considered one of the most effective ways to control environmental pollution [13,14]. Urban rail transit, with its advantages of safety, comfort, speed and efficiency, energy-saving nature, and environmental protection, is developing rapidly in major cities in China [15].
However, scholars still have some doubts about the effect of urban rail transit on improving air pollution and noise pollution. Aiming at the relationship between rail transit and air quality, the existing literature mainly analyses the impact of rail transit on air quality from the aspects of traffic diversion and traffic creation. Mohring [16], the proponent of the transportation diversion theory, believed that rail transit could change the original travel mode of travellers and produce a traffic diversion effect. Rail transit improves urban air quality by reducing the number of private cars or taxi users, resulting in lower tailpipe emissions. Fageda [17] took 98 cities with rail transit in Europe as the research object and found that the air quality of all cities improved significantly after the opening of rail transit. Zheng et al. [18] conducted a differences-in-differences test using the daily average concentration data of air quality before and after the opening of rail transit in Changsha, China, from 2014 to 2016. The study found that in the first year of the opening of rail transit in Changsha, China, CO in the urban area decreased significantly, and the CO concentration decreased more during the peak travel period. Li et al. [19], based on an empirical analysis of 14 newly opened rail transit lines in Beijing from 2008 to 2016, found that air quality would improve by 2% for each standard deviation increase in rail transit density. Zhang et al. [20] calculated the carbon emissions generated by personal travel in two scenarios with or without rail transit in Baoji City, China, based on passenger travel demand. They found that carbon emissions would drop significantly in the scenario of rail transit.
Based on the traffic creation theory, some scholars have the opposite view. For example, Vickrey [21] argued that the construction of rail transit might cause residents living in the city centre to relocate to suburbs with relatively cheap housing prices, thereby creating new commuters and commuter demand. Duranton et al. [22] found that the improvement of ground transportation conditions by rail transit can make private driving more attractive and increase the need for people to use private cars for additional trips. Rivers et al. [23] found that public transportation did not improve air quality but increased local pollution levels by comparing nearby pollution levels during and without a public transportation strike in Canada. Some scholars believe that rail transit and the urban ecological environment are not a single positive and negative relationship. Liang et al. [24] analysed the impact of air pollution on the newly opened 45 lines in China and believe that rail transit has a scale effect. The longer the rail traffic accumulation operation has, the stronger the emission reduction effect of the newly opened rail transit line. Sun et al. [25] used the quarterly data of 28 cities with rail transit in China from 2013 to 2016 to judge the traffic diversion effect of rail transit construction on air quality. The study found that rail transit has a reduced effect on air pollution in the long run, while it harms air quality in the short run.
For the research on rail transit and urban traffic noise, some scholars compare rail transit with general road traffic and believe that the opening of rail transit has the same traffic diversion effect on noise pollution. Chua et al. [26] believed that most rail traffic operates underground, with the advantages of fast running speed and low vehicle density. Its noise is 5–10 decibels lower than general road traffic. Therefore, the opening of rail transit can significantly reduce the impact of transportation on the urban acoustic environment. Urban and Máca [27] surveyed five cities in the Czech Republic. They found that residents living within the range of rail transit noise exposure were less annoyed than those living within road noise exposure. Using data provided by the European Environment Agency, Wrótny and Bohatkiewicz [28] compared the impact of road noise and rail vehicle noise on the surrounding environment. They found that the environmental pollution caused by road noise was ten times higher than that caused by rail vehicle noise. Some scholars have also explored the noise pollution created by rail transit. Ding and Li [29] found that the impact of rail traffic noise on the acoustic environment along the line is related to the trainload. When rail transit is overloaded, the resulting traffic noise affects the everyday life of residents. It seriously affects the surrounding environment of rail transit line operation. Hao et al. [30] surveyed residents near Tianjin rail transit lines 1, 3, and 6. It was found that residents complained more about the low-frequency noise pollution caused by the friction between the track and the wheel. However, after grinding the wheel and rail and decelerating to 45 km/h, the residents’ living comfort improved significantly.
By reviewing the above-related studies, it can be found that most scholars believe that there is a positive emission reduction effect on the relationship between urban rail transit and air pollution and noise pollution, but there is a scale effect. In the early urban rail transit development stage, the ecological environment did not improve. However, it improved significantly when rail transit developed to a particular scale. The existing research on urban rail transit and the ecological environment is mainly aimed at a single line’s air pollution or noise pollution. The research results focus more on comparing rail transit with other modes of transportation and only explore the unilateral static effect of rail transit on the ecological environment. In reality, urban rail transit and the ecological environment are not only a one-way, static change relationship but a two-way, dynamic interactive coercion relationship with mutual influence, as shown in Figure 1. In the early stage of urban rail transit development, the travel sharing rate of rail transit was still relatively low, which could not effectively reduce the air pollution and noise pollution caused by general road traffic. In addition, since rail transit construction will involve a lot of demolition work and road fragmentation work, the traffic creation effect is higher than the traffic diversion effect, which further deteriorates the ecological environment along the rail transit line. The deterioration of the ecological environment has a negative effect on the development of rail transit, resulting in the government’s construction of rail transit being restricted to a certain extent and unable to concentrate on the development of rail transit. As rail transit development enters a new period, rail transit construction technology and construction achievements have broken through a certain critical point. The rail transit travel sharing rate has risen sharply, making the traffic diversion effect higher than the traffic creation effect. It has a significant control effect on air and noise pollution, and the ecological environment has gradually improved. The improvement of the ecological environment also prompted the government to invest more money and energy in rail transit development. In the later stage of urban rail transit development, rail transit has become the primary way of travel for residents. However, due to the overall increase in the overall travel volume, the traffic diversion effect and the traffic creation effect remain relatively balanced. The improvement effect of rail transit on the ecological environment is relatively insignificant. It is difficult for the ecological environment to have a significant positive impact on rail transit development.
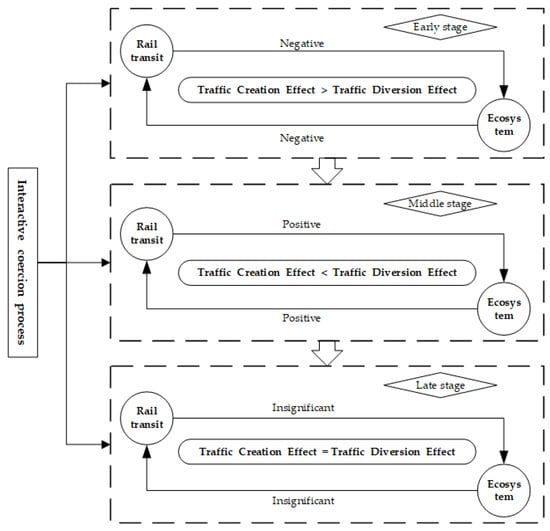
Figure 1.
The interactive coercion relationship between rail transit and the ecological environment.
However, few scholars have discussed the interaction between rail transit development and the ecological environment. Although Demirel et al. [31] studied the two-way effect of transportation and resources and the environment, no scholars have studied the interactive coercion relationship between rail transit and the ecological environment. Therefore, this study applied the interactive coercion theory [32,33,34] to the field of urban rail transit based on the above research results. The first ten cities in mainland China that opened and operated urban rail transit were selected to analyse the change trajectory of urban rail transit and the ecological environment from 2006 to 2019, and from the operational scale of rail transit and the atmospheric and acoustic environments in the ecological environment, to explore and verify the interactive coercion relationship between rail transit and the ecological environment. Then, we explored the degree of coupling and coordinated development between the two systems. This research hopes to provide theoretical support for the coordinated development of rail transit and the ecological environment.
2. The Interactive Coercing Model of Urban Rail Transit and Ecological Environment
This study designed a framework to measure the degree of coordinated development between urban rail transit and the ecological environment, as shown in Figure 2. The first is to establish an index system to calculate the overall level of the two subsystems. Among them, the entropy weight method was used to calculate the weight value of the indicators in the system. Then the TOPSIS method was used to calculate the total evaluation value of rail transit and the ecological environment. Then, the interactive coercion model of rail transit and ecosystem was established to verify whether there is a significant interactive coercion relationship between the two subsystems. After that, a coupling coordination degree model based on the coupling coordination function was established to evaluate the coupling coordination status of the two subsystems. Finally, according to the calculation results of the coupling coordination degree of rail transit and ecological environment, the coordinated development level of the two subsystems in each city was classified.
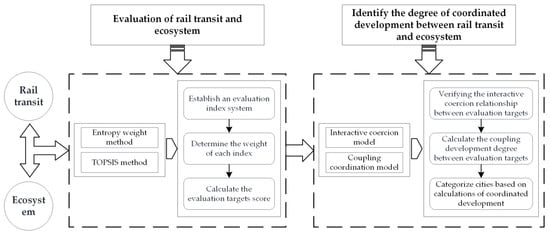
Figure 2.
Research framework.
2.1. Constructing an Analysis Model of Interactive Coercion Relationship
The theory of interactive coercion believes that vicious and virtuous cycle processes exist within the ecosystem. As the coercion of a specific subsystem breaks through a certain trigger point, the pressure will begin to appear. At the same time, the coercion system will be forced to adjust and slow down. When the active control measures come into play and the contradictions between the subsystems are eased, a new round of vicious circles becomes a virtuous circle that will start again. Scholars initially used this theory to analyse the interactive coercion relationship between urbanisation and the ecological environment. According to the research of Zhou [35], it was found that there is a particular logarithmic curve interactive relationship between the level of urbanisation and the level of economic development, and its expression is as follows:
In Formula (1): y is the level of urbanisation, x is GDP per capita, and a and b are non-negative undetermined parameters.
Grossman and Kreuger [36] confirmed that the relationship between the level of economic development and the ecological environment is an inverted “U”-shaped curve, and its expression is as follows:
In Formula (2): z is the ecological environment deterioration index; x is the per capita GDP, and m, n, and p are non-negative undetermined parameters.
Combining the above two relationship models, Huang et al. [37] further deduced the double exponential function of the interactive coercion relationship between urbanisation and the ecological environment, and its expression is as follows:
In Formula (3): z is the ecological environment deterioration index; y is the urbanisation level, and a, b, m, n and p are undetermined parameters. When , it means that the ecological environment gradually deteriorates with the increase in urbanisation level. When , it means that the deterioration of the ecological environment reaches the maximum value m. When , it means that the ecological environment gradually improves with the increase in urbanisation level.
With the deepening of research, some scholars have begun to apply the interactive coercion model of urbanisation and ecological environment to other fields, for example, terrestrial ecosystem [33], water resources ecosystem [34], cultivated land resource ecosystem [38], and other fields. In the early stage of rail transit development, air pollution and noise pollution were not effectively reduced due to poor technical equipment, low management level, and slow construction speed, and the ecological environment further deteriorated. With the upgrading of rail transit equipment technology, the improvement of the operation level, and the construction scale breaking through a certain critical point, rail transit began to produce apparent control effects on air pollution and noise pollution. There is an interactive coercion relationship between the two, similar to urbanisation and the ecological environment. Based on this, this study further reveals the evolution law between rail transit and the ecological environment through the interactive coercion model, whose expression is as follows:
In Formula (4): S1 and S2 are the ecological environment pressure index and rail transit comprehensive development index, respectively; m is the ecological environment threshold; a, b, n, and p are undetermined parameters. The m value is related to the degree of deterioration of the ecological environment when the curve’s inflexion point occurs. The larger the value, the higher the degree of deterioration of the ecological environment when the inflexion point occurs. The value of n is related to the ecological environment pressure with the development rate of rail transit. The larger the value, the faster the change rate of the ecological environment system. The b value is related to the development level of the rail transit system when the inflexion point of the curve occurs. The larger the value, the higher the development level of the rail transit system when the inflexion point occurs.
2.2. Construction of Evaluation Index System
In order to calculate the ecological environment pressure index (S1) and the comprehensive development index of rail transit (S2), this study referred to the research results of Xie et al. [39], Yin et al. [40], and Jain et al. [41]. According to the characteristics of ecological environment and rail transit development, and considering the availability of data indicators, this study selected three indicators to evaluate the comprehensive development index of rail transit from the perspective of the urban rail transit development scale. A total of five indicators were selected from the two dimensions of atmospheric environment and acoustic environment to evaluate the ecological environment pressure index, as shown in Table 1.

Table 1.
Evaluation index system and weight calculation results of urban rail transit and ecological environment system.
Due to the different dimensions of different indicators, they are not comparable. This paper adopted the dimensionless method to standardise the indicator data:
In formula (5), i is the index number, j is the year, Xij is the actual calculated value, and max(Xi) and min(Xi) are the maximum and minimum values of the i-th index, respectively.
Since the research area of this paper involves multi-city and multi-year comprehensive index calculation of urban rail transit and the ecological environment, considering the correlation between the indicators, to eliminate the subjective factors of weight determination, the entropy method [42] was used to calculate the index weight. The calculation results are shown in Table 1.
2.3. Calculate the Composite Index
In this study, the TOPSIS (Technique for Order Preference by Similarity to Ideal Solution) method was used to calculate the ecological environment pressure index (S1) and the comprehensive development index of rail transit (S2). The TOPSIS method is a comprehensive evaluation method for multi-objective decision-making. It can objectively and genuinely reflect the scores of different schemes by calculating the relative closeness between the evaluation scheme and the ideal scheme [43]. The calculation formula is:
In the formula: is the indicator weight in Table 1. R+ and are the set of optimal and worst solutions. and are the Euclidean distances between the optimal solution and the worst solution. is the comprehensive evaluation index.
2.4. Constructing the Evaluation Model of Coupling Coordination Degree
Coupling is a concept in physics. It reflects the phenomena and laws that promote or restrict each other through interaction and mutual influence among multiple systems or the elements that make up the system. The coupling coordination degree can be used to analyse the coordinated development level between systems, reflecting the benign coupling degree of each system and the interaction relationship between systems [44,45,46]. Therefore, this study used the coupling coordination degree model to study and analyse the coordinated development between the ecological environment and the urban rail transit system.
- (1)
- Calculation of coupling degree
According to the coupling degree calculation formula:
The coupling degree calculation formula between the urban rail transit and the ecological environment is as follows:
- (2)
- Calculation of comprehensive evaluation value
According to the calculation formula of the total evaluation value, is taken for the two systems of urban rail transit and ecological environment, so the calculation formula of the total evaluation value is as follows:
- (3)
- Calculation of coupling coordination degree
According to the calculation formula of the coupling coordination degree and Formulas (10) and (11), the final calculation formula of the coupling coordination degree is as follows:
This study divided the coupling coordination degree between urban rail transit and the ecological environment into four levels and 12 types, as shown in Table 2.
Table 2.
Coupling coordination degree level and type division.
3. Empirical Analysis
3.1. Study Area and Data Sources
As of 30 December 2019, 38 cities in China’s mainland areas had opened rail transit systems (Figure 3). As an emerging public transportation mode, the earliest opening time of urban rail transit significantly impacts the ecological environment [25]. Therefore, in this study, the first ten cities (Beijing, Changchun, Chongqing, Dalian, Guangzhou, Nanjing, Shanghai, Shenzhen, Tianjin, and Chongqing) in mainland China that opened rail transit operations were the research objects and we analysed the interactive coercion relationship between rail transit and the ecological environment. The research data are mainly from China Statistical Yearbook (China Statistics Press, 2007–2020) and China Social Statistical Yearbook (China Statistics Press, 2007–2020). Statistical Yearbook of Cities (China Statistics Press, 2007–2020), China Tertiary Industry Statistical Yearbook (China Statistics Press, 2007–2020), and China Environmental Statistical Yearbook (China Statistics Press, 2007–2019).
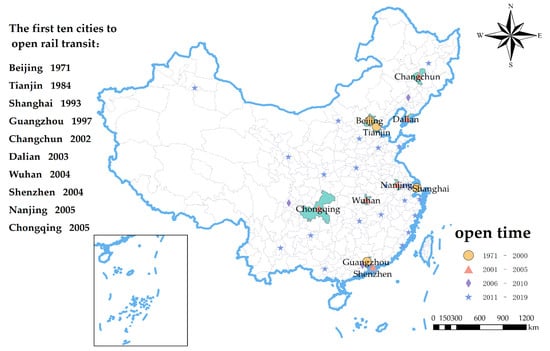
Figure 3.
Time for the opening of rail transit systems in cities in mainland China.
3.2. Analysis of Ecological Environment and Evolution Law of Urban Rail Transit
This study used the TOPSIS method to calculate the ecological environment pressure index and the comprehensive development index of rail transit in 10 cities from 2006 to 2019 and analysed the evolution law of the ecological environment and urban rail transit. From Figure 4, it can be seen that the overall development index of rail transit shows a stable upward trend, among which the upward trend in Beijing and Shanghai is particularly obvious. The growth rate of Guangzhou and Shenzhen is relatively moderate. The growth rate of other cities is relatively slow. In 2006, each city’s average rail transit development index was 0.053, increasing to 0.449 in 2019. Among the ten cities in 2019, Beijing and Shanghai’s rail transit development indexes reached 0.995 and 0.953, respectively. The average of the indexes of other cities was 0.318, while the indexes of Changchun and Dalian were both lower than 0.15.
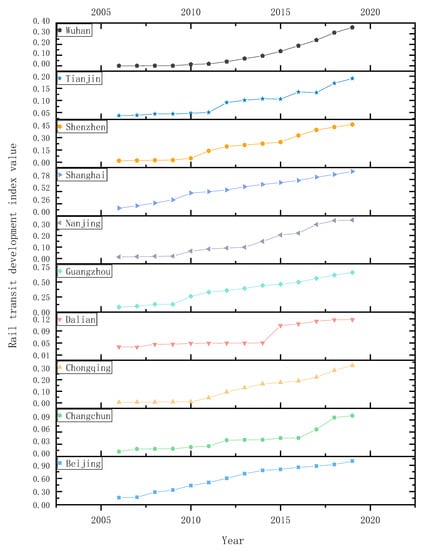
Figure 4.
The growth rate of rail transit.
As shown in Figure 5, from 2006 to 2019, the ecological environment pressure index of 10 cities was generally low, and only Wuhan showed a continuous downward trend. The rest of the cities showed a trend of first increase and then decreased, and the change range was more prominent. By the end of 2019, Tianjin’s ecological environment stress index ranked the highest among the ten cities, while Wuhan ranked the lowest. In 2006, the average index of ecological environment pressure in each city was 0.575. It dropped to 0.297 in 2019, with a reduced rate of 48.37%. Wuhan and Guangzhou saw the most significant declines among the ten cities, from 0.597 and 0.717 in 2006 to 0.066 and 0.320 in 2019. Tianjin had the lowest reduction rate of ecological environment pressure index, 23.84%. The ecological environment pressure index of 10 cities showed a negative growth trend, indicating that the ecological environment of each city tended to improve.
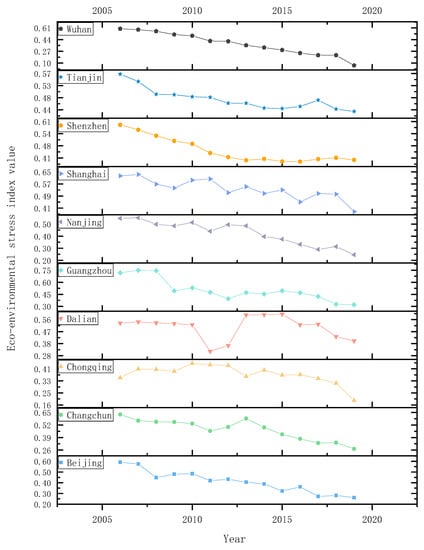
Figure 5.
The growth rate of the ecological environment.
3.3. Analysis of Interactive Coercion Effect between Urban Rail Transit and Ecological Environment
Based on the calculation results of the ecological environment pressure index and the comprehensive development index of rail transit, this study used Origin9.0 software to perform curve fitting for ten cities that opened rail transit from 2006 to 2019 and derive the corresponding double exponential relationship function (Table 3). According to the R2 test of the coefficient of determination, the curve equations of the ten cities have a good fitting effect.
Table 3.
Double exponential function equation of mutual stress between urban rail transit and the ecological environment.
From the value of m, Beijing > Guangzhou > Changchun > Wuhan > Shenzhen > Shanghai > Tianjin > Nanjing > Dalian > Chongqing, indicating that when the inflexion point of the urban rail transit development system curve appears in Beijing, the ecological environment system has a high degree of deterioration. Although Beijing was the first city in China to open rail transit, before 2000, the construction of urban roads in China was not based on public transportation but tended to be a private car-oriented urban road development model. The lag in Beijing’s rail transit development has stimulated the rapid development of private cars, resulting in the deterioration of the urban environment and severe ecological problems such as the greenhouse effect, air pollution, and traffic noise. From the point of view of the n value, Shanghai > Wuhan > Changchun > Shenzhen > Tianjin > Guangzhou > Beijing > Nanjing > Chongqing > Dalian, indicating that Shanghai’s ecological environment system has improved rapidly with the development of rail transit. Shanghai is currently one of the cities with the best development of urban rail transit in China. Rail transit has become the main body of urban transportation, giving full play to the transit diversion effect of rail transit and significantly improving ecological problems such as air pollution and traffic noise. From the perspective of b value, Shanghai > Beijing > Shenzhen > Guangzhou > Nanjing > Wuhan > Tianjin > Changchun > Dalian > Chongqing, indicating that the ecological environment of Shanghai began to improve gradually when the development level of urban rail transit was relatively high. Due to the rapid growth of the total number of motor vehicles and the average travel distance in Shanghai, more air pollution and traffic pollution have been created, so Shanghai’s urban rail transit only gradually improved the city’s ecological problems when it reached a high level of development.
According to the double exponential equation of mutual coercion between urban rail transit and ecological environment in Table 3, this study further drew a double exponential curve of the interaction between urban rail transit and ecological environment, as shown in Figure 6.
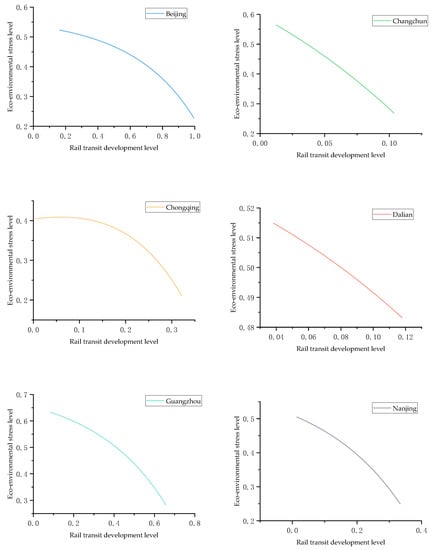
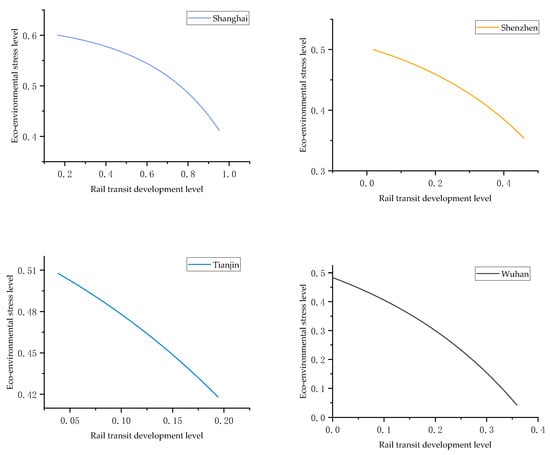
Figure 6.
Double exponential curve of the interaction between urban rail transit and the ecological environment.
Judging from the changing laws of the ecological environment and rail transit development in the ten cities in this study, the pressure on the ecological environment has ushered in an inflexion point under rail transit development. The development of rail transit generally has a negative coercive impact on the ecological environment pressure, indicating that rail transit development has a significant effect on improving the ecological environment. With the continuous expansion of the operation scale of urban rail transit, the city’s ecological environment will be further improved. The findings are consistent with the environmental Kuznets curve [36]. When the development level of rail transit in a region is low, the environmental pollution is relatively light. However, as the scale of rail transit operation expands, environmental pollution increases from low to high, and environmental deterioration increases with rail transit development. When the development of rail transit reaches a certain level and a certain inflexion point, with the further expansion of the operation scale of rail transit, the environmental pollution will gradually decrease from high to low, the degree of environmental pollution will gradually slow down, and the environmental quality will be gradually improved.
The above coefficient calculation results and relevant graph show that the ecological environment has a significant constraint effect on urban rail transit. The urban rail transit has a significant coercive effect on the ecological environment. The specific manifestation is that in the early stage of rail transit development, due to the limited planning and layout of urban transportation, the number of motor vehicles continued to rise, resulting in increasingly severe urban ecological environment problems, which made urban rail transit construction subject to certain constraints. With the further development of rail transit, the generation of urban air pollutants and noise has been dramatically reduced. The pressure on the urban ecological environment has continued to decline. In the later stage of rail transit development, the improvement of urban environmental quality has become the critical object of urban management. Many government funds have been invested in improving urban environmental quality, robbing the limited resources of urban transportation development, thus indirectly inhibiting the development of urban rail transit. The double exponential curve equation can adequately reflect the fundamental evolution law of the interactive coercion between rail transit and the ecological environment in 10 cities that have opened rail transit. That is to say, the development of urban rail transit has a noticeable coercive effect on the ecological environment, and the ecological environment also has a robust constraining effect on the development of urban rail transit.
3.4. Analysis of the Effect of Coordinated Development between Urban Rail Transit and Ecological Environment
Based on the coupling coordination degree level and type classification principles in Table 2, this study analysed the types of coordinated development of urban rail transit and the ecological environment from 2006 to 2019 (Table 4). From Table 4, we can draw the characteristics of the coupling and coordinated development of urban rail transit and the ecological environment:
- (1)
- The degree of coupling and coordination between urban rail transit and the ecological environment has been steadily improved. From 2006 to 2019, the coupling coordination degree of 10 cities showed a rising trend. Compared with 2006, the coordination degree in 2019 increased by 55.33%. In 2019, the coupling coordination between rail transit and ecological environment systems was type III or type IV in all cities. The degree of coupling coordination in Wuhan has changed the most, from the coupling coordination type I of urban rail transit and the ecological environment system in 2006 to the coupling coordination type IV of urban rail transit and the ecological environment system in 2019.
- (2)
- The degree of coordinated development of urban rail transit and ecological environment varies significantly. In terms of comprehensive categories, Beijing and Shanghai entered type IV in 2012 and 2014, respectively, showing a better level of coordination than other cities. The coordination levels of Changchun and Dalian are relatively poor, and it was not until 2017 that they got rid of type II and entered type III. In terms of sub-categories, although the comprehensive categories of Chongqing and Shenzhen from 2013 to 2019 are the same, the balanced development level of the urban rail transit system and the ecological environment system in Shenzhen is relatively good. By 2016, Shenzhen changed from type III1 to type III2.
- (3)
- The coordinated development level of urban rail transit and the ecological environment needs to be improved. At the end of 2019, only Shenzhen was in a relatively balanced development of urban rail transit and ecological environment among the ten cities. Changchun, Chongqing, Dalian, Nanjing, Tianjin, and Wuhan have relatively strong pressure on the ecological environment. Urban rail transit has not fully exerted its positive benefits on the ecological environment. There is still much room for improvement in the overall coordination level. Although other cities’ overall coupling coordination degree has reached a good coordination level, the coordinated development level of their ecological environment system is relatively lower than that of the urban rail transit system. The coordinated development level of the ecological environment system needs to be further improved.
Table 4.
Calculation and classification results of coupling coordination degree between urban rail transit and ecological environment.
Table 4.
Calculation and classification results of coupling coordination degree between urban rail transit and ecological environment.
| 2006 | 2007 | 2008 | 2009 | 2010 | 2011 | 2012 | 2013 | 2014 | 2015 | 2016 | 2017 | 2018 | 2019 | |
|---|---|---|---|---|---|---|---|---|---|---|---|---|---|---|
| Beijing | 0.506 | 0.519 | 0.630 | 0.645 | 0.688 | 0.736 | 0.765 | 0.805 | 0.832 | 0.860 | 0.859 | 0.895 | 0.901 | 0.926 |
| III1 | III1 | III1 | III1 | III2 | III2 | IV3 | IV3 | IV3 | IV3 | IV3 | IV3 | IV3 | IV3 | |
| Changchun | 0.261 | 0.302 | 0.304 | 0.306 | 0.324 | 0.345 | 0.379 | 0.363 | 0.382 | 0.405 | 0.414 | 0.463 | 0.506 | 0.524 |
| II1 | II1 | II1 | II1 | II1 | II1 | II1 | II1 | II1 | II1 | II1 | II1 | III1 | III1 | |
| Chongqing | 0.237 | 0.247 | 0.255 | 0.269 | 0.270 | 0.397 | 0.481 | 0.538 | 0.559 | 0.578 | 0.587 | 0.617 | 0.663 | 0.713 |
| I1 | I1 | II1 | II1 | II1 | II1 | II1 | III1 | III1 | III1 | III1 | III1 | III1 | III1 | |
| Dalian | 0.366 | 0.363 | 0.382 | 0.384 | 0.391 | 0.429 | 0.422 | 0.375 | 0.376 | 0.446 | 0.473 | 0.481 | 0.508 | 0.516 |
| II1 | II1 | II1 | II1 | II1 | II1 | II1 | II1 | II1 | II1 | II1 | II1 | III1 | III1 | |
| Guangzhou | 0.393 | 0.394 | 0.426 | 0.505 | 0.592 | 0.645 | 0.682 | 0.675 | 0.701 | 0.695 | 0.717 | 0.753 | 0.802 | 0.818 |
| II1 | II1 | II1 | III1 | III1 | III1 | III2 | III2 | III2 | III2 | III2 | IV3 | IV3 | IV3 | |
| Nanjing | 0.279 | 0.292 | 0.315 | 0.323 | 0.422 | 0.464 | 0.464 | 0.475 | 0.549 | 0.599 | 0.621 | 0.677 | 0.691 | 0.709 |
| II1 | II1 | II1 | II1 | II1 | II1 | II1 | II1 | III1 | III1 | III1 | III1 | III1 | III1 | |
| Shanghai | 0.499 | 0.532 | 0.587 | 0.630 | 0.668 | 0.675 | 0.723 | 0.729 | 0.760 | 0.762 | 0.805 | 0.801 | 0.817 | 0.876 |
| II1 | III1 | III1 | III1 | III1 | III2 | III2 | III2 | IV3 | IV3 | IV3 | IV3 | IV3 | IV3 | |
| Shenzhen | 0.293 | 0.313 | 0.328 | 0.339 | 0.398 | 0.529 | 0.579 | 0.597 | 0.607 | 0.623 | 0.668 | 0.697 | 0.709 | 0.725 |
| II1 | II1 | II1 | II1 | II1 | III1 | III1 | III1 | III1 | III1 | III2 | III2 | III2 | III2 | |
| Tianjin | 0.358 | 0.367 | 0.389 | 0.389 | 0.396 | 0.404 | 0.473 | 0.485 | 0.496 | 0.495 | 0.524 | 0.516 | 0.558 | 0.576 |
| II1 | II1 | II1 | II1 | II1 | II1 | II1 | II1 | II1 | II1 | III1 | III1 | III1 | III1 | |
| Wuhan | 0.001 | 0.106 | 0.128 | 0.148 | 0.288 | 0.321 | 0.388 | 0.457 | 0.501 | 0.558 | 0.613 | 0.659 | 0.702 | 0.761 |
| I1 | I1 | I1 | I1 | II1 | II1 | II1 | II1 | III1 | III1 | III1 | III1 | III1 | IV1 |
4. Discussion of Results
In order to reflect the current coordinated development degree of rail transit and ecological environment in each city, this study further divided cities into three categories based on the city’s average coupling coordination degree from 2017 to 2019 (Figure 7): high-level coordinated cities, intermediate coordinated cities, and primary coordinated cities.
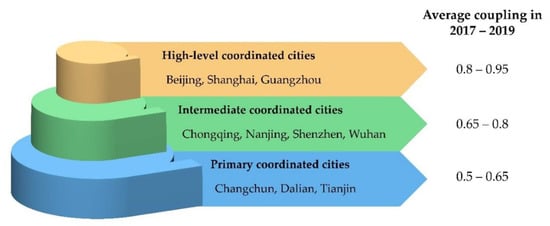
Figure 7.
Classification of the degree of urban coordination.
- (1)
- High-level coordinated cities: Beijing, Shanghai, Guangzhou. Beijing, Shanghai, and Guangzhou opened their first urban rail transit in 1971, 1993, and 1997, respectively, ranking first, third, and fourth among the cities in mainland China that have opened rail transit. Compared with other cities, Beijing, Shanghai, and Guangzhou have a larger base of passenger volumes, operating routes, and operating vehicles, and have the most significant positive effects on the ecological environment in terms of rail transit development. The overall coordinated development of urban rail transit and the ecological environment is the highest. This urban rail transit system has formed a relatively complete road network structure. At the same time, the improvement of the ecological environment is relatively slow. Urban managers should scientifically formulate a public transportation development strategy compatible with the development of the urban social environment and transportation construction, improve existing rail transit vehicles’ technical equipment and technical performance, and further reduce exhaust emissions and noise pollution [47].
- (2)
- Intermediate coordinated cities: Chongqing, Nanjing, Shenzhen, and Wuhan. The rail transit in Chongqing, Nanjing, Shenzhen, and Wuhan has developed relatively rapidly and has formed a certain scale. It gradually increased the transfer effect on general road traffic. It had a positive control effect on air pollution and noise pollution. In the future, urban managers can learn from the successful experience of domestic and foreign transportation development, scientifically plan and rationally design the rail transit system, further develop the rail transit road network structure, improve the operation mode and service quality of rail transit, and increase the attractiveness of rail transit to passengers. In addition, the use of non-green transportation such as private cars or taxis can be appropriately limited to realise the coordination between transportation and the ecological environment and promote the green development of transportation [48].
- (3)
- Primary coordinated cities: Changchun, Dalian, Nanjing, and Tianjin, accounting for 40% of this research city. Referring to the research conclusions of Liang et al. [24], the longer the accumulated mileage of the existing rail transit, the stronger the pollution control effect of the new line. When the cumulative mileage is less than 200 km, the pollution reduction effect of rail transit is less significant. The development level of rail transit in Changchun and Dalian is much lower than that of other cities. As of 2019, the operating mileage of rail transit in Changchun and Dalian has not exceeded 200 km. Tianjin is the second-largest city in mainland China that has opened rail transit. However, the development speed of rail transit in recent years has been relatively low. As of the end of 2019, the cumulative mileage of Tianjin’s rail transit is only higher than that of Changchun and Dalian, and it cannot give full play to the pollution reduction effect of rail transit. Urban managers should adhere to the development of urban public transportation with rail transit as the core, increase investment in rail transit and policy preference, cooperate with the introduction of corresponding local policies, improve the development efficiency of local rail transit, and create a favourable environment for the coordinated development of urban transportation and the ecological environment [49].
5. Conclusions and Policy Implications
This study used the entropy weight and TOPSIS method to analyse the evolution of rail transit development and the urban ecological environment from 2006 to 2019 in the ten earliest cities in China that opened rail transit. Based on the interactive coercion model and the coupling coordination degree model, the interactive coercion relationship between rail transit and the ecological environment was verified and calculated. The main conclusions are as follows: (1) There is an interactive coercive relationship between urban rail transit and the ecological environment. The evolution process between urban rail transit and the ecological environment system conforms to the law of double exponential curve changes. (2) In the early stage of urban public transport development, the development of rail transit could not meet the travel needs of the people, resulting in a substantial increase in the number of motor vehicles in the city, so the transportation diversion effect of rail transit was not significant. In the mid-term of urban rail transit development, rail transit began to show its advantages and became more attractive to residents. Therefore, the traffic transfer effect of rail transit was gradually strengthened, and the effect was remarkable. In the later urban rail transit development stage, rail transit has become the backbone of public transport in modern cities. It has begun to play a significant role in improving urban air quality and traffic noise. The pressure on the ecological environment has dropped significantly with the development of urban rail transit. (3) The coordinated development of urban rail transit and the ecological environment has been continuously improved. The urban rail transit system and the ecological environment system are in a virtuous cycle.
In this study, a double exponential relationship function was introduced in the context of China to verify the interactive coercion relationship between rail transit and the ecological environment. However, the principle of this function can also be applied to the research on the interaction between rail transit and the ecological environment in other countries. In other words, this study provides a reference method for studying the interaction relationship between rail transit and the ecological environment.
The research conclusions revealed some policy implications. First, the government should further accelerate the construction planning of urban rail transit, focus on the integration of bus and rail transit, and gradually improve the travel efficiency of public transportation. Cities with severe pollution should increase the cost of driving private cars and encourage residents to use public transportation. Secondly, a virtuous circle of rail transit development and ecological environment will be realised through innovative technologies such as energy-saving, green new energy, and carbon emission reduction. Thirdly, different regions can share the different development experiences of urban rail transit [50,51], such as social capital to participate in rail transit projects considering China’s substantial urban rail transit construction.
The limitation of this study is that the number of evaluation indicators selected was relatively tiny. Urban rail transit and ecological environment system is a complex index system. Due to the limitation of data availability, the indicators selected in this study may not be perfect. It is undeniable that studying the index system further and choosing a more reasonable index system are imperative. In addition, this study used the coupling coordination degree model to reveal the evolution characteristics and coordination types of the coordinated development of the urban rail transit and ecological environment composite system during the study period. However, the coordination index calculated by this model can only reflect the relative difference between the system indexes. It cannot characterise the value of the system index, which will be continued in the follow-up work of our research team.
Author Contributions
Conceptualization, L.J. and F.L.; methodology, F.L. and Y.Z.; software, F.L.; validation, L.J.; formal analysis, F.L.; investigation, F.L. and X.H.; resources, L.J.; data curation, F.L. and F.W.; writing—original draft preparation, F.L.; writing—review and editing, L.J., Y.Z. and Y.W.; visualization, F.L.; supervision, L.J.; project administration, L.J.; funding acquisition, L.J. All authors have read and agreed to the published version of the manuscript.
Funding
This research was funded by the National Natural Science Foundation of China (Grant No.71901043, No. 72004187), the Humanities and Social Science project of Ministry of Education of China (Grant No. 21YJC630169), the Science and Technology Research Project of Chongqing Ed-ucation Commission (Grant No. KJQN201900713, Grant No. KJQN202000724), the Natural Science Foundation of Chongqing (Grant No. cstc2021jcyj-msxmX1010).
Institutional Review Board Statement
Not applicable.
Informed Consent Statement
Not applicable.
Data Availability Statement
Not applicable.
Conflicts of Interest
The authors declare no conflict of interest.
References
- Liang, L.; Wang, Z.; Li, J. The effect of urbanisation on environmental pollution in rapidly developing urban agglomerations. J. Clean. Prod. 2019, 237, 117649. [Google Scholar] [CrossRef]
- Bristow, A.L.; Tight, M.; Pridmore, A.; May, A.D. Developing pathways to low carbon land-based passenger transport in Great Britain by 2050. Energy Policy 2008, 36, 3427–3435. [Google Scholar] [CrossRef]
- Hassan, S.T.; Zhu, B.; Lee, C.C.; Ahmad, P.; Sadiq, M. Asymmetric impacts of public service “transportation” on the environmental pollution in China. Environ. Impact Assess. Rev. 2021, 91, 106660. [Google Scholar] [CrossRef]
- Sun, C.; Xu, S.; Yang, M.; Gong, X. Urban traffic regulation and air pollution: A case study of urban motor vehicle restriction policy. Energy Policy 2022, 163, 112819. [Google Scholar] [CrossRef]
- Soleimani, M.; Akbari, N.; Saffari, B.; Haghshenas, H. Health effect assessment of PM2.5 pollution due to vehicular traffic (case study: Isfahan). J. Transp. Health 2022, 24, 101329. [Google Scholar] [CrossRef]
- Carlos, I.; Rafael, L.; Sergio, G.; Ramón, E. Spatio-temporal changes of road traffic noise pollution at ecoregional scale. Environ. Pollut. 2021, 286, 117291. [Google Scholar] [CrossRef]
- Lercher, P.; Widmann, U.; Thudium, J. Hypotension and Environmental Noise: A Replication Study. Int. J. Environ. Res. Public Health 2014, 11, 8661–8688. [Google Scholar] [CrossRef]
- Seidler, A.; Hegewald, J.; Seidler, A.H.; Schubert, M.; Zeeb, H. Is the whole more than the sum of its parts? health effects of different types of traffic noise combined. Int. J. Environ. Res. Public Health 2019, 16, 1665. [Google Scholar] [CrossRef]
- Hahad, O.; Frenis, K.; Kuntic, M.; Daiber, A.; Münzel, T. Accelerated Aging and Age-Related Diseases (CVD and Neurological) Due to Air Pollution and Traffic Noise Exposure. Int. J. Mol. Sci. 2021, 22, 2419. [Google Scholar] [CrossRef]
- Jiang, X.; Ma, H.; Wu, X.; Zou, Y.; Fu, J. Evaluation of environmental and economic efficiency of transportation in China based on SBM model. Procedia Comput. Sci. 2022, 199, 1120–1127. [Google Scholar] [CrossRef]
- Aminzadegana, S.; Shahriaria, M.; Mehranfar, F.; Abramović, B. Factors affecting the emission of pollutants in different types of transportation: A literature review. Energy Rep. 2022, 8, 2508–2509. [Google Scholar] [CrossRef]
- Lu, L.; Li, B.; Li, H.; AlBarakani, A. Expansion of city scale, traffic modes, traffic congestion, and air pollution. Cities 2021, 108, 102974. [Google Scholar] [CrossRef]
- Wang, X.; Xi, X.; Tao, Z. An Assessment Model of Reducing Air Pollution Benefit of Urban Rail Transit. Energy Procedia 2012, 14, 770–774. [Google Scholar] [CrossRef][Green Version]
- Zhu, Y.; Jiao, L.; Zhang, Y.; Wu, Y.; Huo, X. Sustainable Development of Urban Metro System: Perspective of Coordination between Supply and Demand. Int. J. Environ. Int. J. Environ. Res. Public Health 2021, 18, 10349. [Google Scholar] [CrossRef]
- Jiao, L.; Li, D.; Zhang, Y.; Zhu, Y.; Huo, X.; Wu, Y. Identification of the Key Influencing Factors of Urban Rail Transit Station Resilience against Disasters Caused by Rainstorms. Land 2021, 10, 1298. [Google Scholar] [CrossRef]
- Mohring, H.H. Optimization and scale economies in urban bus transport. Am. Econ. Rev. 1972, 62, 591–604. [Google Scholar]
- Fageda, X. Do light rail systems reduce traffic externalities? Empirical evidence from mid-size european cities. Transp. Res. Part D Transp. Environ. 2021, 92, 102731. [Google Scholar] [CrossRef]
- Zheng, S.; Zhang, X.; Sun, W.; Sun, W.; Wang, J. The effect of a new subway line on local air quality: A case study in Changsha. Transp. Res. Part D Transp. Environ. 2019, 68, 26–38. [Google Scholar] [CrossRef]
- Li, S.; Liu, Y.; Purevjav, A.O.; Yang, L. Does subway expansion improve air quality? J. Environ. Econ. Manag. 2019, 96, 213–235. [Google Scholar] [CrossRef]
- Zhang, N.; Wang, Z.; Chen, F.; Song, J.; Wang, J.; Li, Y. Low-Carbon Impact of Urban Rail Transit Based on Passenger Demand Forecast in Baoji. Energies 2020, 13, 782. [Google Scholar] [CrossRef]
- Vickrey, W.S. Congestion theory and transportation investment. Am. Econ. Rev. 1969, 59, 251–261. [Google Scholar]
- Duranton, G.; Turner, M.A. The Fundamental Law of Road Congestion: Evidence from US Cities. Am. Econ. Rev. Am. Econ. Assoc. 2011, 101, 2616–2652. [Google Scholar] [CrossRef]
- Rivers, N.; Saberian, S.; Schaufele, B. Public transit and air pollution: Evidence from Canadian transit strikes. Can. J. Econ./Rev. Can. D’économique 2020, 53, 496–525. [Google Scholar] [CrossRef]
- Liang, R.; Xi, P. Heterogeneous effects of rail transit on air pollution—An empirical study with RDID. China Ind. Econ. 2016, 3, 83–98. (In Chinese) [Google Scholar] [CrossRef]
- Sun, C.; Zhang, W.; Yuan, L.; Luo, Y.; Xu, Y. The improvement and substitution effect of transportation infrastructure on air quality: An empirical evidence from China’s rail transit construction. Energy Policy 2019, 129, 949–957. [Google Scholar] [CrossRef]
- Chua, D.K.H.; Koh, C.G.; Lo, K.W. Performance of Urban Rail Transit System: Vibration and Noise Study. J. Perform. Constr. Facil. 1997, 12, 67–75. [Google Scholar] [CrossRef]
- Urban, J.; Máca, V. Linking Traffic Noise, Noise Annoyance and Life Satisfaction: A Case Study. Int. J. Environ. Res. Public Health 2013, 10, 1895–1915. [Google Scholar] [CrossRef]
- Wrótny, M.; Bohatkiewicz, J. Traffic Noise and Inhabitant Health—A Comparison of Road and Rail Noise. Sustainability 2021, 13, 7340. [Google Scholar] [CrossRef]
- Ding, Z.; Li, D. Dynamic response analysis on vibration of ground and track system induced by metro operation. Eng. Comput. 2019, 36, 958–970. [Google Scholar] [CrossRef]
- Hao, Y.; Qi, H.; Liu, S.; Nian, V.; Zhang, Z. Study of Noise and Vibration Impacts to Buildings Due to Urban Rail Transit and Mitigation Measures. Sustainability 2022, 14, 3119. [Google Scholar] [CrossRef]
- Demirel, H.; Sertel, E.; Kaya, S.; Sekera, D.Z. Exploring impacts of road transportation on environment: A spatial approach. Desalination 2008, 226, 279–288. [Google Scholar] [CrossRef]
- Wang, S.; Ma, H.; Zhao, Y. Exploring the relationship between urbanisation and the eco-environment—A case study of Beijing–Tianjin–Hebei region. Ecol. Indic. 2014, 45, 171–183. [Google Scholar] [CrossRef]
- Yu, Y.; Tong, Y.; Tang, W.; Yuan, Y.; Chen, Y. Identifying Spatiotemporal Interactions between Urbanization and Eco-Environment in the Urban Agglomeration in the Middle Reaches of the Yangtze River, China. Sustainability 2018, 10, 290. [Google Scholar] [CrossRef]
- Xiao, R.; Lin, M.; Fei, X.; Li, Y.; Zhang, Z.; Meng, Q. Exploring the interactive coercing relationship between urbanisation and ecosystem service value in the Shanghai–Hangzhou Bay Metropolitan Region. J. Clean. Prod. 2020, 253, 119803. [Google Scholar] [CrossRef]
- Zhou, Y. Discussion on the regularity of the relationship between urbanisation and GDP. Popul. Econ. 1982, 1, 28–33. (In Chinese) [Google Scholar]
- Grossman, G.M.; Kreuger, A.B. Economic growth and the environment. Q. J. Econ. 1995, 110, 353–378. [Google Scholar] [CrossRef]
- Huang, J.; Fang, C. Analysis of coupling mechanism and rules between urbanisation and eco-environment. Geogr. Res. 2003, 22, 211–220. (In Chinese) [Google Scholar] [CrossRef]
- Zhou, D.; Tian, Y.; Jiang, G. Spatio-temporal investigation of the interactive relationship between urbanisation and ecosystem services: Case study of the Jingjinji urban agglomeration, China. Ecol. Indic. 2018, 95, 152–164. [Google Scholar] [CrossRef]
- Xie, X.; Fang, B.; He, S. Is China’s Urbanization Quality and Ecosystem Health Developing Harmoniously? An Empirical Analysis from Jiangsu, China. Land 2022, 11, 530. [Google Scholar] [CrossRef]
- Yin, Y.; Zhang, Y. Environmental Pollution Evaluation of Urban Rail Transit Construction Based on Entropy Weight Method. Nat. Environ. Pollut. Technol. 2021, 20, 819–824. [Google Scholar] [CrossRef]
- Jain, P.; Cullinane, S.; Cullinane, K. The impact of governance development models on urban rail efficiency. Transp. Res. Part A Policy Pract. 2008, 42, 1238–1250. [Google Scholar] [CrossRef]
- Zhou, D.; Xu, J.; Lin, Z. Conflict or coordination? Assessing land use multi-functionalisation using production-living-ecology analysis. Sci. Total Environ. 2017, 577, 136–147. [Google Scholar] [CrossRef]
- Chen, P. Effects of normalisation on the entropy-based TOPSIS method. Expert Syst. Appl. 2019, 136, 33–41. [Google Scholar] [CrossRef]
- Liu, T.; Song, Q.; Lu, J.; Qi, Y. An integrated approach to evaluating the coupling coordination degree between low-carbon development and air quality in Chinese cities. Adv. Clim. Chang. Res. 2021, 12, 710–722. [Google Scholar] [CrossRef]
- Dong, G.; Ge, Y.; Zhu, W.; Qu, Y.; Zhang, W. Coupling Coordination and Spatiotemporal Dynamic Evolution Between Green Urbanization and Green Finance: A Case Study in China. Front. Environ. Sci. 2021, 8, 621846. [Google Scholar] [CrossRef]
- Zhu, S.; Huang, J.; Zhao, Y. Coupling coordination analysis of ecosystem services and urban development of resource-based cities: A case study of Tangshan city. Ecol. Indic. 2022, 136, 108706. [Google Scholar] [CrossRef]
- Tan, Y.; Jiao, L.; Shuai, C.; Shen, L. A system dynamics model for simulating urban sustainability performance: A China case study. J. Clean. Prod. 2018, 199, 1107–1115. [Google Scholar] [CrossRef]
- Zhang, Y.; Chen, X.; Mao, Y.; Shuai, C.; Jiao, L.; Wu, Y. Analysis of resource allocation and PM2.5 pollution control efficiency: Evidence from 112 Chinese cities. Ecol. Indic. 2021, 127, 107705. [Google Scholar] [CrossRef]
- Shen, L.; Jiao, L.; He, B.; Li, L. Evaluation on the utility efficiency of metro infrastructure projects in China from sustainable development perspective. Int. J. Proj. Manag. 2015, 33, 528–536. [Google Scholar] [CrossRef]
- Tornabene, S.; Nilsson, I. Rail transit investments and economic development: Challenges for small businesses. J. Transp. Geogr. 2021, 94, 103087. [Google Scholar] [CrossRef]
- Sovacool, B.K.; Yazdi, A.H. Technological frames and the politics of automated electric Light Rail Rapid Transit in Poland and the United Kingdom. Technol. Soc. 2019, 59, 101190. [Google Scholar] [CrossRef]
Publisher’s Note: MDPI stays neutral with regard to jurisdictional claims in published maps and institutional affiliations. |
© 2022 by the authors. Licensee MDPI, Basel, Switzerland. This article is an open access article distributed under the terms and conditions of the Creative Commons Attribution (CC BY) license (https://creativecommons.org/licenses/by/4.0/).