Article

Impact of Land Management Scale on the Carbon Emissions of the Planting Industry in China

1
College of Economics and Management, Northwest A&F University, Xianyang 712100, China
2
International Energy Security Research Center, University of Chinese Academy of Social Sciences, Beijing 102488, China
*
Author to whom correspondence should be addressed.
Land 2022, 11(6), 816; https://doi.org/10.3390/land11060816
Submission received: 5 May 2022 / Revised: 29 May 2022 / Accepted: 30 May 2022 / Published: 31 May 2022
(This article belongs to the Special Issue The Impact of Land Use on Atmospheric Environment)

Abstract

:
A change in agricultural land management scale leads to the recombination and adjustment of production factors, which have an important impact on agricultural carbon emissions. There are few studies on the connection between the scale of land management and agricultural carbon emissions. In this study, we empirically examined the relationship between planting scale and agricultural carbon emissions using the threshold model, which allows the data to endogenously generate several regimes identified by the thresholds. The results showed that from 2003 to 2018, carbon emissions from planting first increased and then decreased, reaching their highest in 2015. Across the whole country in the main rice- and wheat-producing regions, the scale of planting land has a threshold effect on agricultural carbon emissions, showing an inverted “U” shape. Carbon sinks and natural disasters significantly affected planting carbon emissions in the above three regions. The amount of fiscal support for agriculture significantly affects planting carbon emissions in the national and main wheat-producing regions, while peasants’ per capita income significantly affects planting carbon emissions in the main rice- and wheat-producing regions. This study provides policy makers with new ideas, in that continuously expanding the scale of agricultural land management is conducive to reducing agricultural carbon emissions.

1. Introduction

The increasingly serious greenhouse effect has become the most pressing global environmental problem [1,2], and the main cause of the greenhouse effect is the large amount of carbon dioxide emissions. At present, China is the world’s largest carbon emitter, accounting for 35.6% of global greenhouse gas emissions [3]. With the speedy development of China’s economy, agricultural modernization, the rapid development of chemical agriculture, petroleum agriculture, and mechanical agriculture, China’s total grain production continues to improve. Meanwhile, China’s carbon emissions from agriculture are also growing significantly [4]. China’s crop production accounts for more than 50% of full agricultural output, making it the main component of agriculture. Wheat, corn, and rice account for more than half of the planting space of food crops [5]. However, within the methods of grain production in China, the costs of resources and of environmental impacts are too high. In the past 30 years, the total grain output has increased by 90%, but fertilizer consumption and greenhouse gas emissions have increased by 180% and 103%, respectively [6,7].
An appropriate scale-up of agricultural land is the only way to develop modern agriculture [8], which will promote cultivated productivity, ensure food safety, increase peasants’ incomes, and advance rural maintenance. Large-scale farmers have much more potential to assume maintainable farming practices. However, some scholars [9,10,11] believe that the environmental pollution caused by large-scale agricultural production, especially in the use of agricultural chemicals and energy, will be magnified due to the limitations of farmers’ educational levels and scientific farming technical abilities. Moreover, this will ultimately aggravate the emission of carbon dioxide and thus accelerate deterioration of the ecological environment.
In recent years, agricultural carbon emissions have received extensive attention [12]. Previous studies have primarily targeted the effects that influence agricultural carbon emissions, in addition to agricultural production categories [13,14], technology progress [15,16], and farmers’ costs and income [17,18]. The results showed that research and development (R&D) events can cut carbon emissions through refining agricultural production technology [19]. Additionally, resources for R&D activities are very important in increasing the amount of advanced agricultural production technology, ultimately reducing carbon emissions [20]. Other studies have proven that R&D support can effectively enhance the potency of agricultural production, thereby dropping its carbon emissions [21,22]. Ma et al. [23] indicated that population, affluence, and technology constitute the biggest impacts on CO2 emissions. Other studies have considered whether demographic structure can also affect agricultural CO2 emissions. For example, Li and Zhou [24] explored the effect of a series of demographic structural influences on agricultural CO2 emissions, concluding that average house size, and therefore the dependency magnitude relation, place negative impacts on agricultural CO2 emissions. Based on the spatial political economy model, Liao et al. [25] investigated the CO2 emissions of entirely different crops planted in the Kingdom of Sweden’s agriculture sector.
As agriculture is the dominant sector in China and, albeit conjointly, the first driver of environmental degradation, the scale of cultivated land takes center stage in environmental protection debates [26,27]. In this respect, studies have shown that the relations of different farm sizes in nearly all aspects, such as efficiency of agricultural production, use of pesticides and fertilizers [28], employment, and income, are highly relevant. With an increase in the scale of planting, a scale economy effect will be reached. Economies of scale are inherently associated with capital-intensive technological development: with the increasing number of foreign technological inventions, each unit of land can scale up production productivity and labor utilization, and thereby reduce input costs [29] in the meantime. That is to say, the larger the land occupied, the smaller the carbon footprint per unit of land. In order to realize economies of scale, China has introduced a number of policies, such as the No. One Documents, and a series of different agricultural policy documents in 2013 and 2014, whose goals are to market various kinds of large-scale farming [30]. In particular, the “separating three property rights” policy broadcasted in 2014 separated the possession, constricting, and management rights of farmland [31,32], and this further helped farmers achieve large-scale units [32]. However, some scholars say that compared with small-scale management, large-scale planting cannot protect the ecological environment. Wiggins et al. [33] argued that a converse relationship between land area and efficiency exists, owing to diseconomies of scale, as well as an absence of economies of scale in agriculture. Knickel et al. [34] and Ashkenazy et al. [35] also questioned whether large-scale farming supports sustainable agriculture. Accordingly, it is significant to explore the relationship between the scale of cultivated land management and agricultural environmental pollution.
The existing research results mainly discuss the impact of agricultural economic development level, production efficiency, structural factors, and labor scale on agricultural carbon emissions [17,23]; however, little consideration is given to reducing carbon emissions by adjusting the scale of land. The mode of agricultural production under large-scale management is bound to be very different from that of small-scale peasants. The massive transfer of labor toward non-agricultural sectors, and the outflow of cultivated land have resulted in changes in the scale of agricultural land management [24]. These changes led to the recombination and adjustment of production factors, which will inevitably have a significant influence on future agricultural carbon emissions [29]. Meanwhile, whether or not expanding the planting area can reduce carbon emissions is still controversial. In addition, most of the existing studies carried out research on farmers in specific areas through micro-surveys [33,35]. These data obtained are cross-sectional, which can not reveal underlying macro laws; furthermore, less consideration is given to the continuous changes of agricultural factor input and carbon emissions in time.
Therefore, the innovation of this paper is mainly reflected in two aspects. Firstly, based on an analysis of the impact mechanism of land scale on carbon emissions, this paper tested the threshold effect of land scale on the carbon emissions from the planting industry. Secondly, different crops have different effects on carbon emissions as a result of their planting areas, input of production factors, and farming systems. Therefore, taking the three major grains in China (corn, wheat, and rice) as an example, this paper further discusses whether there are differences between these crops in the relationship between planting scale and carbon emission.
The remainder of this paper is organized as follows: Section 2 outlines the theoretical frameworks; Section 3 describes the methodology and data; Section 4 presents the results and discussion; and Section 5 finishes with conclusions and policy implications.

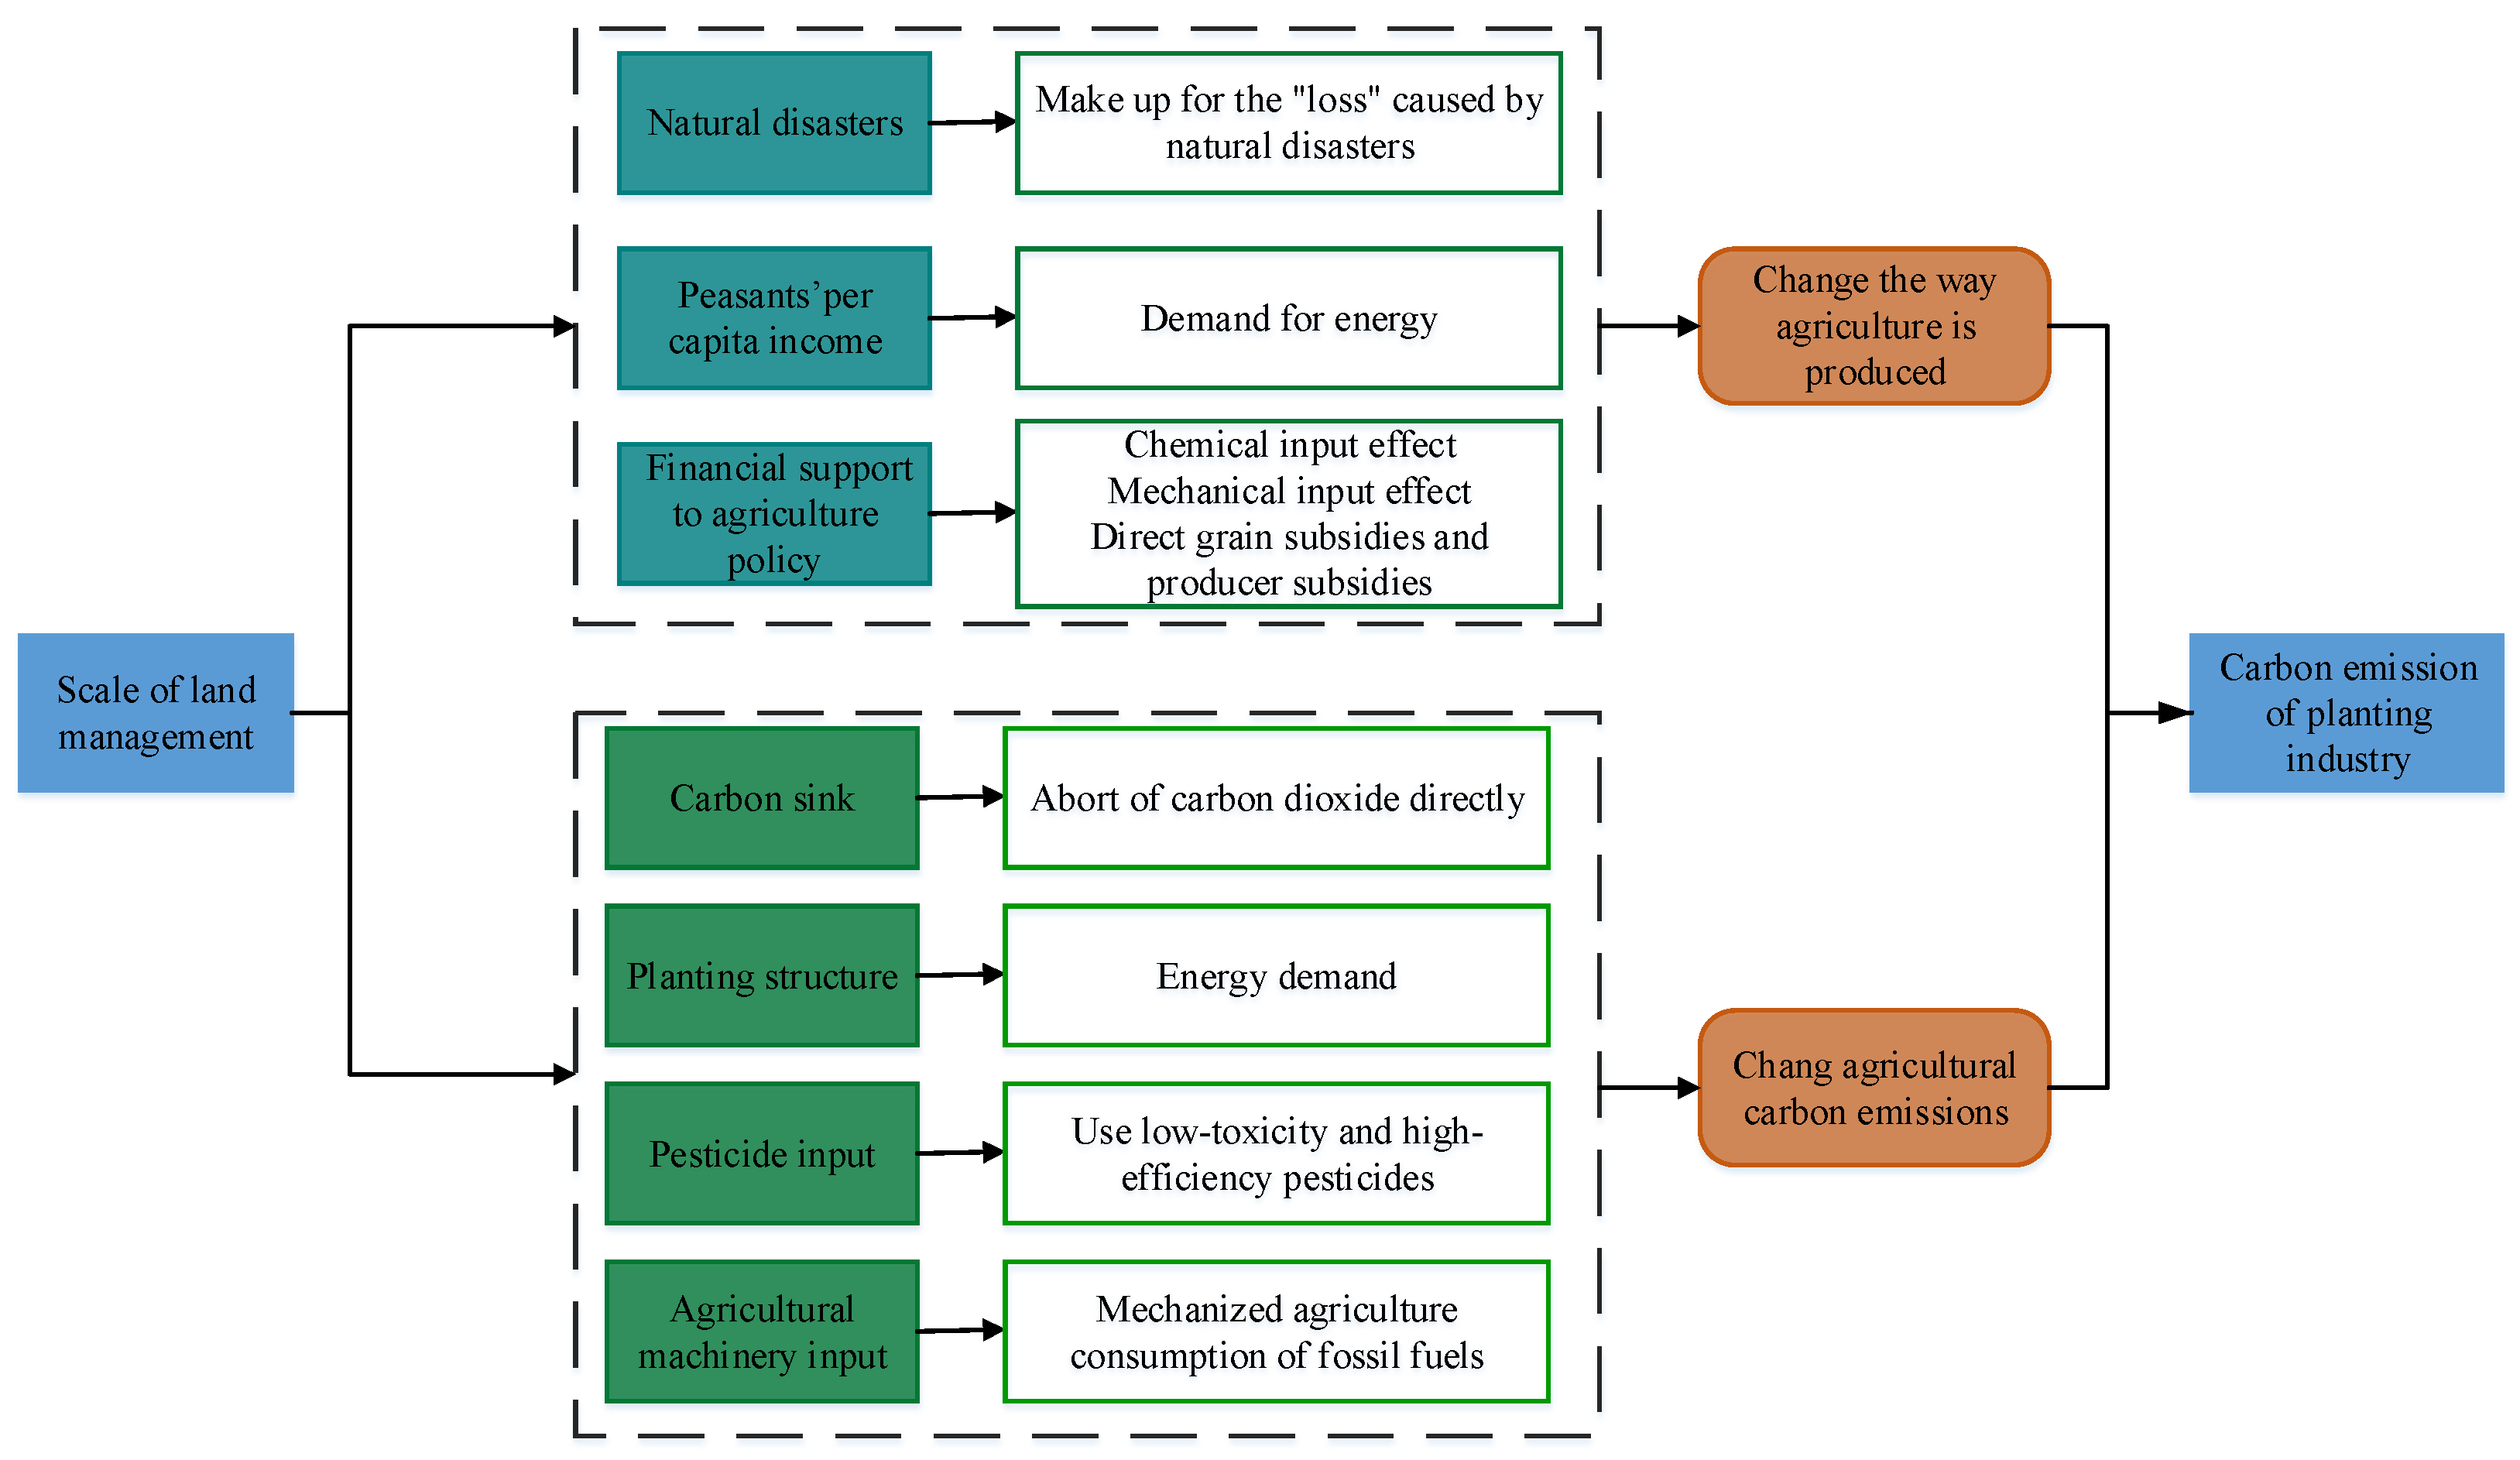
2. Theoretical Framework

Figure 1 depicts the theoretical framework. In theory, the scale of land management can affect agricultural carbon emissions through indirect paths such as natural disasters [36], fiscal support for agriculture, farmers’ per capita income [37], planting structure, pesticide input [38], and agricultural machinery input [39]. When encountering the same natural disaster, the larger the scale of land management, the larger the affected area of agriculture and the greater the reduction in yield, which will cause a greater distinction between the anticipated agricultural yield and the real yield. In order to make up for the “loss” caused by natural disasters, farmers with larger land management scales are more likely to change their original farming methods, thereby affecting agricultural carbon emissions. In terms of fiscal support for agriculture, farmers with a larger land management scale pay more attention to maintaining the land for sustainable use. Therefore, subsidies for soil-testing formula fertilizers and for slow and controlled-release fertilizers can be used to reduce the amount of chemical input and increase use efficiency. Subsidies are more conducive to the use of less toxic and less harmful agrochemicals, thereby reducing carbon emissions. Moreover, for farmers with a larger business scale, a purchase subsidy for agricultural machinery can significantly increase the investment intensity of their machinery and equipment, promote the consumption of fossil fuels and increase carbon emissions. Finally, an increase in the direct grain and producer subsidies obtained by farmers with a large planting scale can significantly enhance the enthusiasm of farmers to grow grain, in turn increasing the area of grain planting and thereby promote a relative reduction in the carbon emissions of planting. For peasants with a larger land management scale, an increase in their per capita income can lead to a greater energy demand for agricultural production. At the same time, peasants’ demand for electricity, natural gas, and other energy sources involved in production and living will also increase. Under the inflexible conditions that the energy consumption of the whole society is subjugated by carbon-based energy, agricultural carbon emissions will also increase. Different crops use different amounts of agricultural chemicals, such as pesticides and fertilizers, due to their different growth characteristics. Studies have shown that food crops emit less carbon than cash crops. Therefore, as the proportion of the food crop operation scale increases, carbon emissions relatively decrease. Peasants with larger management scales are more inclined to adopt new technologies such as efficient fertilization, which increases the efficiency of chemical input requirements and reduces environmental pollution and carbon emissions. The scale of land management affects the input intensity of agricultural machinery, which conversely affects agricultural carbon emissions. With an increase in the scale of land management, the level of mechanization will continue to increase, thereby accelerating the consumption of energy such as petroleum fuels, which in turn will increase carbon emissions. In summation, the use of agricultural machinery is conducive to improving agricultural production efficiency and reducing carbon emissions relatively.

3. Methodology and Data

3.1. Calculation Method of Planting Carbon Emissions

Based on the research results of many scholars, this paper determined the planting carbon emissions from the following two aspects: The first aspect is the carbon emissions from the input of production factors. Based on the research results of existing scholars, the carbon sources of planting production were classified into five categories in this paper: agricultural fertilizer, diesel oil, pesticide, plastic film, and irrigation. Planting carbon emissions include those from the use of agricultural fertilizers, diesel pesticides, and plastic film, and from the use of machinery and electricity for agricultural irrigation. Taking into consideration that tillage does not apply to all food crops, carbon emissions from tillage are not accounted for. The second aspect is the carbon emissions from growing wheat, corn, and rice, which produce nitrous oxide and methane gas. Methane emissions from rice cultivation have been incorporated into the planting carbon emission measurement system. Wheat, corn, and rice are the three major grain crops in China, and they are of equal importance in agricultural production. Meanwhile, because the growth habits of the three grain crops are quite different, they produce different types of greenhouse gases as they grow. Therefore, this paper divided the three major grain crops into spring wheat, winter wheat, corn, upland rice, medium rice, and double-cropping late rice, and considered the nitrous oxide and methane gas produced by them in the planting carbon emission measurement system. When adding up the planting carbon emissions, replace C, Methane (CH4), and N2O into standard C. The replacement criterion used was as follows: the greenhouse effect induced by 1 t of nitrous oxide (N2O) is equivalent to that induced by 81.2727 t of C (2.98 million t CO2), and that induced by 1 t of methane (CH4) is equivalent to that induced by 6.8182 t of C (25t CO2). Planting carbon emissions can be measured in the following way:
C ( t ) = T i σ i
where C ( t ) is the total carbon emissions of the three food crops in year t , 104 t; T represents the amount of carbon emission sources; i represents the type of carbon sources; and σ represents the carbon emission coefficient of each source.
The carbon emission coefficients for each factor of production are shown in Table 1, and the gas emission types and corresponding emission factors for each food crop are shown in Table 2.

3.2. Panel Threshold Regression Model

This article used the method of Gonzalez et al. [41] to establish the panel threshold regression model created by Tong, which is often used to divide the interval endogenously and find the threshold value according to the characteristics of the data itself. Thus, this approach can effectively avoid the bias caused by artificially dividing the sample interval, or by using the quadratic term model. The outstanding advantage of this model is its ability to automatically identify the sample data, in order to estimate the specific threshold number and value, and to perform a significant test of the threshold effect. In threshold research, the existing academic achievements mostly use the grouping test and the cross-item test model. The grouping test sets the dividing point through subjective experience, and the cross-item test is limited by the uncertainty of the form of the cross-item; neither approach can implement a significance test for the threshold effect. The threshold regression model can overcome the shortcomings of the above two methods, and can also complete a significance test while accurately estimating the threshold value [42]. Specifically, there are four advantages to this model. Firstly, it is not required to establish nonlinear equations in order to represent the relationships between variables. Secondly, the sample data decide the value and the amount of the threshold completely. Thirdly, it can calculate the boldness interval of those parameters with an asymptotic distribution theorem. Fourthly, the statistical significance of the thresholds can be estimated using the bootstrap method [43].
The process of estimating the panel threshold regression model is as follows: First, a value of the threshold variable is arbitrarily selected as the threshold value, the data are divided into two intervals, and the parameter values of the two intervals are estimated by the least square method. Then, the total residual of the square of the two interval parameters is calculated. Then, different thresholds are continuously and repeatedly selected, and the residual sum of squares corresponding to the threshold sum is recorded. Finally, the residual sum of squares is compared. Based on this study, the processes are as follows:
First, a panel threshold model is established in order to check the nonlinear effect of the scale of agricultural land on agricultural carbon emissions. The basic model is as follows:
ln Y i t = α + δ ln Z i t + ln x i t + u i t + ε i t
Based on Formula (2), it is initially assumed that there is a single-threshold effect to find a single-threshold model (3); this can then be extended to a double-threshold model (4).
ln Y i t = α + δ ln Z i t + β 1 ln x i t I ( η i t γ ) + β 2 ln x i t I ( η i t γ ) + u i t + ε i t
ln Y i t = α + δ ln Z i t + β 1 ln x i t I ( η i t γ 1 ) + β 2 ln x i t I ( γ 1 η i t γ 2 )   + β 3 ln x i t I ( η i t γ 2 ) + u i t + ε i t
In the above equation, Y i t is the explained variable; α is the controlled variable; x i t is the core explanatory variable; η i t is the threshold variable; γ is the threshold value; and I ( * ) is the indicator function. Next, the dummy variable is set as I i t ( α ) = { η i t γ } , when η i t γ , I = 1 ; otherwise, I = 0 . The variables β 1 , β 2 , β 3 are the influence coefficients of the explanatory variables on the explained variables when the threshold variables are in different threshold intervals. The variable u i t represents constant terms; and ε i t refers to the random error terms.
For a given threshold γ , the assessed value β of β ^ ( γ ) and the corresponding residual sum of squares can be obtained after estimating the following model:
S n ( γ ) = e ^ ( γ ) e ^ ( γ )
The variable γ ^ corresponds to the least residual total of squares; S n ( γ ) is the optimum threshold. When deciding the calculable threshold value, the corresponding parameter values of the model are determined. When deciding the parameter values, the threshold effect is additionally tested in order to assess the importance of the threshold effect, and the genuineness of the threshold estimated value.
In order to test the importance of the threshold effect, the hypothesis of the model test is H 0 : β 1 = β 2 ; H 1 : β 1 = β , and the following LM statistics are created to test the null hypothesis:
F 1 ( γ ) = S 0 S 1 γ ^ σ ^ 2
In this expression, S 0 and S 1 γ ^ are the null hypothesis and the residual total of squares below the condition of the threshold influence, respectively, and σ ^ 2 is the variance of the threshold regression residuals. As the threshold value is not identifiable below the null hypothesis, F 1 does not follow the standard asymptotic distribution, and the crucial worth cannot be obtained.
Then, the genuineness of the threshold estimation is tested, for which the matching null hypothesis is H 0 : γ ^ = β 0 . The precise figures are as follows:
L R γ = S 1 γ S 1 γ ^ σ ^ 2
where S 1 γ is the unrestrained residual number of squares. At the α level of notable,
L R γ C α = 2 ln [ 1 1 α ]
After the first threshold is obtained, the existence of two and three thresholds is sequentially verified until the null hypothesis is accepted. Then, the final threshold is determined. On the premise of the current research results of the model, and on the assumption of the existence of threshold effects, the following threshold regression models were constructed to study the impact of the single- and double-threshold effects of cultivated land area on agricultural carbon emissions. The specific models are presented in Equations (9) and (10):
ln A C E i t = α + δ ln Z i t + β 1 ln A R i t I ( η i t γ 1 )   + β 2 ln A R i t I ( η i t γ 1 ) + u i t + ε i t
ln A C E i t = α + δ ln Z i t + β 1 ln A R i t I ( η i t γ 1 ) + β 2 ln A R i t I ( γ 1 η i t γ 2 )   + β 3 ln A R i t I ( η i t γ 2 ) + u i t + ε i t
In these expressions, A C E i t is the explained variable, on behalf of the agricultural carbon emissions of province i in year t; A R i t is the explanatory variable, on behalf of the area of cultivated land of country i in year t; Z includes carbon sink, natural disasters, fiscal policy of supporting agriculture, and per capita income of farmers; q i t is the threshold variable, representing the threshold value of different levels; δ i t is the coefficient of the control variable; β 1 , β 2 , β 3 represent the coefficients of the core explanatory variables in different intervals; I ( * ) is the indicator function; u i t is the constant term; and ε i t is the random error term.

3.3. Data Sources

This study used data from 30 provinces in mainland China, excluding Tibet, from 2003 to 2018. The net output of agricultural chemical fertilizers, the use of agricultural diesel, the use of agricultural chemicals, the use of agricultural plastic film, the sown area, and the output of various food crops, were all obtained from China Rural Statistical Yearbooks [44]. The carbon emissions caused by irrigation were calculated from the irrigated area of arable land, and the data came from the China Water Conservancy Statistical Yearbook [45]. The population figures were obtained from China Statistical Yearbooks [46] at the end of the year. The annual gross agricultural production value of each province came from the China Agricultural Yearbook [47]. For the missing data in the data collection process, the mean value method was used for supplementation.
Based on the net yield of agricultural chemical fertilizers, the use of agricultural diesel oil, the use of agricultural chemicals, and the use of agricultural plastic film, all of the data were the sum of the actual use of all crops in each province and region in the same year. The data of irrigated area of cultivated land represented the total irrigated area of all crops in each province and region in the current year. As there were no data on sub-crops, this article referred to former scholars regarding the output value of the planting industry as 50% of the output value of agriculture, and the input quantity and irrigation area of the three major grain crops as half of the total input quantity and irrigation area of agricultural materials in each province.

4. Results and Discussion

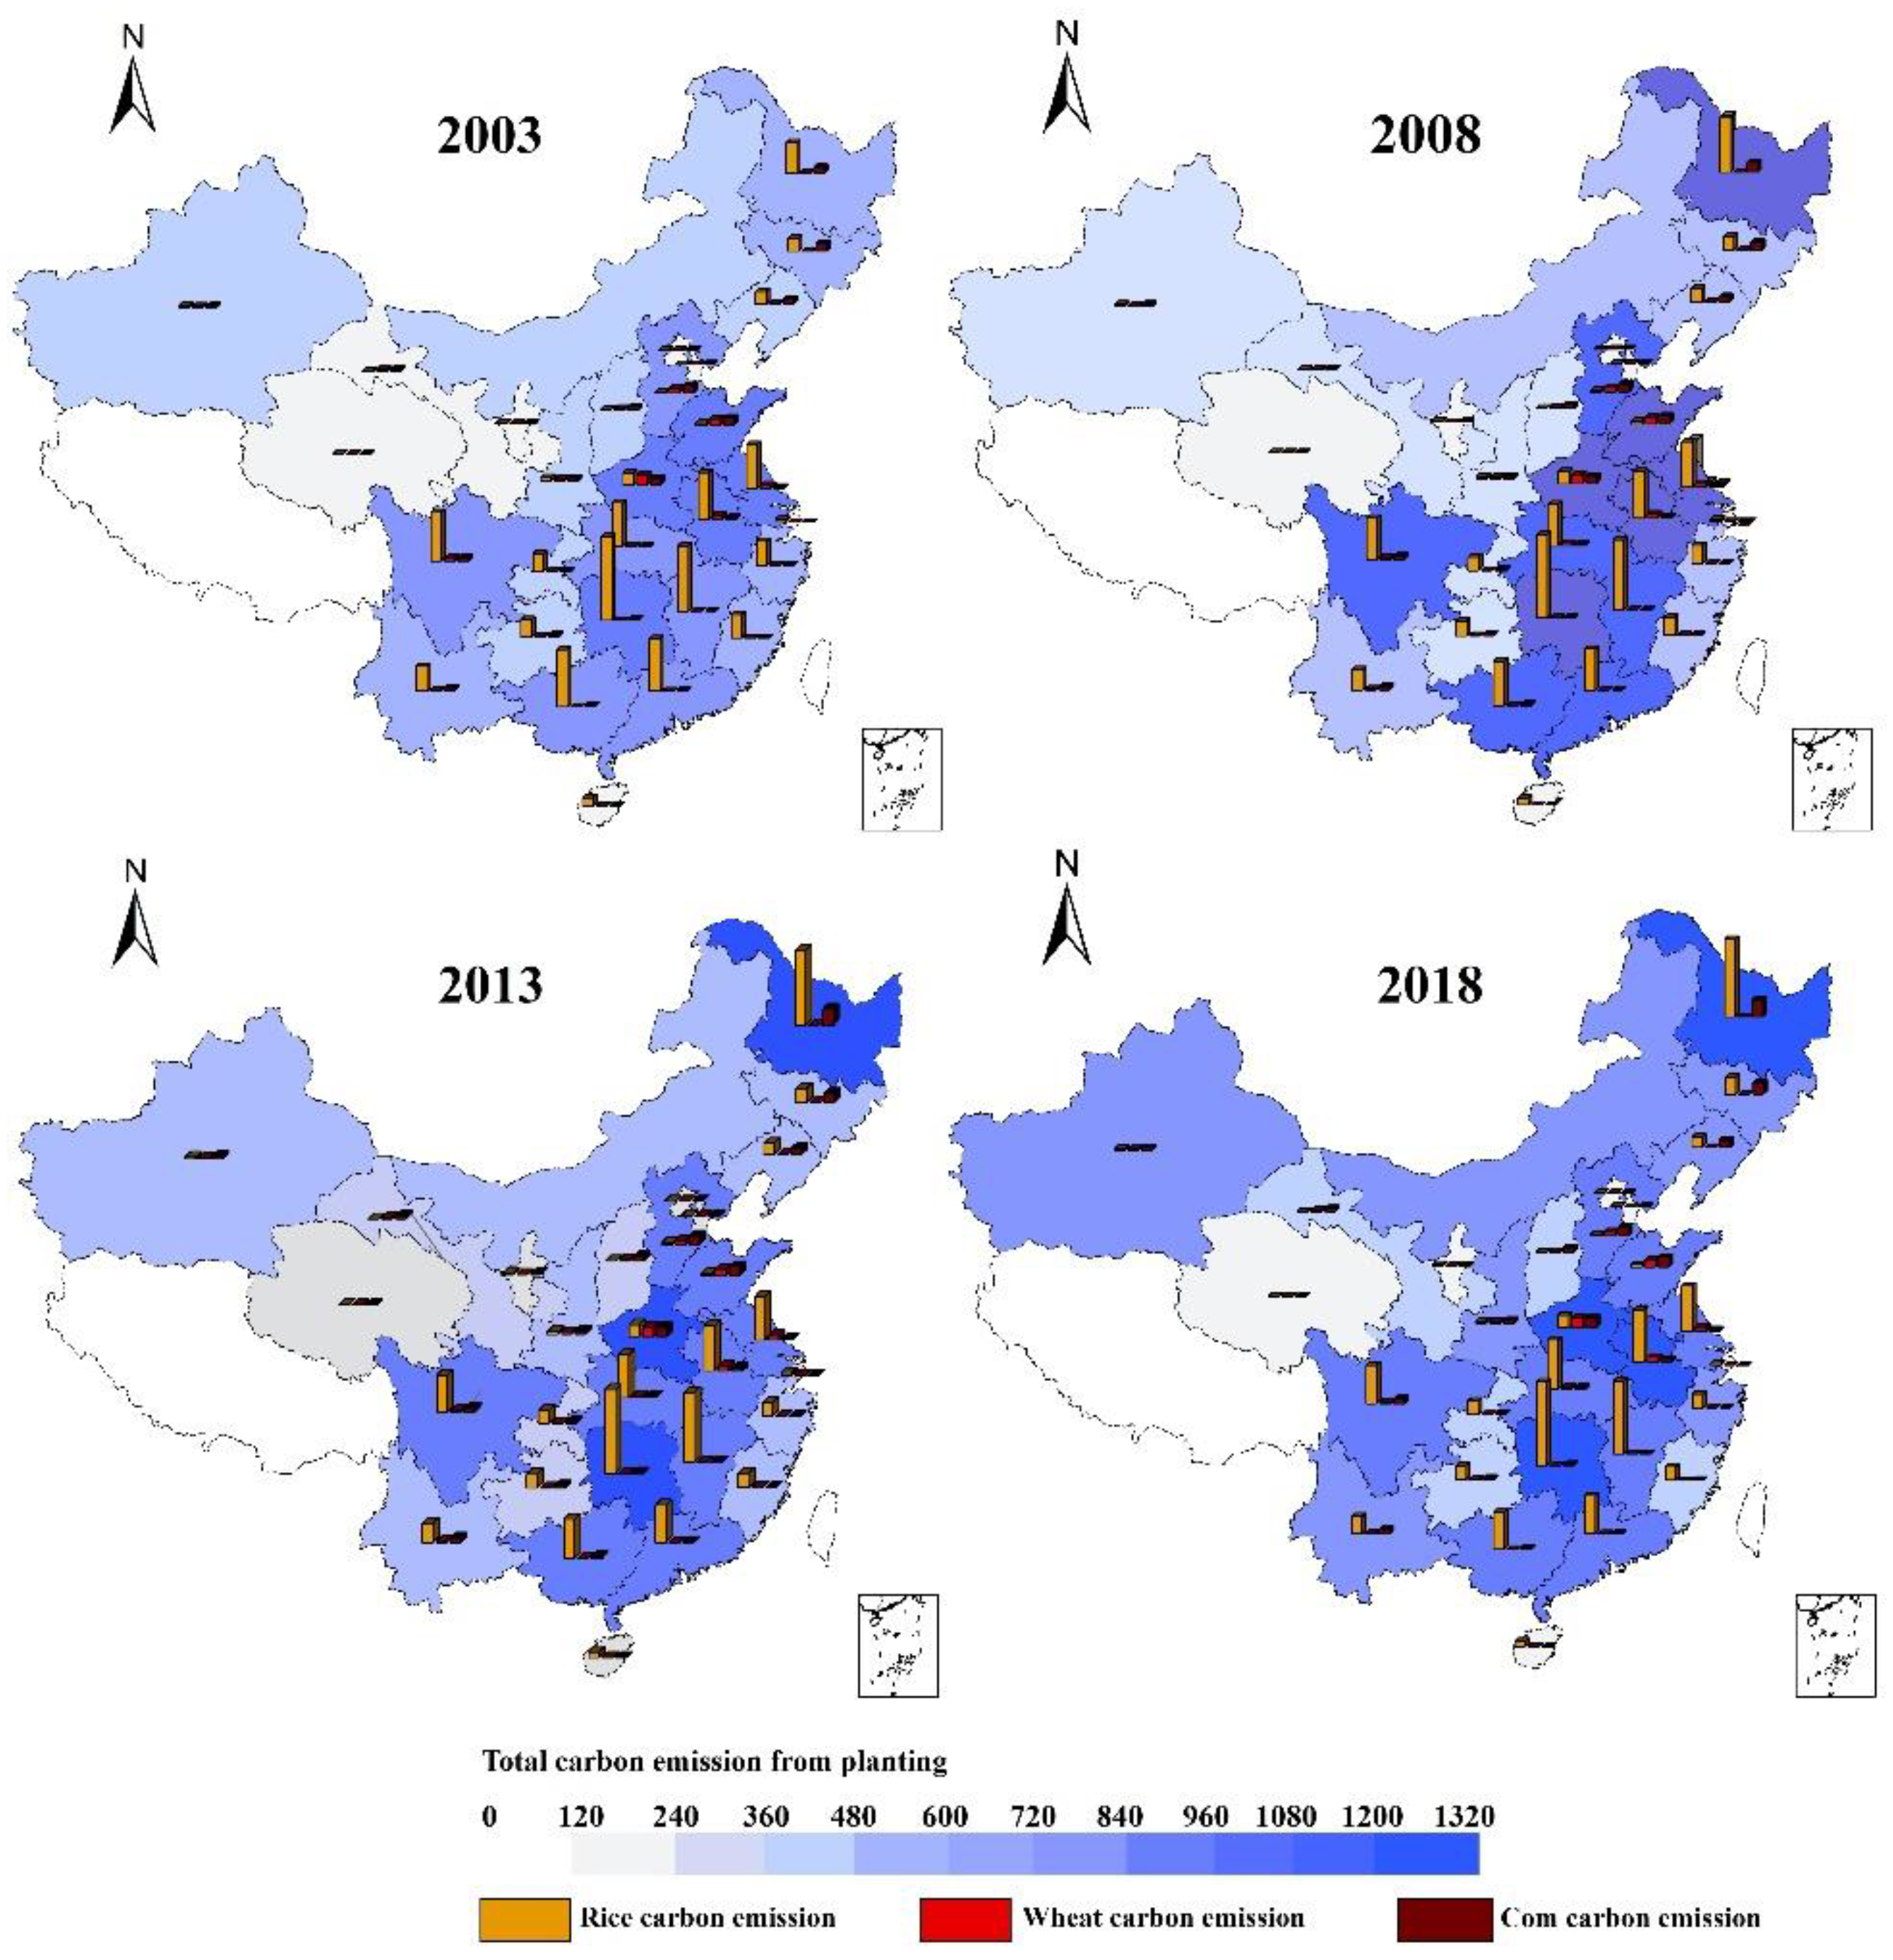
4.1. Spatio-Temporal Changes in Agricultural CO2 Emissions

In order to reveal regional differences, Figure 2 shows the provincial distribution of carbon emissions from cultivation. From 2003 to 2018, the carbon emissions from planting first increased and then decreased, reaching their highest in 2015, and then showing a downward trend. Specifically, more than two-thirds of the provinces increased their total carbon emissions. Among them, Heilongjiang and Henan had the largest increases. The carbon emissions of the other provinces remained roughly the same or decreased. Hebei and Zhejiang had the greatest reduction in carbon emissions. The provinces with the highest carbon emissions were Hunan, Henan, and Heilongjiang. Planting in Qinghai and Ningxia Hui Autonomous Region had lower carbon emissions. On the whole, the carbon emission distribution of the planting industry showed a decreasing trend from southwest to northwest. Judging from the carbon emissions for the three major grains, those of rice production were much higher than those of the other two grains. It can be found that the carbon emissions from rice production were positively correlated with provincial agricultural carbon emissions.

4.2. Unit Root Test

This paper considered the six variables of agricultural carbon emissions (ACE), carbon sinks (CS), urbanization level (UR), natural disasters (ND), fiscal policy on supporting agriculture (FP), and peasants’ per capital income (IN), and used their logarithms for analysis. This article used LLC and IPS tests. The LLC test is based on the homogeneous panel unit root hypothesis, while the IPS test is based on the heterogeneous panel unit root hypothesis. In order to enhance the robustness of the unit root test results, this paper uses the LLC and IPS tests to determine stationarity. Table 3 reports the results of the stationarity test of the relevant variables. The horizontal series of the main variables in the model showed obvious non-stationarity, but the first-order difference series of each variable showed stationarity at the 1% significance level. Therefore, all of the variables can be considered to be steady after the first-order difference.

4.3. Threshold Effect Test

Before estimating the threshold of the model, it is necessary to guarantee that the data have a threshold effect. The panel regression model was used to test whether there is a threshold effect, and to obtain an accurate threshold. This paper used Stata16.0 to test the threshold effect (results in Table 4 and Table 5). Taking the scale of land management as the threshold variable, the influence of planting scale on agricultural carbon emissions in 30 provinces in China was studied, and the relationship between the two was further explored using the main producing areas of rice, wheat, and corn.
The test results show that when studying 30 provinces in China, the single-threshold F-statistic of LNAR was 32.79, and the double-threshold F-statistic was 5.39; that is, there was only a single-threshold effect and no double-threshold effect. When studying the rice planting scale and carbon emissions in the major rice-producing areas in China, the single- and double-threshold F-statistics of LNAR were 53.82 and 44.93, respectively. When studying the major wheat-producing areas, the LNAR single-threshold F-statistic was 387.88 and the double-threshold F-statistic was 18.12, in which case there was only a single-threshold effect. When studying the main maize-producing areas, the LNAR single-threshold F-statistic was 17.33, which was lower than the critical value at the 10% significance level, indicating no threshold effect.

4.4. Regression Results of the Threshold Effect

The threshold effect regression results are shown in Table 6. In China’s 30 provinces, when the planting scale was less than the threshold 2.444, the estimated coefficient of the planting scale on agricultural carbon emissions was 0.122. In other words, agricultural carbon emissions rise with a surge in planting scale. When the planting scale exceeds the threshold, the influence of planting scale on agricultural carbon emissions was estimated to be −0.490, which is significant at the 99% confidence level. This illustrates that when the planting scale exceeds a certain limit, a continuous increase in planting scale can restrain agricultural carbon emissions. Within the main rice-producing areas, the impact of rice-planting scale on carbon emissions from rice production has a double-threshold effect. Under the first threshold of 0.896, the assessed coefficient of the rice planting scale on carbon emissions was 1.459, which is significant at the 99% confidence level; when the rice-planting scale was higher than the first threshold but lower than the second threshold of 0.903, the impact coefficient was 2.345, which is significant at the 99% confidence level; when the rice-planting scale exceeded the second threshold, the impact coefficient was 0.915, which is notable at the 95% confidence level. In the main wheat-producing areas, there was a single-threshold effect on the impact of wheat-planting scale on carbon emissions from wheat planting. When the wheat-planting scale was lower than the threshold value of 0.594, the impact coefficient of the wheat-planting scale on wheat-planting carbon emissions was 1.205, which is notable at the 99% confidence level; when the scale was greater than the threshold value, the impact coefficient was −0.100, which is at the 95% confidence level. However, in the major corn-producing areas, there was no threshold effect between the scale of corn planting and the carbon emissions from corn planting.
In the main wheat-producing regions across the whole country, the planting scale had a positive and then negative effect on agricultural carbon emissions. Namely, when the planting scale was smaller than the threshold, agricultural carbon emissions grew as the planting scale increased; however, when the threshold was exceeded, agricultural carbon emissions decreased as the planting scale increased. The reason can be explained as that with the expansion of planting scale, farmers hope to manage the few arable land on their own. However, because most farmers use “extensive” farming with more agricultural chemicals such as pesticides and fertilizers, which are consistent with those of Qin and LÜ, Li and Shen and Wei et al. [48,49,50], at this stage, agricultural carbon emissions increase with the expansion of planting scale. In addition, the transfer of rural surplus labor can promote the transfer of capital, reflecting the results of Shao et al. and Hao et al. [51,52], toward technology and other production factors. This is consistent with Yasmeen et al., who noted that carbon emissions are also significantly decreased by research and development investment [19], as well as agriculturally socialized services, such as mechanical farming services, irrigation services, and pest control services in the agricultural sector. This is furthermore supported by the findings of Qian et al. who show that outsourced agricultural machinery services could positively regulate each other’s influence on land leasing [53], thereby increasing agricultural productivity and reducing agricultural carbon emissions. However, at this stage, the transfer of agricultural labor is reduced, and laborers may even return to their hometowns. However, when the scale of planting is further expanded, farmers are more inclined to hire professional farmers and managers in order to cultivate and improve production methods, and hence agricultural carbon emissions also begin to decrease. Therefore, for the country and its main wheat-producing regions, as the planting area expands, agricultural carbon emissions show an inverted U-shaped change.
Only the planting area of the main corn-producing areas had no threshold effect on the impact of agricultural carbon emissions, which can be explained by the low soil fertility and by the variety levels used in these areas. This reason is supported by Xia et al. [54] who found that the main maize-producing areas had the lowest apparent utilization rate of nitrogen fertilizer and the lowest yield increase rate of nitrogen fertilizer. However, corn likes fertilizer; its plant is tall, its root system is developed, its absorption capacity is strong, thus it absorbs more nutrients. Except for C and hydrogen peroxide (H2O2), which come from CO2, other nutrients must be absorbed from the soil. Therefore, to produce the same yield, corn needs more fertilizer. In addition, compared to the main production areas of rice and wheat, the arable land in the main maize-producing areas is seriously fragmented, and the quality of its arable land is relatively poor. In order to pursue higher yields, farmers often apply more fertilizers. On the contrary, the reform of the agricultural technology extension system is lagging behind, and grassroots agricultural technology extension organizations are under attack. It is difficult for farmers to obtain scientific information on fertilization, which invisibly encourages farmers to overuse chemical fertilizers.
Carbon sinks (LNCS) have a significant positive influence on agricultural carbon emissions in the country and the main rice-producing areas, but curb agricultural carbon emissions in the main wheat-producing areas. Natural disasters (LNND) play a positive role in promoting agricultural carbon emissions throughout the country, as well as in the main rice- and wheat-producing areas. The Financial Support to Agriculture Policy (LNPS) has a significant negative impact on agricultural carbon emissions in the country and its main rice-producing areas. The results are consistent with those of Kärkkäinen et al. [55]. However, it has a significant positive impact on agricultural carbon emissions in the main wheat-producing areas. The reason could be that China has relatively substantial financial support for rice planting, as the world’s largest rice producer. From the perspective of the input effect of the fiscal policy mechanism for supporting agriculture, the purchase of agricultural machinery and tools directly increases the machinery and equipment in agricultural production. The investment intensity promotes the consumption of fossil fuels, thereby increasing carbon emissions. Alternatively, for farmers seeking to maximize output, financial support for agriculture creates a certain pressure or incentive, and they can increase output through the intensification of chemical inputs. Therefore, in the main rice-producing areas, fiscal support-based agriculture policies can significantly promote agricultural carbon emissions. The per capita income of farmers (LNIN) promotes agricultural carbon emissions across the country and in the main rice-and wheat-producing areas. In other words, with the development of the rural economy and the increase in per capita income, an increase in planting scale can promote agricultural carbon emissions. The result is similar to that of Kolte et al. [56]. In areas with higher economic levels, agricultural production tends to be capital-intensive rather than labor-intensive; investment in agricultural input increases, and the use of agrochemicals in agricultural production also increases, which objectively leads to an absolute increase in total greenhouse gas emissions. In addition, from the viewpoint of farmers’ lifestyles, the use of electricity and other energy sources also increases, thereby further increasing agricultural carbon emissions.

5. Conclusions and Policy Implications

Based on the data of 30 provinces in China from 2003 to 2018 in this study, we used a threshold model to quantitatively study the impact of planting scale on agricultural carbon emissions. Then, taking the main rice-, wheat-, and corn-producing areas as examples, we further explored the impact of the scale of planting land on agricultural carbon emissions. The conclusions that can be drawn are that, firstly, the distribution of carbon emissions from the planting industry shows a decreasing trend from southwest to northwest, and that the national carbon emissions from the planting industry also decrease. Secondly, the threshold value of planting scale on agricultural carbon emissions is 2.444, the threshold effect is 99%.; it has an inverted “U” shape. Thirdly, a threshold effect of farmland management scale on agricultural carbon emissions exists in the main rice- and wheat-producing areas, and there is a double-threshold effect in the main rice-producing areas, but not in the main corn-producing areas. Fourthly, the fiscal policy of supporting agriculture positively affects agricultural carbon emissions.
Based on the above findings, this study has the following implications:
(1)
The government should establish a unified carbon accounting system, in order to monitor the scale of planting land and agricultural carbon emissions in all provinces, so as to maximize the ecological effect of planting land. In terms of carbon emissions reduction, we can establish files on the basic situation of farmers’ agricultural production and operation, calculate and formulate standards of use for pesticides, chemical fertilizers, and plastic film by farmers, and formulate reward and punishment measures, in order to achieve the effect of carbon emissions reduction. It is suggested to reduce the redundancy of agricultural production resources, promote the rational utilization of agricultural factor resources, and protect the rural ecological environment.
(2)
Continuously expanding the scale of agricultural land management is conducive to reducing agricultural carbon emissions. We should constantly improve China’s land transfer system, further clarify the property rights of agricultural land, issue policy documents and measures to promote and reward the legal transfer of agricultural land, and guide various forms of large-scale transfer. In particular, the main rice- and corn-producing areas should speed up large-scale operation in order to reach the inflection point of the inverted “U” shape as soon as possible. For the main wheat-producing areas, the planting scale does not have an inverted “U”-shaped impact on agricultural carbon emissions, but continuously promotes an increase in carbon emissions. Therefore, the planting area of wheat-producing areas should be reasonably planned to control carbon emissions.
(3)
The government should increase investment in scientific research and encourage scientific research in institutes, agricultural colleges, and enterprises, in order to carry out research and development of low-carbon production technologies related to grain production. At the same time, enterprises and scientific research institutions should be supported to establish scientific research teams, in order to provide technical support for agricultural carbon emission reduction.
This paper only analyzes the impact mechanism of land scale on planting carbon emissions from a macro perspective. In the future, farmers’ level data can be further used to study the impact path of agricultural land management scale on agricultural carbon emissions, in order to verify the robustness of these conclusions.

Author Contributions

Funding acquisition, W.C.; methodology and writing—original draft preparation, J.L.; software and writing—theorical framework and editing, M.L.; investigation and data curation, Y.W. and Z.L.; writing—results, Q.L.; conceptualization and guidance, W.W. All authors have read and agreed to the published version of the manuscript.

Funding

This research was funded by the National Natural Science Foundation of China (72074181, 72103027), the National Social Science Foundation of China (20CJY023), the Innovation Capability Support Program of Shaanxi (2021KJXX-12), the Natural Science Basic Research Program of Shaanxi Province (2022JM-422), and the China Postdoctoral Science Foundation (2019M653780, 2019M663846).

Institutional Review Board Statement

Not applicable.

Informed Consent Statement

Not applicable.

Data Availability Statement

Not applicable.

Acknowledgments

The authors would like to thank the anonymous referees for their helpful suggestions and corrections on the earlier draft of our paper.

Conflicts of Interest

The authors declare no conflict of interest.

References

  1. Wang, Y.; Niu, Y.; Li, M.; Yu, Q.; Chen, W. Spatial structure and carbon emission of urban agglomerations: Spatiotemporal characteristics and driving forces. Sustain. Cities Soc. 2022, 78, 103600. [Google Scholar] [CrossRef]
  2. Wang, Y.; Yin, S.; Fang, X.; Chen, W. Interaction of economic agglomeration, energy conservation and emission reduction: Evidence from three major urban agglomerations in China. Energy 2022, 241, 122519. [Google Scholar] [CrossRef]
  3. Li, M.; Li, Q.; Wang, Y.; Chen, W. Spatial path and determinants of carbon transfer in the process of interprovincial industrial transfer in China. Environ. Impact Assess. Rev. 2022, 95, 106810. [Google Scholar] [CrossRef]
  4. Wu, X.; Zhang, J.; Cheng, L.; Tian, Y. Potential of agricultural carbon reduction under climate change and its spatial correlation characteristics in China: Based on the spatial Durbin model. China Popul. Resour. Environ. 2015, 25, 53–61. (In Chinese) [Google Scholar] [CrossRef]
  5. You, L.; Spoor, M.; Ulimwengu, J.; Zhang, S. Land use change and environmental stress of wheat, rice and corn production in China. China Econ. Rev. 2011, 22, 461–473. [Google Scholar] [CrossRef]
  6. Guo, C.; Liu, X.; He, X. A global meta-analysis of crop yield and agricultural greenhouse gas emissions under nitrogen fertilizer application. Sci. Total Environ. 2022, 831, 154982. [Google Scholar] [CrossRef]
  7. Islam, S.M.; Gaihre, Y.K.; Islam, M.R.; Ahmed, M.N.; Akter, M.; Singh, U.; Sander, B.O. Mitigating greenhouse gas emissions from irrigated rice cultivation through improved fertilizer and water management. J. Environ. Manag. 2022, 307, 114520. [Google Scholar] [CrossRef]
  8. Fei, R.L.; Lin, Z.Y.; Chunga, J. How land transfer affects agricultural land use efficiency: Evidence from China’s agricultural sector. Land Use Policy. 2021, 103, 105300. [Google Scholar] [CrossRef]
  9. Xue, Y.; Guo, J.; Li, C.; Xu, X.; Sun, Z.; Xu, Z.; Feng, L.; Zhang, L. Influencing factors of farmers’ cognition on agricultural mulch film pollution in rural China. Sci. Total Environ. 2021, 787, 147702. [Google Scholar] [CrossRef]
  10. Zhou, Z.; Liu, J.; Zeng, H.; Zhang, T.; Chen, X. How does soil pollution risk perception affect farmers’ pro-environmental behavior? The role of income level. J. Environ. Manag. 2020, 270, 110806. [Google Scholar] [CrossRef]
  11. Chuai, X.; Huang, X.; Wang, W.; Zhao, R.; Zhang, M.; Wu, C. Land use, total carbon emissions change and low carbon land management in Coastal Jiangsu, China. J. Clean. Prod. 2015, 103, 77–86. [Google Scholar] [CrossRef]
  12. Hansen, B.E. Threshold effects in non-dynamic panels: Estimation, testing, and inference. J. Econom. 1999, 93, 345–368. [Google Scholar] [CrossRef] [Green Version]
  13. Bennetzen, E.H.; Smith, P.; Porter, J.R. Agricultural production and greenhouse gas emissions from world regions—The major trends over 40 years. Glob. Environ. Change 2016, 37, 43–55. [Google Scholar] [CrossRef]
  14. Mohammadi, A.; Rafiee, S.; Jafari, A.; Keyhani, A.; Mousavi-Avval, S.H.; Nonhebel, S. Energy use efficiency and greenhouse gas emissions of farming systems in north Iran. Renew. Sustain. Energy Rev. 2014, 30, 724–733. [Google Scholar] [CrossRef]
  15. Smith, P.; Martino, D.; Cai, Z.; Gwary, D.; Janzen, H.; Kumar, P.; McCarl, B.; Ogle, S.; O’Mara, F.; Rice, C.; et al. Greenhouse gas mitigation in agriculture. Philos. Trans. R. Soc. B Biol. Sci. 2008, 363, 789–813. [Google Scholar] [CrossRef] [Green Version]
  16. Zaman, K.; Khan, M.M.; Ahmad, M.; Rustam, R. The relationship between agricultural technology and energy demand in Pakistan. Energy Policy 2012, 44, 268–279. [Google Scholar] [CrossRef]
  17. Glenk, K.; Eory, V.; Colombo, S.; Barnes, A. Adoption of greenhouse gas mitigation in agriculture: An analysis of dairy farmers’ perceptions and adoption behaviour. Ecol. Econ. 2014, 108, 49–58. [Google Scholar] [CrossRef]
  18. Dulal, H.B.; Brodnig, G.; Shah, K.U. Capital assets and institutional constraints to implementation of greenhouse gas mitigation options in agriculture. Mitig. Adapt. Strateg. Glob. Change 2010, 16, 1–23. [Google Scholar] [CrossRef]
  19. Yasmeen, R.; Tao, R.; Shah, W.U.H.; Padda, I.U.H.; Tang, C. The nexuses between carbon emissions, agriculture production efficiency, research and development, and government effectiveness: Evidence from major agriculture-producing countries. Environ. Sci. Pollut. Res. 2022, 1–14. [Google Scholar] [CrossRef]
  20. Cui, L.; Sun, Y.; Song, M.; Zhu, L. Co-financing in the green climate fund: Lessons from the global environment facility. Clim. Policy 2020, 20, 95–108. [Google Scholar] [CrossRef]
  21. Lin, B.; Xu, B. Factors affecting CO2 emissions in China’s agriculture sector: A quantile regression. Renew Sustain. Energy 2018, 94, 15–27. [Google Scholar] [CrossRef]
  22. Fei, R.; Lin, B. Technology gap and CO2 emission reduction potential by technical efficiency measures: A meta-frontier modeling for the Chinese agricultural sector. Ecol. Indic. 2017, 73, 653–661. [Google Scholar] [CrossRef]
  23. Ma, X.; Wang, C.; Dong, B.; Gu, G.; Chen, R.; Li, Y.; Li, Q. Carbon emissions from energy consumption in China: Its measurement and driving factors. Sci. Total Environ. 2019, 648, 1411–1420. [Google Scholar] [CrossRef] [PubMed]
  24. Li, S.; Zhou, C. What are the impacts of demographic structure on CO2 emissions? A regional analysis in China via heterogeneous panel estimates. Sci. Total Environ. 2019, 650, 2021–2031. [Google Scholar] [CrossRef]
  25. Liao, C.; Feng, Z.; Li, P.; Zhang, J. Monitoring the spatio-temporal dynamics of swidden agriculture and fallow vegetation recovery using Landsat imagery in northern Laos. J. Geogr. Sci. 2015, 25, 1218–1234. [Google Scholar] [CrossRef] [Green Version]
  26. Squires, V.; Blumröder, J.S.; Ibisch, P.L.; Krause, A.; Missall, S.; Welp, M.; Halik, Ü.; Abliz, A.; Fernández-Giménez, M.; Andreeva, O.V.; et al. Global Land Outlook (GLO); 2019; ISBN 978-92-95110-68-7. Available online: https://portals.iucn.org/library/node/48554 (accessed on 4 May 2022).
  27. Lai, L.; Huang, X.; Yang, H.; Chuai, X.; Zhang, M.; Zhong, T.; Chen, Z.; Chen, Y.; Wang, X.; Thompson, A.J.R. Carbon emissions from land-use change and management in China between 1990 and 2010. Sci. Adv. 2016, 2, e1601063. [Google Scholar] [CrossRef] [Green Version]
  28. Guo, L.; Li, H.; Cao, X.; Cao, A.; Huang, M. Effect of agricultural subsidies on the use of chemical fertilizer. J. Environ. Manag. 2021, 299, 113621. [Google Scholar] [CrossRef]
  29. De Roest, K.; Ferrari, P.; Knickel, K. Specialisation and economies of scale or diversification and economies of scope? Assessing different agricultural development pathways. J. Rural. Stud. 2018, 59, 222–231. [Google Scholar] [CrossRef]
  30. Zuo, Y.; Ma, L.; Cai, H.; Wu, T.; Xin, X. China’s on-going debates over large-scale farming: What are the pros and cons? China Agric. Econ. Rev. 2015, 7, 338–343. [Google Scholar] [CrossRef]
  31. Li, A.; Wu, J.; Zhang, X.; Xue, J.; Liu, Z.; Han, X.; Huang, J. China’s new rural “separating three property rights” land reform results in grassland degradation: Evidence from Inner Mongolia. Land Use Policy 2019, 71, 170–182. [Google Scholar] [CrossRef]
  32. Li, Y.; Wu, W.; Liu, Y. Land consolidation for rural sustainability in China: Practical reflections and policy implications. Land Use Policy 2018, 74, 137–141. [Google Scholar] [CrossRef]
  33. Wiggins, S.; Kirsten, J.; Lambi, L. The future of small farms. World Dev. 2010, 38, 1341–1349. [Google Scholar] [CrossRef]
  34. Knickel, K.; Redman, M.; Darnhofer, I.; Ashkenazy, A.; Calväo Chebach, T.; Sumane, S.; Tisenkopfs, T.; Zemeckis, R.; Atkociuniene, V.; Rivera, M.; et al. Between aspirations and reality: Making farming, food systems and rural areas more resilient, sustainable and equitable. J. Rural. Stud. 2017, 59, 197–210. [Google Scholar] [CrossRef] [Green Version]
  35. Ashkenazy, A.; Chebach, T.C.; Knickel, K.; Peter, S.; Horowitz, B.; Offenbach, R. Operationalising resilience in farms and rural regions–Findings from fourteen case studies. J. Rural. Stud. 2018, 59, 211–221. [Google Scholar] [CrossRef]
  36. Trinh, T.A.; Feeny, S.; Posso, A. The impact of natural disasters and climate change on agriculture: Findings from Vietnam//Economic effects of natural disasters. In Economic Effects of Natural Disasters; Academic Press: Cambridge, MA, USA, 2021; pp. 261–280. [Google Scholar] [CrossRef]
  37. Carroccio, A.; Crescimanno, M.; Galati, A.; Tulone, A. The land grabbing in the international scenario: The role of the EU in land grabbing. Agric. Food Econ. 2016, 4, 1–9. [Google Scholar] [CrossRef] [Green Version]
  38. Van der Werf, H.M.G. Assessing the impact of pesticides on the environment. Agric. Ecosyst. Environ. 1996, 60, 81–96. [Google Scholar] [CrossRef]
  39. Salami, P.; Ahmadi, H. Energy inputs and outputs in a chickpea production system in Kurdistan, Iran. Afr. Crop Sci. J. 2010, 18, 51–57. [Google Scholar] [CrossRef]
  40. Duan, H.P.; Zhang, Y.; Zhao, J.B.; Bian, X.M. Carbon footprint analysis of farmland ecosystem in China. J. Soil Water Conserv. 2011, 25, 203–208. (In Chinese) [Google Scholar] [CrossRef]
  41. Gonzalez, A.; Teräsvirta, T.; Van Dijk, D.; Yang, Y. Panel Smooth Transition Regression Models; 2017; ISSN 1441-8010. Available online: https://ideas.repec.org/p/hhs/hastef/0604.html (accessed on 4 May 2022).
  42. Hajamini, M.; Falahi, M.A. Economic growth and government size in developed European countries: A panel threshold approach. Econ. Anal. Policy 2018, 58, 1–13. [Google Scholar] [CrossRef]
  43. Anatolyev, S. Inference when a nuisance parameter is weakly identified under the null hypothesis. Econ. Lett. 2004, 84, 245–254. [Google Scholar] [CrossRef]
  44. National Bureau of Statistics China (NBSC). China Rural Statistical Yearbook; Statistics Press: Beijing, China, 2020.
  45. China Water Resource Yearbook Compilation Committee. China Water Statistical Yearbook 2020; Water and Power Press: Beijing, China, 2020.
  46. National Bureau of Statistics of China (NBSC). China Statistical Yearbook; China Statistics Press: Beijing, China, 2020.
  47. China Agricultural Yearbook Editorial Committee. China Agricultural Statistical Yearbook; China Statistics Press: Beijing, China, 2018.
  48. Qin, S.; Lü, X. Do large-scale farmers use more pesticides? Empirical evidence from rice farmers in five Chinese provinces. J. Integr. Agric. 2020, 19, 590–599. [Google Scholar] [CrossRef]
  49. Li, B.; Shen, Y. Effects of land transfer quality on the application of organic fertilizer by large-scale farmers in China. Land Use Policy 2021, 100, 105124. [Google Scholar] [CrossRef]
  50. Wei, Z.H.U.; QI, L.; Wang, R. The relationship between farm size and fertilizer use efficiency: Evidence from China. J. Integr. Agric. 2022, 21, 273–281. [Google Scholar] [CrossRef]
  51. Shao, S.; Li, B.; Fan, M.; Yang, L. How does labor transfer affect environmental pollution in rural China? Evidence from a survey. Energy Econ. 2021, 102, 105515. [Google Scholar] [CrossRef]
  52. Hao, Y.; Zhang, Z.Y.; Yang, C.; Wu, H. Does structural labor change affect CO2 emissions? Theoretical and empirical evidence from China. Technol. Forecast. Soc. Change 2021, 171, 120936. [Google Scholar] [CrossRef]
  53. Qian, L.; Lu, H.; Gao, Q.; Lu, H. Household-owned farm machinery vs. outsourced machinery services: The impact of agricultural mechanization on the land leasing behavior of relatively large-scale farmers in China. Land Use Policy 2022, 115, 106008. [Google Scholar] [CrossRef]
  54. Xia, Y.; Kwon, H.; Wander, M. Developing county-level data of nitrogen fertilizer and manure inputs for corn production in the United States. J. Clean. Prod. 2021, 309, 126957. [Google Scholar] [CrossRef]
  55. Kärkkäinen, L.; Lehtonen, H.; Helin, J.; Lintunen, J.; Peltonen-Sainio, P.; Regina, K.; Uusivuori, J.; Packalen, T. Evaluation of policy instruments for supporting greenhouse gas mitigation efforts in agricultural and urban land use. Land Use Policy 2020, 99, 104991. [Google Scholar] [CrossRef]
  56. Kolte, A.; Siggia, D.; Veer, N.; Daryani, A. Critical exploration of Indian economic reforms of 1991: A lesson for developing economies. Int. J. Eng. Adv. Technol. 2019, 8, 490–500. [Google Scholar] [CrossRef]
Figure 1. The mechanisms of the scale of land management on the carbon emissions of the planting industry.
Land 11 00816 g001
Figure 2. Planting carbon emissions of China in 2003, 2008, 2013, and 2018.
Land 11 00816 g002
Table 1. Carbon emission coefficients for each factor of production.
Carbon SourceEmission CoefficientUnitData Reference Source (Basis)
Agricultural fertilizer0.8956Kg CE/kgORNL (Oak Ridge National Laboratory)
Diesel oil0.5927Kg CE/kgIPCC (Intergovernmental Panel on Climate Change)
Pesticide4.9341Kg CE/kgORNL (Oak Ridge National Laboratory)
Plastic film5.1800Kg CE/kgIREEA (Institute of Resource, Ecosystem and Environment of Agriculture)
Irrigation266.48Kg CE/hm2Duan et al. [40]
Table 2. The gas emission types and corresponding emission factors according to food crop.
Carbon SourceExhaust GasEmission CoefficientUnit
Spring wheat,N2O0.4Kg N2O/hm2
Winter wheatN2O1.75Kg N2O/hm2
CornN2O2.532Kg N2O/hm2
Upland riceN2O0.24Kg N2O/hm2
N2O241.0Kg N2O/hm2
Medium rice and double-cropping late riceN2O0.24Kg N2O/hm2
Table 3. Panel unit root test results.
VariableTest MethodAt LevelAt 1st Difference
t-StatisticProb.t-StatisticProb.
LN ACELLC−5.49210.0000−5.49210.0000
IPS−9.12360.0000−9.12360.0000
LN CSLLC−1.91740.0276−8.88130.0000
IPS−3.17270.0008−4.81000.0000
LN NDLLC−5.97980.0000−5.97980.0000
IPS−9.42290.0000−9.42290.0000
LN FPLLC−4.40480.0000−4.40480.0000
IPS−2.36450.0000−2.36450.0000
LN INLLC−7.21050.0000−7.21050.0000
IPS−2.48530.0000−2.48530.0000
Table 4. Threshold effect test results 1: existence test results.
ObjectNumber of ThresholdsF-Statisticp-Value1% Critical Value5% Critical Value10% Critical Value
All regionsSingle32.79 ***0.00011.2099.7007.613
Double5.390.340105.94461.93528.600
Major rice production areasSingle53.82 **0.03069.35543.20134.440
Double44.93 *0.07087.37657.50338.768
Major wheatproduction areasSingle387.88 ***0.00056.00937.17930.080
Double18.120.833184.714106.25857.158
Major corn production areasSingle17.330.54764.38944.14635.612
Double9.790.80044.04031.32327.255
Note: Significance at the 1%, 5% and 10% levels are expressed by ***, **, and *, respectively.
Table 5. Threshold effect test results 2: authenticity test.
ObjectNumber of ThresholdsThreshold Value95% Confidence Interval
All regionsSingle2.444[2.384, 2.493]
Major rice production areasSingle0.896[0.893, 0.914]
Double0.903[0.797, 0.914]
Major wheat production areasSingle0.594[0.551, 2.473]
Table 6. Threshold effect regression results.
VariablesAll RegionsMajor Rice Production AreasMajor Wheat Production Areas
LNAR ( q i t < γ 1 ) 0.122 (0.58)1.459 *** (3.91)1.205 *** (23.57)
LNAR ( q i t γ 1 ) −0.490 *** (−2.26) −0.100 ** (−2.28)
LNAR ( γ 1 < q i t γ 2 ) 2.345 *** (6.36)
LNAR ( q i t > γ 2 ) 0.915 ** (2.37)
LNCS0.605 *** (4.14)0.418 *** (3.72)−0.007 * (−2.09)
LNND−0.427 *** (−2.94)−0.472 *** (−4.04)0.291 *** (4.13)
LNFP0.170 ** (2.26)−0.587 (−0.95)0.064 *** (−2.71)
LNIN−0.654 (−0.66)−2.537 *** (−3.43)4.461 *** (13.69)
Constant0.8680.9950.992
R20.8740.9950.993
Note: Significance at the 1%, 5% and 10% levels are expressed by ***, **, and *, respectively.
Publisher’s Note: MDPI stays neutral with regard to jurisdictional claims in published maps and institutional affiliations.

