Article

The Impact of Human Activities on Net Primary Productivity in a Grassland Open-Pit Mine: The Case Study of the Shengli Mining Area in Inner Mongolia, China

1
State Key Laboratory of Coal Resources and Safe Mining, China University of Mining and Technology-Beijing, Beijing 100083, China
2
College of Geoscience and Surveying Engineering, China University of Mining and Technology-Beijing, Beijing 100083, China
*
Author to whom correspondence should be addressed.
Land 2022, 11(5), 743; https://doi.org/10.3390/land11050743
Submission received: 27 March 2022 / Revised: 30 April 2022 / Accepted: 16 May 2022 / Published: 18 May 2022
(This article belongs to the Section Land Systems and Global Change)

Abstract

:
In grassland open-pit mining areas, net primary productivity (NPP) is mainly affected by climate conditions and human activities. The identification and assessment of the influence of human activities on NPP is important for mining production and the implementation of ecological restoration. In this study, we explored the influence of human activities on the NPP in the Shengli mining area in Inner Mongolia, China by using the Carnegie–Ames–Stanford Approach (CASA) model and the Chikugo model, in which a calibration method was applied. An analysis of four representative years showed that the proportion of NPP induced by human activities reached 56.2%, that the percentage of pixels with an inhibitory effect on NPP was 99% in 2011 with the highest intensity of mining activity, and that these two values decreased to 11.9% and 69% in 2020, respectively, with the steady implementation of ecological restoration. Moreover, from the analysis of global and local spatial correlation, mining activities and ecological restoration aggravated and weakened the aggregation of NPP induced by human activities, respectively.

1. Introduction

On the one hand, the development of mineral resources has promoted the economic development of mining areas and has met energy needs. On the other hand, mining activities have altered soil properties and hydrological balance, disturbing local ecosystems, which has led to a decline or even a loss of carbon sequestration capacity in mining areas [1,2]. It is important to obtain accurate data related to carbon sinks for planning mining activities and ecological restoration in mining areas.
The net primary productivity (NPP) of vegetation refers to the total amount of organic matter produced by plants per unit time and unit area through photosynthesis minus the amount consumed by autotrophic respiration [3,4,5]. By reflecting the efficiency of plants in fixing and converting photosynthates, NPP is an important constituent of the surface carbon cycle, and also serves as a main factor in judging ecosystem carbon sinks [6]. NPP has attracted increased scientific attention and has been widely used to indicate carbon sinks of different scales, different periods, and different ecosystems [7,8]. For example, Field et al. [9] modeled global NPP with reasonably high temporal and spatial resolution by combining ecological principles with satellite data. Chen [10] provided 1 km raster data that described the monthly NPP in China’s terrestrial ecosystems north of 18° N, from 1985 to 2015. NPP spatiotemporal datasets in the Tibetan Plateau from 1982 to 2006 and in the Sanjiangyuan from 1985 to 2015 were produced by Zhou [11] and Didan et al. [12], respectively. In addition, a series of investigations on the NPP of forest [13,14], grassland [15,16,17], urban [18,19], and wetland ecosystems [20,21] have been undertaken with notable research achievements. In recent years, research on NPP in mining areas has also attracted more and more attention [2,5,22,23].
Dynamic changes in NPP are influenced by multiple factors such as topographic conditions, vegetation types, climatic factors, and human activities [24]. However, spatiotemporal variations in NPP are more sensitive to disturbances due to human activities and changes in climate [25]. Nemani et al. [26] utilized 18 years of data to investigate global vegetation responses to climatic changes, and revealed that the NPP increased 6% globally with global changes in climate and the greatest increases were in tropical ecosystems mainly due to an increase in solar radiation and a decrease in cloud cover. Wang et al. [27] analyzed MODIS and climate data to construct correlations between climatic variables and NPP, and reported that temperature and precipitation were the two main climatic variables with different influences on NPP in different regions and different seasons. Liu et al. [28] found a gradual improvement in NPP in the Shanxi-Gansu-Ningxia Region due to the ”Grain for Green” policy and other relevant policies formulated by the state. Yang et al. [25] mainly attributed a decrease in the NPP of research areas to an increase in construction and urban land areas and a decrease in cultivated land areas. In mining areas, human activities characterized by mining and ecological restoration have a complex influence on variations in NPP. Therefore, it is important to conduct studies that identify and quantify the influence of human activities on NPP variations, which can be helpful for the design and implementation of ecosystem restoration projects in mining areas [2,5].
Human appropriation of net primary production (HANPP) has been used as an indicator to measure the impact of human activities [29,30,31]. With the development of remote sensing technology and models for different ecological processes, potential NPP and actual NPP can both be calculated to simulate climate-induced production and combined-induced production, respectively [28,32]. The difference between potential NPP and actual NPP indicates the effects of human factors. Using the abovementioned method, Ugbaje et al. [33] quantified the influences of climate variability and human activities on the spatiotemporal variability of NPP in Africa; Yang et al. [34] assessed the relative roles of human activities and climate variations on grassland and concluded that the restored grassland areas influenced by climate variations and the degraded areas affected by human activities were 83.9%, 85.1%, 6.7% and 65%, 79.1%, 11.6% in Mongolia, Pakistan, and Uzbekistan, respectively; Wang et al. [27] distinguished the roles of human activities and climate changes in NPP dynamics and quantified the effects of these two factors in the Jinghe River Basin in the Loess Plateau.
Research on the temporal and spatial changes of NPP in mining areas has been conducted by scholars [35,36]. It is important to identify and assess the influence of human activities on NPP in mining areas that are characterized by mining and ecological restoration. However, there are no studies in the literature using the abovementioned method to study the relative roles of climate conditions and human activities. Therefore, in this paper, we aim to explore NPP changes and to analyze the effects of human activities on NPP in a grassland open-pit mining area, considering the existence of a large number of coal mines of this type in northern China. Specifically, the Shengli mining area in Xilinhot City, China was selected as a case study. The actual NPP, namely the combined-induced production, is computed using the Carnegie–Ames–Stanford Approach (CASA) model, and the potential NPP induced by climate is simulated using the Chikugo model. Since the research area was a relatively small region located in a grassland open-pit mining area, the potential NPP estimated by the Chikugo model (a climate-driven model suitable for grassland ecosystem) could introduce redundancy errors, therefore, a contrast area was selected to conduct a calibration in the process of calculating the NPP induced by human activities. Then, a comprehensive analysis of the impact of human activities on NPP was conducted in the research area, which could provide basic data and reference information for planning mining activities and ecological restoration in mining areas.

2. Materials and Methods

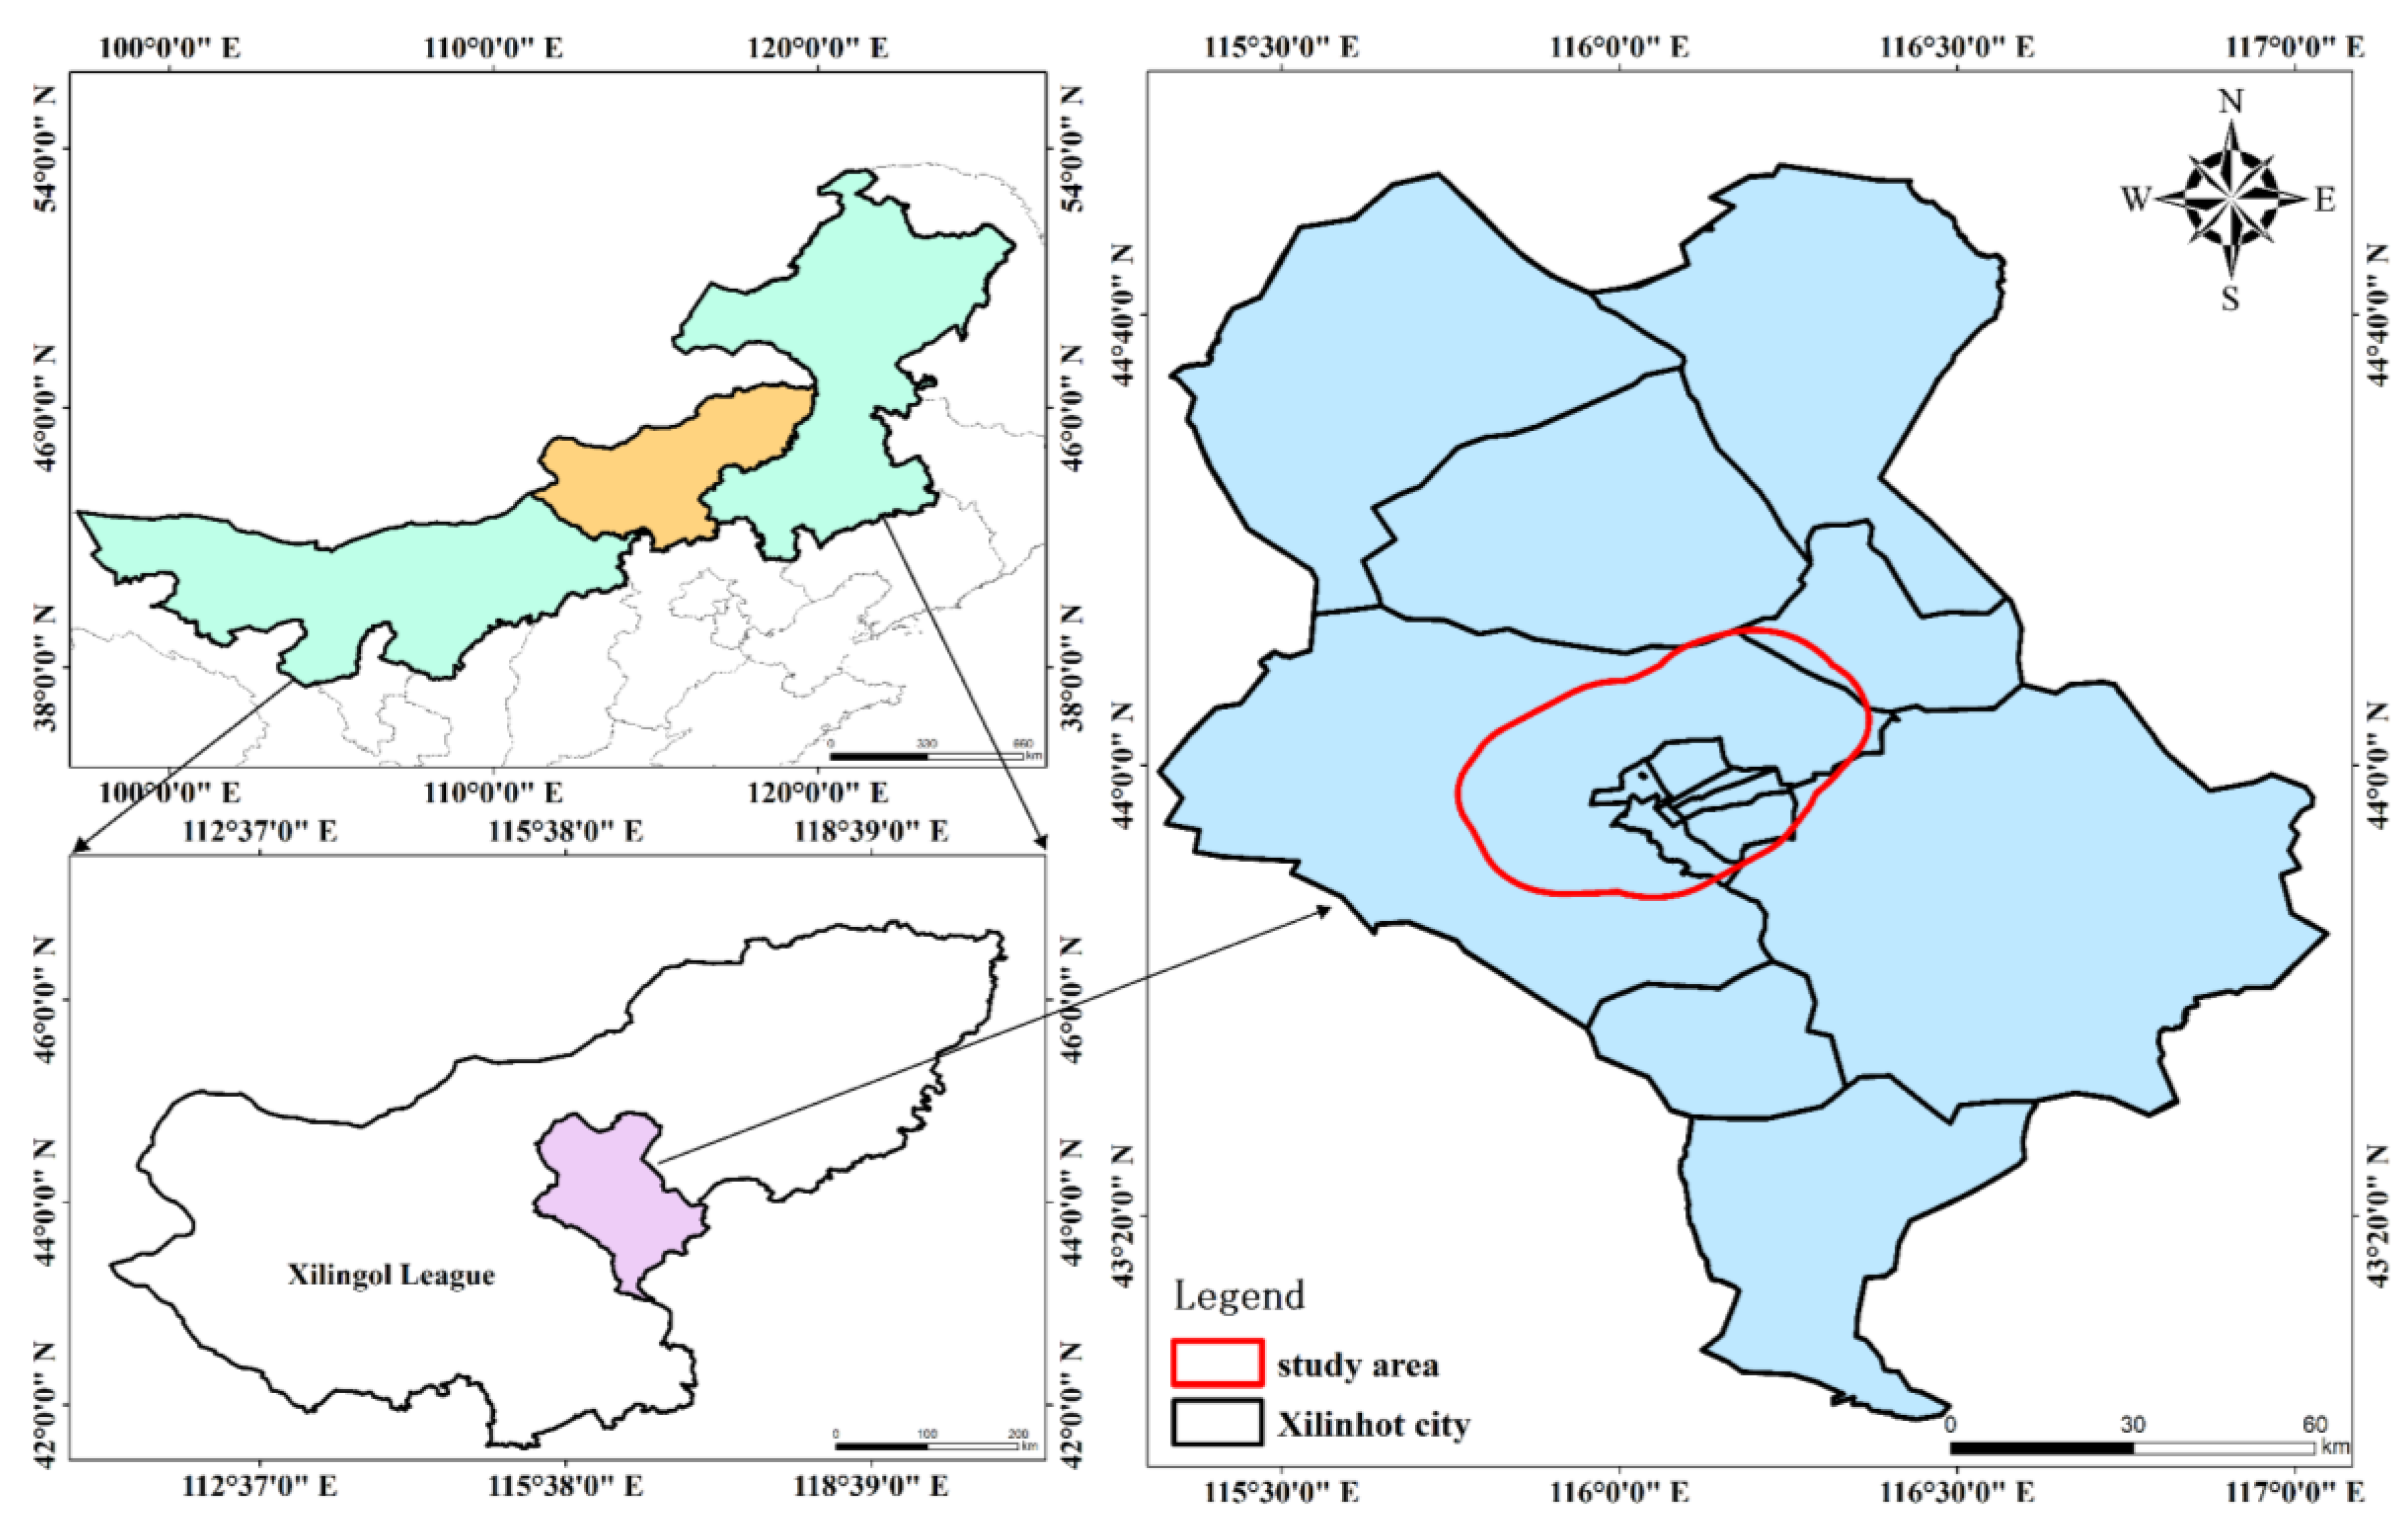
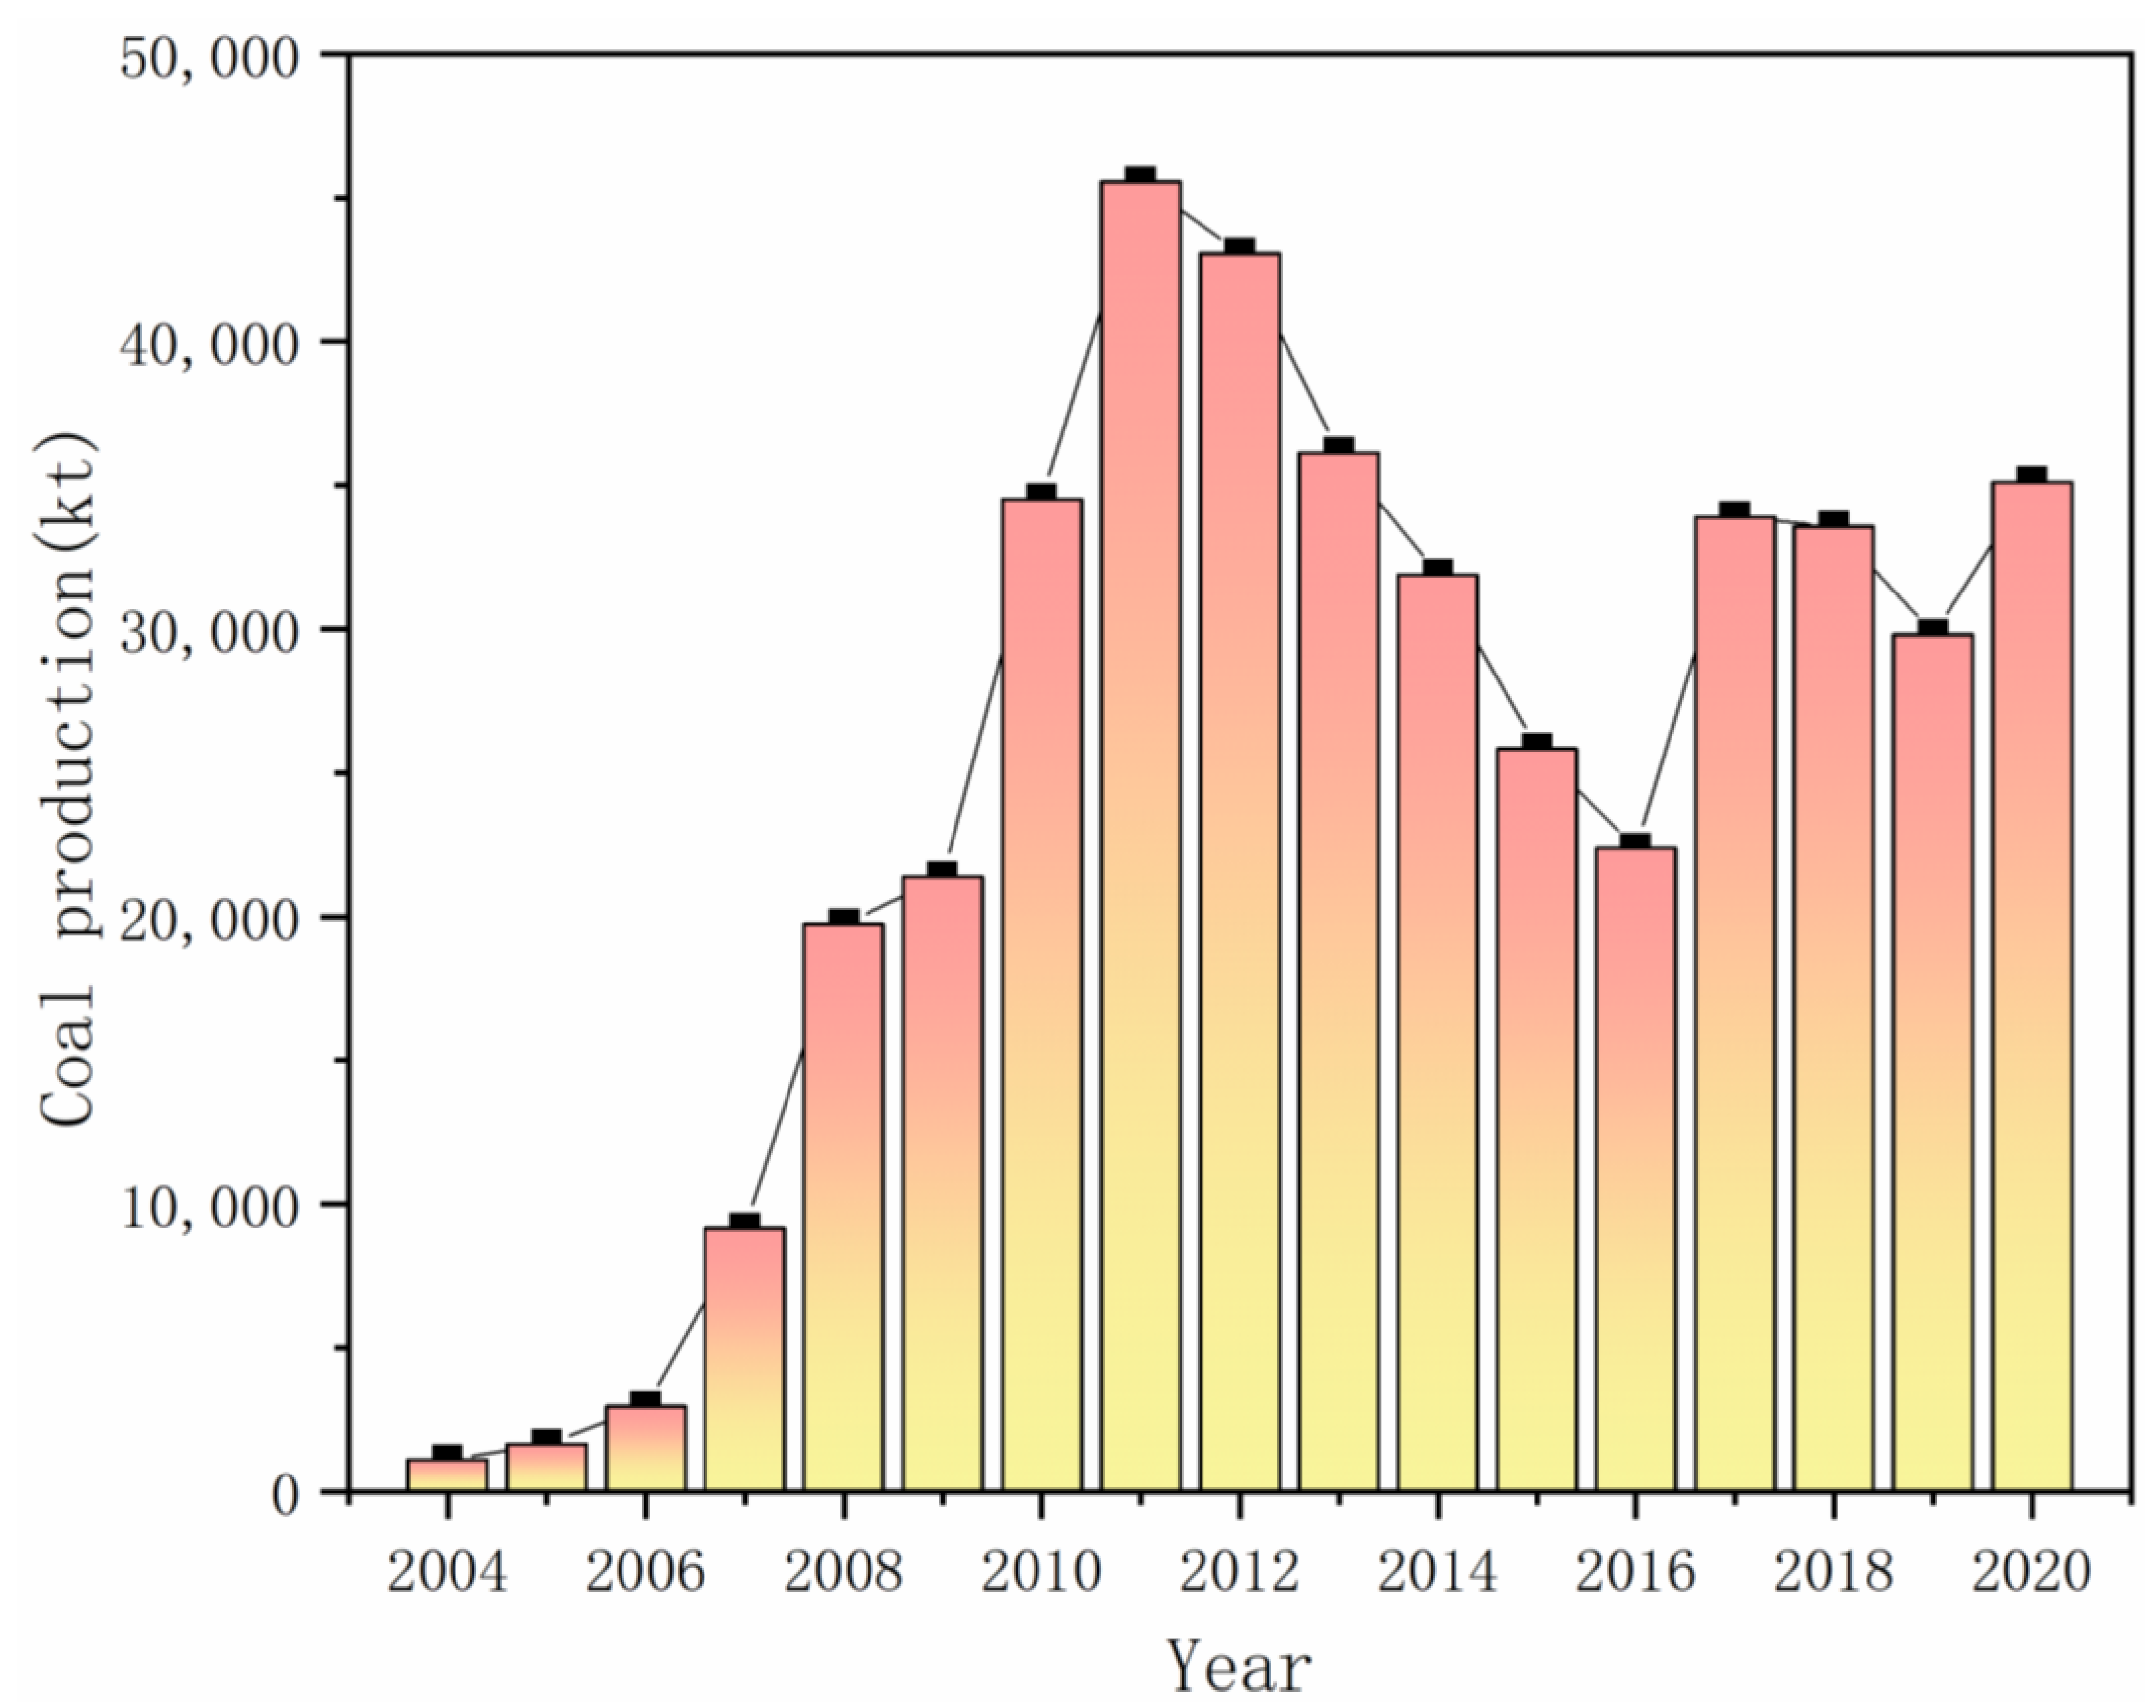
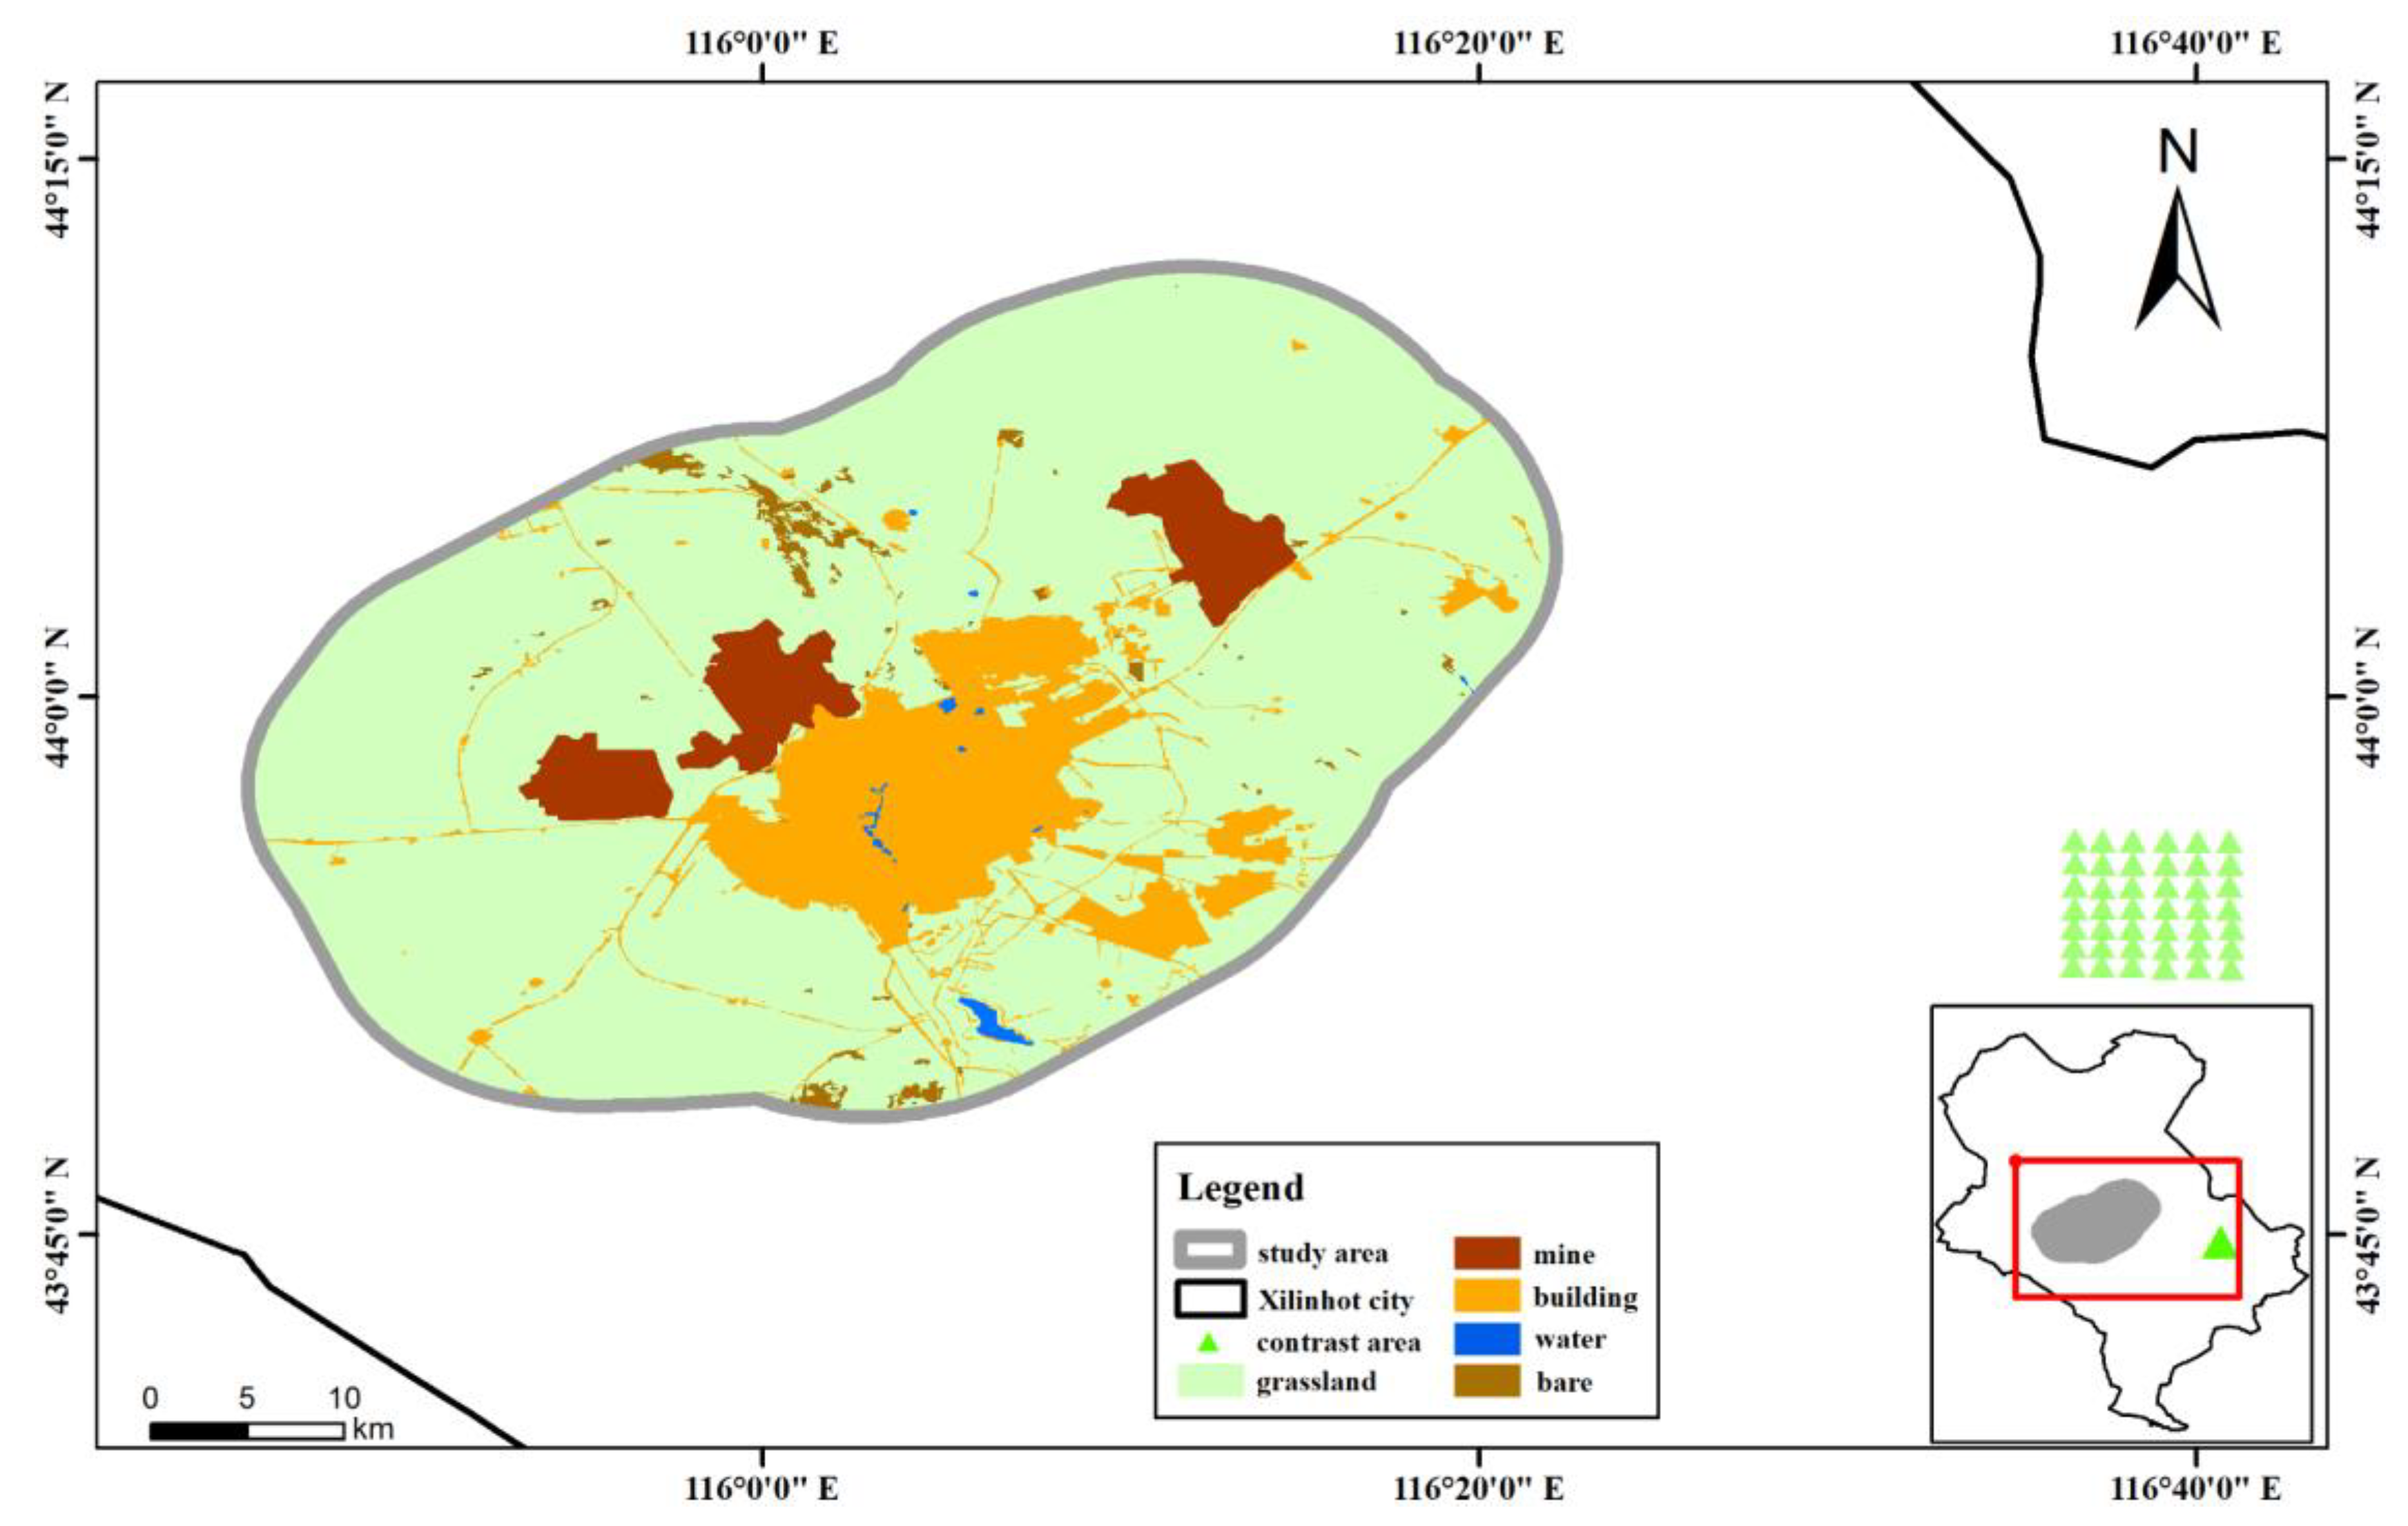
2.1. Study Area and Data Collection

The Shengli mining area was selected as the research area, which is located in the city of Xilinhot, Xilin Gol League, in the Inner Mongolia Autonomous Region, China. The research area is shown in Figure 1, which covers the zones between longitude 115.7° E–116.3° E and latitude 43.8° N–44.2° N. It is a typical grassland open-pit coal mine, which belongs to the continental semi-arid climate region in the northern temperate zone, with cold winters and hot summers [37]. The average annual rainfall is 309 mm and the average annual temperature is 1.5 °C. The extreme maximum and minimum temperatures, in the research area, were recorded as 38.3 °C on 23 July 1955 and −42.4 °C on 15 January 1953, respectively. Rainfall is mainly concentrated in summer, more than 71% of which happens between June and August. The ranges of the annual evaporation, annual net solar radiation, and annual sunshine hours are 1500–2700 mm, 4600–7000 MJ/m2, and 2800–3200 h, respectively. According to the land use classification, the research area includes mainly grassland, bare land, mining, and city land.
In the grassland open-pit coal mine, mining activities have become the most important human factor affecting NPP in the research area. The data of the annual coal production were collected from the Xilinhot Mining Company and are shown in Figure 2. It can be seen that the mine has been in production since about 2005 and coal production continued to increase, reaching its peak annual production in 2011, and then declined year by year until 2016, since the continuous implementation of policies such as ecological restoration. Since 2017, the mine has maintained a relatively stable annual coal production. The annual coal production represents the intensity of the mining activities. Thus, four representative years, i.e., 2006, 2011, 2016, and 2020, were selected to study the NPP of the mining area. The Google Earth Engine (GEE) [38] was used to collect the remote sensing images of the Landsat series satellite with a spatial resolution of 30 m, and the relevant meteorological data were derived from the China Meteorological data network http://data.cma.cn/ (accessed on 10 May 2022).

2.2. The CASA Model and the Chikugo Model

Monteith [39] first proposed the concept of estimating NPP according to light energy use and photosynthetically active radiation (APAR) based on the principle of light energy use. Then, Potter et al. [40] realized the estimation of regional and global NPP using the above principle based on remote sensing data, and proposed the Carnegie–Ames–Stanford Approach (CASA) model, which is the most widely used model in remote sensing retrieval research on NPP. The NPP calculated by using the CASA model can reflect the influence of human activities and climate conditions on NPP and is considered to be the actual NPP such as in the literature [27,33,34]. The main equation of the CASA model is as follows:
NPP ( x , t ) = APAR ( x , t ) × ε ( x , t )
where ε ( x , t ) is the actual light energy utilization rate for the pixel x in month t, unit in gC / MJ ; APAR ( x , t ) denotes the absorbed photosynthetically active radiation by pixel x in month t, unit in gC / ( m 2 month ) . It depends on the characteristics of vegetation itself and the total solar radiation, and can be calculated using the following formula:
APAR ( x , t ) = SOL ( x , t ) × 0.5 × FPAR ( x , t )
where SOL ( x , t ) represents the total solar radiation in pixel x in month t, unit in MJ / m 2 . The constant 0.5 indicates the proportion of effective solar radiation (0.38–0.71 um) that can be utilized by vegetation. FPAR ( x , t ) denotes the fractional photosynthetically active radiation that can be expressed as follows:
FPAR = ( NDVI ( x , t ) NDVI min ) ( FPAR max FPAR min ) NDVI max NDVI min + FPAR min
where NDVI ( x , t ) is the normalized difference vegetation index in pixel x in month t. NDVI max and NDVI min are the maximum and minimum values of NDVI in the research area. FPAR max and FPAR min are constants of 0.95 and 0.01, respectively.
The actual light energy utilization rate ε ( x , t ) is mainly affected by moisture and temperature [40] and can be calculated as follows:
ε ( x , t ) = T ε 1 ( x , t ) × T ε 2 ( x , t ) × W ε ( x , t ) × ε max
where T ε 1 ( x , t ) and T ε 2 ( x , t ) represent the temperature stress coefficients at low and high temperatures; W ε ( x , t ) denotes the water stress coefficient; and ε max refers to the maximum light energy utilization rate of vegetation under ideal conditions, which equals 0.389 gC MJ−1.
The Chikugo model [41], an exclusively climate-driven model, has been utilized to estimate the potential NPP that is affected only by meteorological factors. This model is one of the three most commonly used NPP statistical models. It has been proven to have the smallest standard deviation in simulating the NPP of the grassland in China [42]. The Chikugo model takes the NPP as a function of net radiation and the radiation drought index, which represents the effect of solar radiation on temperature and evapotranspiration as follows:
NPP = 0.29 × e 0.216 RDI × R n × 0.45
where RDI represents the radiation dryness and Rn denotes the net radiation. These two parameters can be calculated using the following formulas:
RDI = ( 0.629 + 0.237 × PER 0.0031 × PER 2 ) 2
R n = RDI × L × P
where PER is the potential evapotranspiration, L and P are the evaporation latent heat and the annual precipitation, respectively.

2.3. Calibration Method

It should be noted that the research area is a grassland open-pit mine, which has certain differences as compared with a grassland ecosystem. The Chikugo model is suitable for grassland ecosystems and could introduce redundancy errors in the research area. Therefore, a contrast area was selected when using the above two models to estimate the actual NPP and potential NPP in the research area for the experimental years. Based on the land use classification from 2006 to 2020, the contrast area should be grassland without surrounding roads, cultivated land, and other human activities. Figure 3 shows the selected contrast area which is far from the impact of the Shengli mines, i.e., about 40 km from the center of the mining area, about 47.4 m2 in area, and also has a north temperate continental semi-arid climate with the same latitude as the research area. Thus, the NPP in the contrast area is considered to be only affected by climatic factors. In this case, the potential NPP estimated by the Chikugo model in the contrast area should be close to the actual NPP calculated by the CASA model.
The differences between the potential and actual NPP for each pixel in the experimental years were calculated in the contrast area using the following formula:
NPP d i f f ( i , t ) = NPP a ( i , t ) NPP p ( i , t )
where NPPa and NPPp denote the actual NPP calculated by the CASA model and potential NPP estimated by the Chikugo model, respectively, i refers to the pixel i in the contrast area, and t is the corresponding year.
In Figure 4, the NPP differences of the four study years in the contrast area are shown in the form of boxplots, which are used to explore the statistical characteristics of the NPP differences. The characteristic values marked in the boxplots are the Q1, Q2, Q3, and the upper/lower bounds. Q1 and Q3 represent the first and third quartiles that are located at the bottom and top of the box, the second quartile (Q2) refers to the median that is located inside the box; the upper and lower bounds are located at Q1 − 1.5 (IQR) and Q3 + 1.5 (IQR), respectively. IQR is the interquartile range, defined as the difference between the Q3 and the Q1, and reflects the discreteness of a set of data.
It can be seen that the characteristic values in 2011 are all relatively greater than those in the other three years. On the one hand, this indicates that the NPP differences between the potential and actual NPP in the contrast area have different distributions in the four study years. Specifically, the characteristic values of the Q1 are 30.6, 34.2, 16.5, and 21.2 gC/m2 for the four experimental years, respectively. On the other hand, it can be observed that the length of the box and the range of the bounds are small for each year, indicating a relatively stable distribution of the NPP differences. The values of the IQR are 6.4, 6.5, 9.2, and 9.6 gC/m2 for the four years, 2006, 2011, 2016, and 2020, respectively. Therefore, the median values of the NPP differences in each year are selected as the calibration values for the Chikugo model estimating the potential NPP in the corresponding year, i.e., 33.8 gC/m2 for 2006, 37.4 gC/m2 for 2011, 21.5 gC/m2 for 2016, and 26.2 gC/m2 for 2020, respectively.
In the research area, the influence of human activities on NPP is obtained after calibrating the potential NPP estimated by the Chikugo model, and the formulas are expressed as follows:
NPP p c = NPP p + c a l i
NPP h = NPP p c NPP a
where NPP p c refers to the calibrated potential NPP, NPP h denotes human activities induced NPP, and cali represents the calibration values in experimental years.

2.4. Statistical Method
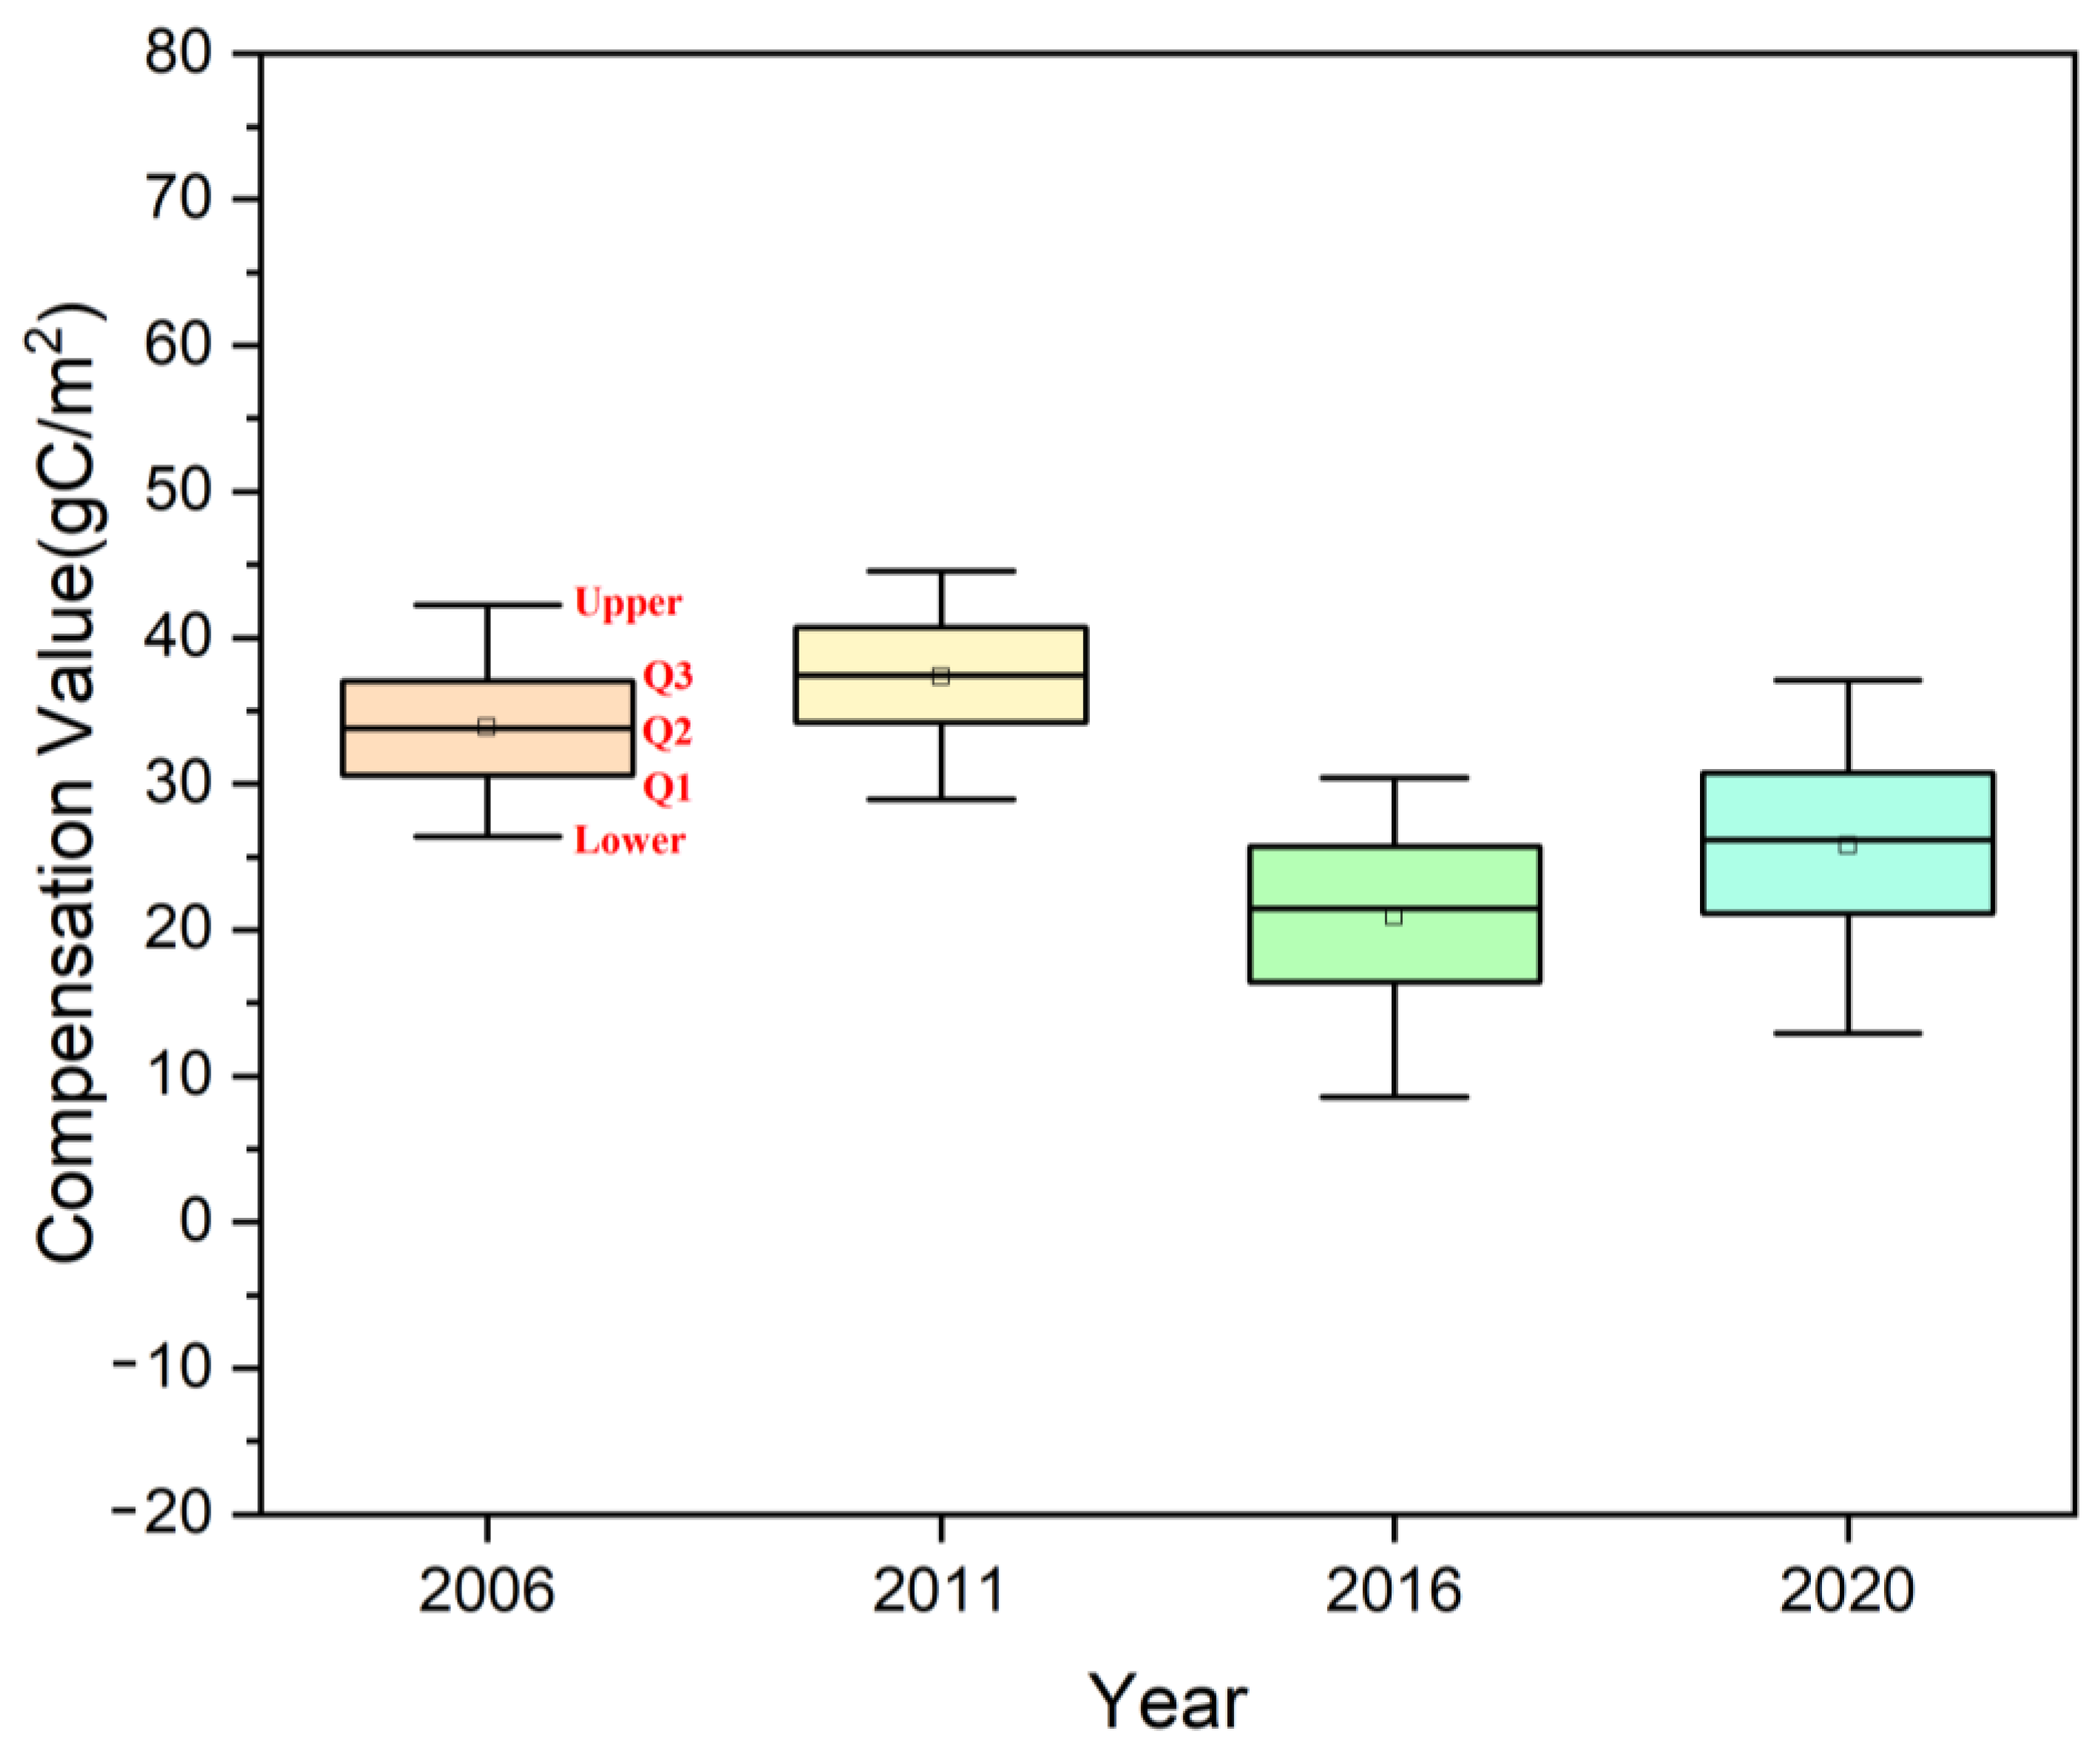
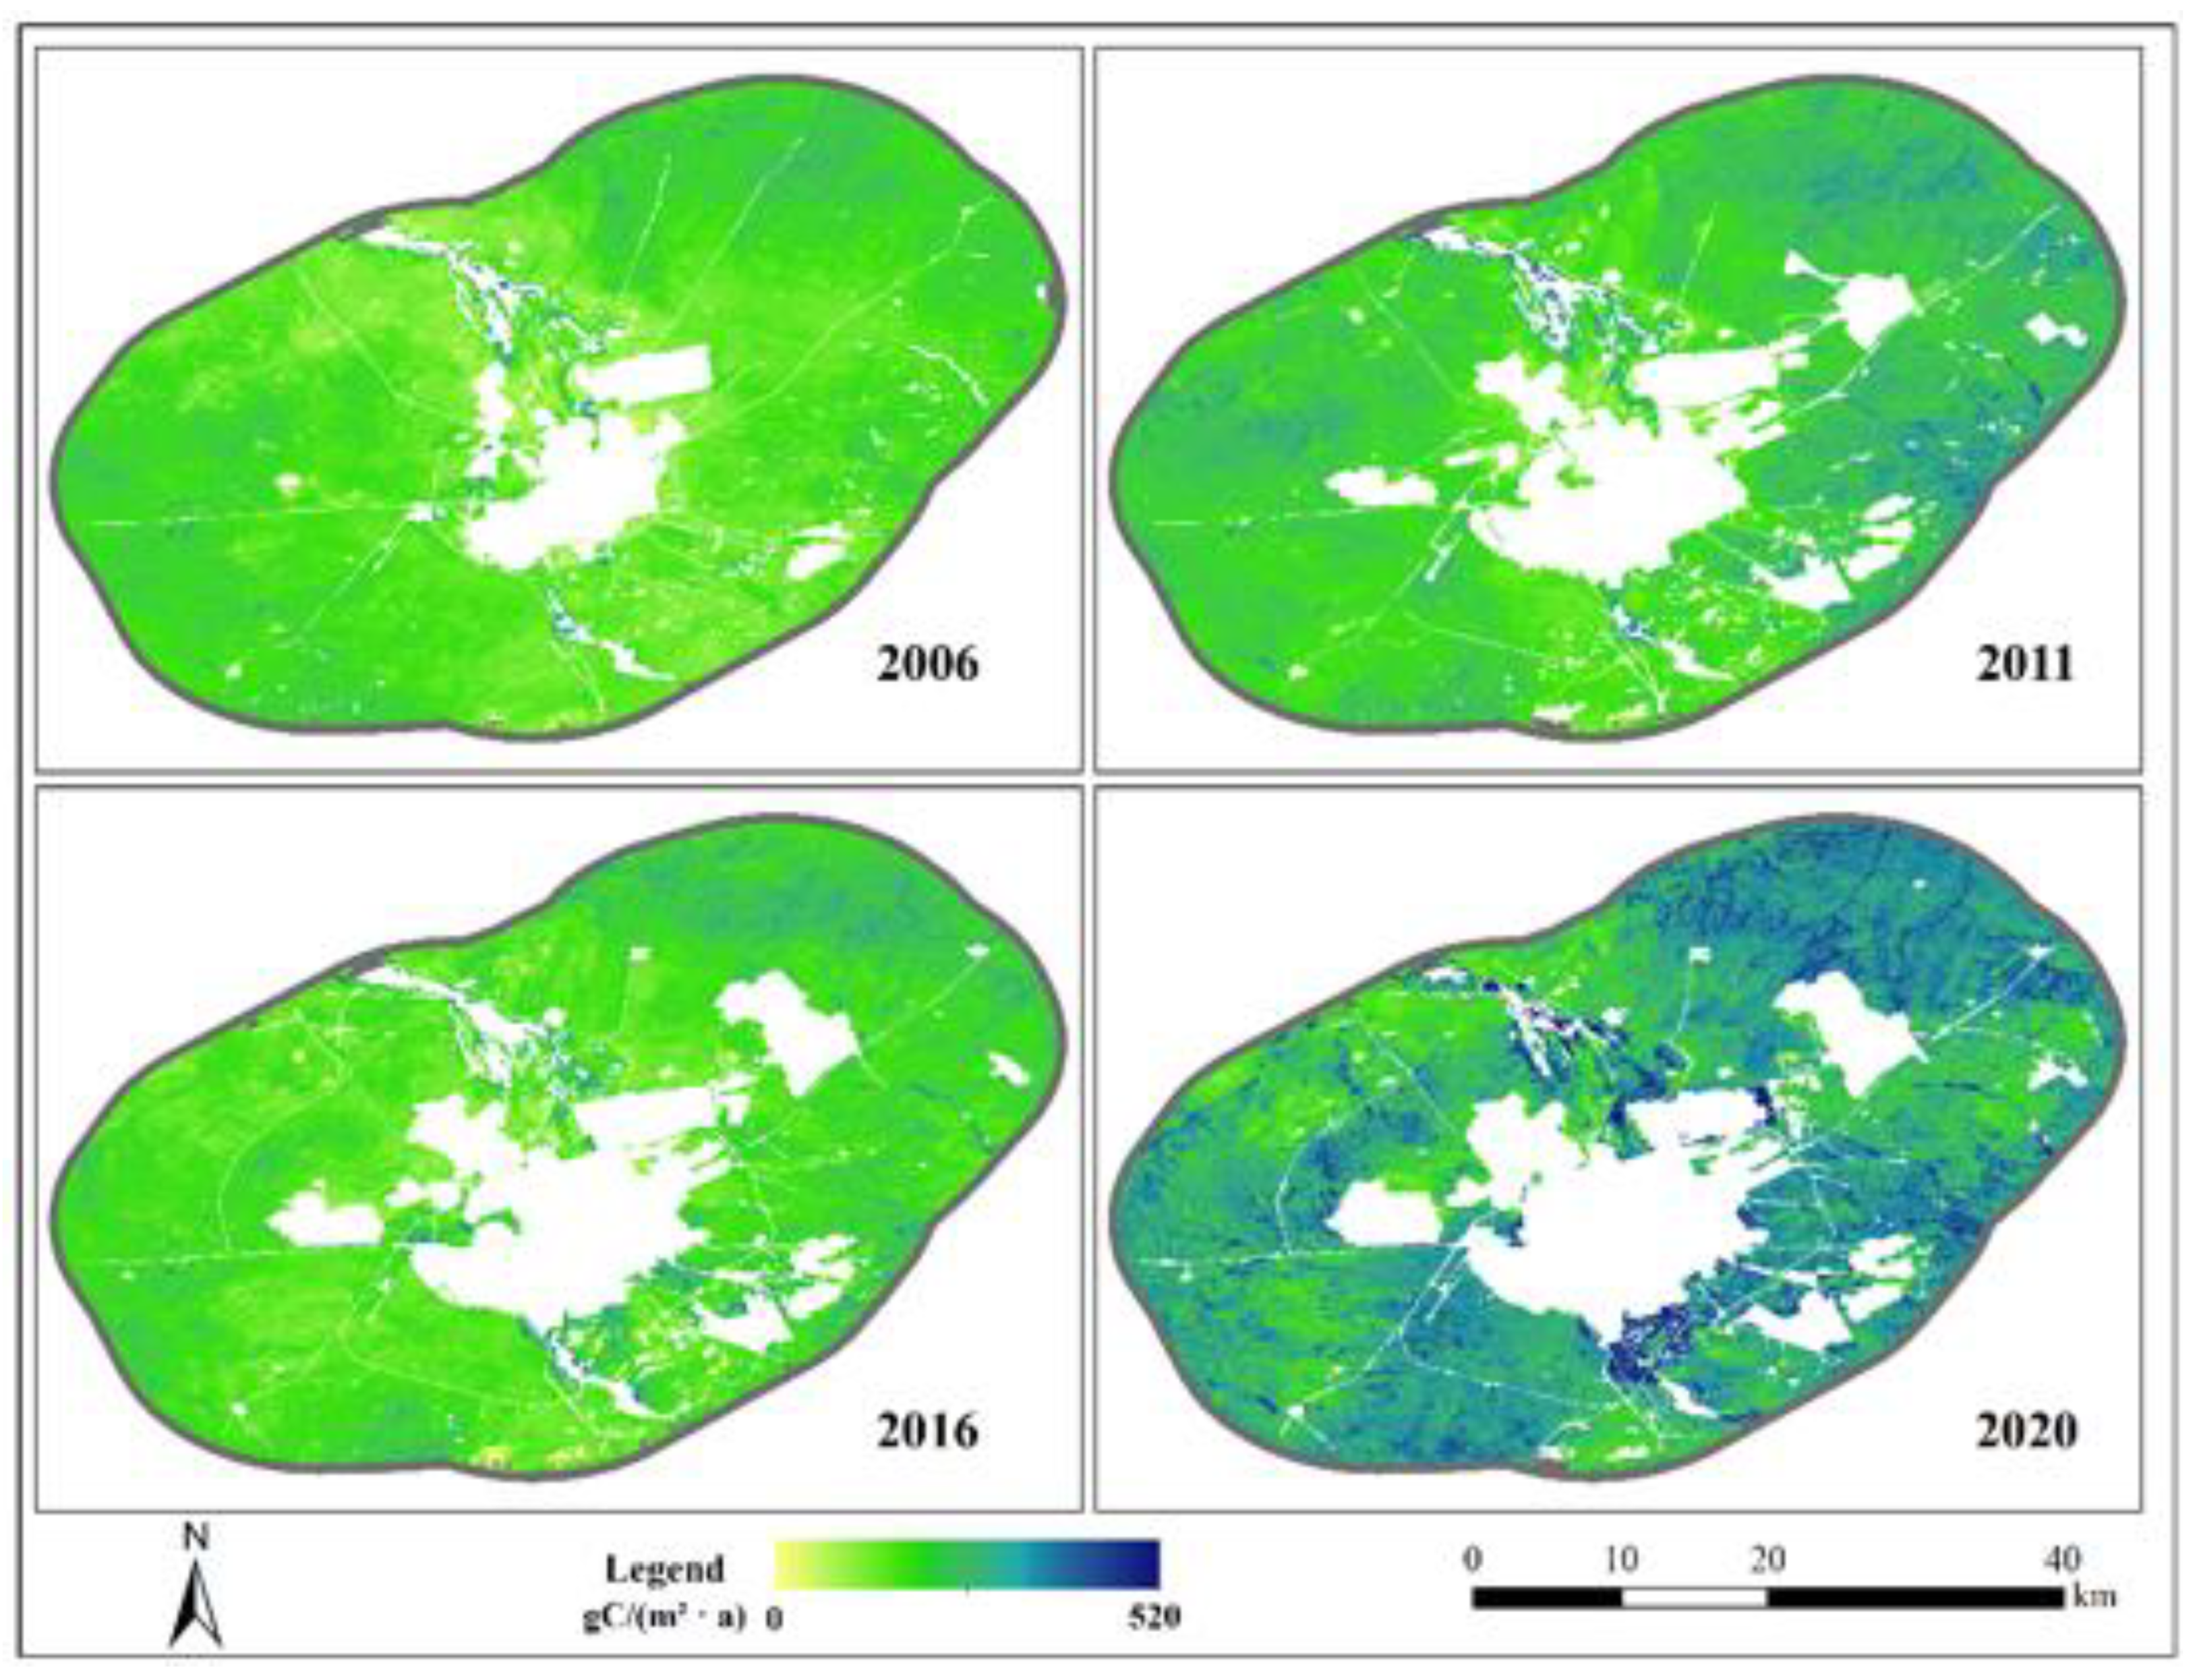
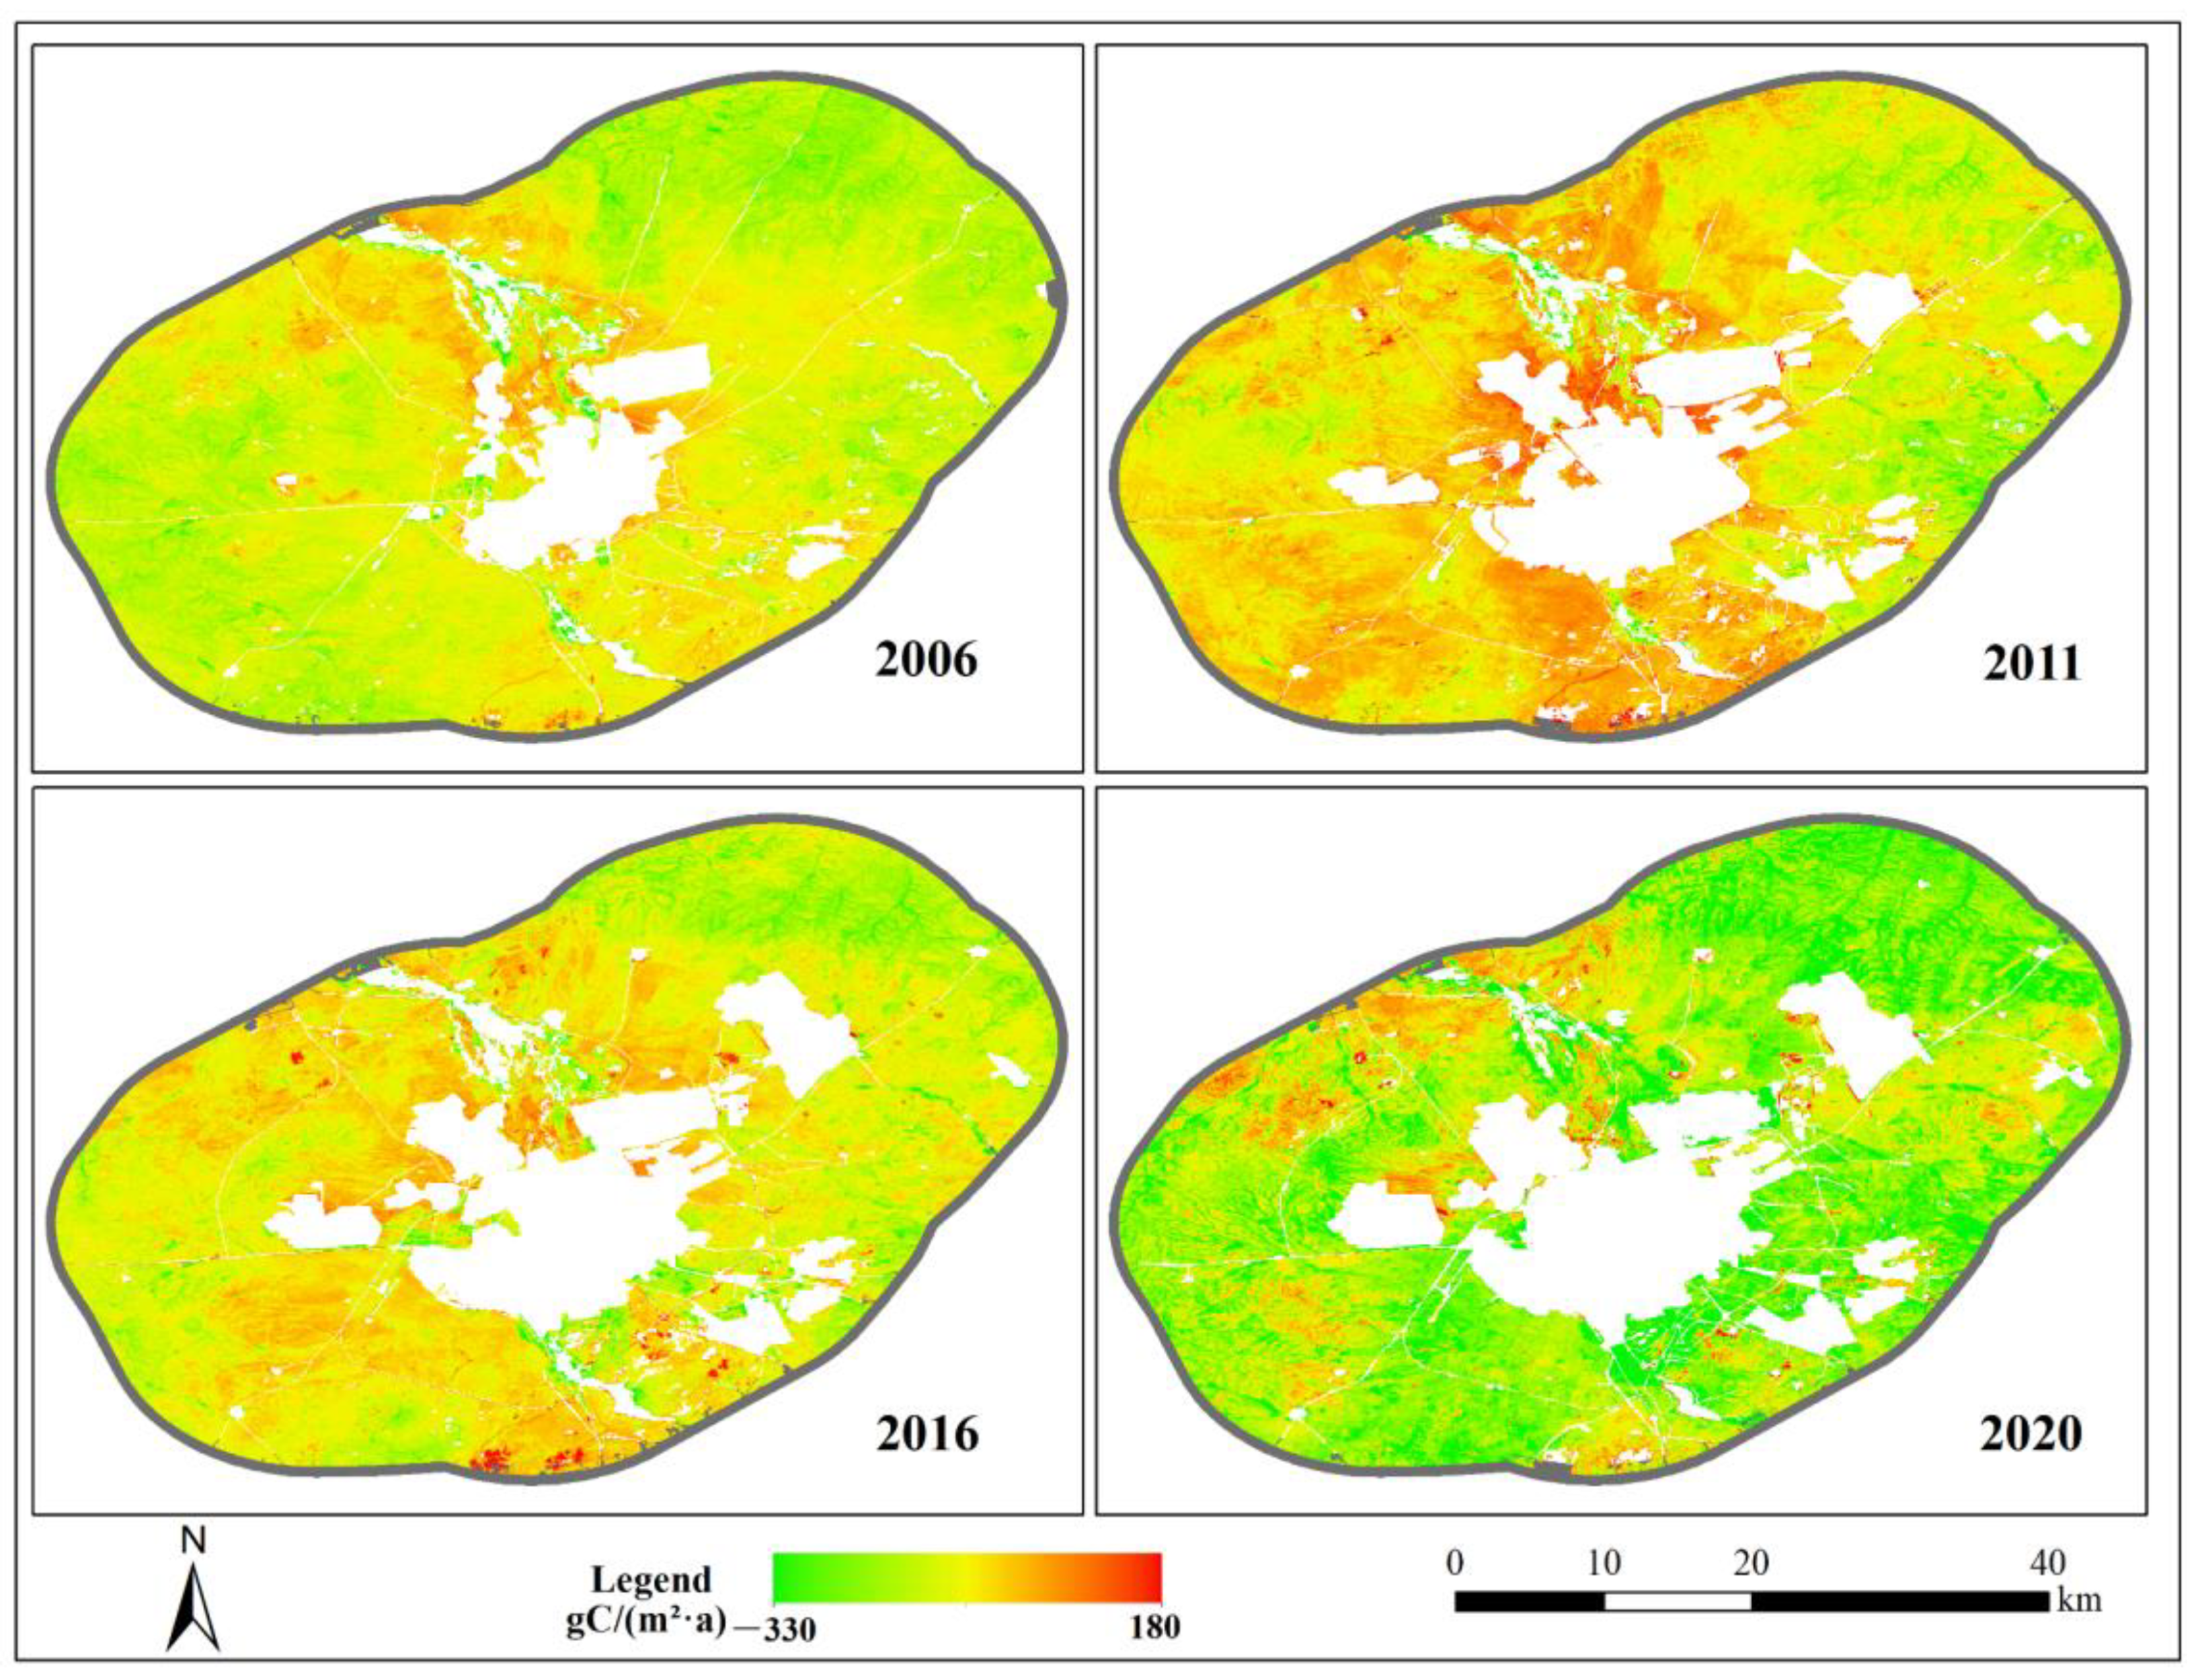
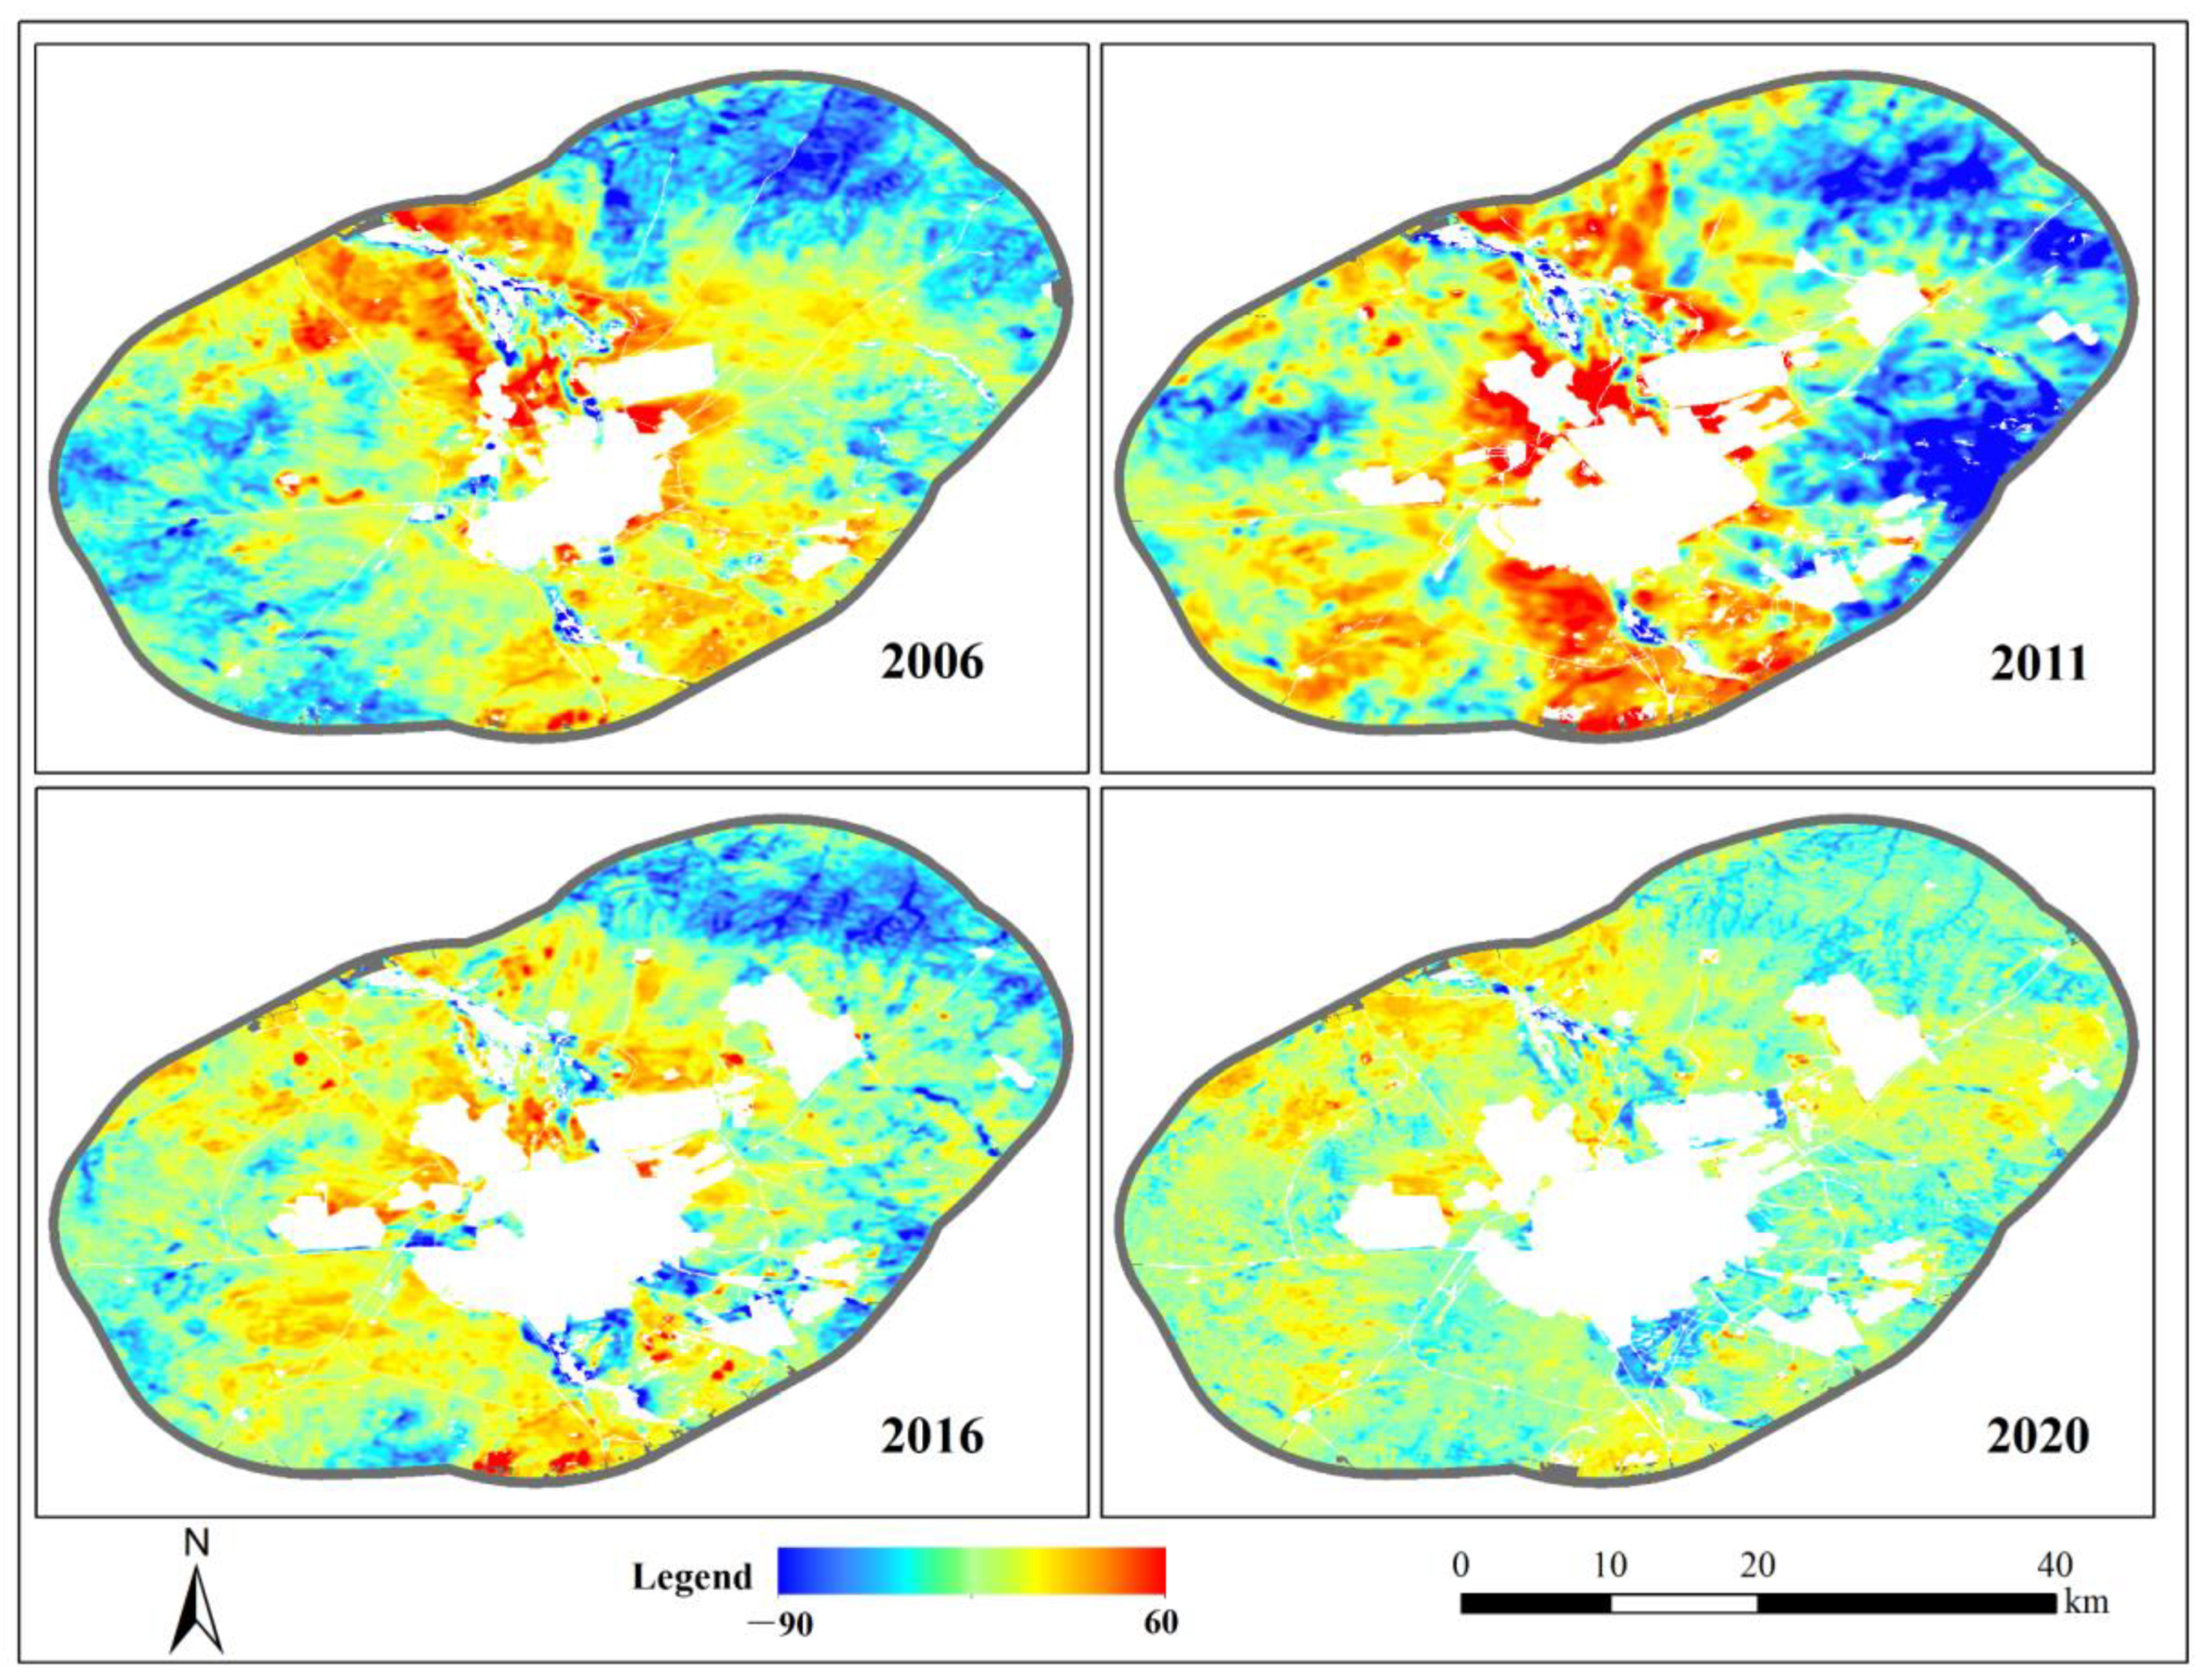
The global Moran’s I and Getis-Ord Gi* were selected as the statistical values to explore the spatial correlation and the aggregation degree of the impact of human activities on NPP in the research area. The global Moran’s I has been widely used in the field of geographic information science to measure how closely clustered different features are in a certain area. It ranges between −1 and +1 and is described in detail in the relevant literature [43]. The formula is as follows:
I = N i = 1 N j 1 N C i j ( x i x ¯ ) ( x j x ¯ ) i = 1 N ( x i x ¯ ) 2 i = 1 N j = 1 N C i j
where N refer to the total number of pixels; x i and x j are the attribute values of pixel i and j, respectively; C i j represents the spatial adjacency matrix of pixel i and j; and C i j = 1 when these two pixels are adjacent.
The Getis-Ord Gi* takes distance as the measure to identify and calculate the spatial distribution of high-value clusters and low-value clusters at different spatial locations, namely hot spots and cold spots [44]. The formula is as follows:
G ( d ) = i = 1 N j = 1 N W i j ( d ) x i x j i = 1 N j = 1 N x i x j
where d denotes the distance, W i j ( d ) represents the distance weight between pixel i and j, and the other parameters are the same as those in Equation (11). Then, the G coefficient is normalized by the following formula:
Z ( G ) = ( G ( d ) E ( G ( d ) ) ) V a r ( G ( d ) )
where E ( G ( d ) ) and V a r ( G ( d ) ) denote its expectation and variance, respectively.

3. Results

The NPP values calculated by the CASA model and shown in Figure 5 illustrate the spatial distribution of the actual NPP in the research area in the experimental years. It can be seen from the overall distribution that the NPP in 2020 is the highest, followed by 2011, 2016, and 2006. This does not match the order of mining intensity in the experimental years, especially the NPP in 2011 with the highest mining production, which is greater than both that in 2006 at the beginning of mining and that in 2016 with a valley value of mining production. The summer means of temperature/precipitation are 21.3 °C/48.3 mm, 21.5 °C/87.6 mm, 22.7 °C/52.4 mm, and 20.6 °C/101.3 mm for the four years, respectively. It shows that the interannual difference of the mean temperature is relatively small, while the mean precipitation appears as an obvious interannual difference in the relatively small grassland open-pit mine. The variations in the actual NPP are consistent with the changes in the mean precipitation, indicating the importance of climatic factors for NPP in grassland open-pit mining areas.
The statistical results of the actual NPP including maximum, minimum, and mean values of all pixels in the research area in the corresponding years are listed in Table 1. It can be observed that the minimum NPP value for each year in the research area is stable at around 0.5 gC/m2 year, and the maximum NPP value reaches 511 gC/m2 year in 2020. Note that the maximum value in 2011 is 351 gC/m2 year, which is smaller than that in 2016, but its mean value still reaches 116 gC/m2 year, achieving a 19% improvement as compared with that in 2016. The mean NPP value in each year shows the same trend as that in Figure 5. It is difficult to show the characteristics of NPP and its variations in the grassland open-pit mine. Thus, a more detailed study on the impact of human activities on NPP is necessary in the selected research area.
The NPP induced by human activities was calculated for each study year based on the proposed calibration method. The spatial distributions of NPP induced by human activities in the experimental years are shown in Figure 6. A value of NPPh greater than zero indicates that human activities have an inhibitory effect on NPP in the research area, and the greater the value, the more serious the inhibitory effect. While a value of NPPh less than zero indicates that human activities promote NPP in the research area, and the larger the absolute value, the stronger the promotion of NPP. Figure 6 shows that the impact of human activities on NPP had an inhibitory effect in the research area as a whole in the initial period of mining in 2006, that the highest mining intensity was in 2011, and that the valley value of coal production was in 2016. Specifically, the percentages of pixels with NPPh greater than zero in the research area are 98%, 99%, and 97% for the first three years (2006, 2011, and 2016), respectively. For 2020, the impact of human activities appears to have a promotion effect on NPP in the research area as a whole, and the percentage of pixel with NPPh less than zero reaches 31%. From 2006 to 2011, with the expansion of the mining area and city, a surge in coal production, and the quarrying activities in the southern area, the inhibitory effect of human activities on NPP in the research area increased significantly in the corresponding areas. From 2011 to 2016, with a continuous reduction in coal production and steady implementation of the ecological restoration polices, the inhibitory effect of human activities on NPP in the research area appears to be an obvious weakening phenomenon, for example, in the northeast of the research area. In 2020, the mining area has stable coal production and the ecological restoration projects have been completed, for example, the reclamation of the dump and artificial vegetation planting near the open pit have been completed and the forest park in the southern of the city has been constructed with a green area of 2.52 km2. Thus, the promotion of NPP by the ecological restoration and other activities exceeds the inhibitory effect of mining on NPP in some certain pixels.
Considering the expansions of the open pit and the city in these four years, the mean value of NPPh for the research area in each year is calculated to better show the changes in NPP induced by human activities. The mean value refers to the ratio of the total NPPh generated in the whole research area to the area of the corresponding pixels. The mean values are 47.587 gC/m2 year, 65.443 gC/m2 year, 55.378 gC/m2 year, and 18.93 gC/m2 year for the four years, respectively, showing a trend of increasing first, and then decreasing, which is consistent with changes in the coal production and ecological restoration in the research area. It indicated that the impact of human activities on NPP varied year by year, since the intensities of various human activities were different and changed in the experimental years.
Further, the total NPPh and NPPa were counted in each year to calculate the proportion of NPP induced by climate conditions and human activities. Table 2 lists the statistical values. It shows that the proportion reaches 52.9% even in the initial period of mining in 2006, indicating that NPP in the grassland open-pit mine is easily affected by human activities such as mining. In 2011 with the highest mining intensity, the proportion reaches the maximum in the four years with a value of 56.2%. As compared with the proportions of 2006 and 2016, 56.2% does not refer to a large increase, since a better climate condition for NPP appeared in 2011. The proportion of NPP induced by human activities still reaches the highest value under a more suitable climate, indicating that human activities, mainly mining activities, have a significant inhibitory effect on NPP in this year. The impact of human activities accounted for only 11.9% in 2020, which was due to stable mining, steady implementation of ecological restoration, and very favorable climate conditions.

4. Discussion

Since carbon sinks in mining areas have attracted more and more attention, in this study, we aimed to explore the spatiotemporal changes of NPP and to analyze the impact of human activities on NPP in a grassland open-pit mine. This is because there are many grassland open-pit mines in northern China that need to be studied, and NPP is an important constituent of the surface carbon cycle and serves as a main factor in judging ecosystem carbon sinks.
The variations in actual NPP indicate that total NPP in a grassland open-pit mine is still mainly affected by climatic factors. One of the most critical factors for vegetation growth and its photosynthesis is climate conditions. In the Shengli mining area, located in the semi-arid grassland region of northern China, the influence of precipitation on vegetation is particularly obvious. This largely obscures the impact of human activities including coal mining and ecological restoration, which are a greater concern in a grassland open-pit mining area.
NPP induced by human activities was calculated using the calibration method proposed by this study, and effectively showed the corresponding relationships among mining intensity, ecological restoration, and NPPh changes. In the initial period of mining in 2006, a large number of grasslands in the research area were developed as mining and building areas, and during this time, human activities appeared to have had an inhibitory effect on NPP [45]. With the completion of mining construction and the largest mining intensity occurring in 2011, the impact analysis of human activities on NPP showed that the intense mining activities had an inhibitory effect. Since ecological restoration was at an early stage in 2016, the inhibitory effect was still observed as a whole in the research area even though the coal production experienced the valley value [46]. In 2020 with stable mining and steady implementation of ecological restoration, the impact of human activities on NPP appears to have had a promotion effect in the research area as a whole. This demonstrates the importance of setting a reasonable mining intensity and carrying out ecological restoration for NPP in grassland open-pit mining areas.
Further, to explore the spatial correlation of the influence of human activities on NPP in the research area, the global Moran’s I was calculated and is listed in Table 3. A global Moran’s I greater than zero represents a positive spatial correlation, and the larger the value the more obvious the correlation. On the contrary, a global Moran’s I less than zero indicates a spatial negative correlation, and the smaller the value the greater the spatial difference. Thus, it is useful for demonstrating the aggregation characteristics of the NPP impact induced by human activities in the research area. From Table 3, it can be seen that the values of the four-year Moran’s I are all greater than 0.85, indicating that the impact of human activities on NPP have a strong spatial autocorrelation in each period of mining in the grassland open-pit mine. That is, pixels with similar NPPh values are clustered together in the research area, which reflects the impact characteristics of mining activities on NPP. In addition, the global Moran’s I increased from 2006 to 2011, and then decreased until 2020. This shows that an increase in mining intensity tends to aggravate the aggregation, and the implementation of ecological restoration could help to weaken the aggregation.
To further illustrate the aggregation degree of the impact of human activities on NPP in local areas, the Getis-Ord Gi* was adopted. The local sum for a feature in the neighborhood of a grid cell was compared proportionally to the sum of all features using the Getis-Ord Gi* statistic [45], and then the Z-score was obtained, as shown in Figure 7. A positive and larger Z-score indicates more intense clustering of high values (hot spot) and a negative and smaller Z-score signifies more intense clustering of low values (cold spot) [47]. It can be seen from Figure 7 that the hot spots increased obviously from 2006 to 2011, especially near the mining area and the quarrying area in the south of the city. As compared with the large NPPh values clustered in hot spots, these values in the eastern part of the research area are relatively small and accumulated to form new cold spots. With the stabilization of mining activities and the continuous implementation of ecological restoration, the area of the cold and hot spots decreased gradually in the whole research area. Especially in 2020, the internal spatial aggregation of the impact of human activities on NPP reaches the lowest level in the four study years.
In this grassland open-pit mining area, human activities mainly consist of mining activities, expansion of the mining area and city, and ecological restoration. Different types of human activities have different effects on NPP, among which ecological restoration is stimulatory and the other human activities are inhibitory. The impacts of human activities on NPP varied year by year since the intensities of various human activities were different and changed in different years. Moreover, edaphoclimatic and land management practices are important conditioning factors, which need more attention in follow-up research.
It should be noted that the remote sensing images are affect by clouds and other factors in the research area, and therefore, they are not suitable to use for calculating the actual NPP based on the CASA model. Thus, it was difficult to obtain the actual NPP with high accuracy in each year. Moreover, there are four years that are special mining periods, i.e., the initial period of mining, the year with intense mining activities, the year that the coal production experienced the valley value, and the year with stable annual coal production. Therefore, only four years (2006, 2011, 2016, and 2020) were selected to analyze the NPP changes and the impact of human activities on NPP in the grassland open-pit mining area. More detailed results could be obtained if data from consecutive years were available in follow-up research.

5. Conclusions

In this study, we attempted to assess the influence of human activities on the NPP in a grassland open-pit mine in China. The CASA model was utilized to calculate the actual NPP, and we proposed a method for selecting a contrast area to calibrate the potential NPP estimated by the Chikugo model to obtain the NPP induced by human activities. The Shengli mining area, located in the city of Xilinhot, Xilin Gol League, in the Inner Mongolia Autonomous Region, China, was selected as the research area to explore the NPP in four representative years.
We concluded that the human activities-induced NPP is a better indicator than the actual NPP to reflect the characteristics of carbon sinks in grassland open-pit mines. The impact of human activities on NPP varied year by year, since the intensities of coal mining and the implementation of ecological restoration were different in each year. The percentages of pixels with an inhibitory effect on NPP were 98%, 99%, 97%, and 69% for the four study years. The proportion of NPP induced by human activities reached maximum and minimum values of 56.2% and 11.9% in 2011 and 2020, respectively. In addition, the analysis based on the Moran’s I and the Getis-Ord Gi* showed that mining activities and ecological restoration could aggravate and weaken the aggregation of NPPh, respectively.
The method proposed can be adopted for use in other study areas that are also grassland open-pit mining areas. In follow-up research, a more detail method to select the contrast area should be explored for obtaining more accurate calibration values. With more available images from the remote sensing satellite, a more continuous NPP time series in the research area would better reflect the impact of human activities on NPP in grassland open-pit mining areas.

Author Contributions

Conceptualization, F.Y. and J.W.; Data curation, C.Z., H.X. and Z.Z.; Formal analysis, F.Y. and J.W.; Funding acquisition, F.Y. and J.L.; Investigation, J.W.; Methodology, F.Y.; Resources, C.Z., H.X. and Z.Z.; Supervision, J.L.; Validation, F.Y. and J.W.; Writing—original draft, F.Y.; Writing—review and editing, F.Y., J.W., C.Z., J.L., H.X. and Z.Z. All authors have read and agreed to the published version of the manuscript.

Funding

This work was supported by the Open Fund of the State Key Laboratory of Coal Resources and Safe Mining (no. SKLCRSM21KFA08), the Open Fund of the State Key Laboratory of Water Resource Protection and Utilization in Coal Mining (grant no. GJNY-21-41-18), the China Postdoctoral Science Foundation (no. 2021M703510), the Fundamental Research Funds for the Central Universities (no. 2021XJDC01 and 2022JCCXDC04), the National Natural Science Foundation of China (no. 41901291), and the Yueqi Young Scholars Program of China University of Mining and Technology at Beijing.

Data Availability Statement

The datasets generated during and/or analyzed during the current study are available from the corresponding author on reasonable request.

Conflicts of Interest

The authors declare no conflict of interest.

References

  1. Ahirwal, J.; Maiti, S.K. Assessment of soil properties of different land uses generated due to surface coal mining activities in tropical Sal (Shorea robusta) forest, India. CATENA 2016, 140, 155–163. [Google Scholar] [CrossRef]
  2. Yang, B.; Bai, Z. Research advances and emission reduction measures in carbon source and sink of land ecosystems in coal mining area under the carbon neutrality. China Min. Mag. 2021, 5, 1–9. [Google Scholar]
  3. Lieth, H. Historical Survey of Primary Productivity Research. In Primary Productivity of the Biosphere; Springer: Berlin/Heidelberg, Germany, 1975; pp. 7–16. [Google Scholar] [CrossRef]
  4. Euskirchen, E.S.; Chen, J.; Li, H.; Gustafson, E.J.; Crow, T.R. Modeling landscape net ecosystem productivity (LandNEP) under alternative management regimes. Ecol. Model. 2002, 154, 75–91. [Google Scholar] [CrossRef] [Green Version]
  5. Chen, G.; Huang, Y.; Chen, J.; Wang, Y. Spatiotemporal Variation of Vegetation Net Primary Productivity and Its Responses to Climate Change in the Huainan Coal Mining Area. J. Indian Soc. Remote Sens. 2019, 47, 1905–1916. [Google Scholar] [CrossRef]
  6. Lal, R. Carbon Cycling in Global Drylands. Curr. Clim. Chang. Rep. 2019, 5, 221–232. [Google Scholar] [CrossRef]
  7. Gang, C.; Li, J.; Ju, W.; Chen, J. The comparisons of carbon sink/source of Chinese grassland ecosystem using different approaches. In Proceedings of the 2011 International Conference on Remote Sensing, Environment and Transportation Engineering, Nanjing, China, 24–26 June 2011; pp. 841–844. [Google Scholar] [CrossRef]
  8. Mao, F.; Du, H.; Li, X.; Ge, H.; Cui, L.; Zhou, G. Spatiotemporal dynamics of bamboo forest net primary productivity with climate variations in Southeast China. Ecol. Indic. 2020, 116, 106505. [Google Scholar] [CrossRef]
  9. Field, C.B.; Randerson, J.T.; Malmström, C.M. Global net primary production: Combining ecology and remote sensing. Remote Sens. Environ. 1995, 51, 74–88. [Google Scholar] [CrossRef] [Green Version]
  10. Chen, P. Monthly NPP Dataset Covering Northern 18°N of China’s Terrestrial Ecosystems (1985–2015). J. Glob. Change Data Discov. 2019, 3, 35–42. [Google Scholar]
  11. Zhou, C. The NPP Spatio-Temporal Dataset of the Tibetan Plateau (1982–2006); National Tibetan Plateau Data Center: Tibet, China, 2018. [Google Scholar]
  12. Didan, K.; Munoz, A.; Solano, R.; Huete, A. The NPP Products of MODIS in Sanjiangyuan (1985–2015); National Tibetan Plateau Data Center: Tibet, China, 2018. [Google Scholar]
  13. Dawson, T.; North, P.; Plummer, S.E.; Curran, P.J. Forest ecosystem chlorophyll content: Implications for remotely sensed estimates of net primary productivity. Int. J. Remote Sens. 2003, 24, 611–617. [Google Scholar] [CrossRef]
  14. Park, J.; Gan, J.; Park, C. Discrepancies between Global Forest Net Primary Productivity Estimates Derived from MODIS and Forest Inventory Data and Underlying Factors. Remote Sens. 2021, 13, 1441. [Google Scholar] [CrossRef]
  15. Vassallo, M.M.; Dieguez, H.D.; Garbulsky, M.F.; Jobbágy, E.G.; Paruelo, J.M. Grassland afforestation impact on primary productivity: A remote sensing approach. Appl. Veg. Sci. 2012, 16, 390–403. [Google Scholar] [CrossRef]
  16. Zhao, F.; Xu, B.; Yang, X.; Jin, Y.; Li, J.; Xia, L.; Chen, S.; Ma, H. Remote Sensing Estimates of Grassland Aboveground Biomass Based on MODIS Net Primary Productivity (NPP): A Case Study in the Xilingol Grassland of Northern China. Remote Sens. 2014, 6, 5368–5386. [Google Scholar] [CrossRef] [Green Version]
  17. Liu, Y.; Zhou, R.; Ren, H.; Zhang, W.; Zhang, Z.; Zhang, Z.; Wen, Z. Evaluating the dynamics of grassland net primary productivity in response to climate change in China. Glob. Ecol. Conserv. 2021, 28, e01574. [Google Scholar] [CrossRef]
  18. Zhang, H.; Sun, R.; Peng, D.; Yang, X.; Wang, Y.; Hu, Y.; Zheng, S.; Zhang, J.; Bai, J.; Li, Q. Spatiotemporal Dynamics of Net Primary Productivity in Chi-Na’s Urban Lands during 1982–2015. Remote Sens. 2021, 13, 400. [Google Scholar] [CrossRef]
  19. Zhong, J.; Liu, J.; Jiao, L.; Lian, X.; Xu, Z.; Zhou, Z. Assessing the comprehensive impacts of different urbanization process on vegetation net primary productivity in Wuhan, China, from 1990 to 2020. Sustain. Cities Soc. 2021, 75, 103295. [Google Scholar] [CrossRef]
  20. Bian, J.; Li, A.; Deng, W. Estimation and analysis of net primary Productivity of Ruoergai wetland in China for the recent 10 years based on remote sensing. Procedia Environ. Sci. 2010, 2, 288–301. [Google Scholar] [CrossRef] [Green Version]
  21. Zhang, M. Modeling net primary productivity of wetland with a satellite-based light use efficiency model. Geocarto Int. 2021, 1, 1–25. [Google Scholar] [CrossRef]
  22. Chen, F.; Wei, N.; Yang, H. The changes of land use and cover and NPP in mining area: A case study in China. In Proceedings of the 19th International Conference on Geoinformatics, Shanghai, China, 24–26 June 2011. [Google Scholar]
  23. Zhang, W.; Xiao, W.; Lv, X.; Zhang, S. Spatial and temporal change of regional NPP under different mining intensities in Shendong mining area from 2005 to 2015. Mine Surv. 2019, 5, 7. [Google Scholar]
  24. Wang, F.; Wang, Z.; Yun, Z. Spatio-temporal variations in vegetation net primary productivity and their driving factors in Anhui Province from 2000 to 2015. J. Arid. Land 2018, 38, 2754–2767. [Google Scholar]
  25. Yang, H.; Hu, D.; Xu, H.; Zhong, X. Assessing the spatiotemporal variation of NPP and its response to driving factors in Anhui province, China. Environ. Sci. Pollut. Res. 2020, 27, 14915–14932. [Google Scholar] [CrossRef]
  26. Nemani, R.R.; Keeling, C.D.; Hashimoto, H.; Jolly, W.M.; Piper, S.C.; Tucker, C.J.; Myneni, R.B.; Running, S.W. Climate-Driven Increases in Global Terrestrial Net Primary Production from 1982. Science 2003, 300, 1560–1563. [Google Scholar] [CrossRef] [Green Version]
  27. Wang, H.; Liu, G.; Li, Z.; Wang, P.; Wang, Z. Assessing the Driving Forces in Vegetation Dynamics Using Net Primary Productivity as the Indicator: A Case Study in Jinghe River Basin in the Loess Plateau. Forests 2018, 9, 374. [Google Scholar] [CrossRef] [Green Version]
  28. Liu, H.; Zhang, A.; Jiang, T.; Zhao, A.; Zhao, Y.; Wang, D. Response of vegetation productivity to climate change and human activities in the Shaanxi–Gansu–Ningxia region, China. J. Indian Soc. Remote Sens. 2018, 46, 1081–1092. [Google Scholar] [CrossRef]
  29. Haberl, H.; Krausmann, F.; Erb, K.; Schulz, N. Human Appropriation of Net Primary Production. Science 2002, 296, 1968–1969. [Google Scholar] [CrossRef]
  30. Haberl, H.; Erb, K.; Krausmann, F.; Gaube, V.; Bondeau, A.; Plutzar, C.; Gingrich, S.; Lucht, W.; Fischer-Kowalski, M. Quantifying and Mapping the Human Appropriation of Net Primary Production in Earth’s Terrestrial Ecosystems. Proc. Natl. Acad. Sci. USA 2007, 104, 12942–12947. [Google Scholar]
  31. Krausmann, F.; Erb, K.-H.; Gingrich, S.; Haberl, H.; Bondeau, A.; Gaube, V.; Lauk, C.; Plutzar, C.; Searchinger, T.D. Global human appropriation of net primary production doubled in the 20th century. Proc. Natl. Acad. Sci. USA 2013, 110, 10324–10329. [Google Scholar] [CrossRef] [Green Version]
  32. Zhou, W.; Gang, C.; Zhou, F.; Li, J.; Dong, X.; Zhao, C. Quantitative assessment of the individual contribution of climate and human factors to desertification in northwest China using net primary productivity as an indicator. Ecol. Indic. 2015, 48, 560–569. [Google Scholar] [CrossRef]
  33. Ugbaje, S.U.; Odeh, I.O.A.; Bishop, T.; Li, J. Assessing the spatio-temporal variability of vegetation productivity in Africa: Quantifying the relative roles of climate variability and human activities. Int. J. Digit. Earth 2016, 10, 879–900. [Google Scholar] [CrossRef]
  34. Yang, Y.; Wang, Z.; Li, J.; Gang, C.; Zhang, Y.; Zhang, Y.; Odeh, I.; Qi, J. Comparative assessment of grassland degradation dynamics in response to climate variation and human activities in China, Mongolia, Pakistan and Uzbekistan from 2000 to 2013. J. Arid Environ. 2016, 135, 164–172. [Google Scholar] [CrossRef]
  35. Hou, H.; Zhang, S.; Ding, Z.; Gong, Y.; Ma, C. Study on the measurement of ecological loss based on the net primary productivity in coal mines. J. China Coal Soc. 2012, 37, 445–451. [Google Scholar]
  36. Sun, Y.; Qian, S.; Yan, H.; Xu, L.; Wang, Y.; Cao, Y. Spatial-temporal dynamics of vegetation ecosystem in typical coal mining area of Yunnan Province during 2000–2018: A case study in Lincang. Ecol. Environ. Sci. 2019, 28, 2381–2389. [Google Scholar]
  37. Li, J.; Sang, X.; Zhang, C. Analysis of soil moisture content changes in resource-based cities over a long time series: A case study of Xilin Hot city. Bull. Survey. Mapp 2021, 7, 17–22. [Google Scholar]
  38. Gorelick, N.; Hancher, M.; Dixon, M.; Ilyushchenko, S.; Thau, D.; Moore, R. Google Earth Engine: Planetary-scale geospatial analysis for everyone. Remote Sens. Environ. 2017, 202, 18–27. [Google Scholar] [CrossRef]
  39. Monteith, J.L. Solar Radiation and Productivity in Tropical Ecosystems. J. Appl. Ecol. 1972, 9, 747–766. [Google Scholar] [CrossRef] [Green Version]
  40. Potter, C.S.; Randerson, J.T.; Field, C.B.; Matson, P.A.; Vitousek, P.M.; Mooney, H.A.; Klooster, S.A. Terrestrial ecosystem production: A process model based on global satellite and surface data. Glob. Biogeochem. Cycles 1993, 7, 811–841. [Google Scholar] [CrossRef]
  41. Uchijima, Z.; Seino, H. Agroclimatic Evaluation of Net Primary Productivity of Natural Vegetations. J. Agric. Meteorol. 1985, 40, 343–352. [Google Scholar] [CrossRef]
  42. Zhou, P.; Wu, W.; Wang, R.; Liu, T.; Sun, C. Analysis of grassland simulation using different estimation models of grassland net primary productivity in China. Pratacult. Sci. 2018, 35, 2381–2388. [Google Scholar]
  43. Moran, P. Notes on continuous stochastic phenomena. Biometrika 1950, 37, 17–23. [Google Scholar] [CrossRef]
  44. Getis, A.; Ord, K. The Analysis of Spatial Association by Use of Distance Statistics. Geogr. Anal. 1992, 24, 127–145. [Google Scholar] [CrossRef]
  45. Chen, Y.; Wang, J.; Xiong, N.; Sun, L.; Xu, J. Impacts of Land Use Changes on Net Primary Productivity in Urban Agglomerations under Multi-Scenarios Simulation. Remote Sens. 2022, 14, 1755. [Google Scholar] [CrossRef]
  46. Chen, G.; Li, X.; Jiao, L.; Wang, J.; Gu, K. Spatial-temporal variation of vegetation net primary productivity in Huainan coal mine area from 2000 to 2012. Ecol. Environ. Sci. 2017, 26, 196–203. [Google Scholar]
  47. Shariati, M.; Mesgari, T.; Kasraee, M.; Jahangiri-Rad, M. Spatiotemporal analysis and hotspots detection of COVID-19 using geographic information system (March and April, 2020). J. Environ. Heal. Sci. Eng. 2020, 18, 1499–1507. [Google Scholar] [CrossRef] [PubMed]
Figure 1. Map of the study area.
Land 11 00743 g001
Figure 2. Annual coal production in the research area.
Land 11 00743 g002
Figure 3. Map of the contrast area.
Land 11 00743 g003
Figure 4. Boxplots of the NPP differences of the four study years in the contrast area.
Land 11 00743 g004
Figure 5. Distribution of the actual NPP in the experimental years.
Land 11 00743 g005
Figure 6. Spatial distribution of NPP induced by human activities in the experimental years.
Land 11 00743 g006
Figure 7. Hot spots mapping of the impact of human activities on NPP.
Land 11 00743 g007
Table 1. The statistical results of the actual NPP in the experimental years.
Maximum
(gC/m2 year)
Minimum
(gC/m2 year)
Average
(gC/m2 year)
2006334.70.4690.0
2011351.60.47116.4
2016379.70.4597.4
2020511.40.59159.2
Table 2. Proportion of NPP that is induced by climate conditions and human activities.
Climate (%)Human Activities (%)
200647.152.9
201143.856.2
201653.946.1
202088.111.9
Table 3. Moran’s I values for the four study years.
YearGlobal Moran’s I
20060.91
20110.93
20160.89
20200.85
Publisher’s Note: MDPI stays neutral with regard to jurisdictional claims in published maps and institutional affiliations.

