Article

Multi-Dimensional Urbanization Coordinated Evolution Process and Ecological Risk Response in the Yangtze River Delta

1
Agricultural College, Yangzhou University, Yangzhou 225009, China
2
School of Geography, Nanjing Normal University, Nanjing 210023, China
3
Jiangsu Center for Collaborative Innovation in Geographical Information Resource Development and Application, Nanjing 210023, China
4
Population Research Institute, Nanjing University of Posts and Telecommunications, Nanjing 210042, China
*
Author to whom correspondence should be addressed.
Land 2022, 11(5), 723; https://doi.org/10.3390/land11050723
Submission received: 5 April 2022 / Revised: 6 May 2022 / Accepted: 9 May 2022 / Published: 11 May 2022
(This article belongs to the Special Issue Regional Sustainable Development of Yangtze River Delta, China)

Abstract

:
The dislocated development of population, land, and economy will disturb the urban system, cause ecological risk problems, and ultimately affect regional habitat and quality development. Based on social statistics and nighttime lighting data from 2000 to 2018, we used mathematical statistics and spatial analysis methods to analyze the change process of urbanization’s coupling coordination degree and ecological risk response pattern in the Yangtze River Delta. Results show that: ① From 2000 to 2018, the coupling coordination degree of urbanization in the Yangtze River Delta increased, with high values in Suzhou-Wuxi-Changzhou, Shanghai, Nanjing and Hangzhou regions. ② The ecological risk in the Yangtze River Delta weakened, and the vulnerability and disturbance of landscape components together constitute the spatial differentiation pattern of regional ecological risk, which presented homogeneous aggregation and heterogeneous isolation. ③ The overall ecological stress of urbanization in the Yangtze River Delta decreased. ④ The population aggregation degree, socio-economic development level and built-up area expansion trend contributed to the spatiotemporal differentiation of urbanization’s ecological risks through the synergistic effects of factor concentration and diffusion, population quality cultivation and improvement, technological progress and dispersion, industrial structure adjustment and upgrading. This study can provide a reference for regional urbanization to deal with ecological risks reasonably and achieve high-quality development.

1. Introduction

Urbanization is an important symbol of the steady development of society, economy and culture and is a necessary stage of historical development in a country or region [1]. Nevertheless, countries such as the United States, the United Kingdom, Japan, Korea, Brazil, India, and Pakistan all suffer from urbanization threatening the ecological environment during their initial and rapid development periods. Ecological imbalance, environmental contamination, resource depletion, and other ecological risks are negatively impacted by urbanization [2,3,4]. Furthermore, urbanization and industrialization patterns in the wider region in which the study area is sited—that is, east Asia and China—differ from that of the old industrial countries of Europe and North America. China has experienced the most extensive and fastest urbanization process in the world. Due to the compression of space and time, quite a few concentrated conflicts have emerged. Specifically, excessive attention has been paid to economic urbanization leads and to land urbanization ahead of population urbanization. The dislocation of these three components in China has generated more ecological and environmental issues than any other country or region [5], which has, in turn, attracted the attention of widespread international communities.
The studies show that the ecological risk problem in areas with low-level urbanization is relatively simple. The higher urbanization level means more substantial disturbances by human behavior, which has a more profound influence on urban space, population, and industrial structure, generating a wide range of influence and a high frequency of ecological risks [6,7]. Unfortunately, no unified standard exists for evaluating urbanization level, only some single index (i.e., urban population proportion, urban land proportion, etc.) and compound index evaluation methods [7,8]. Since the single index method can only reflect a specific aspect of urbanization quantitatively, the composite index method that comprehensively evaluates the overall development quality is more desirable. Considering that the development mode of urbanization also profoundly impacts the ecological environment [9,10,11], which development model is more conducive to mitigating ecological risks has been a global problem and strategic issue.
The primary attributes of urbanization should include complexity, diversity, and heterogeneity [12]. However, most previous studies have adopted physical expansion rather than an original improvement to simplify the complexity of urban development, including urban expansion, fragmentation and inefficiency of land use, and spatial configurations that disrupt landscape patterns, thereby increasing habitat sensitivity and vulnerability [13]. There is also an insufficient awareness of diversity. The GDP-only model of urban development violates the law of geographical differentiation, resulting in insufficient inclusion and feedback of various material and energy flows, accumulation of potential impacts, risk receptors, and explosive risks over time, all of which complicate the assessment and management process [14]. Moreover, because we ignore heterogeneity, population growth, economic development, and urban spatial expansion fail to cooperate in urbanization [15]. This phenomenon directly affects the ecosystem’s resistance, recovery, and stability, generating chain risk events in the soil, atmosphere, and biosphere. Therefore, urbanization is a multi-dimensional process of spatial change [16,17], and it refers to the process of population agglomeration in cities and towns, the expansion of the urban scale and the resulting economic and social changes, including economic urbanization, population urbanization, and land urbanization [18]. Scholars usually understand this intrinsic connection as urbanization. Its root and core lie in the decline of the proportion of the rural population and the increase of the proportion of the urban population. The industrial structure shifts from an agricultural economy to an industrial economy with the service industry as the economic pillar, driven by the evolution of social structures from rural to urban societies. With the changes in population and economic society in geographical space, land urbanization is the bearer of the urbanization system [19]. The subsystems of economic urbanization, population urbanization and land urbanization complement each other, which is called collaborative urbanization [20]. Only a coordinated development of population, economy, and land urbanization can control and prevent the ecological risks [18,21].
China faces severe ecological and environmental problems, especially in the eastern urban agglomerations. Therefore, it is crucial to explore the conceptual content and evaluation methods of urbanization’s ecological risks for taking adequate early warning and remedial measures. The U.S. Environmental Protection Agency introduced the concept of ecological risk assessment in the 1980s for environmental management objectives. Nowadays, ecological risk assessment has experienced a development process from environmental risk to the ecological risk and then to regional ecological risk assessment. The risk sources have expanded from single to multiple risk sources, and the evaluation scope has expanded from a local to a regional landscape level [22]. Research on urbanization’s ecological risk mainly involves the following aspects: (1) conceptual analysis of urbanization’s ecological risk [23,24]; (2) judgement of urbanization’s ecological risk level [25,26]; and (3) regulation and control of urbanization’s ecological risk [27,28,29]. Generally speaking, urbanization’s ecological risk is the degree and possibility that urban development and construction and human activities will bring adverse changes to ecological elements, processes, and ecosystem services or threats to human health. The methodology system of urbanization’s ecological risk constructed from different perspectives and methods is put forward, which mainly includes three major types. The first is the construction of comprehensive indices or model simulations from risk sources, habitats and ecological receptors in terms of physical damage, such as the biological effect evaluation index method [30,31], the relative risk method [32], the exposure–response method [33], fuzzy mathematics, and grey system [34]. The second is the landscape ecological risk index, which is constructed from the landscape’s vulnerability, disturbance, and resilience based on a landscape analysis perspective [35,36]. The third is to use GIS and RS technology to obtain risk information and combine Ripley’s k function with geostatistics from a spatial perspective [37].
In summary, the academic community has paid attention to the extent and impact of the ecological risks of urbanization from different perspectives. Nonetheless, there are two main shortcomings. First, previous studies have stayed on the correlation between urbanization level and ecological risks, focusing on the spatial location, distribution pattern and quantitative correlation evaluation between urbanization level and ecological risks in a specific cross-sectional time. Some scholars have studied the coupling trend, effect and mechanism of the two, but research on the ecological risk caused by different population allocations, industry and land in cities and towns is weak. The synergy of population gathering, industrialization, and land use are more in line with the diversified requirements of cities and habitats. Secondly, urbanization ecological risk assessment mostly takes administrative units as the data carrier because Chinese socioeconomic data are cascaded by administrative units. However, many ecological risks are difficult to measure by socioeconomic data, making it difficult to describe the spatial patterns of urbanization ecological risks. Therefore, this study could supplement the theoretical perspective of urbanization ecological risks and refine the scale of related studies.
The Yangtze River Delta is one of the regions with the best urbanization foundations in China. With outstanding location advantages, superior natural endowments and comprehensive solid strength, it is one of the six major urban agglomerations in the world. The Outline of the Yangtze River Delta Regional Integrated Development Plan issued in 2019 elevates the integrated development of the Delta to a national strategy. However, the Yangtze River Delta faces a fierce contradiction between territorial space development and ecological protection, which threatens the quality and sustainability of regional urbanization development. Therefore, exploring coordinated regional urbanization and ecological risk response in the Yangtze River Delta is crucial in promoting ecological civilization construction. To fill the gaps above, taking the Yangtze River Delta as an example, this study investigates the coordinated evolution process of urbanization and its ecological risk response in the Delta based on a five km * five km raster scale from 2000 to 2018 with the help of downscaling analysis, coupling coordination, an ecological risk evaluation model, and a trend analysis. This study aims: (1) to scientifically recognize the distribution characteristics and laws of ecological risk under the role of collaborative urbanization development; and (2) to attempt to complement the study on the spatiotemporal correlation between the two at the raster scale. This study is expected to guide the implementation of new urbanization and regional integration policies in the relevant regions and to provide scientific guidance for mitigating and controlling ecological risks.

2. Coupling Mechanism of Urbanization Coordination and Ecological Risk

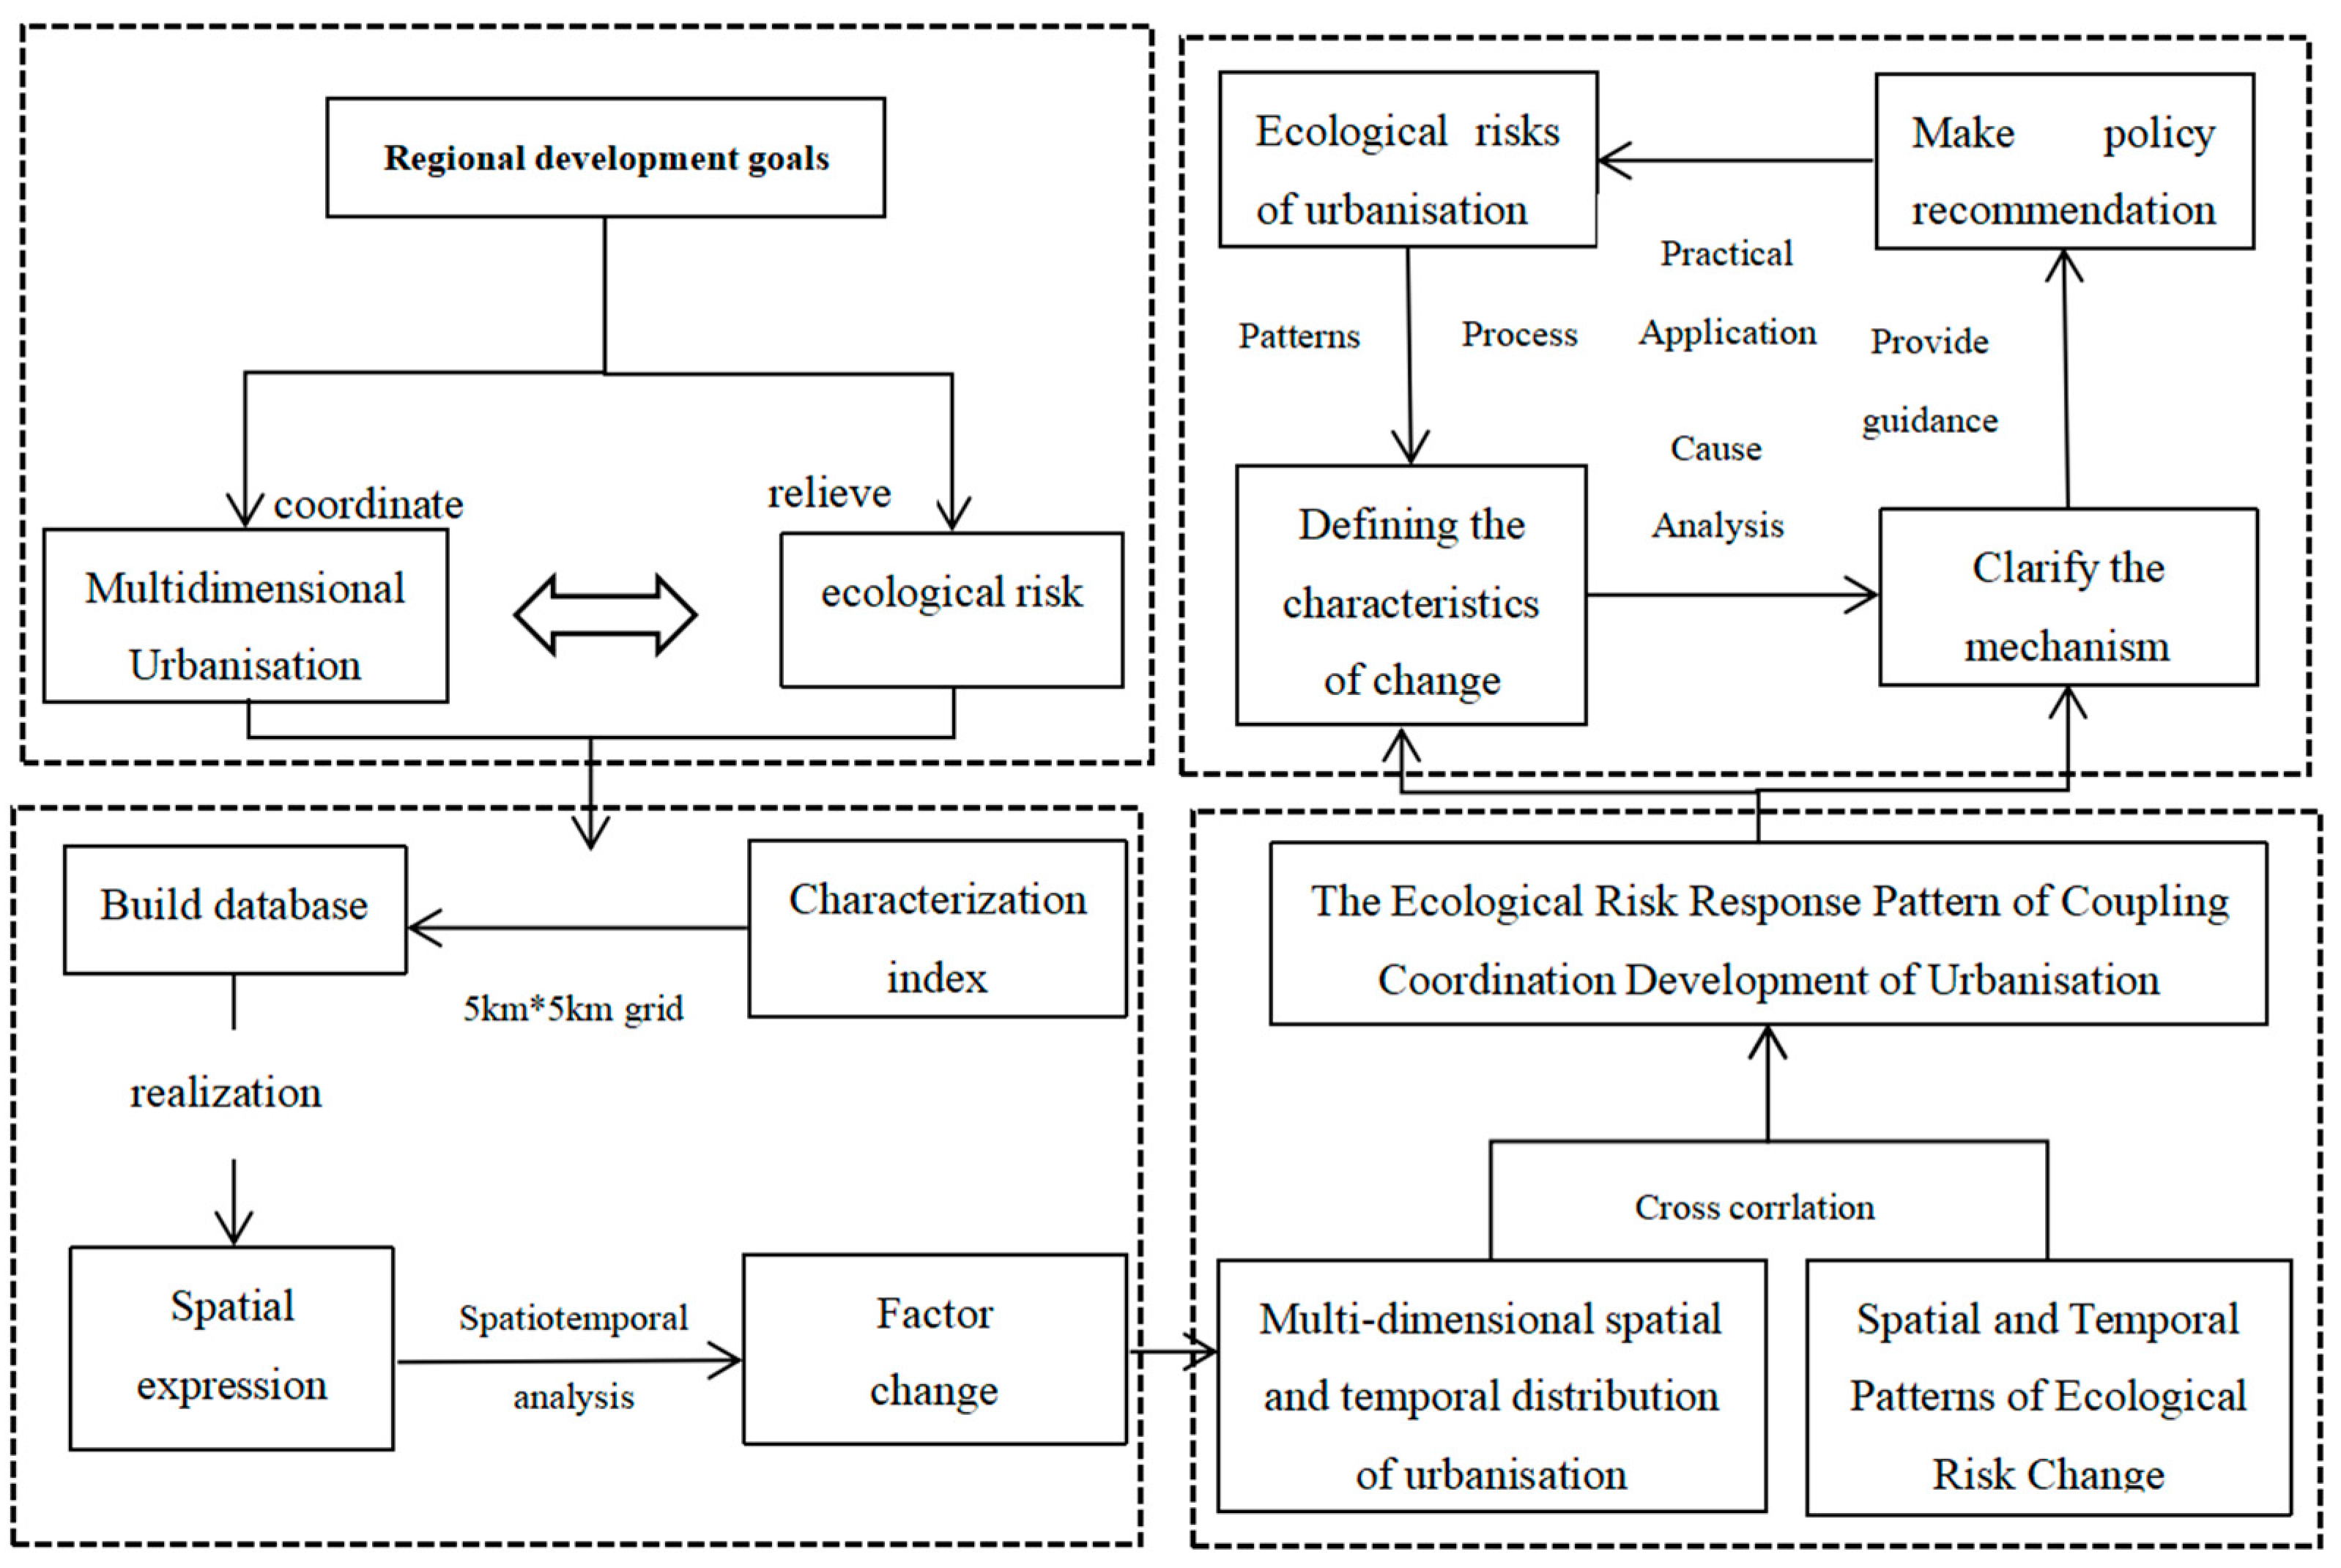
2.1. Technical Roadmap of This Research

This study intends to portray the combined state of multidimensional urbanization quantitatively, to measure the spatial and temporal distribution characteristics of ecological risks based on the goal of high-quality regional development, and to refine the driving mechanism of ecological risks of regional urbanization through an analysis of the interaction relationship between multidimensional urbanization and ecological risks. As a result, we try to provide a reference for regional development practice (Figure 1). The steps of the study are as follows: (1) Quantitative measurement of multidimensional urbanization. Based on the perspective of a balanced coordination of population urbanization, economic urbanization, and land urbanization, the paper spatially expresses the population density, economic density and spatial extent of urbanization, respectively, in the Yangtze River Delta region from 2000 to 2018 with the help of downscaling models and a nighttime light database. (2) Ecological risk measurement. In this section, the paper constructs risk plots and uses a landscape pattern index to evaluate regional ecological risk change patterns. (3) Multidimensional urbanization and ecological risk response patterns. Based on the analysis of the change characteristics of multidimensional urbanization and ecological risk, we combine the changes in population urbanization, economic urbanization, and land urbanization elements in the Yangtze River Delta from 2000 to 2018 and comprehensively refine the driving mechanism of urbanization’s ecological risk in the Delta.

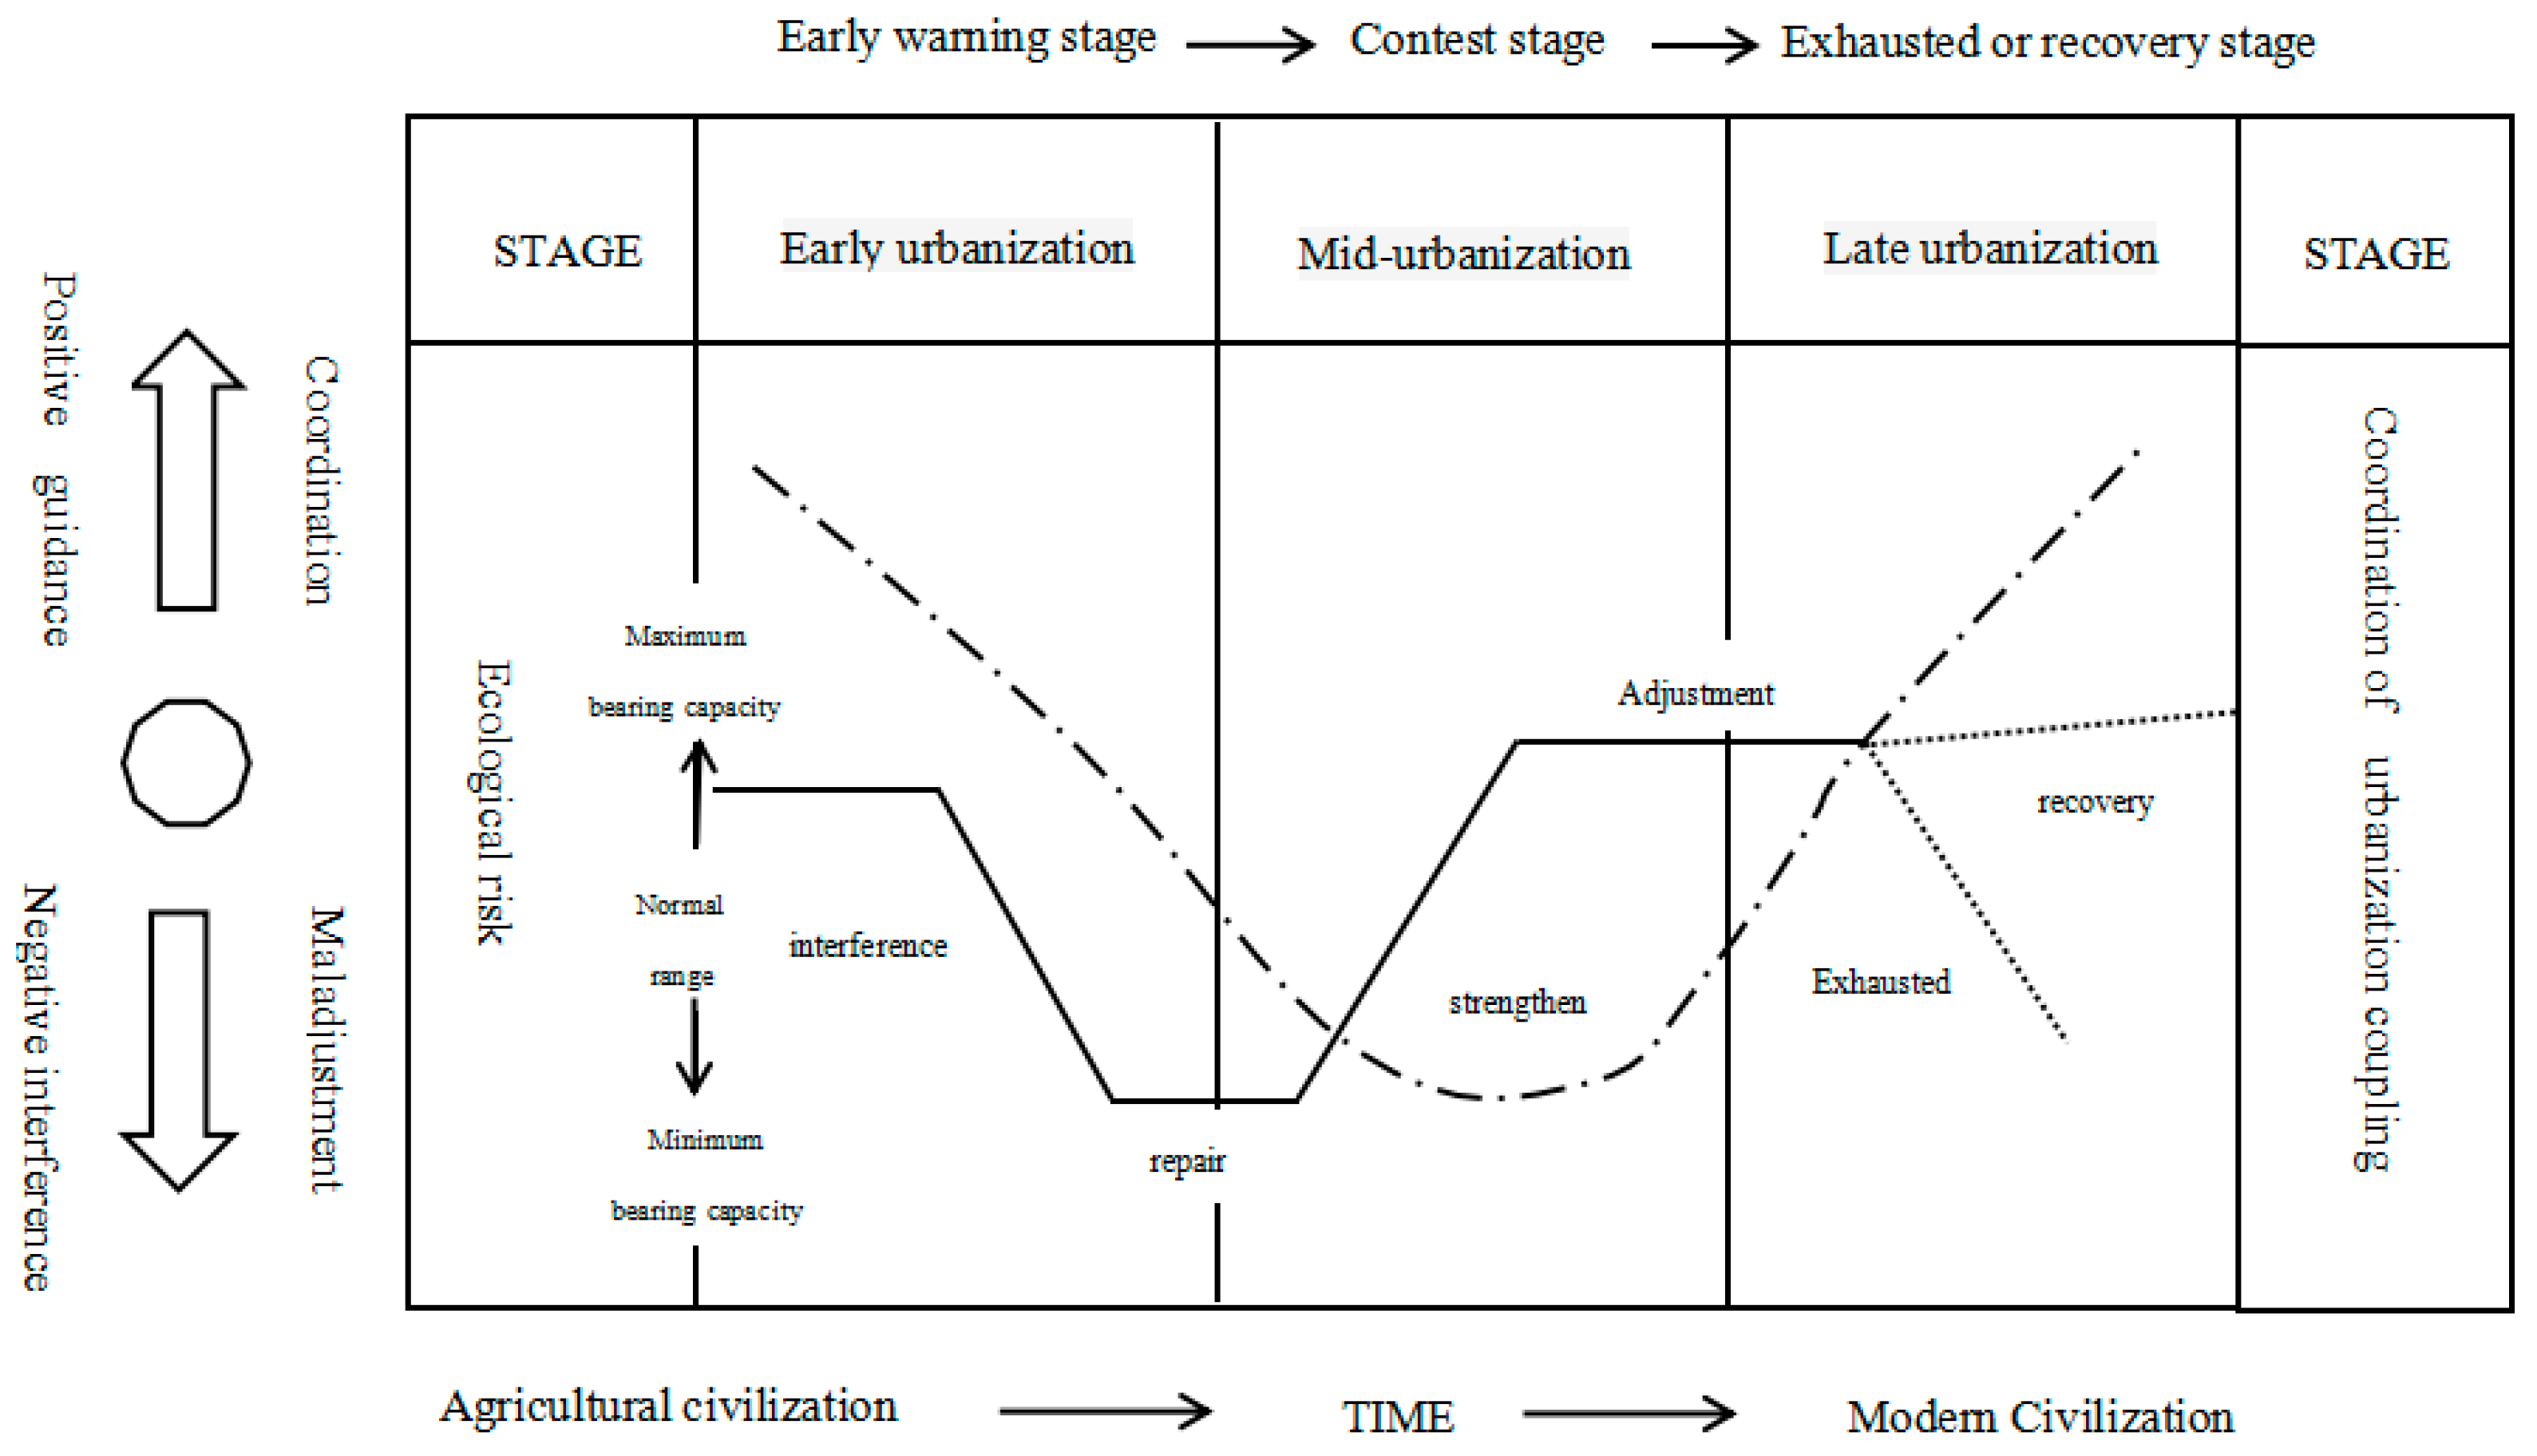
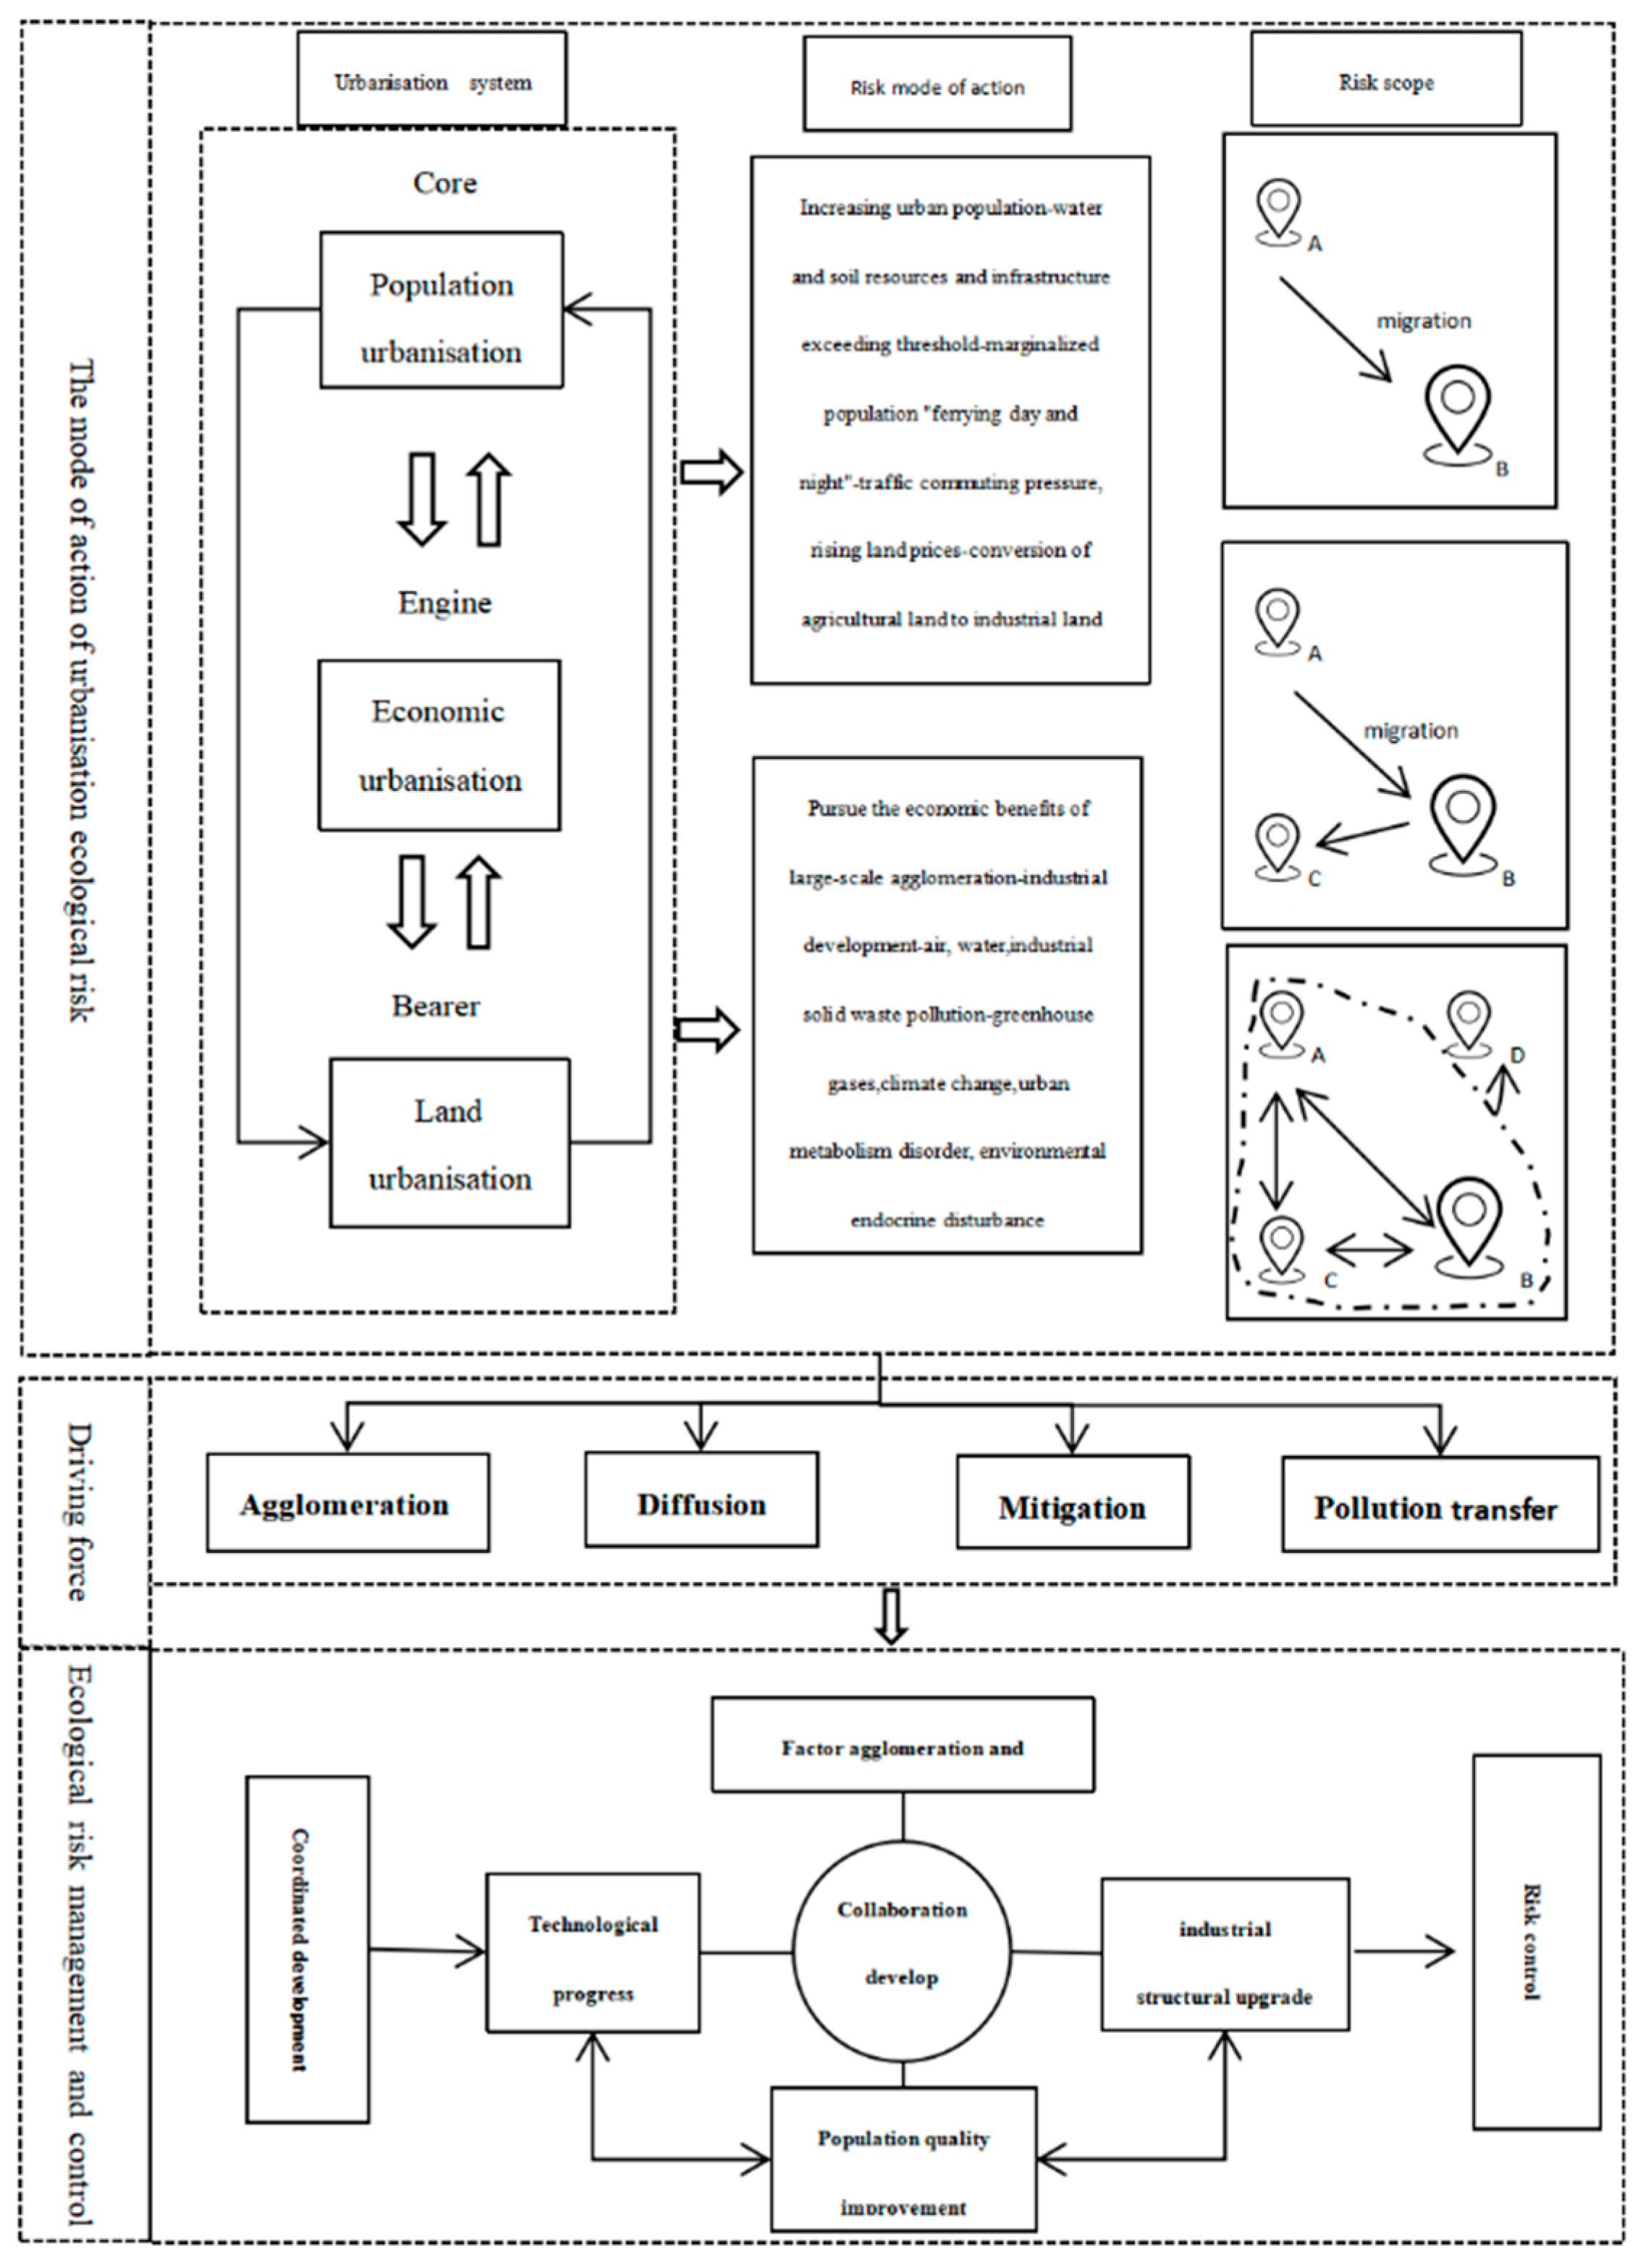
2.2. Interaction of Urbanization and Ecological Risk

Population growth, economic development, and spatial expansion in urbanization could induce ecological risks. ① Population urbanization is mainly the migration of the agricultural population to the non-agricultural population. With the rapid increase in population density and consumption level [38], the large population in urban centers brings challenges to living, commuting, etc. These pressures have to be alleviated by outward expansion and increased production and living pollutants. Meanwhile, the growing consumer demand poses more significant challenges to the supply capacity of water and land resources; if the disturbance force exceeds the natural system’s carrying capacity, the ecosystem’s elasticity will decline and collapse, eventually leading to an increase in ecological risk.
② Economic urbanization is mainly manifested in the level of industrialization and in the upgrading and adjustment of the industrial structure [39]. Among them, industrialization refers to transforming primary products into final products through one or more processing methods and is the main engine driving urbanization. On the one hand, the initial stage of industrialization is relatively rough and inefficient, and the pollution of waste gas, wastewater, and industrial solid waste generated during this process seriously threatens the atmosphere and the hydrosphere. On the other hand, in the middle and late stages of industrialization, ecological risks are reduced due to the improvement of production efficiency, the implementation of environmental regulations, the improvement of clean production technologies and the upgrading and adjustment of industrial structures, but due to the stress of long-term cyclic accumulation, the ecosystem still has hidden, long-term and uncertain risks [40,41].
③ Land urbanization is manifested in the change of urban landscape patterns and the expansion of the geographical expansion of built-up areas [42]. Land rent theory argues that people pursue economic growth in land ownership. Therefore, the early expansion of construction land mainly depends on the deprivation of many low-value-added cultivated lands and natural ecological land, resulting in a severe depletion of ecosystem services and a decline in ecosystem self-recovery and adaptative capacity. In addition, it is easier to maintain its stability for intensive, compact, and continuous landscapes. However, during this period, people’s investment in construction is high. The intensity of urban sprawl tends to lead to a decline in the compactness of the landscape on the fringes of towns, scattered urban forms, fragmentation of each landscape component, and a sharp increase in ecological risks. In the middle and later stages of development, land use is developed by spatial governance and protection of territorial space, which can gradually improve the spatial structure, form, and interaction of towns and cities with the scale agglomeration effect of population and industry to reduce ecological risks.
Population, spatial, and economic urbanization, as a complicated system, are not affected individually but interfere with each other, resulting in co-frequency resonance or negative superposition according to the coupling and coordination of all three. Rapid population urbanization is the root and core driver of risks. In contrast, rapid industrialization is the engine and driving force to solve the demand for transportation, employment, housing, and consumption caused by rapid population urbanization. However, this industrialization also brings more severe and broader ecological risk threats. The mediating effect of land urbanization on population and economic population enhances ecological vulnerability, further deepening and consolidating ecological risks [18,21]. Therefore, the mandatory interaction between urbanization and ecological risks need to be studied from a synergistic perspective of population, economy, and space (Figure 2).

3. Materials and Methods
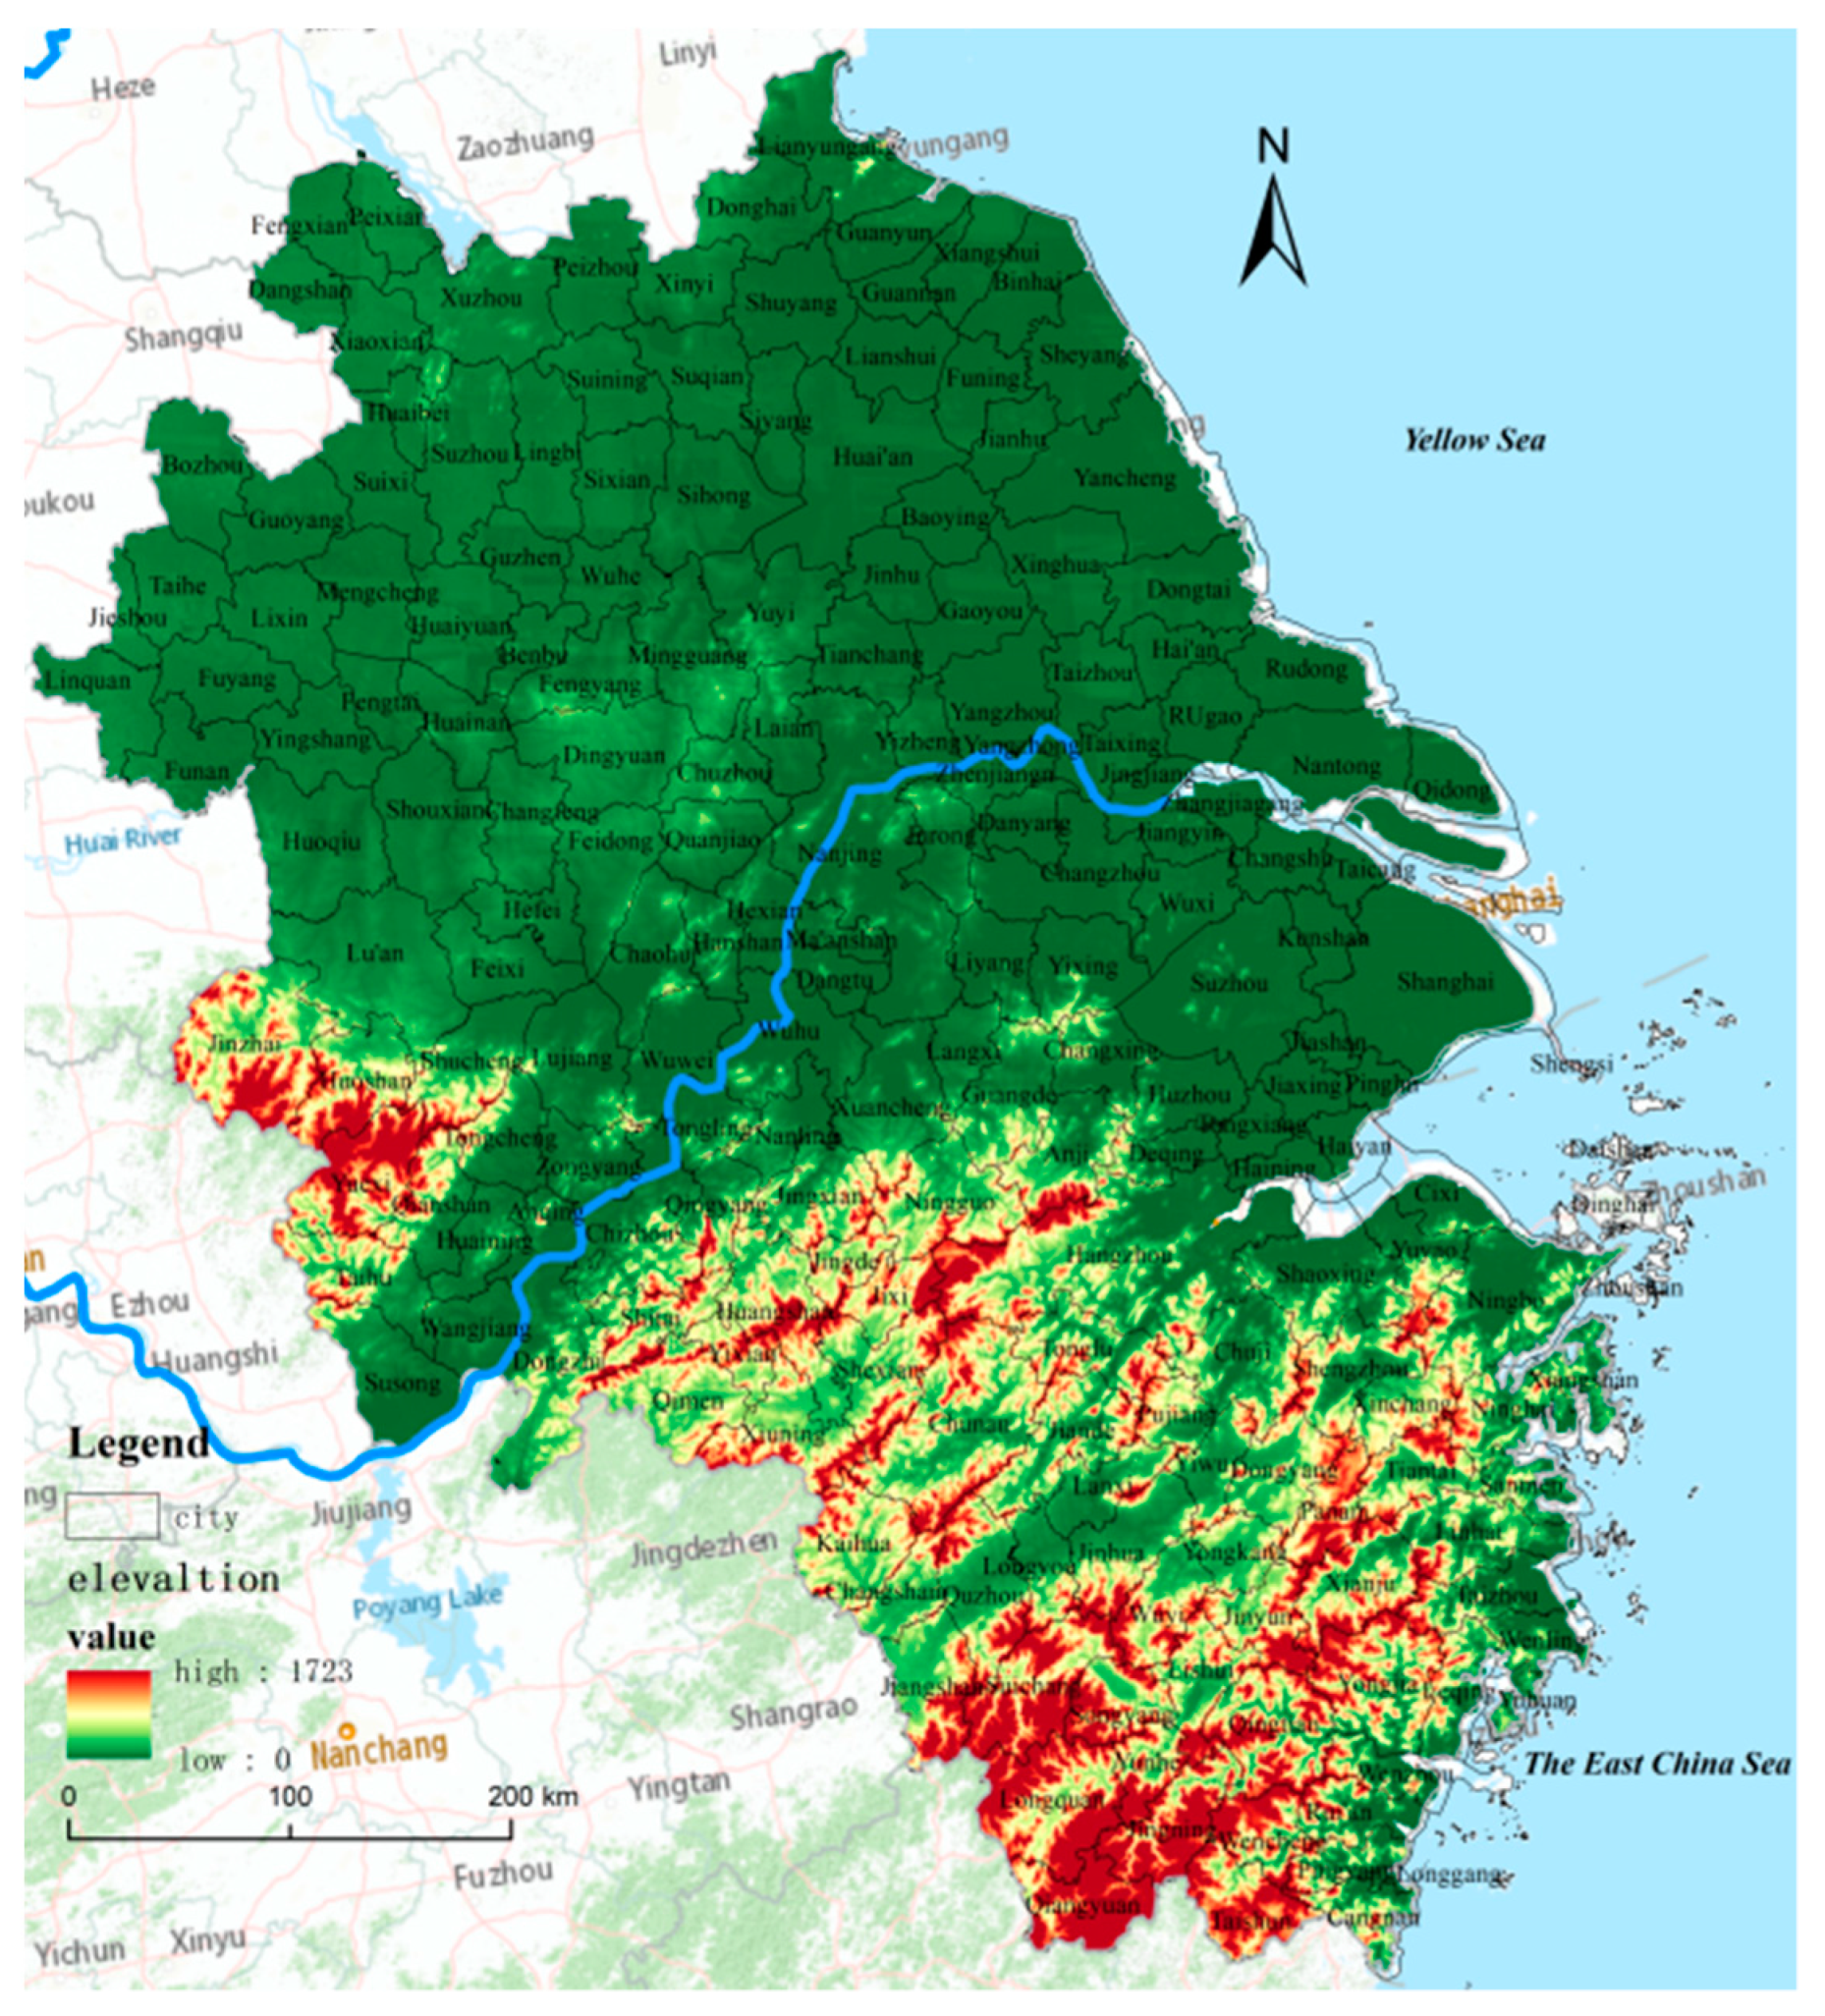
3.1. Study Area

The Yangtze River Delta is located on the eastern coast of China, with latitude 32°34′ N–29°20′ N and longitude 115°46′ E–123°25′ E. It includes the four provinces of Shanghai, Jiangsu, Zhejiang, and Anhui, with 41 cities and 358,000 square kilometers. It is at the intersection of the Yangtze River Economic Belt and the One Belt, One Road Initiative. Although the strategic position of the Delta is vital, its national spatial development and ecological environment coercion problems are also prominent, and there is an urgent need to formulate appropriate management policies and congestion relief plans.
This study selects the Yangtze River Delta region as the research object, mainly based on three considerations. (1) Strong leadership and demonstration skills. The Yangtze River Delta is the region with the highest and fastest urbanization level in China, with an average annual urbanization growth rate of 9.2%, a large population inflow, and an average annual GDP growth rate of 15.7% [43]. The total economic output of the Yangtze River Delta region is close to 25% of the national total. The region is also at the forefront of China’s high-tech industry development. (2) A larger threat of ecological risks. The natural ecosystem of the Yangtze River Delta has been disturbed by human activities, and the landscape pattern of the Delta has undergone significant changes. In the past 18 years, the cultivated land, grassland, and forest land have declined significantly, and the release area change rates were −8.76%, −2.61%, and −1.83%, respectively. Meanwhile, construction land showed a significant upward trend, the area change rate was as high as 293.41% (Table 1), the natural landscape continued to decline, and the artificial landscape continued to expand. Therefore, the United Nations Intergovernmental Panel on Climate Change has listed the Yangtze River Delta as an ecological risk hotspot [44]. (3) More significant natural spatial heterogeneity and socioeconomic development gradient. The natural environment in the Yangtze River Delta is significantly different, with diverse terrain and prominent and zonal topography. They were bounded by the Yangtze River and the famous Yangtze River Delta Plain to the north. The terrain is gentle and undulating, and the south is mountainous hills, such as the hilly mountains in southern Anhui and the hilly plains in southwestern Zhejiang, where the climate is divided by the line of the Huaihe-Subei irrigation canal and the transitional characteristics are a subtropical to warm temperate zone (Figure 3). There are apparent regional economic differences in the Yangtze River Delta, with Shanghai at the center and the development pattern of coastal river networks where the Suzhou-Wuxi-Changzhou city group, the Hangzhou-Jiaxing-Huzhou city group, the Nanjing metropolitan area, the Hefei metropolitan area, and the Ningbo metropolitan area are formed. Nevertheless, the development of the northern Anhui, the southwest Zhejiang, and the northern Jiangsu, which are on the outer edges of the circle, are still relatively lagging. The regional economic and social development stages are lagging, which is not conducive to regional integration and coordinated development.

3.2. Data Sources and Processing

Data sources include (1) land-use remote sensing monitoring data. 2000, 2005, 2015, and 2018 remote sensing monitoring data of the Yangtze River Delta were obtained from the Resource and Environment Science Data Center of the Chinese Academy of Sciences (http://www.resdc.cn (accessed on 1 January 2020)), which is based on Landsat TM/ETM+/OLI remote sensing image processing. The current land-use map was obtained after image pre-processing, manual visual interpretation, and other operations. The land-use types were divided into six categories, namely arable land, forest land, grassland, water, construction land, and unused land [45], according to the Classification of Current Land Use (GB/T21010-2017). The overall accuracy of the study area reached more than 80%, and the Kappa coefficient was above 0.70. (2) Statistical data. The socioeconomic data used in this study were obtained from the Shanghai Statistical Yearbook (2001–2019), the Jiangsu Statistical Yearbook (2001–2019), the Zhejiang Statistical Yearbook (2001–2019), the Anhui Statistical Yearbook (2001–2019), the China County Statistical Yearbook (2001–2019), and the China City Statistical Yearbook (2001–2019). (3) Nighttime light database. The data used in this study contain DMSP/OLS (version 4) from 1992 to 2013 and NPP/VIIRS (day/night band) from 2013 to 2018, which were obtained from the National Oceanic and Atmospheric Administration (https:// www.ngdc.noaa.gov/ngdc.html (accessed on 1 January 2020)). The data were processed using the maximum threshold method to remove background noise and temporary light interference with radiation correction. Subsequently, we referred to Li’s method [46] for correction and fusion processing of the two types of data in order to ensure the accuracy and consistency of the study data. (4) Administrative boundary data. The administrative boundary data of the Yangtze River Delta were obtained from the National Basic Geographic Information Center of China (http://ngcc.sbsm.gov.cn (accessed on 1 January 2020)). Given the administrative boundaries adjustment and the above data’s continuity, the study was subsumed and processed according to the latest administrative boundaries. In addition, since there is a gradual transition zone between built-up areas and suburban areas within municipal jurisdictions, splitting the two was not conducive to the totality of the study units, so the study combined and processed the municipal jurisdictions of each city in a unified manner. After reorganizing counties, county-level cities and municipal districts, 193 county units were identified (Figure 2).

3.3. Methods

3.3.1. Urbanization Evaluation Index System

The urbanization system is a multi-level and multi-factor complex system [1,17]. Scholars construct composite index methods from multiple levels such as population, ecology, society, economy, and land [47,48]. There may be multiple covariates, leading to bias in the evaluation results.
Since the 1960s and 1970s, Western society has entered a period of transformation and development. The United Nations, the World Bank, the Organization for Economic Cooperation and Development, and the European Union have paid unprecedented attention to environmental issues. Therefore, they have successively introduced indicator systems for evaluating sustainable development. To date, the mainstream indicator frameworks include Pressure-State-Response (PSR), Driving-Force-State-Response (DSR), Driving-Force-Pressure-State-Impact-Response (DPSIR), Vitality-Organization-Resilience frameworks (VOF), the human well-being/ecological health framework, and the thematic framework based on a factor–structure system. Among these, the thematic framework of the element–structure system can be decomposed by indicators, analyze the effect of each element on the target layer, and then select critical indicators. Based on the human–land relationship theory and the synergistic effect theory, this study comprehensively considers the advantages and disadvantages of individual indicators and comprehensive evaluation, draws on the research methods of most scholars [49,50], and identifies population urbanization, economic urbanization, and land urbanization as the key indicators of urbanization. The study identifies population, economic, and land urbanization as the primary indicators of urbanization evaluation [20,51]. It constructs the secondary indicators of population density, economy density, and spatial intensity based on scientific, comprehensiveness, and representativeness principles.
Population density and economic density: It is customary to use population data to be counted and aggregated at each level according to administrative units [52], which is large in scale, insufficient in dynamics, and unfavorable for overlaying with other geospatial data [53]. The downscaling method is mostly used in meteorological forecasting and spatialization of demographic and economic data [54,55], based on certain regression relationships. The original attribute information is converted into grid cells by weighting and summing the regression coefficients of different influence factors [56]. Land use is closely related to human activities and can be superimposed with other geographic factors in order to achieve integrated multivariate analysis; accordingly, this study chose a land-use model to spatialize population and economic data [57]. The height of the industrial structure is a symbol of prosperity and the flourishing of urbanization, and it is also a support for the continuous improvement of the regional economy [58,59]. This study selects urban land, rural settlements, and construction land, focusing on spatializing the economic density of secondary and tertiary industries. Please refer to the literature for the specific spatial regression method [60].
Spatial intensity (total light intensity): In the spatial dimension of urbanization, most studies follow the statistical yearbooks of built-up areas or extract remote sensing image information, but they can only analyze the quantitative expansion process of different sections of urban land, while the spatial expansion of urban land includes information on spatial structure and morphological structure, while mining the spatial combination and evolution of urban land is more conducive to the intensive utilization of resources and model exploration [61]. DMSP/OLS data can effectively monitor the urban land expansion process [62], often analyzing urban spatial processes, utilizing total light intensity [63]. The calculation method is as follows.
S N a = i = min ( D N ) max ( D N ) ( D N i × n i )
In the formula, SNa stands for the total light intensity of an area; DNi stands for the grayscale value of i unit; ni stands for the total number of pixels of i unit. SNa reflects the intensity of human activities and indirectly reflects the intensity of urbanization and the spatial extent. This study uses this as a characterization of land urbanization.

3.3.2. Ecological Risk Assessment

Risk plot determination: Landscape structure and landscape dynamics have significant scale effects, and different scales have a greater impact on the results of landscape pattern analysis. By choosing an appropriate scale domain analysis, we can effectively reveal the research phenomenon’s patterns and processes or things [64]. The landscape risk plot was empirically selected as 2–5 times the average area of the landscape patches in the study area for multiple debugging [65]. Therefore, we chose a 5 km × 5 km grid with equal spacing systematic sampling method. At last, a total of 181,705 sample plots were generated, which can reflect the spatial differentiation pattern. According to the ecological risk index model, the ecological risk index of each sample point is calculated and assigned to the center point of each sample point. Then the spatial pattern characteristics of ecological risk in the study area are analyzed by a Kriging spatial interpolation method.
Landscape index calculation: The component composition of the landscape and its spatial form can be reflected using the landscape pattern index [64]. Landscape risk mainly depends on external factors (anthropogenic disturbance) and internal factors (the ability of the landscape to maintain its own ecological stability) [23]. However, there is no best method to measure the landscape risk index, which is mainly based on the study scale and land use of the study area. Therefore, with reference to previous studies [35,36,37], we measured the landscape dominance index (D), the fragmentation index (C), and the separation index (F), and constructed the landscape disturbance index. Then we combined an expert scoring method, a hierarchical analysis method and a literature analysis method to construct the landscape vulnerability index. Finally, we established the loss index. Fragstasts 4.2 and Patch Analyst were used to calculate each landscape pattern index; the expressions and ecological meanings of each landscape index are referred to in the manual of Fragstasts 4.2.
Ecological risk evaluation: Land use landscape components are more accessible to preserve and obtain than ecological monitoring information. Using the area weight of each land-use type allows us to construct a land-use ecological risk index which can better reflect the ecological risk level in the sample area. The spatial sampling method was used to obtain the spatial representation of ecological risk, reflecting the ecological processes of regional landscape patterns or the influence of functions [66]. The calculation formula was as follows.
E R I k = i = 1 m A k i A k × L i
ERIk is the ecological risk index of the k sample area of the landscape. Li is the landscape loss index. Aki stands for the study area, Ak is the area of the k sample area, m is the number of land-use types in the sample area grid, and i stands for the six different land-use types.

3.3.3. Coupling Coordination Degree Model

(1) Coupling degree function
Using the concept of capacity coupling in physics and the model of a capacity coupling coefficient, the coupling degree model of multi-system (or element) interaction is generalized. Therefore, the change coupling degree function between population urbanization, economic urbanization, and land urbanization can be expressed as [67].
C = ( ( u 1 u 2 u 3 ) / ( ( u 1 + u 2 + u 3 ) / 3 ) 3 ) 1 3
In the formula, C stands for the coupling degree of population urbanization, economic urbanization, and land urbanization, and C ∈ [0, 1], u1, u2, u3 are the combined index values of population urbanization, economic urbanization, and land urbanization, respectively.
(2) Coupling coordination degree model
The coupling coordination model reflects the coordination status in the changing interactive coupling process of population urbanization, economic urbanization, and land urbanization, which is calculated as:
D = ( C × T ) 1 / 2
T = a × u 1 + b × u 2 + c × u 3
In the formula, D stands for the coupling coordination degree, C stands for the coupling degree; T stands for the combined index values of population urbanization, economic urbanization, and land urbanization; u1, u2, and u3 stand for the combined development of the level of population urbanization, economic urbanization, and land urbanization, respectively; a, b, and c are the coefficients to be determined, and considering the regional characteristics, this study adopts the equal weight method to set the value of all three coefficients to 1/3, aiming to improve the overall urbanization level.

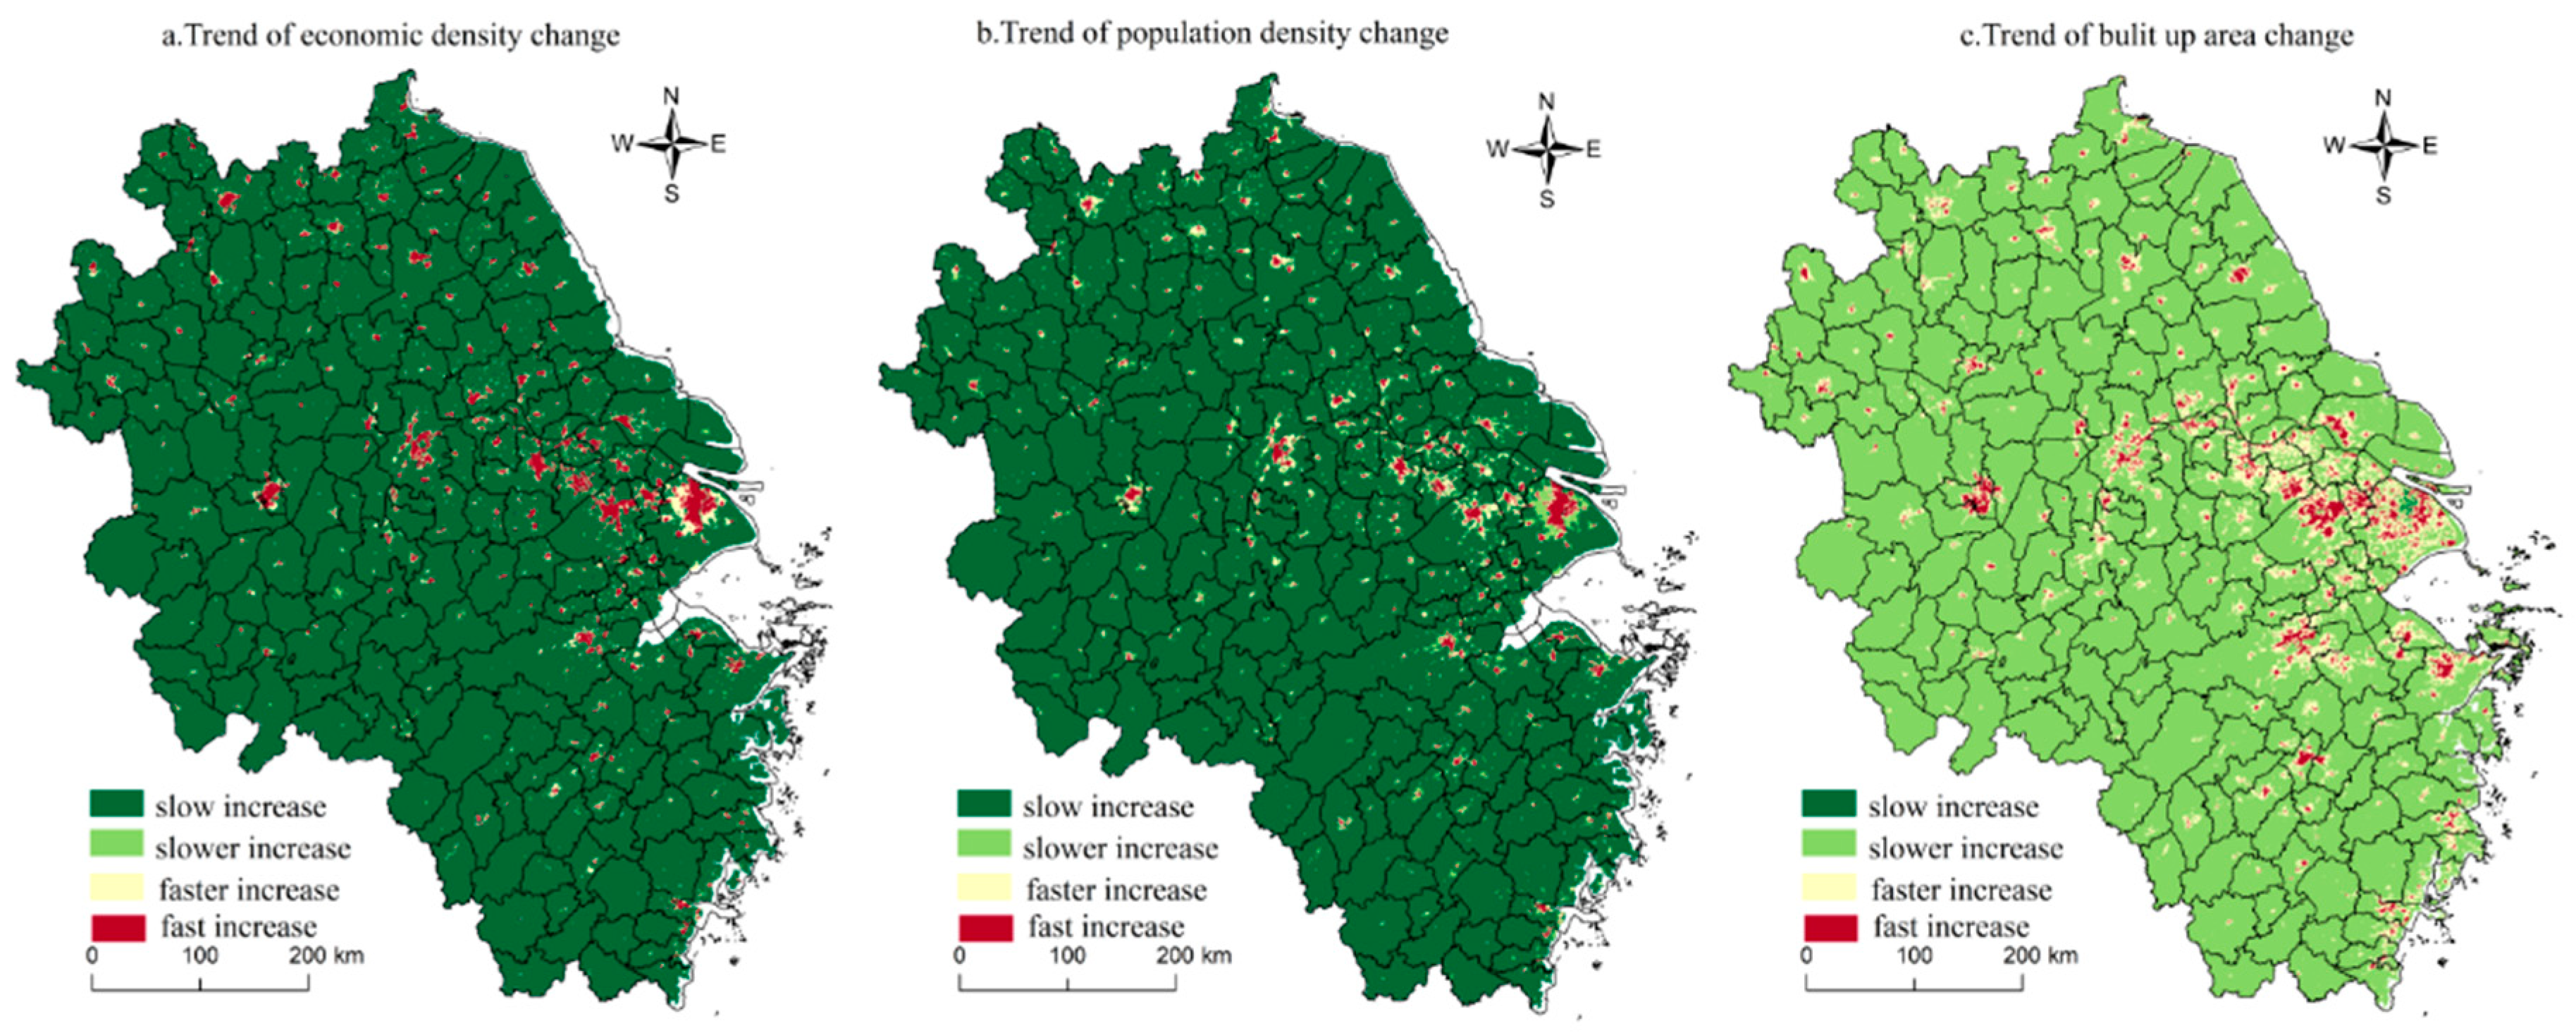
3.3.4. Change Trend Analysis

The changing trend between two variables can be analyzed using the slope in a one-dimensional linear regression equation. This study selected an urbanization coupling coordination degree and ecological risk as independent variables, and times as the dependent variable, respectively. The slope of the one-dimensional regression equation is used to analyze the trend of changes in the independent variables using the least-squares method [62]. The calculation formula is as follows:
k = n × i = 1 n ( i × S i ) i = 1 n i × i = 1 n S i n × i = 1 n i 2 ( i = 1 n i ) 2 k = n × i = 1 n ( i × S i ) i = 1 n i × i = 1 n S i n × i = 1 n i 2 ( i = 1 n i ) 2
In the formula, k stands for slope, n stands for the number of time points; i stands for time; and Si is the statistical number of image elements.

4. Results

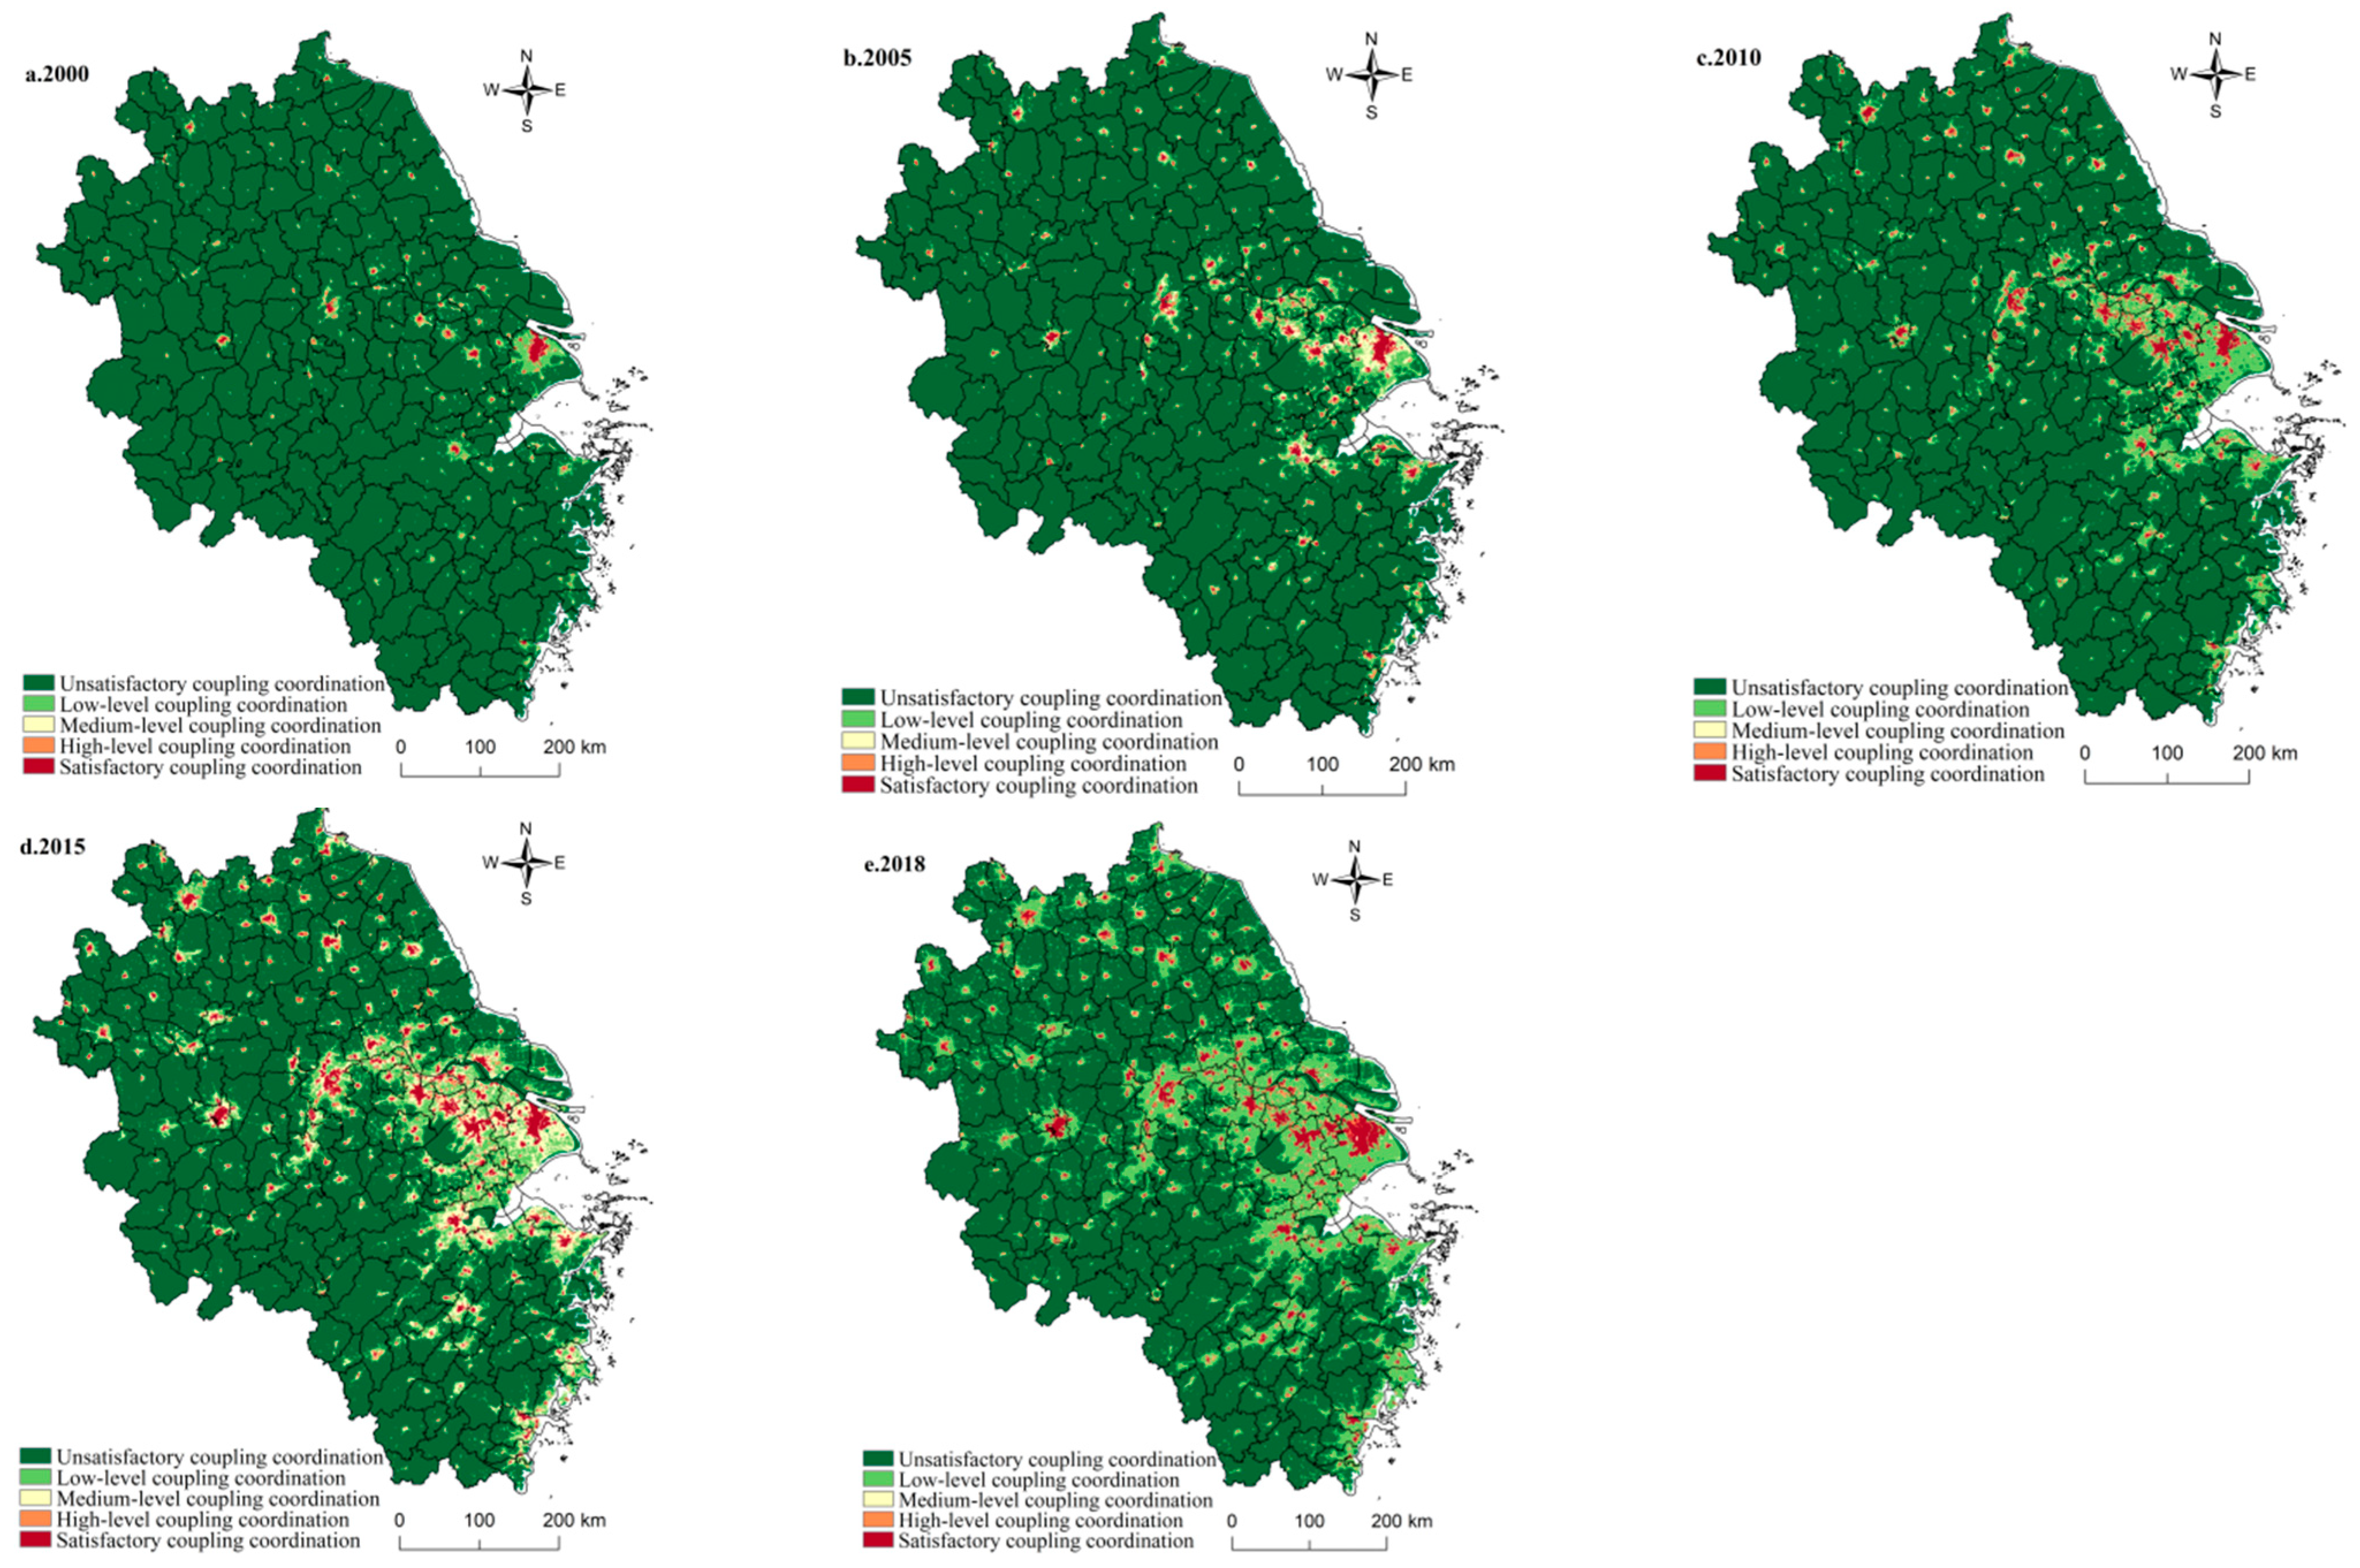
4.1. Spatio-Temporal Development Process of Urbanization’s Coupling Coordination Degree in the Yangtze River Delta

From 2000 to 2018, the urbanization coordination level in the Yangtze River Delta continued to improve, and the speed continued to accelerate. The coupling coordination degree increased from 0.0116 to 0.0687, with a change rate of 494.27%. This indicates that urbanization development in the Delta is in a high-quality development stage of integrated, multidimensional, comprehensive, and coordinated urbanization. Based on the natural fracture method, the urbanization coupling coordination degree was divided into five levels from low to high: unsatisfactory coupling coordination degree (<0.0980); low coupling coordination degree (0.0980–0.3057); medium coupling coordination degree (0.3058–0.4782); high coupling coordination degree (0.4783–0.6545); and satisfactory coupling coordination degree (>0.6546) (Figure 4).
In 2000, the coupling coordination of urbanization in the Yangtze River Delta was weak (0.0116). The unsatisfactory coupling coordination patches accounted for 96.45%, which were widely distributed in a continuous pattern throughout the region. There were 8427 (2.41%) patches with a low coupling coordination, which were wrapped around the periphery of the satisfactory coupling coordination patches in a circular pattern, clustered in the periphery of the central cities and irregular in shape; 1430 (0.41%) patches of medium coupling coordination were distributed in a scattered pattern in the central towns, and 1551 (0.44%) high coupling coordination map units were adjacent to the satisfactory coupling coordination map units. The number of satisfactory coupling coordination map units was only 0.29%, mainly concentrated in the central cities (Shanghai, Nanjing, Hangzhou, Suzhou-Wuxi-Changzhou, etc.)
In 2005, the coupling level of urbanization in the Yangtze River Delta was enhanced compared with that in 2000, and the mean value of regional coupling coordination was 0.0226, which was still low. Regional differences tended to soar and the satisfactory coupling coordination degree was concentrated in the central cities, and the east–west divergence was strengthened. Among them, the number of unsatisfactory and low coupling coordination spots was 6457 less than that in 2000, but the proportion was still as high as 97.01%; the number of medium coupling coordination spots was 3423 more, which presented a belt-type spreading trend in the line of Shanghai, Suzhou-Wuxi-Changzhou, and Nanjing. Hangzhou, Ningbo, and Hefei showed signs of patchy intensification more strongly. The number of higher coupling coordination map units increased (2933 in total) and were mainly located between higher and lower coupling coordination map units, with buffering and transition effects. The number of high coupling coordination map units increased significantly (1652 map units in total) spatially, with Shanghai, Nanjing, Suzhou-Wuxi-Changzhou, and Hangzhou as the multipolar centers.
In 2010, the degree of urbanization coupling and coordination in the Yangtze River Delta continued to increase with an average value of 0.0415. The county gap widened, and the east–west differentiation characteristics were further locked. The proportion of unsatisfactory coupling and coordination map units decreased to 87.15%, but spatial distribution did not shift much compared with the past. The number of low coupling coordination degree map units increased, with the proportion rising to 7.16%, showing a Z-type spatial pattern mainly concentrated in the surrounding areas, such as Shanghai, Hangzhou-Jiaxing-Huzhou, and Suzhou-Wuxi-Changzhou. The number of medium coupling coordination map units also decreased, which were scattered in the center of each county unit in the form of sporadic points; higher coupling coordination map units accounted for 1.43%, spreading from the central city to the surroundings in a radiation diffusion way; the satisfactory coupling and coordination map units had an axis development trend compared to before, with the clusters in the Hefei, Ningbo, and Xuzhou city centers beginning to increase.
In 2015, the coupling coordination of urbanization in the Yangtze River Delta rose slightly, with the mean value of regional coupling coordination increasing slightly to 0.0578. At the same time, the regional differences narrowed, and the polarization center jumped the overall spread. The number of unsatisfactory coupling coordination map units in Shanghai, southern Jiangsu, and northeastern Zhejiang transitioned to a lower coupling coordination; the number of unsatisfactory coupling coordination map units in the region decreased, and the proportion of lower coupling coordination map units increased significantly (12.81%). The number of medium coupling coordination map units and the spatial distribution range increased, with the structural characteristics of spatial balance beginning to emerge. The change in the number of units and the spatial spread of the higher coupling coordination map units were not significant. The number of units of satisfactory coupling coordination map spots further increased to 7746, the network-like structure of the southern Jiangsu region appeared, and the central map units of Hefei City and Xuzhou City continued to expand.
In 2018, the degree of urbanization coupling coordination in the Yangtze River Delta continued to increase, with the regional average value of coupling coordination being 0.0687. However, the regional difference transitioned from polarization to equilibrium. The proportion of unsatisfactory coupling coordination degree map units dropped to 71.33%. The proportion of low coupling coordination degree map units quickly increased to 23.86%, Shanghai-Sunan-North Zhejiang became a continuous patch and a subtle line between the high and low values in northern Jiangsu and northern Anhui regions was revealed, which was related to the implementation of the Yangtze River Delta integration policy, truly regional connections and strengthened integration. The medium and high coupling coordination degrees changed slightly compared with 2015. The number of map units in the satisfactory coupling coordination degree was still increasing (7868), in which the spatial distribution had the characteristics of ‘one pole, many strong small centres’. Shanghai was the core, and Suzhou-Wuxi-Changzhou, Nanjing, Hefei, and other provinces were the strengthening zones, with jumping spreading forms of sporadic minor strengthening points in northern Jiangsu, northeastern Zhejiang, and northern Anhui.
The coupling coordination degree of the Yangtze River Delta’s urbanization has two characteristics. (1) From the perspective of pattern characteristics, the spatial distribution of urbanization coupling coordination degree has path-locking characteristics. Satisfactory coupling coordination decreased from the core to the periphery, mainly in Shanghai, Suzhou-Wuxi-Changzhou, Nanjing, and Hangzhou. However, the higher and medium coupling coordination degrees did not fully play the roles of transition and link, respectively. (2) In terms of evolution characteristics, from 2000 to 2018, the evolutionary context of urbanization coupling coordination degree in the Yangtze River Delta had an overall trend of localized agglomeration points to whole spread. 2000–2010 was the polarization stage of urbanization coupling and coordination degree to the agglomeration of regional central cities, in which regional, inter-provincial, and intra-county differences increased due to the gradient of economic development, the hierarchy of the industrial structure, the trend of population movement and the efficiency of resource utilization. In addition, the polarization process gradually transformed from the initial single-core agglomeration center (Shanghai) to the multi-core agglomeration point (Nanjing, Suzhou-Wuxi-Changzhou, Hangzhou) at the same time as the scope of polarization spread grew. Afterwards, as the integration of the Delta became a national development strategy in 2007, it entered the diffusion stage of urbanization coupling coordination degree after 2010, and the state of balanced regional development began to appear. In northern Anhui, northern Jiangsu and northeastern Zhejiang, there were many map units of satisfactory coupling and coordination degree. The diffusion model was also transformed from radiation diffusion and hierarchical diffusion to jump-diffusion.

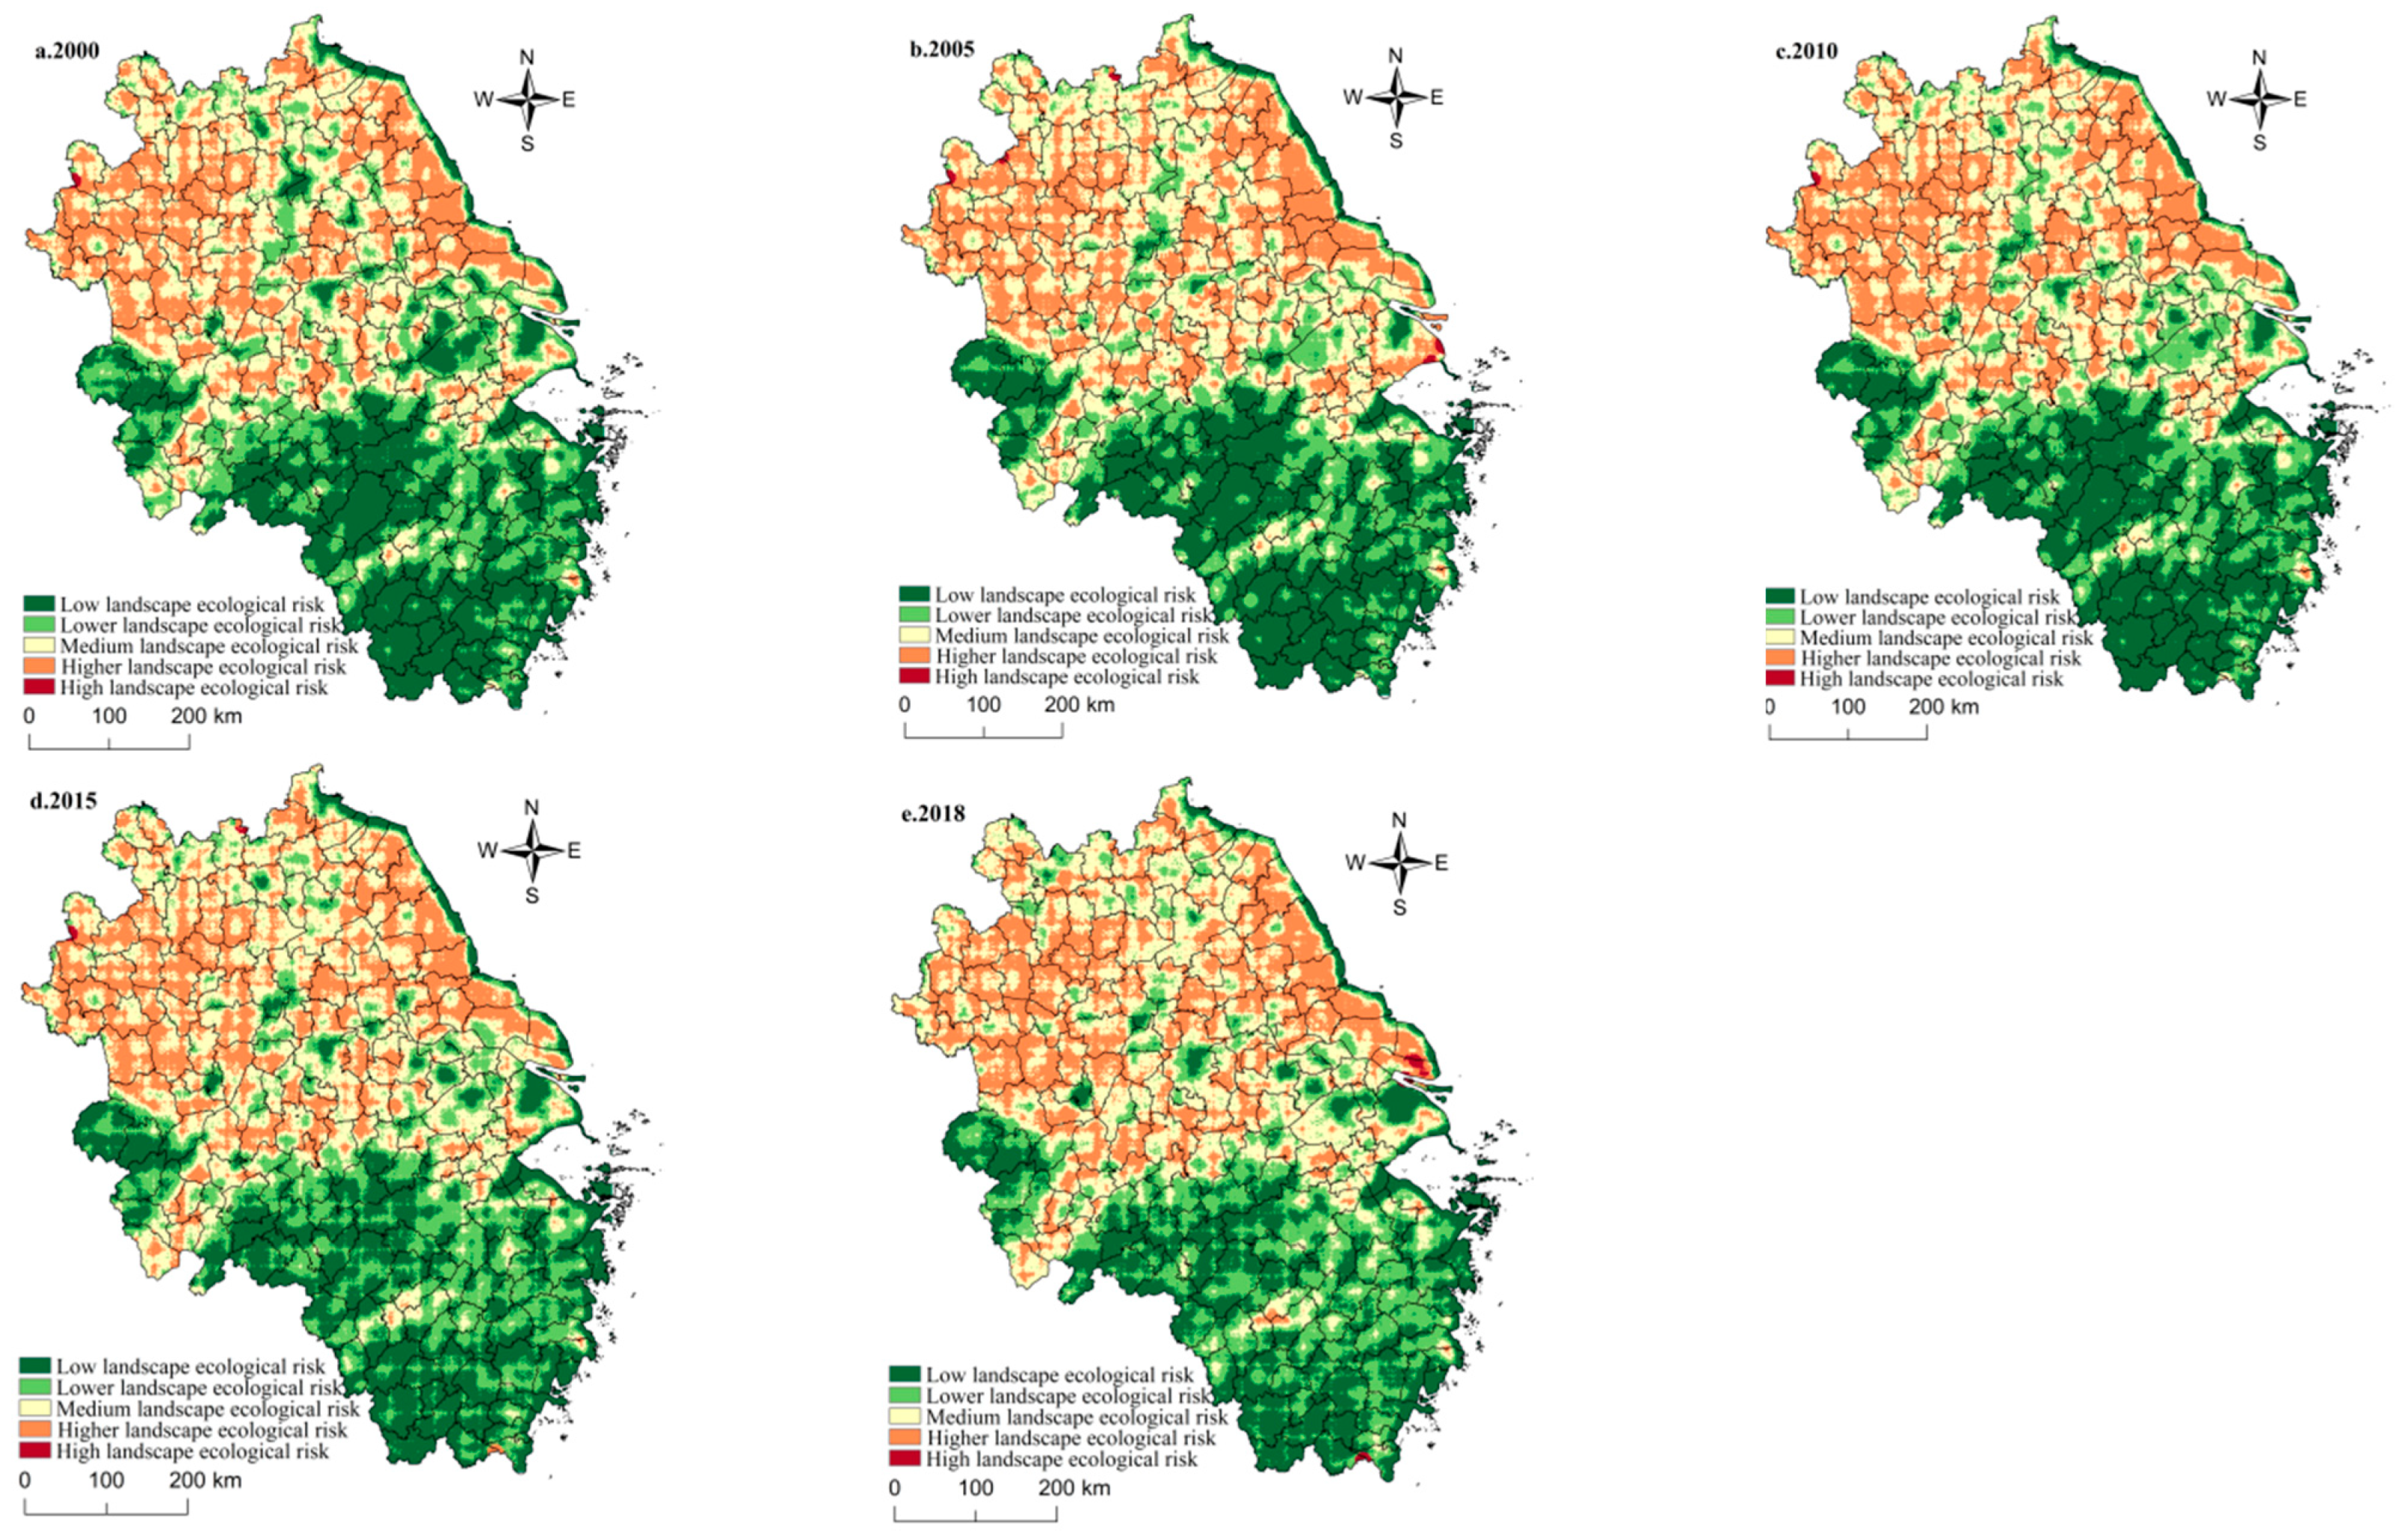
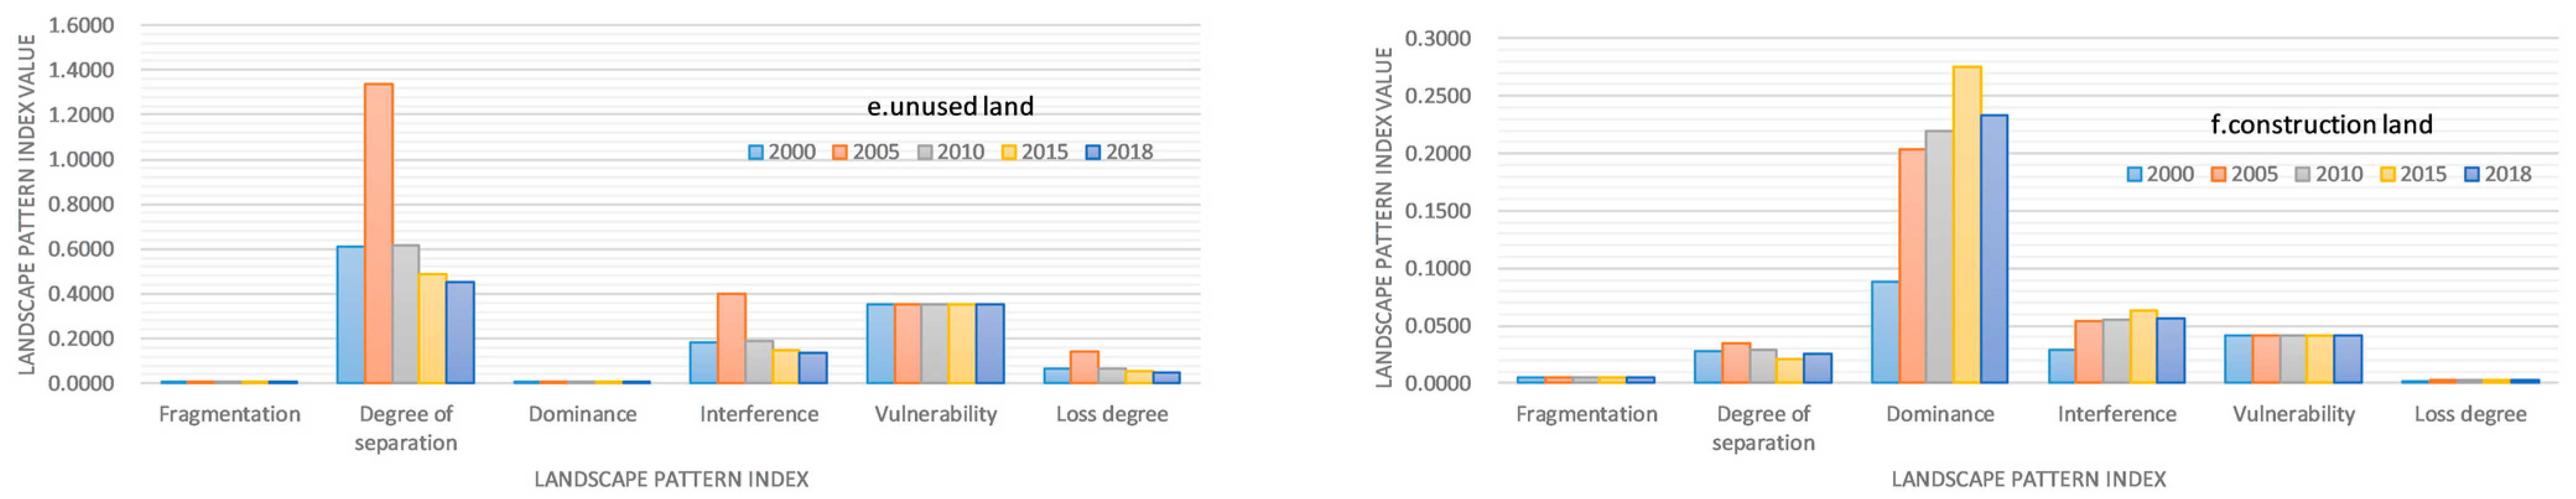
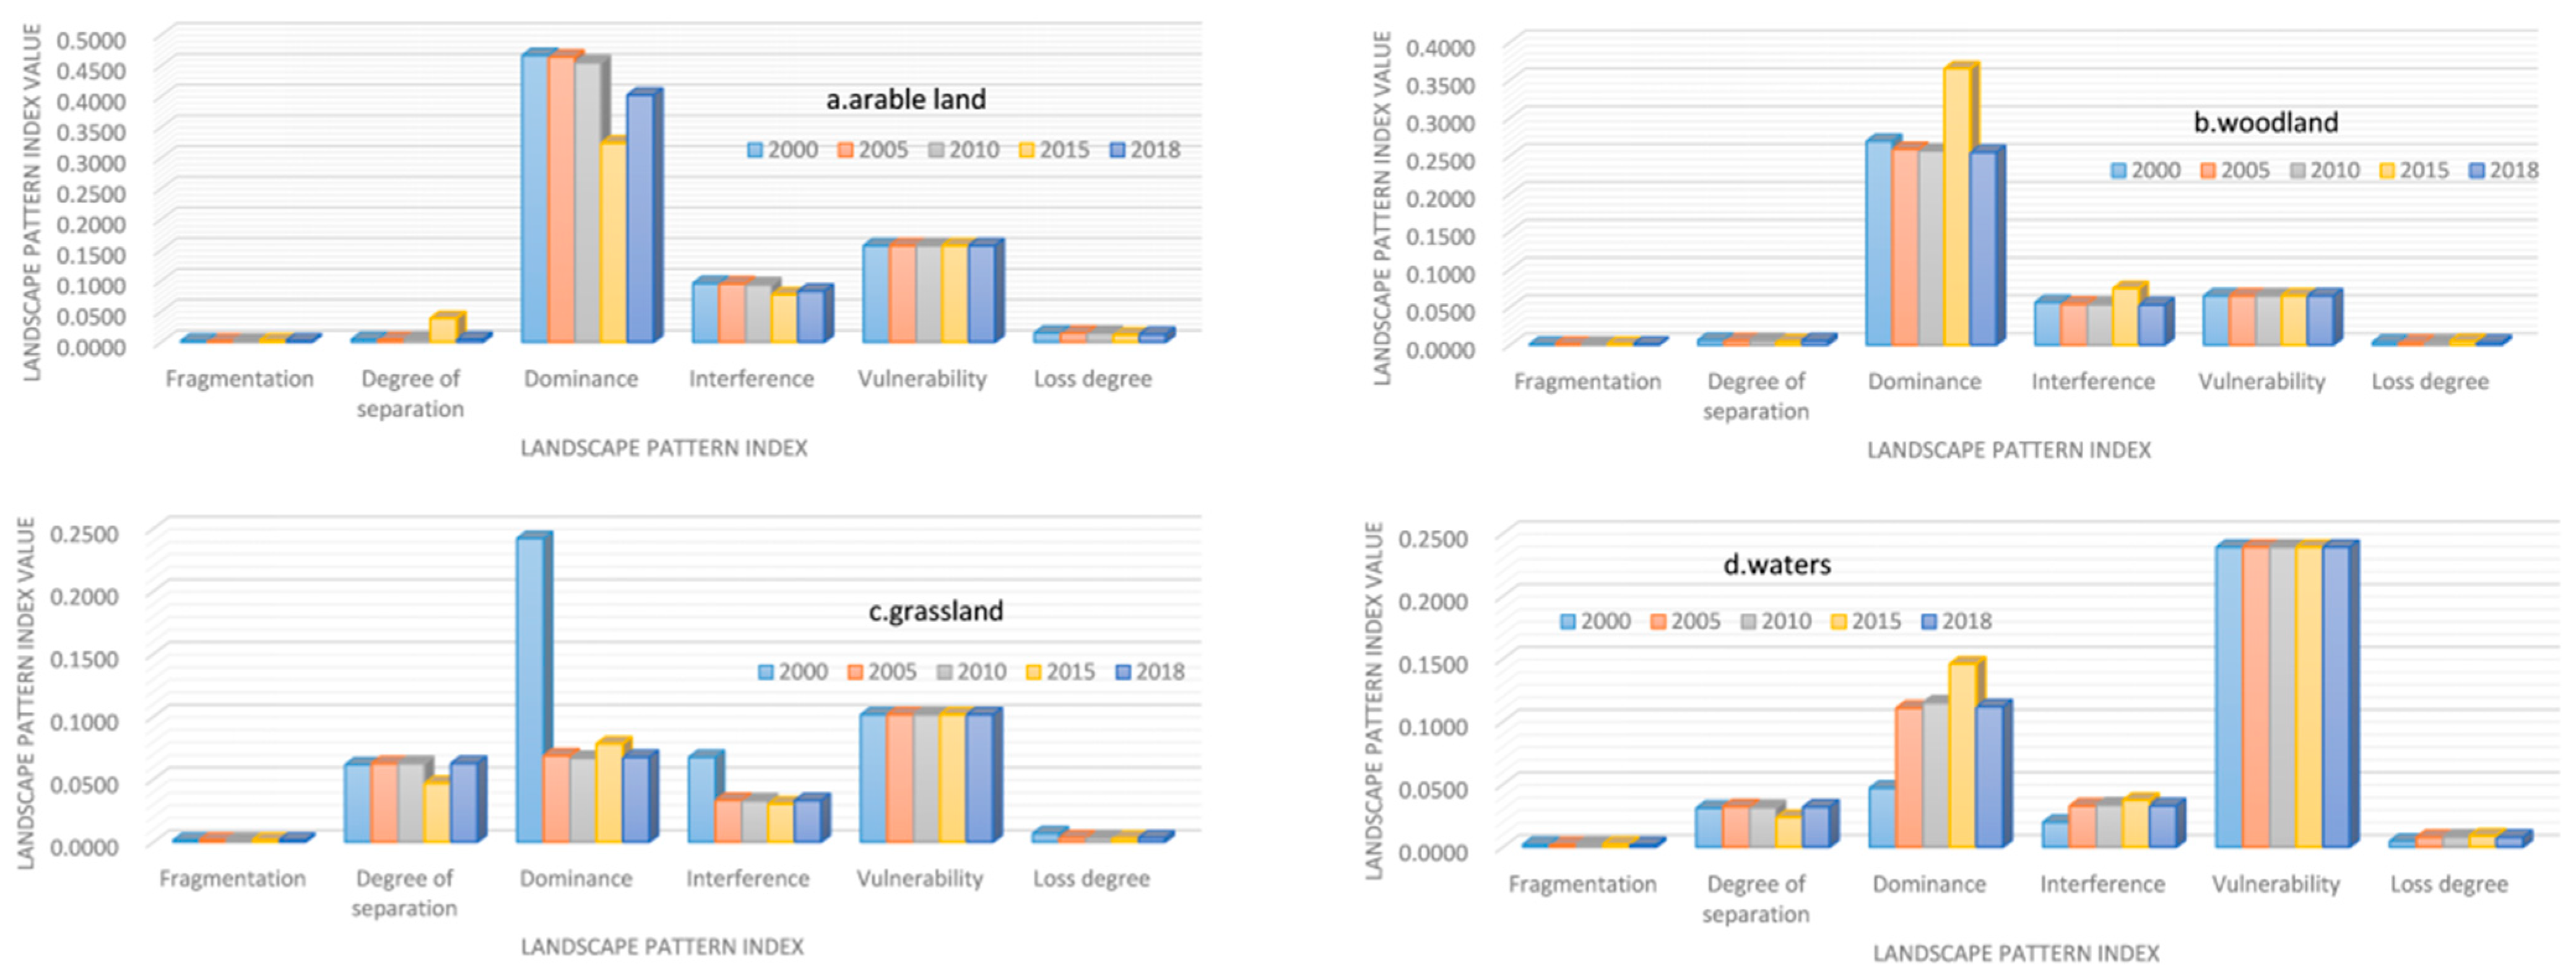
4.2. Spatiotemporal Evolution Characteristics of Ecological Risk in the Yangtze River Delta

The regional risk value was divided into five levels based on the natural fracture method: low risk (0–0.0061), lower risk (0.0062–0.0092), medium risk (0.0093–0.0121), and higher risk (0.0121–0.0203) and high risk (>0.0203). After spatial interpolation, the spatial distribution map of ecological risks in the Yangtze River Delta from 2000 to 2018 (Figure 5) was derived. With the help of regional statistical tools, the risk values in different regions and periods were obtained.
From 2000 to 2018, ecological risk in the Yangtze River Delta tended to weaken, dropping from 0.0091 to 0.0082, with a change rate of −10.03%. Spatially, the distribution of risk values was characterized by a pattern of homogeneous aggregation and heterogeneous isolation, with a high north and a low south and a manifest circle structure. Specifically, in 2000, the average ecological risk of the entire region was 0.0091. The low and lower ecological risk areas occupied the dominant position (accounting for 26.42% and 21.88%, respectively) and were mainly distributed along the northern part of the southern Anhui Mountains to the Taihu Lake Rim, such as the Dabie mountains, the Taihu Lake Plain and mountainous and hilly areas in southwestern Zhejiang (e.g., Shucheng, Suzhou, Longquan, Qingyuan, Chun’an, etc.) Water and woodland were the dominant landscapes in these areas, so the overall landscape dominance and connectivity were high(Figure 6). The proportion of medium and higher risk areas was relatively large (50.17%), forming a heterogeneous pattern of north–south isolation from low-risk areas, especially in the northeastern coast of Jiangsu and the northern plains of Anhui, where the risk was relatively high (e.g., Sheyang, Dongtai, Suixi, Huaiyuan, etc.) Arable land and construction land were embedded in the medium- and high-risk areas, causing patches in these areas to be cut easily by transportation land and water. Hence, the land structure was diverse and complex, resulting in high separation and loss. High-risk areas accounted for a small proportion (0.05%). They were mainly distributed across areas with an apparent expansion of built-up areas (e.g., Bozhou, Suzhou, etc.) because construction land invades cultivated land and ecological land, resulting in increased regional fragmentation.
In 2005, the ecological risk value of the Yangtze River Delta slightly increased (0.0095), but the areas of low and lower ecological risk decreased to 45.46% compared to 2000. During this period, construction land occupied more arable land, which decreased by 3788.84 km2. Hence, the predominance and interference degree of construction land was significantly increased, indicating that the interference effect of human activities had increased. The areas of medium risk and higher ecological risk increased to 54.35%. Due to the expansion of construction land, it was still mainly external expansion that was squeezing ecological land use and arable land, exacerbating extensive and acceptable land use in built-up areas and in urban–rural transition zones. The separation of construction land and unused land increased significantly, which exacerbated regional ecological risks. High ecological risk areas were concentrated in Shanghai, Bozhou City and other places (0.19%); these areas were mainly composed of water and cultivated land with greater vulnerability, high intensity of human activities, significant landscape heterogeneity, and high risks.
In 2010, the regional risk decreased (0.0091), the proportion of medium risk areas was still high (28.19%), and the spatial impact spread to northern and southern Jiangsu and the Hangzhou-Jiaxing-Huzhou regions. For all the regions referred to, construction land and unused areas with high fragility were expanded such that loss and interference increased immediately (Figure 5). The areas of low risk and more low risk increased by 1.70% compared with 2005, as the picture of ecological risk in Zhejiang and the southern Anhui mountainous areas with high vegetation coverage gradually decreased. Lastly, higher and high ecological risk areas did not change much (the proportion increased by only 0.16%).
In 2015, the expansion of built-up areas in the Yangtze River Delta was restricted by policies. Therefore, ecological risks were reduced, with a regional average of 0.0083. The higher ecological risk area gradually degenerated into a medium risk area, leading to the medium risk area increasing to 30.75%. The fragmentation of the regional landscape also decreased; in particular, the fragmentation of construction land decreased significantly (−0.0024). At the same time, the measures of retreating from farming and lakes and protecting forest land were vigorously implemented, thereby enhancing the advantageous degree of green ecological lands such as forest land and water. The low risk and lower risk areas remained at 46.58%. Meanwhile, in the northwest and central Zhejiang, the large low ecological risk areas tended to shift to lower risk areas, resulting in a decrease of 3.97% of the total low-risk areas, which is related to the encroachment of forest land due to the significant expansion of arable land and construction land in the district during this period.
In 2018, the ecological risk of the Yangtze River Delta was still showing a slight decline. However, in southern Anhui, Zhejiang mountainous and hilly areas, the low-risk range was narrowing, causing the overall low ecological risk areas to climb to lower ecological risk areas and medium risk areas. As shown in Figure 4, the three areas accounted for 20.89%, 24.56%, and 24.03%, respectively. The areas with high ecological risks did not change much.
In conclusion, the ecological risks of the Yangtze River Delta were deeply affected by rapid urbanization, in which the fragility (internal factors) and disturbance (external factors) of landscape components together formed a spatial differentiation pattern of regional ecological risks. On the one hand, high and higher ecological risk areas were concentrated around built-up areas and urban–rural transition zones, while low and lower ecological risk areas were concentrated around waters and woodlands; on the other hand, the isolation of high–low ecological risk areas was evident.

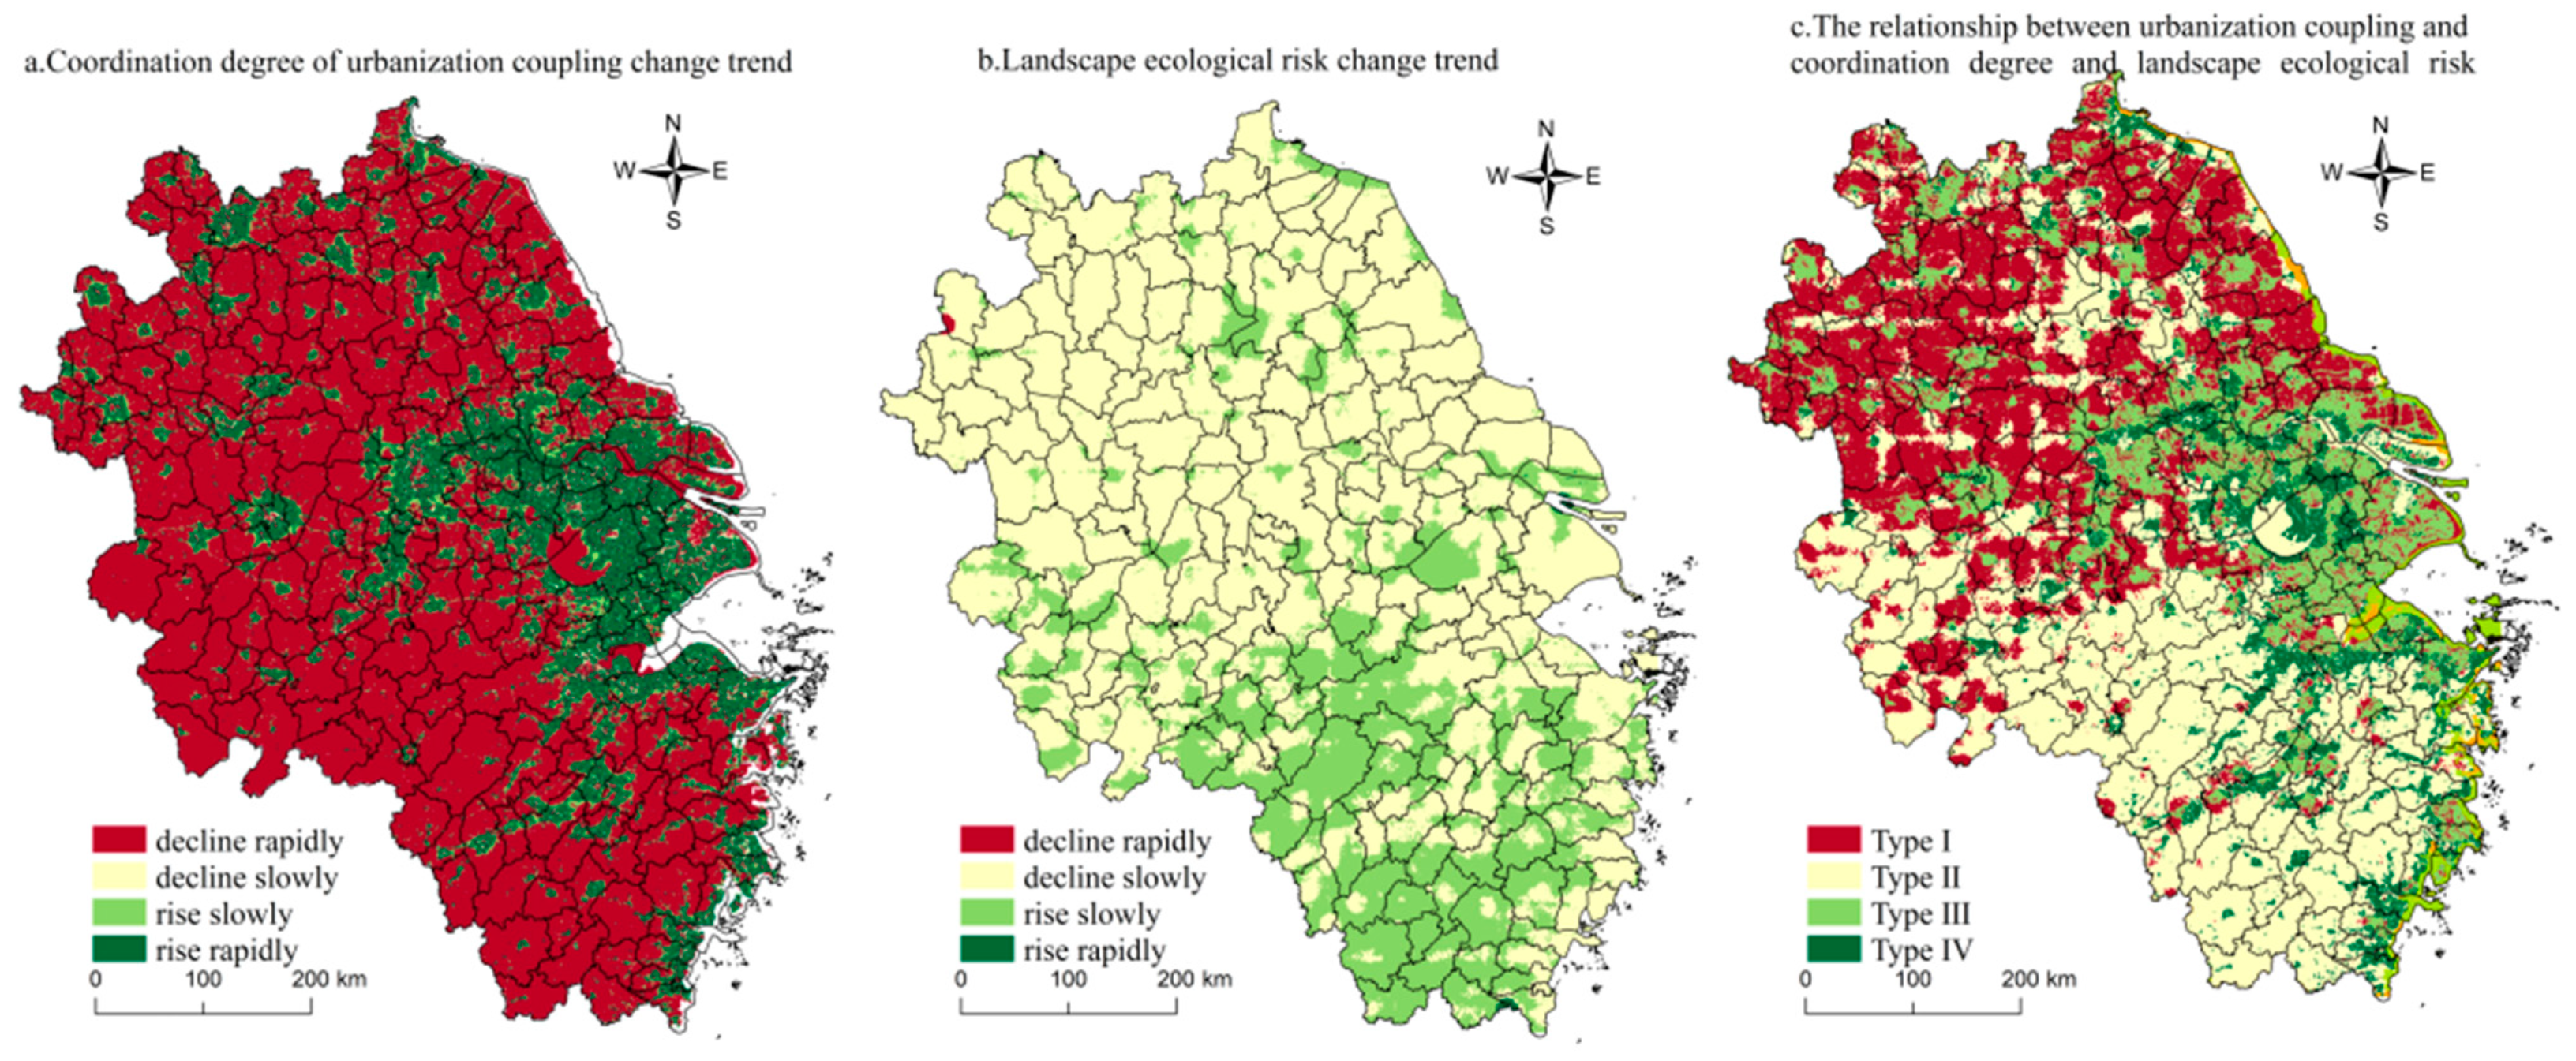
4.3. Ecological Risk Response Pattern of the Coupling Coordination Development of Urbanization in the Yangtze River Delta

Previous studies on urbanization and the ecological environment mostly drew conclusions based on their quantitative correlation analyses, such as the standard heterogeneous growth model, coupling coordination, elasticity coefficient, decoupling analysis, Pearson correlation, grey correlation, and STIRPAT analysis. There are many ways to associate things, such as direct/indirect and internal/external, but correlation analysis provides only one phenomenon. A positive correlation between the two does not mean promotion and enrichment, whereas a negative correlation does not necessarily mean they inhibit each other. Thus, there should be some similarities in their development process and ways, and urbanization’s ecological risk response mechanism is far more complex than its appearance [40]. Hacken’s synergy considers the synergy between complex systems, such as the coordination and cooperation between components under the control of sequential parameters, to promote the development of the overall system in the same direction in order to finally achieve the order of the overall system [68]. Accordingly, the current study used the least-squares method to fit the 1-D linear regression equation and employed geographic information mapping to achieve the interrelated analysis of the trend changes between the two.
From 2000 to 2018, the coupling coordination degree of urbanization in the Yangtze River Delta increased, while the ecological risk of the landscape tended to decrease (Figure 7), indicating that the coercion of urbanization on the ecological environment was improving, consistent with the findings of existing empirical studies [69]. The rapidly increasing urbanization coupling coordination zone area accounted for about 20.04%. It was distributed in a polycentric set-core pattern in Shanghai, Suzhou-Wuxi-Changzhou, Hangzhou-Jiaxing-Huzhou, Nanjing-Zhenjiang-Yangzhou, and Hefei metropolitan areas with a high degree of integration, where geographical location, population distribution, industrial structure and traffic arteries significantly influenced the degree of synergy. Meanwhile, development was slightly lagging in northern Jiangsu, northern Anhui, and the central Zhejiang basins and hilly areas, scattered in a point-axis or stripe pattern. This finding indicated that the stage of economic, social development and topography were also factors affecting the degree of urbanization coupling coordination [42]. The rising and slowly rising areas mainly surrounded the edge of the built-up areas. Nevertheless, the degree of urbanization coupling coordination on a large scale decreased, mainly in the mountainous hills around the Yangtze River and lakes and the Yellow and Huaihai plains; this decrease was related to differences in technology level, industrial structure, environmental protection, the threat of water pollution and water disasters (e.g., eutrophication of rivers and lakes, groundwater pollution, etc.) and soil pollution (e.g., soil slabbing, heavy metal pollution, etc.), such as that triggered by domestic sewage, industrial wastewater, and agricultural surface source pollution. All these are still serious, indicating that the overall coordinated urbanization development in the Yangtze River Delta region is still at the developmental stage and requires vigilance against the infiltration and the transfer of low-end industries in areas with advantageous coordinated urbanization development.
Figure 7b depicts the apparent trend of regional ecological risk decreasing in the north and increasing in the south. The landscape ecological risk tends to increase in the Dabie mountains, the mountains of southern Anhui, the hilly areas of western Zhejiang, the mountains of southern Zhejiang, the ring of Taihu Lake, Hongze Lake, the northern coast of Jiangsu and the estuary of the Yangtze River, indicating that the urbanization process has a more robust response to the stress of the ecological environment. Ecological risk gradually decreased after spreading outward from the above ecological land because the ecosystem was resilient and self-healing and more vulnerable to solid disturbance by human activities. Above all, it is necessary to strengthen territorial spatial planning by setting the necessary bottom line and resilient space according to the resource and environmental carrying capacity and by coordinating the ecological safety space and social development.
The inverse correlation between urbanization coupling degree and ecological risk in the Yangtze River Delta was the central dynamic of regional development (Figure 7c). Guided by policies such as ecological reforestation, urban greening, green eco-efficiency and the return of farmland and lakes (forestry), the increased coordination of urbanization coupling in Zhejiang Province, Jiangsu Province and Shanghai effectively reduced local ecological risks. More than that, the industrial structure, science and technology, and population quality in these regions were better, and pollution control and environmental awareness were higher. Nevertheless, many Type I pixels appeared in the majority of Anhui Province and northern Jiangsu Province, indicating that the ecological risk of urbanization in the late-developing areas may be more challenging to manage. This was since, on the surface, these areas undertake industrial transfer, which temporarily and rapidly improves the local urbanization process, but the risk leads to concealment and lag and long-term accumulation of risk explosive progress in the process. The number of Type IV pixels was tiny (3.85%), mainly located in the area around Taihu Lake, where the intensity of human social activities was high. However, with the awakening of ecological awareness and the improvement of ecological compensation mechanisms in the Taihu Lake basin, this type will gradually shrink.
Type Ⅰ indicates that the coupling coordination degree of urbanization and the ecological risk of landscape decrease. Type Ⅱ indicates that the coupling coordination degree of urbanization increases and the ecological risk of landscape decreases. Type Ⅲ indicates that the coupling coordination degree of urbanization decreases and the ecological risk of landscape increases. Type Ⅳ indicates that the coupling coordination degree of urbanization and the ecological risk of landscape increase.
To comprehensively and deeply explore multidimensional urbanization and its ecological risk response, the urbanization system was decomposed into crucial dimensions, such as population, economic, and land [18]. The results show the following:
Population urbanization: During 18 years, the total population of the Yangtze River Delta increased rapidly, with an average annual increase of 1,487,900 people/year (14.34%). The regional average population density also increased from 101 people/km2 to 249 people/km2, reaching 146.53%. These figures indicated that the population attractiveness of the Yangtze River Delta was solid and sustainable. Spatially, the inflowing population in the Delta continued to cluster in the central cities and had a moderate tendency to disperse, with Shanghai as the polarization center; population densities in Suzhou-Wuxi-Changzhou, Hangzhou-Shaoxing-Ningbo, and Nanjing-Zhenjiang-Yangzhou were also growing faster (Figure 8). Population density and consumption level in the Yangtze River Delta were growing simultaneously, and according to the statistical yearbook of the provinces and cities in the Yangtze River Delta, the average annual consumption expenditure per person in urban households in the Delta from 2000 to 2018 increased by an average of RMB 6230.84 per year, posting a growth rate of 394.23%. Consumption was the endogenous driving force of urban economic development. Dense population and growing consumption levels form an endogenous circulatory system while people consume limited regional resources (e.g., land, water, infrastructure, public services, etc.) The proliferation of household consumables and pollutant emissions had likewise placed tremendous pressure on the bearing capacity of resources and the environment, resulting in an increased probability of ecological risk threats.
Additionally, according to the China Education Expenditure Statistical Yearbook (2001–2019), due to the additional $7,246,059.20 investment in education expenditure in the Yangtze River Delta from 2000 to 2018, education in the Delta region has developed steadily. The population quality had improved significantly, making the region one of the most highly educated regions Chinese. On the one hand, high-quality population groups contributed to the formation of green culture and environmental awareness, low-carbon consumption and green travel habits; on the other hand, they also promoted technological progress, clean production and energy use efficiency. Eventually, the moderate population size and high population quality will mitigate ecological risks.
Economic urbanization: Economic density increased from 586,700 yuan/km2 in 2000 to 25,919,600 yuan/km2 in 2018. The rapid increase in industrialization induced frequent air pollution, water pollution and soil heavy metal pollution. According to scholars, the overall PM2.5 concentration in the Yangtze River Delta from 2000 to 2017 was upward, and the air quality was worrying [70]. Notably, the haze was not a local environmental dilemma. However, it would produce spatial spillover effects due to the diffusion or transfer of atmospheric circulation and other factors, easily expanding the spatial extent of ecological risk threats. The problems of domestic sewage and agricultural and industrial wastewater in the Yangtze River Delta were also prominent, leading to repeated environmental stress problems such as cyanobacteria in Taihu Lake and black water in Hongze Lake. The Yangtze River basin was located in the lower reaches of the Yangtze River, where many noxious substances from the upper and middle reaches gather downstream and where sediment precipitation and runoff velocity decrease, making it difficult to self-clean the accumulated harmful substances. The majority of heavy industrial plants (e.g., petrochemical plants, iron, and steel plants, etc.) in the Yangtze River Delta were also built along the river, so solid industrial discharges were dispersed with the water flow, spreading the ecological risk in a point-to-point and comprehensive manner. However, the development of industrial coercion of the ecological environment was not continuously serious; with the awakening of ecological awareness, capital accumulation and technological progress, such a development could also promote the upgrading and adjustment of the industrial structure, the process of energy-saving and emission reduction technology, and the emergence of the lightweight and clean industry. Furthermore, it could reduce non-desired output, improve green ecological efficiency, and further spread clean production technology. At the same time, the five major central cities of Shanghai-Nanjing-Suzhou-Hangzhou-Ningbo have taken on the phenomenon of industrial transfer, and the ‘retreat of two into three’ has led to the mitigation of local ecological risks.
Land urbanization: Land urbanization was manifested by the increase of non-agricultural land and the decline of agricultural land, which would very likely change the soil sub-bedding surface, increase the impervious surface, and affect the surface runoff and local climate circulation among various other outcomes, thus changing soil properties through natural factors such as rainfall-intensified soil erosion and enriched soil heavy metal pollution elements. From 2000 to 2018, the average nighttime light intensity in the Yangtze River Delta increased from 0.23 to 2.26, with the area of urban construction land also increasing from 5754.84 km2 to 17,179.55 km2. These figures indicated that the built-up area expanded rapidly during the study period, mainly in an outward expansion and encroaching on the natural ecological land in the surrounding areas. According to the study, urban land expansion in the Yangtze River Delta was mainly driven by population and economic development [71]. However, more population inflows would increase the spatial demand for urban infrastructure construction.
Furthermore, the increasing price of land in the central city led to rising production costs for enterprises, forcing commercial, industrial, and residential land use to the far suburbs. At the same time, the disorderly expansion and lack of functional land-use planning resulted in a disorderly and inefficient land-use structure or overly mixed, high-intensity structures in some areas, with a large amount of idle land, abandoned land, and urban villages. In addition, due to outward expansion and uneven development, the development zone fever and real estate fever at the expense of arable land resources were also important factors, with the total real estate development investment in the Yangtze River Delta growing at a rate of 152.646 billion yuan/year from 2000 to 2018. However, after strict restrictions on the expansion of built-up areas, delineation of urban growth boundaries and implementation of territorial spatial planning, the outward spreading of urban land has ceased, and the ecological risk pressure, reduced.
In summary, the spatial and temporal differentiation of ecological risks of urbanization arises from the differences in population aggregation, economic and social development levels, and expansion trends of built-up areas. Ecological risks are not local environmental problems, but are dynamic, holistic, open, lagging, hidden, and uncertain. The mutual synergy of population urbanization, economic urbanization, and land urbanization is necessary to achieve the linkage cooperation of factor concentration/diffusion, population quality promotion, technological progress, and industrial structure upgrading to realize the control and prevention of the ecological risks of urbanization (Figure 9).

5. Conclusions and Discussion

5.1. Discussion

5.1.1. Research Applicability

The relationship between urbanization and the ecological environment is a research hotspot in this field [15,72,73]. Due to the different characteristics of urbanization in different regions, the ecological risks caused are also different [18,70]. The different development stages also create ecological risks of different degrees, scopes, and modes. The Yangtze River Delta is an important region for China to implement high-quality development strategies, and the relationship between urbanization development and ecological protection is complex. On the one hand, urbanization development accumulated capital and talents and promotes industrial structure upgrading and production technology innovation; on the other hand, urbanization threatens the natural environment, causing pollution, destruction and collapse of the ecosystems. Therefore, it is significant to explore the characteristics, patterns and ecological risk distributions of urbanization in different regions of the Yangtze River Delta across different periods.
In addition, this study goes beyond the limitation of using administrative units as data carriers by integrating multiple data sources with multiple methods. Instead, we used a finer raster scale to measure the coupling coordination of multidimensional urbanization and its spatiotemporal variation of ecological risk in the Yangtze River Delta region from 2000 to 2018. This broadens the cognitive perspective and research scale of urbanization ecological risks.
The root cause of ecological risk lies in the development stage and development mode of urbanization [18]. Therefore, the urbanization and the industrialization process are not the same for “countries such as the United States, the United Kingdom, Japan, Korea, Brazil, India and Pakistan”, nor for China. Urbanization and industrialization patterns in the wider region in which the study area is sited—that is east Asia and China—differ from those of older industrial countries in Europe and North America. The same stands for the role of industrialization, which is not anymore the driving force of urbanization in Europe and North America, as the tertiary sector is the most important in terms of economic development. The United States and Europe, for example, are more concerned with urban ecological patterns, ecosystem services, human habitat, and even public health risks, as well as persistent severe air pollution, increased ozone concentrations, the greenhouse effect, acid rain and increased concentrations of airborne particulate matter. With the rapid development of urbanization in China, the ecological and environmental problems caused by it also have attracted extensive attention from the government, society and scholars, and the research content has evolved from focusing on the impact of land use change on single elements of the ecological environment, such as climate, hydrology, soil, and biology, to the research on the impact of land use change on the overall ecological environment of the region.
The present study showed that in the past 18 years, urbanization coupling coordination in the Yangtze River Delta was negatively correlated with ecological risks. This showed that in the context of ecological civilization, regional integration and high-quality development, the ecological risks in this region had been highly valued. Therefore, the two-way virtuous circle and sustainable development of local urbanization and ecosystem optimization and the total value of ecological risks tend to decrease gradually. However, it should be noted that, at the regional level, on the whole, it is still necessary to strengthen the linkage regulation and overall optimization of ecological risks in different development stages and different development styles.

5.1.2. Shortcomings and Future Prospects

Due to the complexity of multidimensional urbanization and the uncertainty of risks, this study’s urbanization and risk evaluation criteria were still inconsistent, and it is not easy to obtain primary research data. Owing to the complexity of multidimensional urbanization and the uncertainty of risks, the criteria of urbanization and risk evaluation in this study were still inconsistent, and it is not easy to obtain primary research data. Several shortcomings should be mentioned. ① First, the core indicators of urbanization lacked consideration of human elements for the spatialization of coordinated urbanization development. For instance, social structure changes lacked the necessary questionnaires, in-depth interviews and big data mining. ② Second, lack of policies, zoning adjustments and other changes on the nonlinear effects of ecological risk analysis. In the next step, we will make use of big data (i.e., cell phone signaling, microblog sign-in and mobile population data), questionnaire surveys and Participatory Geographic Information System (PPGIS) to select more specific stage sample points and to further explore the influence mechanisms of collaborative urbanization development on ecological risks from different spatial and temporal scales.

5.1.3. Policy Implications

According to the findings of the article, in order to mitigate the ecological risks of urbanization, the following policy recommendations are proposed: ① First, the construction of a regular ecological risk monitoring and early warning system should be strengthened. Environmental protection departments need to monitor the spatial and temporal extent of air pollution, water pollution, soil pollution, habitat destruction, and intensity of disturbance during the development of urbanization in real-time. Thus, a strict early warning system must be established to reflect and intervene promptly on the results of risk reporting. ② Second, the concept of green, efficient and harmonious development should be established. New industries need to be developed, such as product development, design, financial transactions, services, and logistics and e-commerce, by promoting the optimization and upgrading of the industrial structure of the Yangtze River Delta. Additionally, attention must be directed toward promoting the division of labor and collaboration between regions and the construction of industrial chains to avoid the ‘siphon effect’ arising from the ‘pollution transfer’ caused by one pole alone. ③ Third, we should establish the awareness of spatial planning of national land from top to bottom and from bottom to top. Given the rapid and disorderly expansion of construction land, we should adhere to the concept of spatial governance and urban–rural integration. Based on the evaluation of the carrying capacity and on the suitability of resources and environment, we should adhere strictly to the bottom line of ‘green line’, ‘blue line’, and ‘red line’; plan and coordinate the regional ‘agricultural space’, ‘urban space’, and ‘ecological space’; and strengthen the improvement of human living environment and ecological environment construction. ④ Last, the strategy of zoning control and necessary treatment should be implemented. Studies showed apparent regional differences between the degree of urbanization coupling coordination and ecological risks. Therefore, key zones of risk warning control should be established in the built-up areas, urban–rural transition zones and around ecological lands with higher risk probability, such as the hilly areas in western Zhejiang, the mountains in southern Zhejiang, the ring of Taihu Lake, Hongze Lake, the northern coast of Jiangsu, and the mouth of the Yangtze River. The infiltration of low-end industries in developed areas should be appropriately avoided, and industrial transfer parks must be established for spatial guidance and control. The integration of secondary and tertiary industries in places such as Suzhou-Wuxi-Changzhou, Nanjing, Ningbo, and Hangzhou should be developed vigorously.

5.2. Conclusions

This study diagnosed the spatial and temporal patterns and trends of ecological risk response to coordinated urbanization development in the Yangtze River Delta from 2000 to 2018. It explored the impact of multidimensional coordinated urbanization development on ecological risk from the perspective of spatial linkage. The main findings were as follows:
(1) The overall coupling coordination degree of urbanization in the Yangtze River Delta increased. The satisfactory coupling coordination degree mainly decreased from the core to the periphery with the path-locking effect in Suzhou-Wuxi-Changzhou and Hu-Ning-Hang. However, the higher coupling and medium coupling coordination degrees do not fully play the roles of ‘transition’ and ‘linking’, respectively. In terms of evolutionary characteristics, due to the gradient of economic development, the hierarchy of the industrial structure, trend of population flow and difference in the efficiency of resource utilization, 2000–2010 was the ‘polarization stage’ at which the coupling coordination degree of urbanization transformed from single-core agglomeration to multi-core agglomeration points. Afterwards, it entered the ‘diffusion stage’. The state of balanced development of the region started to appear, with the diffusion mode transforming from the initial radiation diffusion and hierarchical diffusion to jump-diffusion.
(2) From 2000 to 2018, the ecological risk of land use in the Yangtze River Delta tended to weaken, and the fragility (endogenous) and disturbance (exogenous) of landscape components combined to form a spatial differentiation pattern of homogeneous aggregation and heterogeneous isolation of regional ecological risk. High and higher ecological risk areas were concentrated around built-up areas. In urban–rural transition zones, low and lower ecological risk areas were clustered around green areas (e.g., water areas, woodlands, etc.) The segregation of high and low ecological risk areas was more prominent.
(3) The increase in the degree of urbanization coupling and coordination in the Yangtze River Delta during the study period tended to reduce the ecological risk. Increasing urbanization coupling coordination in Zhejiang Province, Jiangsu Province and Shanghai City effectively reduced the local ecological risk. However, the simultaneous increase of urbanization coupling coordination and ecological risk still existed in most of Anhui Province and northern Jiangsu Province. These findings indicated that the ecological risk of urbanization in late-developing areas may be more difficult to manage. The hidden and lagging nature of the risk needs to be identified and prevented. In addition, the Taihu Lake Rim region hinted at the adverse effects of urbanization on ecological risks, but with the awakening of ecological awareness and the improvement of ecological compensation mechanisms in the Basin, ecological risks in this region would decline.
(4) The differences in population aggregation, economic and social development levels, and built-up area expansion trends were essential factors for the spatial and temporal differentiation of urbanization ecological risks. The synergy of population urbanization, economic urbanization, and land urbanization could link factor concentration/diffusion, population quality promotion, technological progress, and industrial structure upgrading and thus realize urbanization ecological risk control and prevention.

Author Contributions

Conceptualization, X.L.; methodology, X.L.; software, X.L.; validation, X.L.; formal analysis, X.L.; investigation, M.Y.; resources, X.L.; data curation, X.L.; writing—original draft preparation, X.L.; writing—review and editing, B.F. and X.X.; visualization, X.L.; supervision, B.F. and T.J.; project administration, B.F.; funding acquisition, B.F. All authors have read and agreed to the published version of the manuscript.

Funding

This research was funded by the National Natural Science Foundation of China, grant number 42071229, 41671174 and the Priority Academic Program Development of Jiangsu Higher Education Institutions, grant number 164320H116.

Data Availability Statement

The Sources and preprocessing of data are in Section 3.2. Other relevant data to support this study are available from the authors upon request.

Conflicts of Interest

The authors declare no conflict of interest.

References

  1. Friedmann, J. Four theses in the study of China’s Urbanisation. Int. J. Urban Reg. Res. 2006, 30, 440–451. [Google Scholar] [CrossRef]
  2. Yi, H.; Kreuter, U.P.; Han, D.; Güneralp, B. Social segregation of ecosystem services delivery in the San Antonio region, Texas, through 2050. Sci. Total Environ. 2019, 667, 234–247. [Google Scholar] [CrossRef] [PubMed]
  3. Hunsaker, C.T.; Graham, R.L.; Suter, I.I.G.W.; Neill, R.V.O.; Barnthouse, L.W.; Gardner, R.H. Assessing ecological risk on a regional scale. J. Environ. Manag. 1990, 14, 325–332. [Google Scholar] [CrossRef]
  4. Tsuchiya, K.; Iha, K.; Murthy, A.; Lin, D.; Mcgreevy, S.R. Decentralization & local food: Japan’s regional Ecological Footprints indicate localized sustainability strategies. J. Clean. Prod. 2021, 292, 126043. [Google Scholar]
  5. Wang, S.J.; Cui, Z.T.; Lin, J.J.; Xie, J.Y.; Su, K. Coupling and coordination of Urbanisation and ecological resilience in the Pearl River Delta. Acta Geograph. Sin. 2021, 76, 973–991. (In Chinese) [Google Scholar]
  6. Zhang, W.; Chang, W.J.; Zhu, Z.C.; Zeng, H. Landscape ecological risk assessment of Chinese coastal cities based on land use change. Appl. Geogr. 2020, 117, 102174. [Google Scholar] [CrossRef]
  7. Tang, L.; Wang, L.; Li, Q.Y.; Zhao, J.Z. A framework designation for the assessment of urban ecological risks. Int. J. Sust. Dev. World. 2018, 25, 387–395. [Google Scholar] [CrossRef] [Green Version]
  8. Liang, L.W.; Wang, Z.B.; Li, J.X. The effect of Urbanisation on environmental pollution in rapidly developing urban agglomerations. J. Clean. Prod. 2019, 237, 117649. [Google Scholar] [CrossRef]
  9. Li, W.J.; Wang, Y.; Xie, S.Y.; Cheng, X. Coupling coordination analysis and spatiotemporal heterogeneity between Urbanisation and ecosystem health in Chongqing municipality. China. Sci. Total Environ. 2021, 791, 148311. [Google Scholar] [CrossRef]
  10. Rezapour, S.; Moghaddam, S.S.; Nouri, A.; Aqdam, K.K. Urbanization influences the distribution, enrichment, and ecological health risk of heavy metals in croplands. Sci. Rep. 2022, 12, 3868. [Google Scholar] [CrossRef]
  11. Yin, R.; Wang, Z.; Chai, J.; Gao, Y.; Xu, F. The Evolution and Response of Space Utilization Efficiency and Carbon Emissions: A Comparative Analysis of Spaces and Regions. Land 2022, 11, 438. [Google Scholar] [CrossRef]
  12. Liu, H.M.; Fang, C.L.; Fang, K. The Coupled Human and Natural Cube: A novel framework analyzing the multiple interactions between human and nature. J. Geogr. Sci. 2020, 30, 355–377. [Google Scholar] [CrossRef]
  13. Mo, W.B.; Wang, Y.; Zhang, Y.X.; Zhuang, D.F. Impacts of road network expansion on landscape ecological risk in a megacity, China: A case study of Beijing. Sci. Total Environ. 2016, 574, 1000–1011. [Google Scholar] [CrossRef] [PubMed] [Green Version]
  14. Liu, X.; Zhang, Z.; Li, M.X.; Fu, Y.H.; Hui, Y. Spatial conflict simulation of land-use based on human-land-landscape elements intercoordination: A case study in Tianjin, China. Environ. Monit. Assess. 2022, 194, 317. [Google Scholar] [CrossRef]
  15. Kroll, F.; Müller, F.; Haase, D.; Fohrer, N. Rural–urban gradient analysis of ecosystem services supply and demand dynamics. Land Use Policy 2012, 29, 521–535. [Google Scholar] [CrossRef]
  16. Chen, M.X. Research progress and scientific issues in the field of Urbanisation. Geogr. Res. 2015, 34, 614–630. (In Chinese) [Google Scholar]
  17. Pumain, D. Alternative explanations of hierarchical differentiation in urban systems. In Hierarchy in Natural and Social Sciences; Methods Series 3; (Chapter 7); Pumain, D., Ed.; Springer: Berlin/Heidelberg, Germany, 2006; pp. 169–222. [Google Scholar]
  18. Du, Y.Y.; Wan, Q.; Liu, H.M.; Liu, H.; Kapsar, K.; Peng, J. How does Urbanisation influence PM 2.5 concentrations? Perspective of spillover effect of multi-dimensional Urbanisation impact. J. Clean. Prod. 2019, 220, 974–983. [Google Scholar] [CrossRef]
  19. Chen, M.X.; Ye, C.; Lu, D.D.; Sui, Y.W.; Guo, S.S. Cognition and construction of the theoretical connotation of new Urbanisation with Chinese characteristics. Acta Geogr. Sin. 2019, 74, 633–647. (In Chinese) [Google Scholar]
  20. Fan, Q.Y.; Yang, S. The spatial characteristics and formation mechanism of the coordinated development of Urbanisation in the Yangtze River Delta. Prog. Geogr. Sci. 2021, 40, 124–134. (In Chinese) [Google Scholar] [CrossRef]
  21. Wei, G.; Sun, P.J.; Jiang, S.N.; Shen, Y.; Liu, B.L.; Zhang, Z.K.; Ouyang, X. The Driving Influence of Multi-Dimensional Urbanisation on PM2.5 Concentrations in Africa: New Evidence from Multi-Source Remote Sensing Data, 2000–2018. Int. J. Environ. Res. Public Health 2021, 18, 9389. [Google Scholar] [CrossRef]
  22. Li, X.; Li, S.; Zhang, Y.; O’Connor, P.J.; Zhang, L.; Yan, J. Landscape Ecological Risk Assessment under Multiple Indicators. Land 2021, 10, 739. [Google Scholar] [CrossRef]
  23. Luo, F.H.; Liu, Y.X.; Peng, J.; Wu, J.S. Assessing urban landscape ecological risk through an adaptive cycle framework. Landsc. Urban Plan. 2018, 180, 125–134. [Google Scholar] [CrossRef]
  24. Wang, J.; Bai, W.Q.; Tian, G. Research progress on ecological risk assessment of land use. J. Nat. Resour. 2020, 35, 576–585. (In Chinese) [Google Scholar]
  25. Wang, H.; Liu, X.M.; Zhao, C.Y.; Chang, Y.P.; Liu, Y.Y.; Zang, F. Spatial-temporal pattern analysis of landscape ecological risk assessment based on land use/land cover change in Baishuijiang National nature reserve in Gansu Province, China. Ecol. Indic. 2021, 124, 107454. [Google Scholar] [CrossRef]
  26. Wu, Z.J.; Lin, C.; Shao, H.; Feng, X.J.; Chen, X.; Wang, S.M. Ecological risk assessment and difference analysis of pit ponds under different ecological service functions-A case study of Jianghuai ecological Economic Zone. Ecol. Indic. 2021, 129, 107860. [Google Scholar] [CrossRef]
  27. Schanze, J. Flood Risk Management-A Basic Framework, Flood Risk Management: Hazards, Vulnerability and Mitigation Measures; Springer: Berlin/Heidelberg, Germany, 2006. [Google Scholar]
  28. Ranjan, R.; Marshall, E.; Shortle, J. Optimal renewable resource management in the presence of endogenous risk of invasion. J. Environ. Manag. 2008, 89, 273–283. [Google Scholar] [CrossRef]
  29. Zhu, Q.; Xu, L.; Wang, W.; Liu, W.; Liu, C.; Jiang, G. Occurrence, spatial distribution and ecological risk assessment of phthalate esters in water, soil and sediment from Yangtze River Delta, China. Sci. Total Environ. 2022, 806, 150966. [Google Scholar] [CrossRef]
  30. Dagnino, A.; Sforzini, S.; Dondero, F.; Fenoglio, S.; Bona, E.; Jensen, J.; Viarengo, A. A weight-of-evidence approach for the integration of environmental triad data to assess ecological risk and biological vulnerability. Integr. Environ. Assess. Manag. 2008, 4, 314–326. [Google Scholar] [CrossRef]
  31. Obery, A.M.; Landis, W.G. A regional multiple stressor risk assessment of the codorus creek watershed applying the Relative Risk Model. Hum. Ecol. Risk Assess. 2002, 8, 405–428. [Google Scholar] [CrossRef]
  32. Xie, H.L.; Wang, P.; Huang, H.S. Ecological Risk Assessment of Land Use Change in the Poyang Lake Eco-economic Zone, China. Int. J. Environ. Res. Public Health. 2013, 10, 328–346. [Google Scholar] [CrossRef] [Green Version]
  33. Shang, T.C. Eco-tourism system management and ecological risk analysis. Arid. Land Resour. Environ. 2008, 22, 91–94. (In Chinese) [Google Scholar]
  34. Peng, L.; Dong, B.; Wang, P.; Sheng, S.W.; Sun, L.; Fang, L.; Li, H.R.; Liu, L.P. Research on ecological risk assessment in land use model of Shengjin Lake in Anhui province, China. Environ. Geochem. Health 2019, 41, 2665–2679. [Google Scholar] [CrossRef] [PubMed]
  35. Li, W.J.; Wang, Y.; Xie, S.Y.; Sun, R.H.; Cheng, X. Impacts of landscape multifunctionality change on landscape ecological risk in a megacity, China: A case study of Beijing. Ecol. Indic. 2020, 117, 106681. [Google Scholar] [CrossRef]
  36. Lin, Y.Y.; Hu, X.S.; Zheng, X.X.; Hou, X.Y.; Zhang, Z.X.; Zhou, X.N.; Qiu, R.Z.; Lin, J.G. Spatial variations in the relationships between road network and landscape ecological risks in the highest forest coverage region of China. Ecol. Indic. 2019, 96, 392–403. [Google Scholar] [CrossRef]
  37. Xie, H.L.; Wen, J.M.; Chen, Q.R.; Wu, Q. Evaluating the landscape ecological risk based on GIS: A case-study in the Poyang Lake region of China. Land Degrad. Dev. 2021, 32, 2762–2774. [Google Scholar] [CrossRef]
  38. Xu, G.; Zhou, Z.Z.; Jiao, L.M.; Zhao, R. Compact Urban Form and Expansion Pattern Slow Down the Decline in Urban Densities: A Global Perspective. Land Use Policy 2020, 94, 104563. [Google Scholar] [CrossRef]
  39. Yi, Y.; Zhang, C.; Zhang, G. Effects of Urbanisation on Landscape Patterns in the Middle Reaches of the Yangtze River Region. Land 2021, 10, 1025. [Google Scholar] [CrossRef]
  40. Steffen, L.; Dagmar, H.; Birgit, K. A modeling approach assessing ecosystem service trade-offs. Ecol. Indic. 2014, 42, 73–94. [Google Scholar]
  41. Fang, C.L.; Cui, X.G.; Liang, L.W. Theory of Urbanisation and ecological environment coupling circle and coupler control. Acta Geogr. Sin. 2019, 74, 2529–2546. (In Chinese) [Google Scholar]
  42. Li, Z.Y.; Luan, W.X.; Zhang, Z.C.; Su, M. Relationship between urban construction land expansion and population/economic growth in Liaoning Province, China. Land Use Policy 2020, 99, 105022. [Google Scholar] [CrossRef]
  43. Yu, M.; Yang, Y.J.; Chen, F.; Zhu, F.W.; Qu, J.F.; Zhang, S.L. Response of agricultural multifunctionality to farmland loss under rapidly urbanizing processes in Yangtze River Delta, China. Sci. Total Environ. 2019, 666, 1–11. [Google Scholar] [CrossRef] [PubMed]
  44. Brondizio, E.S.; Vogt, N.D.; Mansur, A.V.; Anthony, E.J.; Costa, S.; Hetrick, S. A conceptual framework for analyzing deltas as coupled social-ecological systems: An example from the Amazon River Delta. Sustain. Sci. 2016, 11, 591–609. [Google Scholar] [CrossRef]
  45. Abdullah, A.Y.M.; Masrur, A.; Adnan, M.S.G.; Baky, M.A.A.; Hassan, Q.K.; Dewan, A. Spatio-Temporal Patterns of Land Use/Land Cover Change in the Heterogeneous Coastal Region of Bangladesh between 1990 and 2017. Remote Sens. 2019, 11, 790. [Google Scholar] [CrossRef] [Green Version]
  46. Li, X.; Li, D.; Xu, H.; Wu, C.Q. Intercalibration between DMSP/OLS and VIIRS nighttime light images to evaluate city light dynamics of Syria’s major human settlement during Syrian Civil War. Int. J. Remote Sens. 2017, 38, 5934–5951. [Google Scholar] [CrossRef]
  47. Cai, J.; Li, X.P.; Liu, L.J.; Chen, Y.Z.; Wang, W.X.; Lu, S.H. Coupling and coordinated development of new Urbanisation and agro-ecological environment in China. Sci. Total Environ. 2021, 776, 145837. [Google Scholar] [CrossRef] [PubMed]
  48. Li, H.; Song, W. Evolution of rural settlements in the Tongzhou District of Beijing under the new-type Urbanisation policies. Habitat Int. 2020, 101, 102198. [Google Scholar] [CrossRef]
  49. Liu, W.J.; Jiao, F.C.; Ren, L.J.; Xu, X.G.; Wang, J.C.; Wang, X. Coupling coordination relationship between Urbanisation and atmospheric environment security in Jinan City. J. Clean. Prod. 2018, 204, 1–11. [Google Scholar] [CrossRef]
  50. Liu, Y.; Zhou, G.; Liu, D.; Yu, H.S.; Zhu, L.Y.; Zhang, J. The interaction of population, industry and land in process of Urbanisation in China: A case study in Jilin province. Chin. Geogr. Sci. 2018, 28, 529–542. [Google Scholar] [CrossRef] [Green Version]
  51. Xu, D.; Hou, G.L. The Spatiotemporal Coupling Characteristics of Regional Urbanisation and Its Influencing Factors:Taking the Yangtze River Delta as an Example. Sustainability 2019, 11, 822. [Google Scholar] [CrossRef] [Green Version]
  52. Xu, X.; Zhao, Y.; Xia, S.Y.; Zhang, X.L. Investigation of multi-scale spatio-temporal pattern of oldest-old clusters in China on the basis of spatial scan statistics. PLoS ONE 2019, 14, e0219695. [Google Scholar] [CrossRef] [Green Version]
  53. Liao, Y.L.; Wang, J.F.; Meng, B.; Wang, X.H. A method of spatialization of demographic data. Acta Geogr. Sin. 2007, 62, 1110–1119. (In Chinese) [Google Scholar]
  54. Wetterhall, F.; Halldin, S.; Xu, C.Y. Statistical precipitation downscaling in central Sweden with the analogue method. J. Hydrol. 2005, 306, 174–190. [Google Scholar] [CrossRef]
  55. Arshad, A.; Zhang, W.C.; Zhang, Z.J.; Wang, S.H.; Zhang, B.; Cheemae, M.J.L.M.; Shalamzariab, M.J. Reconstructing high-resolution gridded precipitation data using an improved downscaling approach over the high altitude mountain regions of Upper Indus Basin (UIB). Sci. Total Environ. 2021, 784, 147140. [Google Scholar] [CrossRef] [PubMed]
  56. Yue, T.X.; Wang, Y.A.; Liu, J.Y.; Chen, S.P.; Qiu, D.S.; Deng, X.Z.; Liu, M.L.; Tian, Y.Z.; Su, B.P. Surface modeling of human population distribution in China. Ecol. Model. 2005, 181, 461–478. [Google Scholar] [CrossRef]
  57. Feng, Z.; Tang, Y.; Yang, Y.; Zhang, D. Relief degree of land surface and its influence on population distribution in China. J. Geog. Sci. 2008, 18, 237–246. [Google Scholar] [CrossRef]
  58. Liu, Y.; Yao, C.; Wang, G.; Bao, S. An integrated sustainable development approach to modeling the eco-environmental effects from Urbanisation. Ecol. Indic. 2011, 11, 1599–1608. [Google Scholar] [CrossRef]
  59. Li, Y.; Zhang, X.; Cao, Z.; Liu, Z.J.; Lu, Z.; Liu, Y.S. Towards the progress of ecological restoration and economic development in China’s Loess Plateau and strategy for more sustainable development. Sci. Total Environ. 2021, 756, 143676. [Google Scholar]
  60. Zhang, J.J.; Zhu, W.B.; Zhu, L.Q.; Cui, Y.P.; He, S.S.; Ren, H. Grid-based terrain undulation characteristics of western Henan mountainous area and its impact on population and economy. Acta Geogr. Sin. 2018, 73, 1093–1106. (In Chinese) [Google Scholar]
  61. Ortiz, B.P.; Cabrera, B.P.; Bogaert, J. landscape patterns in urban-rural interfaces. J. Urban Manag. 2021, 10, 46–56. [Google Scholar] [CrossRef]
  62. Liu, Y.X.; Wu, W.H.; Wen, X.J.; Zhang, D.H. The Urbanisation process of the energy zone in Shanxi, Shaanxi and Mongolia and its impact on the ecological environment. Geogr. Res. 2013, 32, 2009–2020. (In Chinese) [Google Scholar]
  63. Zhong, Y.; Lin, A.W.; He, L.J.; Zhou, Z.G.; Yuan, M.X. Spatiotemporal Dynamics and Driving Forces of Urban Land-Use Expansion: A Case Study of the Yangtze River Economic Belt, China. Remote Sens. 2020, 12, 287. [Google Scholar] [CrossRef] [Green Version]
  64. Zhang, N. Scale issues in ecology: Connotation and analytical methods. Acta Ecol. Sin. 2006, 7, 2340–2355. (In Chinese) [Google Scholar]
  65. Jin, X.; Jin, Y.; Mao, X. Ecological risk assessment of cities on the Tibetan Plateau based on land use/land cover changes-Case study of Delingha City. Ecol. Indic. 2019, 101, 185–191. [Google Scholar] [CrossRef]
  66. Peng, J.; Dang, W.X.; Liu, Y.X.; Zong, M.L.; Hu, X.X. Research progress and prospects of landscape ecological risk assessment. Acta Geogr. Sin. 2015, 70, 664–677. (In Chinese) [Google Scholar]
  67. Jiang, L.; Bai, L.; Wu, Y.M. Analysis on the coordination of China’s provincial economy, resources and environment—On the three-system coupling formula and its extended form. J. Nat. Resour. 2017, 32, 788–799. (In Chinese) [Google Scholar]
  68. Hermann, H. Advanced Synergetics: Instability Hierarchies of Self-Organizing Systems and Devices; Springer: Berlin/Heidelberg, Germany, 1983. [Google Scholar]
  69. Xie, X.; Fang, B.; Xu, H.; He, S.; Li, X. Study on the coordinated relationship between Urban Land use efficiency and ecosystem health in China. Land Use Policy 2021, 102, 1–10. [Google Scholar] [CrossRef]
  70. Guo, X.Y.; Mu, X.Q.; Ding, Z.S.; Qin, D.L. The non-linear impact and driving mechanism of multi-dimensional Urbanisation in the Yangtze River Delta on PM2.5 concentration. Acta Geogr. Sin. 2021, 76, 1274–1293. (In Chinese) [Google Scholar]
  71. Cao, G.Z.; Chen, S.C.; Liu, T. Spatial patterns and changing trends of population inflows in China’s five major urban agglomerations. Acta Geogr. Sin. 2021, 76, 1334–1349. (In Chinese) [Google Scholar]
  72. Chen, S.; Haase, D.; Xue, B.; Wellmann, T.; Qureshi, S. Integrating Quantity and Quality to Assess Urban Green Space Improvement in the Compact City. Land 2021, 10, 1367. [Google Scholar] [CrossRef]
  73. Nuissl, H.; Haase, D.; Lanzendorf, M.; Wittmer, H. Environmental impact assessment of urban land use transitions—A context-sensitive approach. Land Use Policy 2009, 26, 414–424. [Google Scholar] [CrossRef]
Figure 1. The research technical route.
Land 11 00723 g001
Figure 2. The interactive relationship between urbanization and ecological risk.
Land 11 00723 g002
Figure 3. Study area.
Land 11 00723 g003
Figure 4. Spatial pattern of urbanisation coupling coordination degree in the Yangtze River Delta from 2000 to 2018.
Land 11 00723 g004
Figure 5. The spatial pattern of ecological risk in the Yangtze River Delta from 2000 to 2018.
Land 11 00723 g005
Figure 6. The landscape pattern index of the Yangtze River Delta from 2000 to 2018.
Land 11 00723 g006aLand 11 00723 g006b
Figure 7. Changes of the Coordination Degree of Urbanisation and Ecological Risks in the Yangtze River Delta from 2000 to 2018.
Land 11 00723 g007
Figure 8. Changes of economic urbanization, population urbanization, and spatial urbanization in the Yangtze River Delta from 2000 to 2018.
Land 11 00723 g008
Figure 9. Driving Mechanism of Urbanization Ecological Risk.
Land 11 00723 g009
Table 1. Changes in land use types in the Yangtze River Delta from 2000 to 2018.
Year20002005201020152018
Type Area (km2)Percent (%)Area (km2)Percent (%)Area (km2)Percent (%)Area (km2)Percent (%)Area (km2)Percent (%)
Arable land182,941.11 52.19 179,152.27 51.11 171,977.93 49.06 168,954.51 48.20 166,918.21 47.62
Forest land100,643.55 28.71 100,349.82 28.63 99,665.73 28.43 99,519.75 28.39 98,805.10 28.19
Grassland11,559.02 3.30 11,473.62 3.27 11,227.37 3.20 11,141.03 3.18 11,257.23 3.21
Water Area24,431.04 6.97 24,825.26 7.08 25,588.71 7.30 25,717.68 7.34 25,531.47 7.28
Construction Land30,918.76 8.82 34,697.26 9.90 41,876.91 11.95 45,019.11 12.84 47,803.06 13.64
Utilized land60.82 0.02 56.07 0.02 217.65 0.06 202.25 0.06 239.27 0.07
Publisher’s Note: MDPI stays neutral with regard to jurisdictional claims in published maps and institutional affiliations.

