Article

Assessment of Land Use Pattern and Landscape Ecological Risk in the Chengdu-Chongqing Economic Circle, Southwestern China

1
Key Laboratory of Surface Process and Environment Remote Sensing in Three Gorges Reservoir Area, College of Geographical Science and Tourism, Chongqing Normal University, Chongqing 401331, China
2
107 Geological Team, Chongqing Bureau of Geology and Minerals Exploration, Chongqing 401120, China
3
Appraisal Center for Ecology and Environment Engineering of Chongqing, Chongqing 401121, China
*
Author to whom correspondence should be addressed.
Land 2022, 11(5), 659; https://doi.org/10.3390/land11050659
Submission received: 14 March 2022 / Revised: 25 April 2022 / Accepted: 27 April 2022 / Published: 29 April 2022
(This article belongs to the Special Issue Ecosystem-Based Regional Planning)

Abstract

:
The Chengdu-Chongqing Economic Circle (CCEC) is becoming the fourth growth pole in China after the Yangtze River Delta Economic Circle (YRDEC); Guangdong, Hong Kong, and Macao Economic Circle (GBAEC); Beijing, Tianjin, and Hebei Economic Circle (BTHEC). The land use and landscape ecological management of the CCEC is critical to its social and economic development. Using ArcGIS modeling and Fragstats processing methods, we divided the CCEC into 5 km × 5 km ecological risk areas and constructed a landscape ecological risk index evaluation model to calculate the spatial and temporal dynamic changes in the urban expansion and landscape ecological risk over the last 20 years. The results show that the land use was mainly cultivated land, which exhibited a decreasing trend and was mainly converted to construction land and forest land. The change in the construction land exhibited a continuous expansion trend with the dual core in Chengdu-Chongqing. The average risk of 10,155 risk communities was about 0.16. The expansion of human activities increased the landscape ecological risk of the construction land, and the risk of the edge of the cultivated land was higher than the internal risk value. The ecological risk index values of 16 cities in the study area ranged from 0.02 to 0.28. The resistance of the landscape pattern to external disturbance was stronger than that in other regions of China. The landscape ecological risk is controllable overall. However, the higher level of economic development in Chengdu, Chongqing, and other mature cities poses a greater landscape ecological risk. The results of this research provide an important reference for promoting the optimization and construction of the land space in the CCEC, building ecological shelters, and preventing ecological risk in the upper reaches of the Yangtze River.

1. Introduction

With the rapid growth of China’s economy, China has comprehensively entered the middle and late stages of urbanization [1]. On 3 January 2020, Chinese President Xi Jinping presided over the sixth meeting of the Financial and Economic Commission of the Communist Party of China (CPC) Central Committee, which made strategic plans to promote the construction of the Chengdu-Chongqing Economic Circle (CCEC). On 16 October 2020, Chinese President Xi Jinping presided over a meeting of the Political Bureau of the CPC Central Committee to review the Outline of the Construction Plan for the CCEC. The Chengdu-Chongqing region is becoming the fourth pole of growth after the Yangtze River Delta (YRD); Guangdong, Hong Kong, and Macao (GBA) region; Beijing, Tianjin, and Hebei (BTH) region [2,3]. The CCEC spans Chongqing and Sichuan provinces (cities). From 2000 to 2019, the urbanization rate of Chongqing increased from 35.6% to 66.8%, and that of Chengdu increased from 53.48% to 74.41%. In the process of this urbanization development with Chongqing and Chengdu as the core, development intensity has been relatively high. Developed agriculture, intense human activities, and natural disasters such as earthquakes and landslides pose great risks to the ecology and environment in the study area. Quantitative analysis of the land use changes and the ecological risk distribution and transfer during the urbanization process in the CCEC in the past 20 years is of great significance for promoting the construction of the CCEC in the Chengdu-Chongqing area and to building an important ecological shelter in the upper reaches of the Yangtze River.
As an important means of ecological and environmental management [4,5], ecological risk assessment evaluates the possibility of adverse ecological consequences in a study area after it is affected by natural or human activities [6,7]. There are two main approaches in ecological risk assessment [8,9]. One is based on the risk source–risk receptors–exposure and hazard assessment model, including unidirectional ecological environmental risk studies with different environmental receptors, such as the atmosphere [10], water [11], and soil [12]. Using this method, risk assessment has been carried out by taking landslides [13], debris flows [14], railways [15], coal mine rust water [16], and other sudden environmental events or specific objects as the risk sources, and risk assessment models have been constructed for ecological risk assessment in the five provinces around the Bohai Sea [17], southwestern China [18], and other research areas. The other method is to use remote sensing and geographic information system (GIS) technology to directly evaluate the landscape ecological risk from the perspective of the landscape ecology. Then, a multi-scale landscape ecological risk assessment model for the county, city, or province can be constructed based on the land use changes and landscape pattern index [19,20,21]. The former approach focuses on the identification of risk sources and risk receptors. In the evaluation process, the determination of the risk sources and each index is subjective and has a great influence on the accuracy of the evaluation results. The latter risk approach is widely applicable as it takes account of scale effects, temporal changes, and regional spatial heterogeneity. The approach also facilitates spatial visualization of results for decision making, regional risk prevention, optimization, and management of regional landscape patterns [8].
At present, the spatial scale of the landscape ecological risk assessment is mainly concentrated in small-scale areas such as counties [22,23] and watersheds [24], while relatively few studies have been conducted in large-scale areas such as provinces. Moreover, most previous studies have taken administrative divisions as the basic evaluation unit, artificially splitting the integrity and consistency of ecosystems and leading to large errors in the assessment results. Due to these limitations of the traditional method, grids were used as the basic unit for evaluating landscape changes, spatiotemporal variations, and the impact of urban expansion over the past 20 years on landscape ecological risk. In some studies, grid selection is limited by a large amount of calculations, and the number of grids has mostly ranged from hundreds to thousands [25,26,27,28]. In the calculation process, we used the ArcGIS model builder and Fragstats batch processing tools to build a cross-platform, process-based, mass calculation method of the landscape ecological risk index. The computation capacity of this method exceeds 10,000 grids simultaneously and enables computations for large study areas where the workload increases exponentially. Studies can now be conducted for longer periods and for more complicated calculations in advanced landscape ecological risk research.

2. Materials and Methods
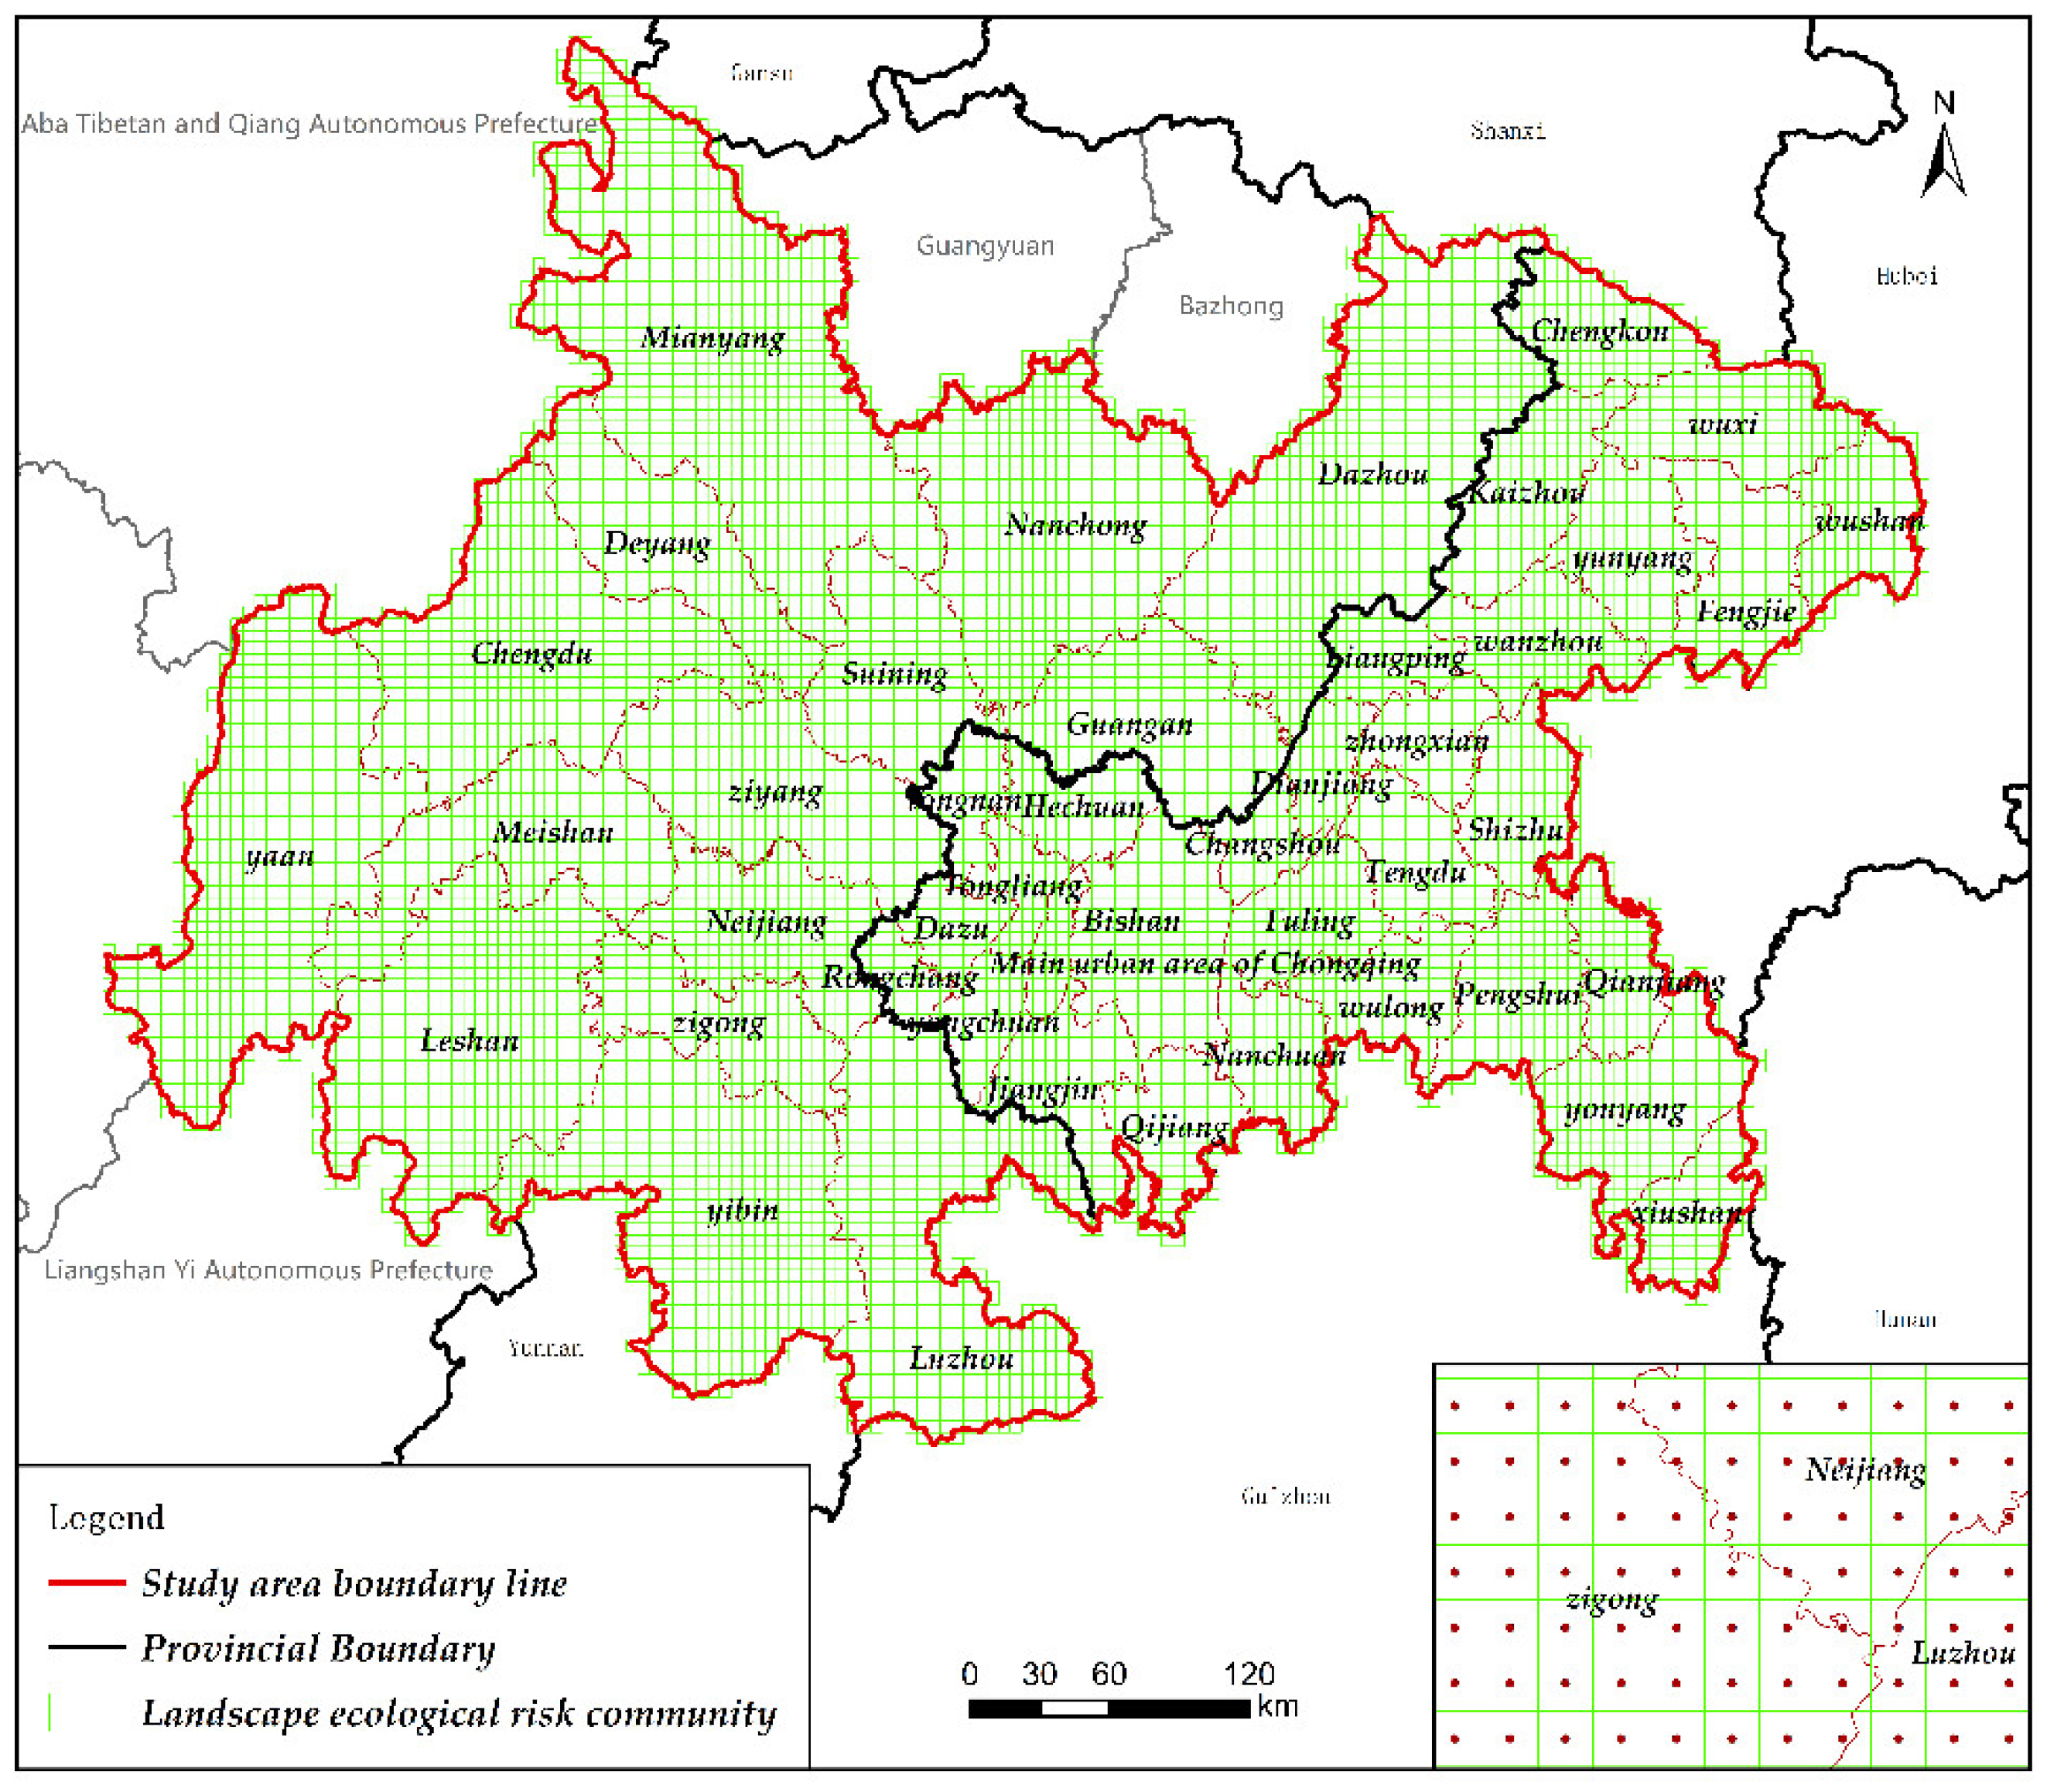
2.1. Study Area

As is shown in Figure 1, the CCEC is located in the hinterland of southwestern China. The study area is located in the upper reaches of the Yangtze River basin and is characterized by complex and diverse landforms. The location of this region is very important. As the transition zone between the headwaters of the Yangtze River and the middle and lower reaches of the Yangtze River, it is the second ecological shelter in China after the three-river headwaters region on the Qinghai–Tibet Plateau, and it occupies an important position in the ecological security pattern of China. Based on the relevant urban agglomeration and urban integrity in the Construction Planning Outline for the CCEC, in this study, the entire region containing Chongqing, Chengdu, Mianyang, and 15 other cities in Sichuan Province was selected as the study area, with a total area of 239,600 km2. Chongqing covers an area of 82,400 km2, and Sichuan covers an area of 157,200 km2.

2.2. Data Sources

The data used in this study were for the land use within the study area in 2000, 2010, and 2020, with a 30 m resolution [21,29,30,31] (http://www.globallandcover.com (accessed on 11 December 2020)). These data were provided by China to the United Nations. These data have been widely used in studies of land use changes [32,33,34]. The data from GlobeLand30 were reclassified into the following six types using the first-level classification standard of the Land Use Status Classification (GB/T2010-2017): cultivated land, forest land (including forest land and shrub), grassland, water area (including water bodies and wetland), construction land (man-made landmarks), and unused land (including bare land, tundra, glaciers, and permanent snow). It should be noted that if the remote sensing image acquisition period was during the initial stage of the urban construction project, it was identified as bare land. However, after the completion of the urban construction, it was identified as urban land or other land use types in the city region, so there is a discrepancy. In this study, the distribution area of the bare land in the study area was very small, accounting for only 0.01%. In addition, the focus of this study was the large-scale landscape pattern changes in each decade, and the process of the changes in local areas had little impact on the research results. The administrative boundary data were obtained from the Data Center for Resources and Environmental Sciences, Chinese Academy of Sciences (http://www.resdc.cn/ (accessed on 15 September 2020)), and the socio-economic data were obtained from the Sichuan Statistical Yearbook and the Chongqing Statistical Yearbook.

2.3. Methods

2.3.1. Land Use Dynamic Degree (LUD)

The land use dynamic degree (LUD) is an indicator used to measure the difference in the regional land use change rates. The specific model is as follows [30]
L U D = { i j n ( Δ U i j U i ) } × ( 1 t ) × 100 % ,
where U i is the total area of land use type class I at the initial time. Δ U i j is the total area of land use type class I that changed into other land use types from the initial to the end time. t is the time period. LUD is the total dynamic degree of land use change in the study area in period t.

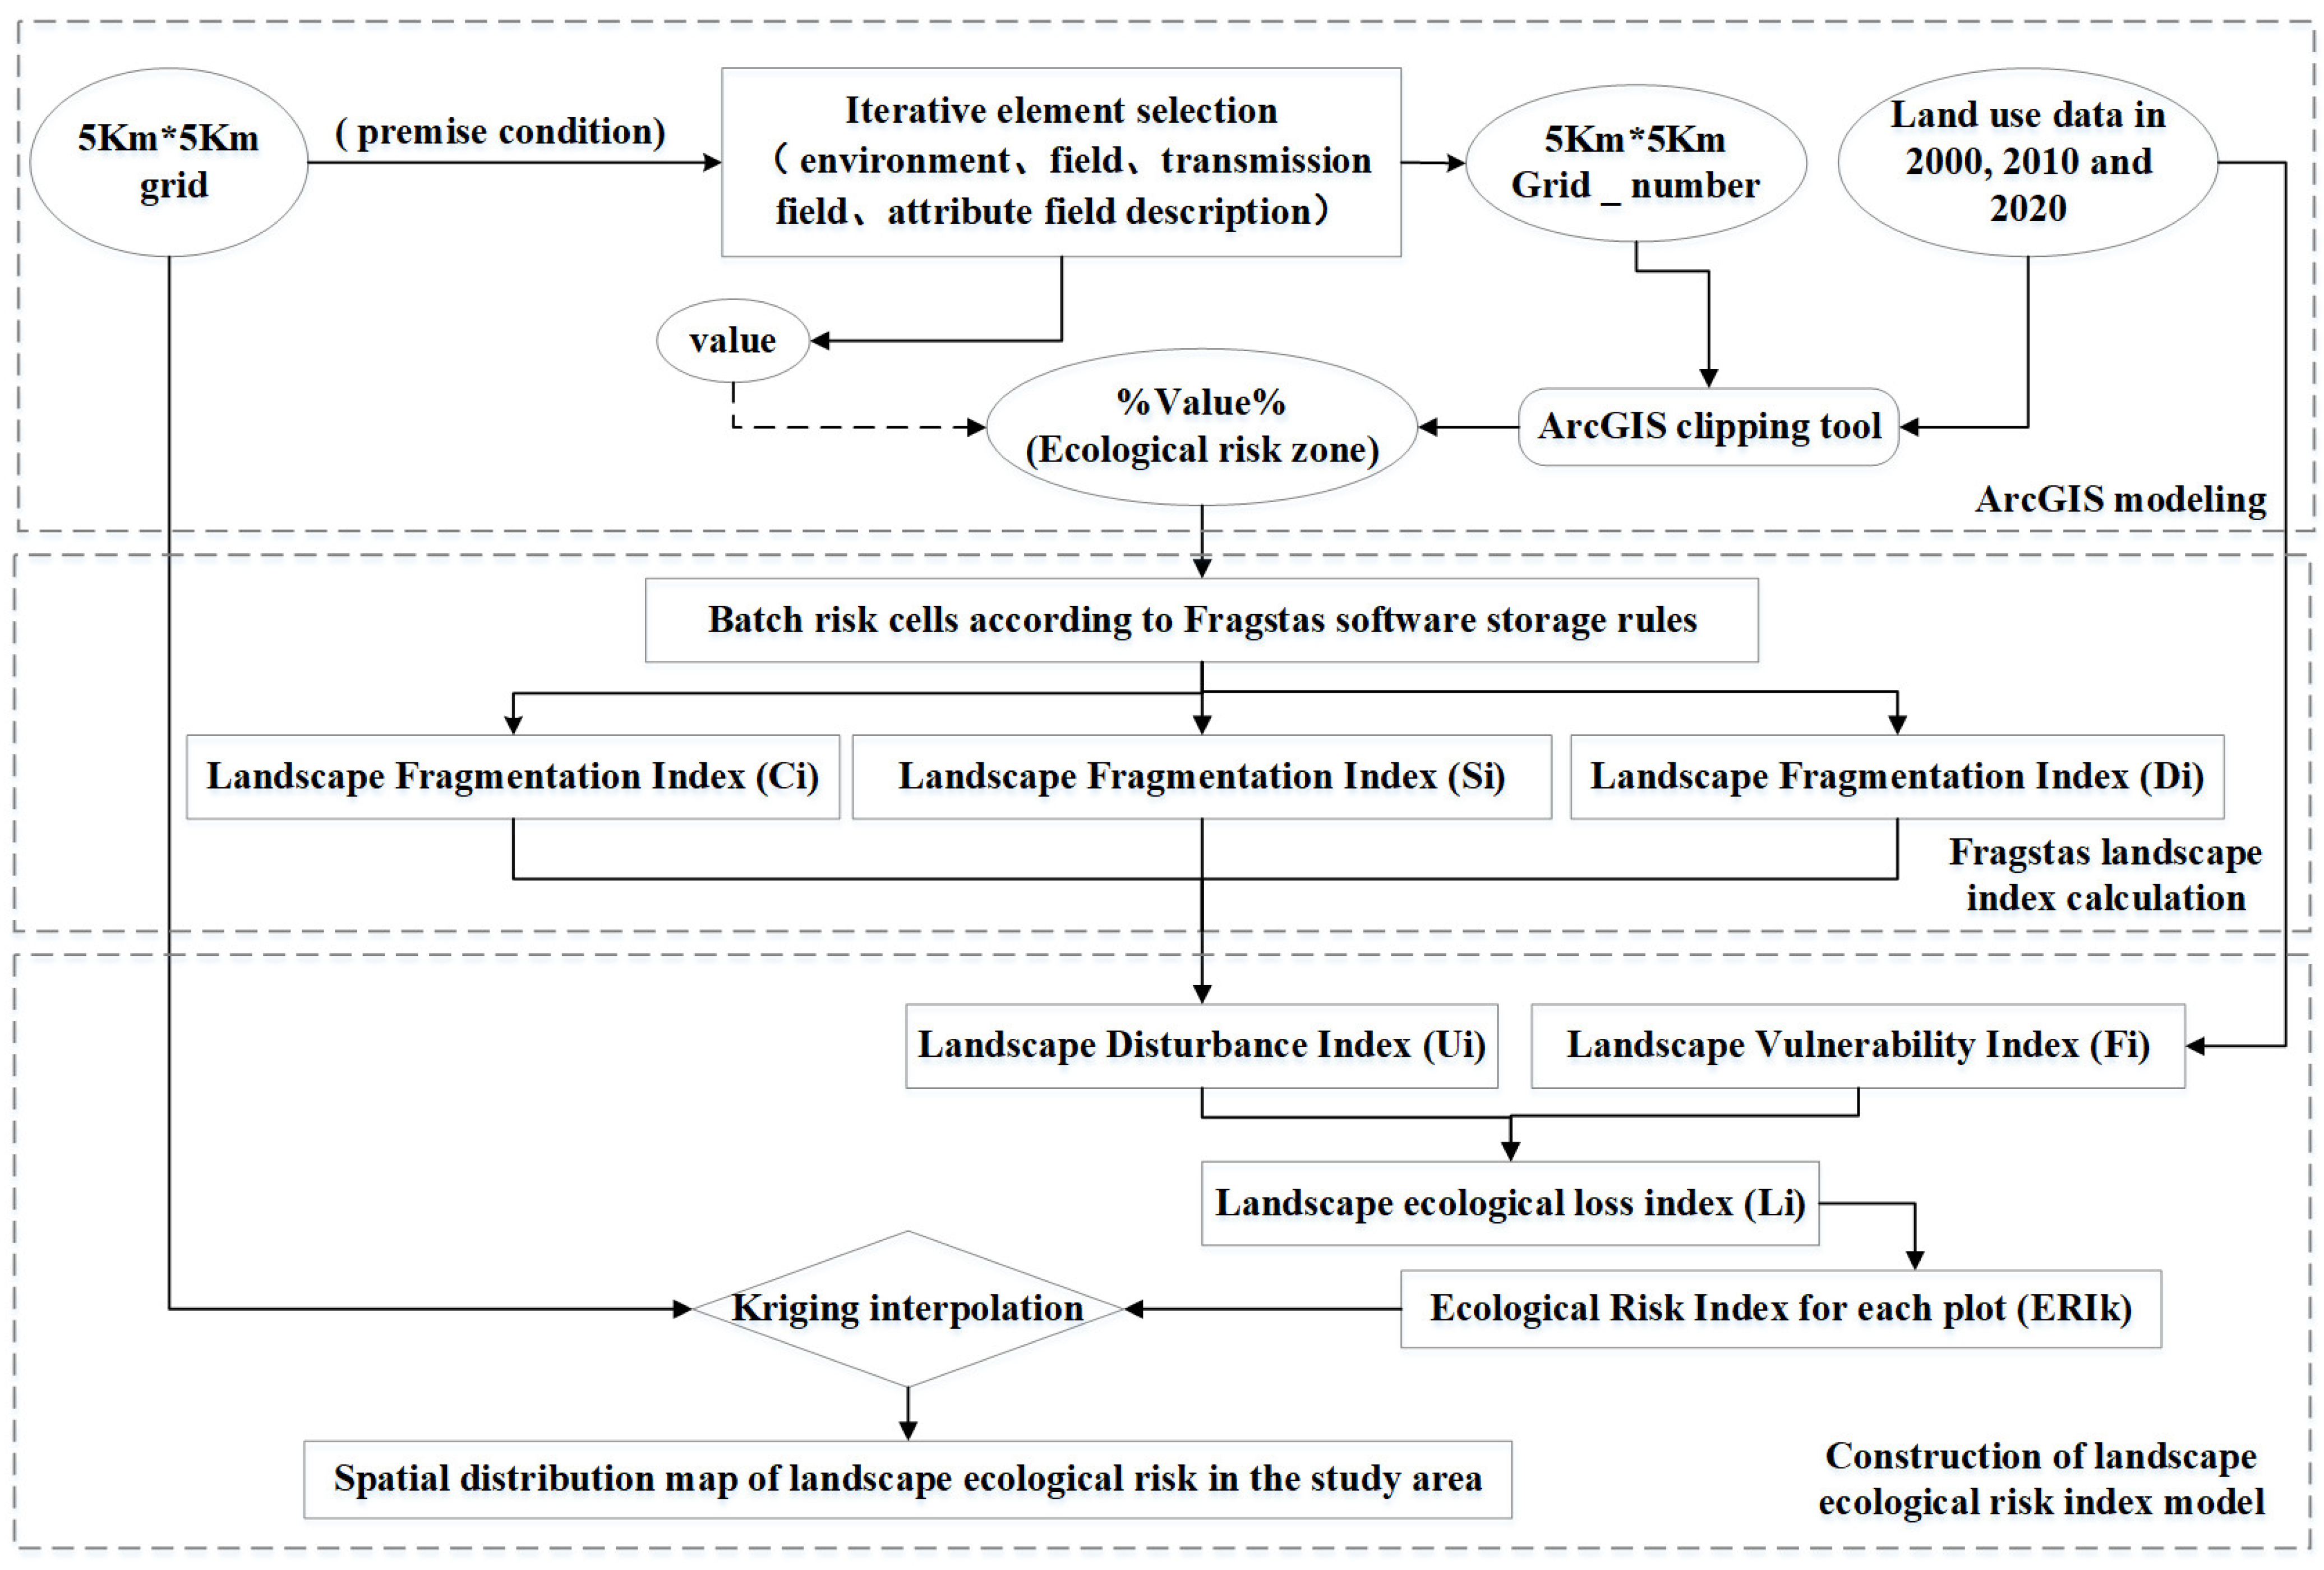
2.3.2. Landscape Ecological Risk Index

The landscape ecological risk refers to the possible adverse consequences of the interactions between the landscape pattern and ecological processes under the influences of natural and/or human factors [20], and it can be defined as the combined result of the different probabilities of the risk probability and landscape loss degree [35,36,37]. Based on previous research results and the actual situation in the study area, in this study, a calculation model of the ecological risk index ( E R I k ) was constructed based on the landscape ecological loss index ( L L i ), and its calculation equations are as follows
E R I k = i = 1 n A k i A k L L i ,  
L L i = U i × F i ,  
U i = a C i × b S i × c D o i ,  
where n is the number of landscape types, A k i is the area of landscape in sample area i , and A k is the total area of sample area k .
U i is the landscape disturbance degree index, which reflects the loss degree of the landscape in a certain region after external disturbances. C i , S i , and D o i are the landscape fragmentation degree index, landscape separation degree index, and landscape dominance degree index, respectively. F i is the landscape vulnerability index, which reflects the ability of the landscape types to resist external disturbances and their sensitivity to external changes. a, b, and c are the weights of the corresponding landscape indices, and a + b + c = 1. According to previous research results, a = 0.5, b = 0.3, and c = 0.2 are assigned as the weights [36]. The six landscape types, including construction land, forest land, grassland, cultivated land, water area, and unused land, were assigned values of 1–6, respectively, and then, they were normalized to obtain Fi [38,39,40].

2.3.3. Risk Subdivision

In this study, ArcGIS was used to divide the study area into several square patches, and each patch was defined as a risk plot. Each risk plot was coded, and the landscape ecological risk index was calculated for each plot. Then, kriging interpolation and the natural breakpoint method were used to obtain a spatial classification map of the landscape ecological risk for the entire study area. Referring to relevant studies, the area of the landscape samples should reach 2–5 times the average area of landscape patches in order to comprehensively reflect the landscape pattern information around the sampling site [3,38,39]. The study area is located in the southwestern mountainous area. The landscape features, such as cultivated land and forest land, in this area are extremely broken. Therefore, the study area was divided into a 5 km × 5 km grid by comprehensively considering the calculation intensity, calculation accuracy, and actual situation in the study area. Then, the geometric center of the grid was taken as the sampling point of the landscape ecological risk index, and a total of 10,155 risk communities were obtained (Figure 2). In the research process, ArcGIS, Fragstats, and other software packages were used to build a detailed technical process for determining the landscape ecological risk index based on a risk calculation flowchart (Figure 3), which makes the calculation process precise and process-based and provides a reproducible operation mode for related research.

3. Results

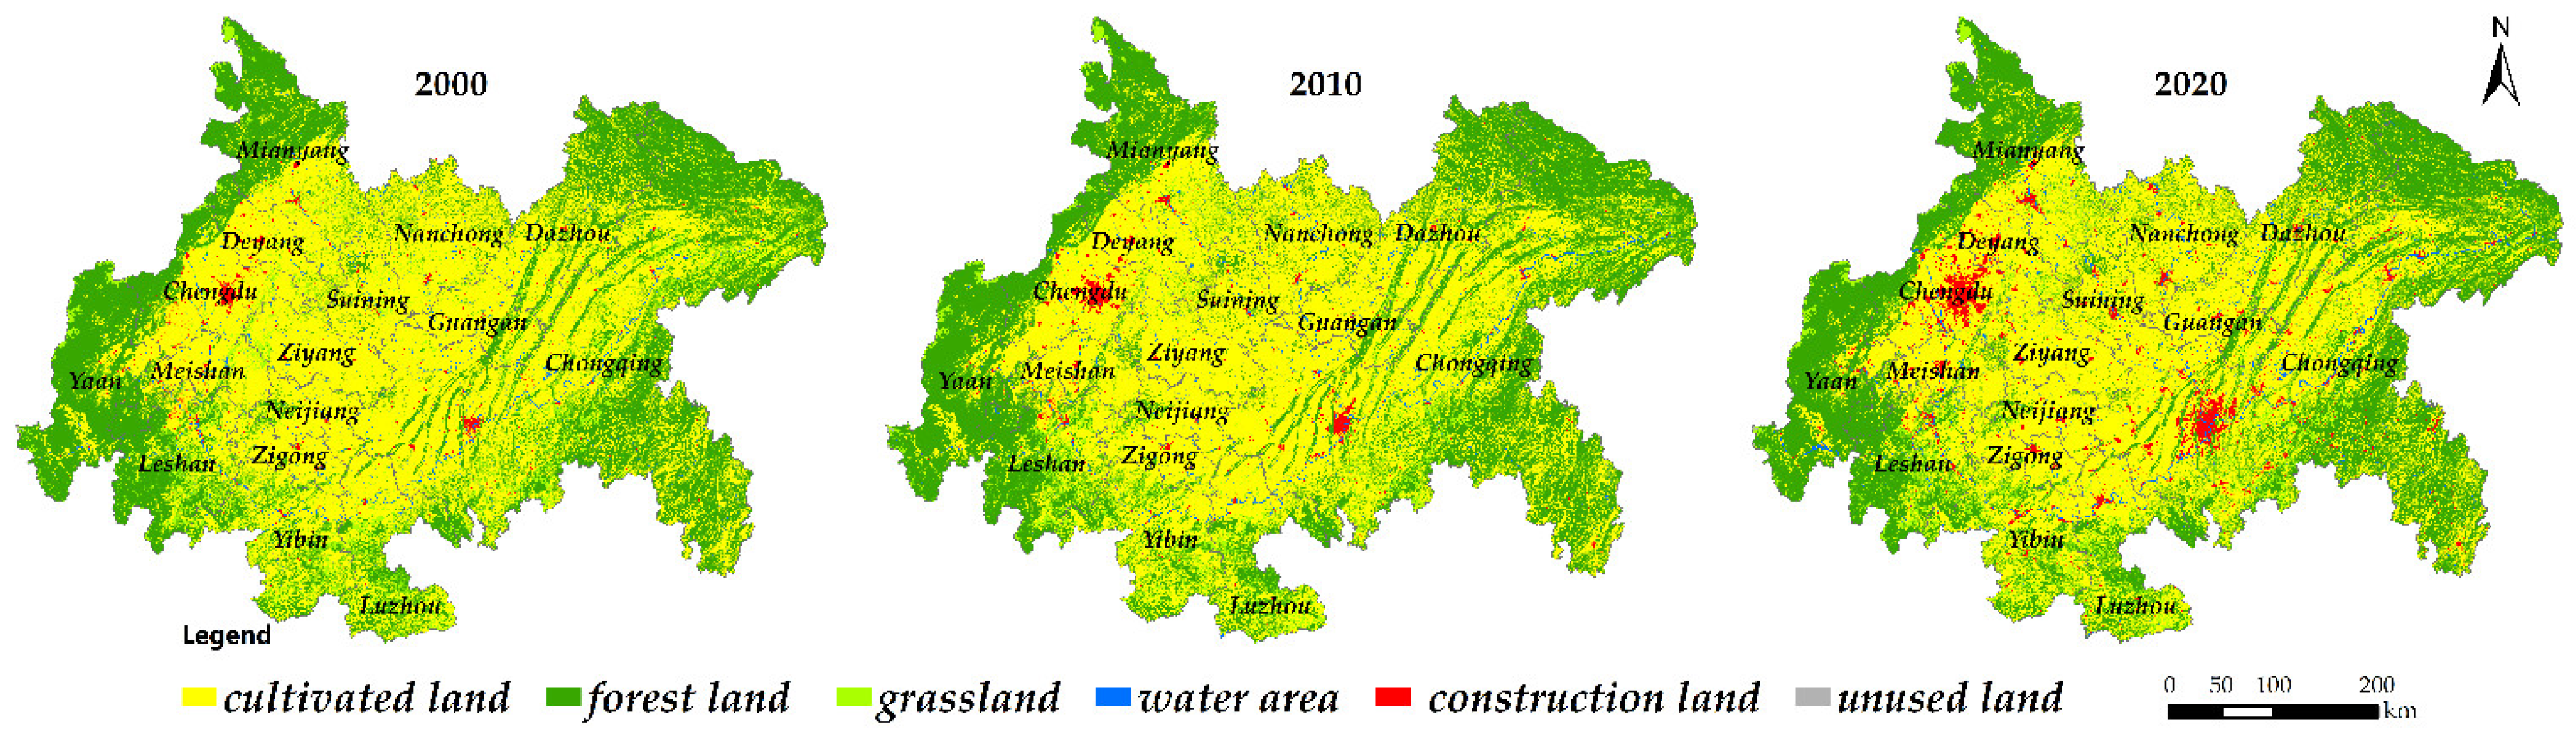
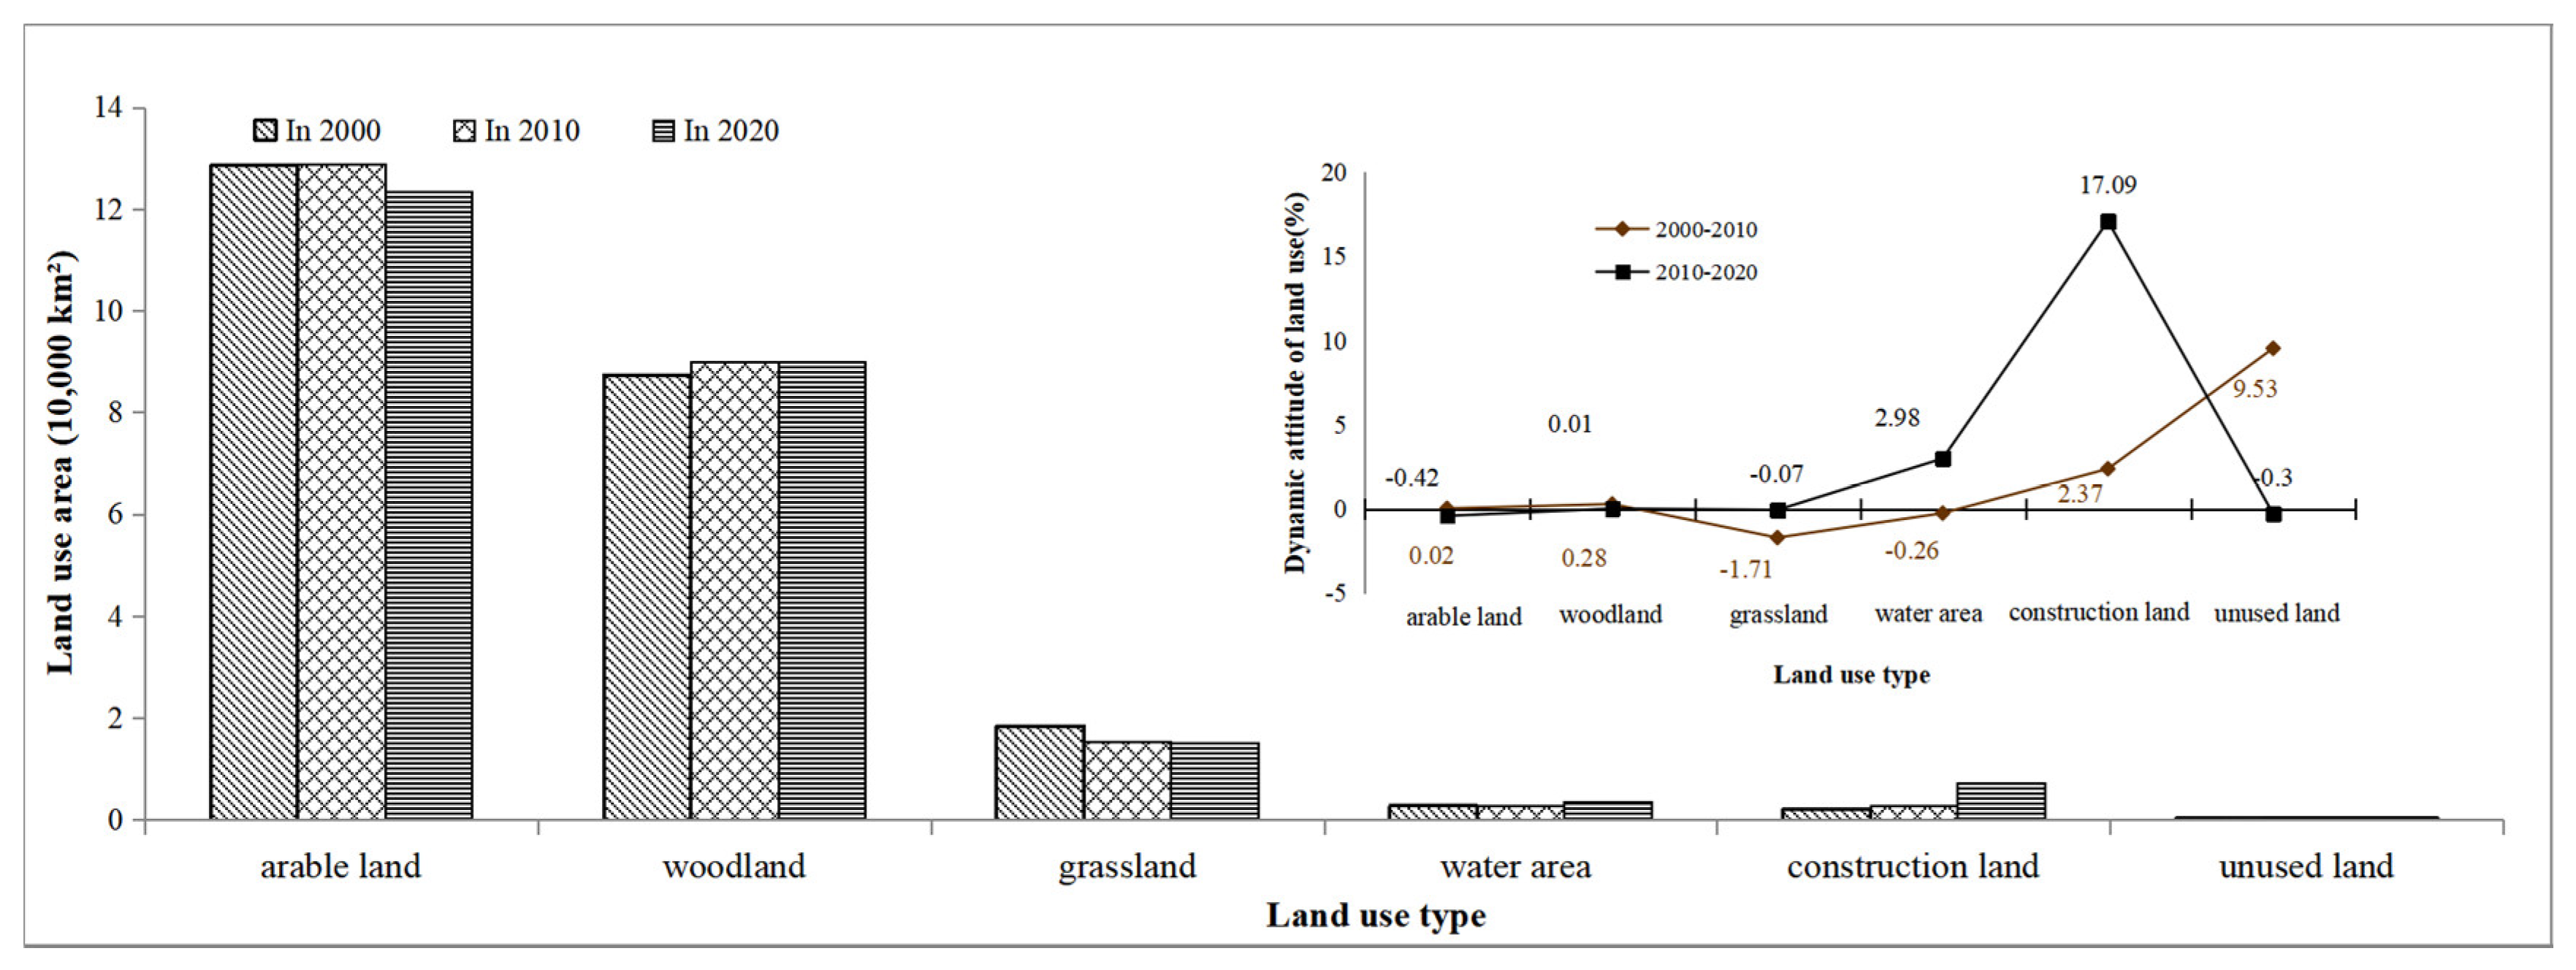
3.1. Evolution of Land Use Landscape Pattern

Based on the land use type map, the overall distributions and changes in each land type in the study area in 2000, 2010, and 2020 were obtained. The main land use types in CCEC were cultivated land and forest land, accounting for about 90% of the total area of the study area. The areas of cultivated land and forest land in Chongqing were 38,200 km2 and 35,200 km2, respectively, and those in Sichuan were 85,300 km2 and 54,700 km2, respectively. Figure 4 shows that the cultivated land was mainly distributed in the basin floor of the Sichuan Basin, upper hills, and siltstone in the parallel ridge-and-valley area. The forest land was mainly distributed in the mountainous areas around the Sichuan Basin. The water area mainly consisted of the Yangtze River, Jialing River, Minjiang River, and Tuojiang River. The grassland was mainly distributed along the rivers and in the lower altitude mountains. The construction land in Chengdu expanded, with Chongqing as the core. From the perspective of the dynamic degree of land use [35], the dynamic degree of comprehensive land use in the study area increased from 7.09% to 10.44% during 2000–2010 and 2010–2020, respectively, and the dynamic degrees of the construction land, water area, and unused land in the study area changed significantly (Figure 5). In general, the areas and distributions of all of the land use types in the study area changed during the past 20 years, among which the change in the construction land was the most significant.
The land use transfer matrix was obtained by tracking the change in land use types during the three phases (Table 1). From 2000 to 2020, the arable land was the main land use type converted to other types. The arable land was mainly converted to construction land and forest land, with conversion areas of 4866 km2 and 3684 km2, respectively, accounting for 45.70% and 34.60% of the conversion area. The forest land was the main land use type formed, mainly from grassland and cultivated land, with conversion areas of 5004 km2 and 3684 km2, respectively, accounting for 57.09% and 42.04% of the total area transferred from the corresponding land use type. In general, the largest degree of construction land transfer occurred in the study area, mainly in the period from 2010 to 2020, and the creation of construction land was much larger than its conversion to other land use types. More than 88% of the construction land was converted from cultivated land; ecological land such as forest land, grassland, and water area was also converted into construction land. In addition, as an important ecological shelter in the upper reaches of the Yangtze River, the study area has a good natural background and ecological resources. Urbanization encroachment on ecological land has caused the study area to face certain ecological risks.

3.2. Ecological Risk Analysis of Landscape Land Use Types

3.2.1. Risk Index Analysis of Ecological Risk Communities

Using Equations (1)–(3) and the Fragstats software, the landscape ecological risk index E R I k of each risk community during the three periods was calculated for 10,155 risk communities in the study area. The average risk values during the three periods in the study area were 0.12–0.31 in 2000, 0.12–0.30 in 2010, and 0.09–0.30 in 2020, with an average value of about 0.16, indicating that there was no significant change in the value. From 2000 to 2010 and from 2010 to 2020, the risk index values of 2753 communities continued to decrease, accounting for 27.11% of all the risk communities. In 1604 communities, it initially increased and then decreased, accounting for 15.81% of all the risk communities. In 3467 communities, it initially decreased and then increased, accounting for 34.14% of all the risk communities. In 1505 communities, it continued to increase, accounting for 14.82% of all the risk communities (Figure 6). The risk index remained unchanged in 110 communities, decreased in 6321 communities, and increased in 3724 communities. The residential areas with decreasing risk values were distributed in a zig-zag pattern along the northwestern part of the Longquan Mountains, the southern part of the Huaying Mountains, and the Wushan mountains. Most of these areas were flat areas of plains and river valleys. The plots with continuous increases in the risk value were distributed at the northern and southern ends of the study area. The overall landscape pattern in these areas was relatively fragmented, and the stability and resilience of the ecosystem was poor. The changes were rapid and obvious under the influences of human activities and/or natural disturbances.
In order to quantitatively analyze the relationship between the land use pattern changes and the ecological risk caused by human activities, the land use transfer matrix and ecological risk transfer matrix from 2000 to 2020 were superimposed (Figure 7 and Figure 8). The results revealed that when other land use types were converted to construction land, the risk increased and decreased in 69.93% and 20.09% of the areas, respectively. The increasing risk values were mainly distributed in the suburbs of Chongqing, Chengdu, and other central urban areas, while the decreasing risk values were mainly distributed in the suburbs far away from the central urban areas. When other land types were converted to cultivated land, the risk value increased and decreased in 59.09% and 15.81% of the areas, respectively. The areas with increased risk values were mostly forest areas at higher elevations, while the areas with decreased risk values were mostly river valleys at lower elevations. The risk values of areas around construction land and cultivated land was higher than that of areas inside construction land and cultivated land. If there is a continuous increase in construction land and cultivated land, including if the entire community becomes construction land or cultivated land, landscape fragmentation will be reduced and land use will become stable. As a result, the risk value of a single cell could remain constant or even decrease.

3.2.2. Spatiotemporal Analysis of Landscape Ecological Risk

In ArcGIS, kriging interpolation was carried out on the landscape ecological risk index during the three phases of development of the community, and maps of the spatial distribution of the landscape ecological risk in the study area in 2000, 2010, and 2020 were obtained (Figure 9). According to the interpolation results, the ecological risk values were divided into five categories using the natural breakpoint method and taking the actual situation in the study area into consideration: no risk ( E R I k < 0.14), low risk (0.14 ≤ E R I k < 0.16), medium risk (0.16 ≤ E R I k < 0.18), high risk (0.18 ≤ E R I k < 0.20), and extremely high risk ( E R I k ≥ 0.2).
The landscape ecological risk values in the study area were high in the periphery and low in the middle, and the different risk areas were zoned along the Yangtze River. The ecological risk levels in the study area exhibited a downward trend from 2000 to 2020. Among them, the low-risk area exhibited an expansion trend, with the proportion increasing from 14.18% to 21.52%. The low risk areas were mainly distributed in the flat areas with low elevations in the middle of the study area, such as on the Chengdu plain and in the Hengduan Mountains in the west, and in the Daba Mountains in the north. This area was dominated by woodland and arable land, the land use trends were stable, and the landscape types were less disturbed by the outside world. The high-risk areas exhibited an initial sharp decrease and then a slow increase. Their proportion decreased from 9.77% in 2000 to 6.47% in 2010 and then increased to 6.84% in 2020. The distribution changed from a contiguous strip to a plane scattered distribution, and it was concentrated in the southeastern part of Mianyang, the eastern part of Leshan, and in Yibin-Luzhou-Chongqing south of the Yangtze River, exhibiting a semi-enclosed shape (i.e., U-shaped). In these regions, the hills and mountains were interlaced, and the cultivated land and forest land were distributed alternately. The overall landscape pattern was relatively broken, and the stability and recovery ability were poor.

3.2.3. Ecological Risk Analysis of the Chengdu-Chongqing Economic Circle

By superimposing the administrative boundaries on the calculated results for the study area, the landscape ecological risk index values of 16 cities in the CCEC were obtained (Figure 10). In the last 20 years, the mean value of the E R I k in 16 cities was 0.17, the maximum value was 0.28, and the minimum value was 0.02. Among them, the E R I k in Neijiang and Zigong cities exhibited a slowly increasing trend, and the E R I k in Suining, Ziyang, Ya’an, Guang’an, Deyang, Nanchong, Dazhou, Mianyang, and Leshan exhibited a continuous decreasing trend. The E R I k values in Chongqing and Luzhou initially decreased and then increased, while those in Chengdu, Meishan, and Yibin initially increased and then decreased. In most cities, the range of the E R I k was larger in 2020 than in 2000 and 2010, indicating that the landscape ecological risk within each city was imbalanced. Overall, the fluctuations in landscape ecological risk in the study area were small. Compared with the results of ecological risk studies conducted in other research areas in China, such as the Haikou Coastal Zone (ERImean = 0.34–0.45) [7], Nanchang (ERImin = 0.17, ERImax = 0.68) [36], Yancheng (ERImean = 0.35–0.39) [37], Hebei Bashang (ERImin = 0.1, ERImax = 0.48) [41], and the Lanzhou Urban Agglomeration (ERImin = 0.19, ERImax = 0.27) [42], the assessment results of the landscape ecological risk index obtained for the study area (ERImean = 0.16, ERImin = 0.09, ERImax = 0.31) are significantly lower. Thus, the landscape pattern in the study area has a stronger ability to resist the risks posed by human activities, such as agricultural development and urban expansion.
Based on analysis of the ecological risk classification results, it was found that there were no high-risk areas in Chengdu, Neijiang, Suining, Ya’an, Ziyang, and Dazhou in 2000, 2010, and 2020. In Ya’an, Ziyang, Suining, Chengdu, Dazhou, Meishan, Nanchong, Neijiang, and Guang’an, the proportion of the areas with the second-highest risk and the high-risk areas was less than 10% of the total area. In Zigong, Mianyang, and Deyang, the areas with the second-highest risk and the high-risk areas accounted for 10–15% of the total area. The areas with the second-highest risk and the high-risk areas accounted for about 20% of the total area in Chongqing. In Leshan, Luzhou, and Yibin, these areas accounted for more than 50% of the total area. Among them, more than 80% of Yibin City was classified as the second-highest risk and high-risk grade areas, accounting for the largest proportion. Overall, there was no significant increase in the second-highest risk and high-risk areas in the 16 cities from 2000 to 2020. The results show that with the development of the economy and society during the past 20 years, the landscape ecological risk in the study area did not deteriorate significantly, and the regional ecological security was generally good.
The per-capita gross domestic product (GDP) values of the study area in 2000, 2010, and 2020 were 4700 yuan, 20,400 yuan, and 53,700 yuan, respectively, i.e., it increased by about 10 times in 20 years. In terms of the spatial distribution, the areas with low per-capita GDPs were distributed in the Mei-Zi-Nei-Sui-Guang-Da-Nan urban belt in the central and northeastern parts of the study area. The high-value areas in Chongqing and Chengdu as the two ends, and opening toward the northeast, the values along the Yangtze River–Minjiang River form a U-shaped distribution in the Mian-De-Cheng-Ya-Le city belt and southeast along the river city belt. The distribution characteristics are highly consistent with the distribution of the landscape ecological risk areas. According to the statistics (Figure 11 and Table 2), there was no significant correlation between the per-capita GDP and the landscape ecological risk in the cities with relatively high economic development levels, such as Chongqing, Chengdu, Dazhou, Deyang, and Mianyang, due to the good ecological environmental foundation, effective protection measures, and mature urban development model. In most of the other cities, the higher the per-capita GDP was, the higher the landscape ecological risk was. In future development, the cities in the low-value landscape ecological risk areas should be used as the future foci for economic development, so that the future development will be based on the good ecological environmental background, and the ecological environmental advantages can be transformed into economic advantages. While leading the economic development, the cities in the high-value landscape ecological risk areas should pay more attention to the protection of the ecological environment, explore the path of green, low-carbon, high-quality, coordinated, and sustainable development, and realize the win-win situation of the simultaneous development of the environment and economy.

4. Discussion

The landscape ecological risk is used to evaluate the spatial and temporal distributions and evolutionary characteristics of regional landscape features based on land use changes. This method provides an efficient and convenient method of regional ecological risk assessment based on geographical patterns. This evaluation model, which has been widely used, is considered to be reasonable and applicable for evaluating landscape ecological risk due to land use changes [20,43]. The evaluation results can provide a reference for the overall layout of the regional territorial space. In this study, a landscape ecological risk index evaluation model was established to analyze the spatiotemporal dynamic changes in the urban expansion and landscape ecological risk in the last 20 years. The research results provide a reference for space optimization, sustainable utilization of resources, and ecological risk prevention and control in the CCEC. The research methods and technical processes can provide a reference for the calculation of the landscape risk index across a wide range of research areas.
In the last 20 years, the overall landscape ecological risk in the study area was at a low level, and the resistance of the landscape pattern to external disturbances was stronger than that in other regions in China. The low-risk area increased from 14.18% to 21.52%, and it expanded in the core of the Sichuan Basin. The high-risk area decreased from 9.77% to 6.84%, and the high-risk areas changed from a banded distribution to a scattered planar distribution. The ecological risk index values of 16 cities in the study area ranged from 0.02 to 0.28, which was at a low level compared with other regions in China. The spatial distribution of the high per-capita GDP areas was highly consistent with that of the high landscape ecological risk.
This study is the first to quantitatively evaluate and diagnose the temporal and spatial changes in the landscape ecological risk in the CCEC. Our results suggest that a high landscape ecological risk results from a high-value ecological source, important ecological corridors, and high-value ecosystem service functions, which overlap with the development in the southwestern and eastern parts of the Chengdu-Chongqing Economic Circle [44], which was found to be closely overlapped by the high-value area of landscape ecological risk in this study. The high-risk area was located in the border region of the Sichuan Basin, which is an ecological shelter area for water conservation, soil and water conservation, and biodiversity in China [9]. This region is in urgent need of ecological protection and restoration.
In recent years, government departments have gradually carried out planning for important ecological protection spaces such as red lines for ecological protection and protected natural areas. The implementation of relevant protection policies and the strengthening of protection is one of the important reasons why the distribution characteristics of the high-risk areas have changed from a banded distribution to a scattered distribution. However, the delimited ecological protection space is fragmented and relatively independent. In particular, the synergy and the linkage of natural ecological protection at the junction of the two provinces is poor, making it difficult to adapt to the integrated development of the CCEC [45]. Therefore, in the future, the landscape ecological high-risk areas identified in this study should be included in the ecological protection red line, natural protection areas, and other controlled ecological spaces. The areas of increased landscape ecological risk in the study area are distributed in the area surrounding the expansion of land used for human activities, which is basically consistent with the research results of a previous study [46]. Therefore, the overall protection and restoration of the cultivated land and the prevention of forest land fragmentation in marginal areas caused by urban expansion should be strengthened in the territorial spatial planning and layout.
To some extent, the grid method divides the original natural ecosystem artificially, which has a certain impact on the assessment and analysis of the local landscape pattern. The specific size of the grid has obvious differences in reflecting the landscape as a whole and in detail. A grid that is too large or too small will affect its ability to reflect the real situation of landscape ecological risk. Based on grid scale analysis of the landscape ecological risk assessment in the mountainous areas in southwestern China, it has been found that when the grid scale is greater than 4 km, the difference in the landscape ecological risk assessment results tends to be stable [47]. Therefore, in this study we carried out landscape ecological risk assessment in the study area based on a 5 km × 5 km grid to ensure the overall accuracy of the research results. In addition, the number of grids in the study area was large, so the research results can reflect the local details of the study area more clearly. However, due to the 30 m resolution of the source data, the details of the landscape ecological risk are slightly weaker in the slender river ecosystems with widths of less than 30 m and in the forest ecosystems with large slopes. Due to the lag of satellite images, the global30 data are suitable for studies of large study areas and low time requirements for the data source, but they are not recommended for studies of small areas and precise data time requirements. In addition, in this study, a technical model for landscape ecological risk assessment was established using a flowchart for the computational processes, including ArcGIS, Fragstats batch processing, and other methods. This method reduces the difficulty of the execution of the research, effectively avoids the human error involved in the calculation process, and greatly improves the calculation speed. To some extent, it lays a technical foundation for subsequent national scale and larger scale research.
In this study, the threshold of the landscape ecological risk classification in the Chengdu-Chongqing region was quantified for the first time, which can be used as a reference for landscape ecological risk classification in the Chengdu-Chongqing region and even in the entire mountainous region in southwestern China. Based on the land use types, in this study, the past landscape ecological risks in the study area were investigated, but the prediction of future landscape ecological risks requires further research. Due to the large scope and complex structure of the ecosystem in the study area, there are still some deficiencies in this study. The grading threshold of the landscape ecological risk assessment results is suitable for longitudinal comparison within the study area, but its applicability to other study areas in China and around the world needs to be evaluated.

5. Conclusions

From 2000 to 2020, cultivated land was the main type of land use in the study area, accounting for more than 50% of the total land use. During the study period, the decrease in cultivated land was mainly due to the conversion of cultivated land to forest land and construction land. Among all of the land use types, construction land was the most changed, with a two-fold expansion in the past 20 years, which mainly occurred in the decade from 2010 to 2020. Chengdu and Chongqing were the two cores of the rapid expansion in all directions.
The average risk value of the 10,155 risk communities in the study area was about 0.16. Human activities such as urbanization expansion and agricultural development led to an increase in the landscape ecological risk in the areas surrounding the construction land and cultivated land. For areas with increased or unchanged risk values, the land use structure should be optimized, the coverage rate of the forest land and grassland should be increased, and the construction of ecological corridors within the region should be strengthened to ensure the connectivity and stability of the ecosystem. For the regions with reduced risk values, the intensity of human activities should be controlled, the ecological function of the landscape should be improved, and the high-quality coordinated development of the regional economic society and ecological civilization should be promoted.
Our results suggest that cities with rapid social and economic development face higher landscape ecological risks. Therefore, in the sustainable development of CCEC, ecological environment protection along the Yangtze River should be strengthened. The urbanization pattern along the Yangtze River should be optimized, as well as controls on the intensity of development, construction, and agricultural cultivation. The development of cities along the Yangtze River should be guided scientifically, The management of the regional landscape ecological risk and economic development requires co-construction, co-governance, joint prevention, and control.

Author Contributions

Conceptualization: C.Z. and J.H.; data curation: J.H.; formal analysis: C.Z., J.H. and Q.H.; funding acquisition: C.Z.; methodology: C.Z., J.H. and Q.H.; project administration: C.Z. and J.H.; resources: C.Z.; software: J.H. and Y.M.; visualization: J.H., Q.H. and Y.M.; supervision: C.Z.; writing—original draft: C.Z., J.H., Q.H. and Y.M.; writing—review and editing: C.Z., J.H., Q.H., Y.M. and B.Y. All authors have read and agreed to the published version of the manuscript.

Funding

This research was financially supported by the Chongqing Social Science Planning Project (No. 2019QNGL23), the Chongqing Natural Science Foundation Project (No. cstc2019jcyj-msxmX0227), the Chongqing Normal University Fund Project (No. 19XL13011), the Science and Technology Research Project of the Chongqing Education Commission (No. KJQN201900524), and Chongqing University Innovation Research Group funding (No.CXQT20015).

Institutional Review Board Statement

Not applicable.

Informed Consent Statement

Not applicable.

Data Availability Statement

The data in the article is detailed in Section 3.2. All the data used are reflected in the article. If you need other relevant data, please contact the author.

Acknowledgments

We are grateful for the 30 m resolution global land cover data provided by the Ministry of Natural Resources of China (http://www.globallandcover.com/ (accessed on 11 December 2020)).

Conflicts of Interest

The authors declare that there are no conflict of interest.

References

  1. Wang, K.; Lin, C.; Wu, C. Trends and planning choices after China’s urbanization rate reaching above 60%. City Plan. Rev. 2020, 44, 9–17. [Google Scholar]
  2. Wang, Z. Under the construction of talent team “first hand chess” to build Chengdu-Chongqing area shuangcheng economic circle important growth pole. Contemp. Party 2020, 19, 41–42. [Google Scholar]
  3. Huang, H.; Zhang, Q. Create an important growth pole and a new driving force for high-quality development across the country. Pioneer 2020, 11, 37–39. [Google Scholar]
  4. Wang, F.C.; Wang, D.C.; Zhang, L.H.; Liu, J.; Hu, B.; Sun, Z.; Chen, J. Spatiotemporal analysis of the dynamic changes in land use ecological risks in the urban agglomeration of Beijing-Tianjin-Hebei vegion. Acta Ecol. Sin. 2018, 38, 4307–4316. [Google Scholar]
  5. Westman, W.E. Ecology, Impact Assessment, and Environmental Planning; John and Wiley and Sons: Chichester, UK, 1984; pp. 212–223. [Google Scholar]
  6. Hunsaker, C.T.; Graham, R.L.; Suter, G.W.; O’Neill, R.V.; Barnthouse, L.W.; Gardner, R.H. Assessing ecological risk on a regional scale. Environ. Manag. 1990, 14, 325–332. [Google Scholar] [CrossRef]
  7. Chen, X.; Xie, G.; Zhang, J. Landscape ecological risk assessment of land use changes in the coastal area of Haikou City in the past 30 years. Acta Ecol. Sin. 2021, 41, 975–986. [Google Scholar]
  8. Peng, J.; Dang, W.X.; Liu, Y.X.; Zong, M.L.; Hu, X.X. Review on landscape ecological risk assessment. Sci. Geogr. Sin. 2015, 70, 664–677. [Google Scholar]
  9. Liu, D.; Yang, Y.; Zou, C. Thoughts on the Construction of Ecological Barrier in the Upper Reaches of the Yangtze River Under the Great Protection Strategy of the Yangtze River Economic Belt. Environ. Prot. 2019, 47, 22–25. [Google Scholar]
  10. Ke, X.; Gui, S.; Huang, H.; Zhang, H.; Wang, C.; Guo, W. Ecological risk assessment and source identification for heavy metals in surface sediment from the Liaohe River protected area, China. Chemosphere 2017, 175, 473–481. [Google Scholar] [CrossRef]
  11. Yang, Q.; Li, Z.; Lu, X.; Duan, Q.; Huang, L.; Bi, J. A review of soil heavy metal pollution from industrial and agricultural regions in China: Pollution and risk assessment. Sci. Total Environ. 2018, 642, 690–700. [Google Scholar] [CrossRef]
  12. Han, W.; Gao, G.; Geng, J.; Li, Y.; Wang, Y. Ecological and health risks assessment and spatial distribution of residual heavy metals in the soil of an e-waste circular economy park in Tianjin, China. Chemosphere 2018, 197, 325–335. [Google Scholar] [CrossRef] [PubMed]
  13. Du, Y.Y.; Peng, J.; Zhao, S.Q.; Hu, Z.C.; Wang, Y.L. Ecological risk assessment of landslide disasters in mountainous areas of Southwest China:A case study in Dali Bai Autonomous Prefecture. Sci. Geogr. Sin. 2016, 71, 1544–1561. [Google Scholar]
  14. Wang, C.; Ba, R.; Zhou, H.; Liu, Y.; Deng, G. Risk Evaluation of Debris Flows in Urban Area of Shimian County of Sichuan Province. Acta Ecol. Sin. 2014, 21, 219–223+228. [Google Scholar]
  15. Li, Y.; Tan, W.; Li, J.; Li, J.; Jiang, J. Environmental risk assessment method of coal mine rust water to drinking water sources and case study. J. Environ. Eng. Technol. 2021, 11, 823–828. [Google Scholar]
  16. Bo, F. Research on Ecological Risk Assessment in Neijiang Zigong Luzhou Section of “Chuan-Nan” High-Speed Railway. Master’s Thesis, Southwest Jiaotong University, Chengdu, China, 2017. [Google Scholar]
  17. Lu, Y.L.; Xu, L.F.; Ma, Z.W.; Yan, L.; Xu, X.G. Ecological risk assessment of five provinces around the Bohai Sea. Chin. J. Ecol. 2012, 31, 227–234. [Google Scholar]
  18. Wang, H.; Rao, E.; Xiao, Y.; Yan, Y.; Lu, H.; Zhu, J. Ecological risk assessment in Southwest China based on multiple risk sources. Acta Ecol. Sin. 2018, 38, 8992–9000. [Google Scholar]
  19. Du, J.; Zhao, S.; Qiu, S.; Guo, L. Land Use Change and Landscape Ecological Risk Assessment in Loess Hilly Region of Western Henan Province from 2000 to 2015. Acta Ecol. Sin. 2021, 28, 279–284+281. [Google Scholar]
  20. Hou, R.; Li, H.; Gao, Y. Ecological Risk Assessment of Land Use in Jiangxia District of Wuhan Based on Landscape Pattern. Acta Ecol. Sin. 2021, 28, 323–330+403. [Google Scholar]
  21. Xu, Z.Y.; Luo, Q.H.; Xu, Z.L. Consistency of Land Cover Data Derived from Remote Sensing in Xinjiang. J. Geogr. Inf. Sci. 2019, 21, 427–436. [Google Scholar]
  22. Liu, D.; Chen, H.; Zhang, M.; Shang, S.; Liang, X. Analysis of Spatial-temporal Distribution of Landscape Ecological Risk in Ecologically Vulnerable Areas and Its Terrain Gradient—A Case Study of Mizhi County of Shaanxi Province. Res. Soil Water Conserv. 2019, 26, 239–244+251. [Google Scholar]
  23. Yu, L.; Zhang, F.; Zang, K.; He, L.; Wan, F.; Liu, H.; Zhang, X.; Shi, Z. Potential Ecological Risk Assessment of Heavy Metals in Cultivated Land Based on Soil Geochemical Zoning: Yishui County, North China Case Study. Water 2021, 13, 3322. [Google Scholar] [CrossRef]
  24. Zhang, S.; Zhong, Q.; Cheng, D.; Xu, C.; Chang, Y.; Lin, Y.; Li, B. Coupling Coordination Analysis and Prediction of Landscape Ecological Risks and Ecosystem Services in the Min River Basin. Land 2022, 11, 222. [Google Scholar] [CrossRef]
  25. Jing, M.; Xu, L.; Xu, Q. FLUS-Markov model-based multiscenario evaluation and prediction of the landscape ecological risk in Kezhou, South Xinjiang. Arid Zone Res. 2021, 38, 1793–1804. [Google Scholar]
  26. Chen, D.; Shi, L. The Landscape Ecological Risk Assessment and Prediction for Xiong’an New Area Based on Land Use Change. Ecol. Econ. 2021, 37, 224–229. [Google Scholar]
  27. Wang, S.; Zhang, Q.; Wang, Z.; Yu, L.; Xiang, S.; Gao, M. GIS-based ecological risk assessment and ecological zoning in the Three Gorges Reservoir area. Acta Ecol. Sin. 2022, 11, 1–11. [Google Scholar]
  28. Wei, F.; Liu, J.; Xia, L.; Long, X.; Xu, Z. Landscape ecological risk assessment in Weibei Dryland Region of Shaanxi Province based on LUCC. China Environ. Sci. 2022, 42, 1–12. [Google Scholar] [CrossRef]
  29. Hou, W.; Hou, X.Y. Consistency of the Multiple Remote Sensing-based Land Use and Land Cover Classification Products in the Global Coastal Zones. J. Geogr. Inf. Sci. 2019, 21, 1061–1073. [Google Scholar]
  30. Hu, J.; Chen, J.; Peng, S. Hot-spot Analysis of GlobeLand30 Data Studying. Remote Sens. Inf. 2018, 33, 1–7. [Google Scholar]
  31. Shi, X.; Nie, S.; Ju, W.; Yu, L. Climate effects of the GlobeLand30 land cover dataset on the Beijing Climate Center climate model simulations. Sci. China Earth Sci. 2016, 46, 1197–1208. [Google Scholar] [CrossRef]
  32. Jun, C.; Ban, Y.; Li, S. Open access to Earth land-cover map. Nature 2014, 514, 434. [Google Scholar] [CrossRef] [Green Version]
  33. Ran, Y.; Li, X. First comprehensive fine-resolution global land cover map in the world from China Comments on global land cover map at 30-m. Sci. Sin. 2015, 45, 1243–1244. [Google Scholar] [CrossRef]
  34. Luo, Z.; Zeng, J. Spatial growth simulation of land use in Tianjin from the perspective of resource and environmental protection. Geogr. Res. 2022, 41, 341–357. [Google Scholar]
  35. Cao, Q.W.; Zhang, X.W.; Ma, H.K.; Wu, J.S. Review of landscape ecological risk and an assessment framework based on ecological services: ESRISK. Sci. Geogr. Sin. 2018, 73, 843–855. [Google Scholar]
  36. Yu, D.; Liang, Z.; Xiao, Z.; Sun, C.; Zheng, Y. Temporal and Spatial Characteristics of Land Ecological Risk in Nanchang City Based on Landscape Ecology. Acta Ecol. Sin. 2020, 27, 213–220. [Google Scholar]
  37. Zhou, R.J.; Zhang, Y.Z.; He, H.C. Ecological risk assessment based on land use changes in the coastal area in Yancheng city. Geogr. Res. 2016, 35, 1017–1028. [Google Scholar]
  38. Rangel-Buitrago, N.; Neal, W.J.; de Jonge, V.N. Risk assessment as tool for coastal erosion management. Ocean Coastal. Manag. 2020, 186, 105099. [Google Scholar] [CrossRef]
  39. Bai, S. Study on Landscape Ecological Risk Assessment of Western Jilin Based on Land Use Change. Master’s Thesis, Jilin University, Changchun, China, 2019. [Google Scholar]
  40. Ma, Y.; Liu, Z. Assessment of landscape ecological risk and its dynamic response with urbanization development of Jiangsu Province. J. Nanjing For. Univ. Nat. Sci. Ed. 2021, 45, 185–194. [Google Scholar]
  41. Liu, M.Z.; Wang, Y.F.; Pei, H.W. Landscape Ecological Risk Assessment in Bashang Area of Hebei Province Based on Land Use Change. Bull Soil. Water Conserv. 2020, 40, 303–311+345. [Google Scholar]
  42. Yang, X. Landscape Ecological Risk Evaluation of Lanxi City Cluster and Its Early Warning Research. Master’s Thesis, Northwest Normal University, Lanzhou, China, 2021. [Google Scholar] [CrossRef]
  43. Wang, F.; Ye, C.S.; Hua, J.Q.; Li, X. Coupling relationship between urban spatial expansion and landscape ecological risk in Nanchang City. Acta Ecol. Sin. 2019, 39, 1248–1262. [Google Scholar]
  44. Zhao, W.; Zou, X.; Pu, H. Construction of ecological security pattern in Chengdu-Chongqing Twin-City Economic Circle. China Environ. Sci. 2021, 41, 2423–2433. [Google Scholar]
  45. Zheng, K.; Luo, B.; Wang, H.; Liu, D.; Gu, C. Thoughts on the community participation in natural ecological protection supervision in the Two-city Economic Circle of Chengdu and Chongqing. Environ. Sustain. Dev. 2021, 46, 115–119. [Google Scholar]
  46. Li, C.; Gao, B.; Wu, Y.; Zheng, K.; Wu, Y. Dynamic simulation of landscape ecological risk in mountain towns based on PLUS Model. Zhejiang A&F Univ. 2022, 39, 84–94. [Google Scholar]
  47. He, J.; Wu, L.; Zhang, L.; Chen, M. Landscape ecological risk assessment of Three Gorges Reservoir Area Based on Ecological Community. Ecol. Environ. Monit. Three Gorges. 2022, 1–19. [Google Scholar]
Figure 1. Location of study area.
Land 11 00659 g001
Figure 2. Schematic diagram of the ecological risk plot division in the study area.
Land 11 00659 g002
Figure 3. Flowchart for calculating the landscape ecological risk index.
Land 11 00659 g003
Figure 4. Landscape patterns showing the distributions of the land use types in 2000, 2010, and 2020.
Land 11 00659 g004
Figure 5. Areas of land use types in 2000, 2010, and 2020 and the dynamic degree of land use from 2000 to 2020.
Land 11 00659 g005
Figure 6. Changes in the risk values of each risk community from 2000 to 2010 and from 2010 to 2020.
Land 11 00659 g006
Figure 7. Land use type conversions and ecological risk changes from 2000 to 2020.
Land 11 00659 g007
Figure 8. Conversion of cultivated land and construction land and changes in the ecological risk.
Land 11 00659 g008
Figure 9. Landscape ecological risk classification from 2000 to 2020.
Land 11 00659 g009
Figure 10. Statistical chart of the landscape ecological risk index values of 16 cities in 2000, 2010, and 2020.
Land 11 00659 g010
Figure 11. Changes in the per-capita GDP from 2000 to 2020.
Land 11 00659 g011
Table 1. Land use landscape transfer matrix from 2000 to 2020 (km2).
2020Cultivated LandForest LandGrass LandWater AreaConstruction LandUnused LandTotal
2020
Cultivated land117,959368412098894866210,651
Forest land290781,1262901258205156285
Grassland1795500410,92736535947527
Water area52375112210666-777
Construction land265-22281868-316
Unused land-16--97
Total5491876442501540549621
Table 2. Per-capita GDP and E R I k statistics for the 16 cities based on the three-year average (2000, 2010, and 2020).
City NamePer-Capita GDP
(Million Yuan)
E R I k City NamePer-Capita GDP
(Million Yuan)
ERIk
Chongqing3.590.17Mianyang2.930.15
Chengdu5.370.15Nanchong1.770.15
Dazhou1.820.15Neijiang2.040.15
Deyang3.320.15Suining2.060.14
Guangan1.950.15Yaan2.430.14
Leshan2.930.19Yibin2.830.19
Luzhou2.340.19Ziyang1.730.14
Meishan2.330.15Zigong2.610.16
Publisher’s Note: MDPI stays neutral with regard to jurisdictional claims in published maps and institutional affiliations.

