Abstract
Financial inclusion, which consists of having a financial system that is easily accessible to citizens, is identified by various international organizations such as the new UN Agenda 2030, as a priority objective. This objective is particularly relevant in rural areas, where access to these services is more difficult, as citizens have to travel several kilometers to access them. In this study, we analyze the current situation of the Polish financial sector in terms of its accessibility, in order to measure the degree of financial inclusion. For this purpose, we use three combined methodologies. Initially, a data extraction from the Central Bank of Poland was carried out. Subsequently, three methodologies are applied to calculate financial inclusion. First, we apply the criteria of the Financial Access Survey (FAS) of the International Monetary Fund. Secondly, the Access to Cash Index (ACI) methodology by calculating a score that describes the access to banking services according to certain items. Finally, we applied the nearest neighbor methodology to detect in each voivodship those points where it is most difficult (measured in km distance) to access banking services. Some areas, especially in rural areas of the different voivodeships, present certain problems when it comes to accessing banking services. Therefore, the fulfillment of SDG 8.10 will be more difficult to achieve in these areas. The public authorities must pay attention to this, in order to reach the commitments acquired with the 2030 agenda, in terms of financial inclusion.
1. Introduction
Promoting an inclusive financial sector is one of the main objectives of different governments and international organizations [1,2,3,4]. In 2015 the new UN Agenda 2030 highlighted expanded access to financial services in 5 of its 17 new Sustainable Development Goals (hereafter SDGs) [5,6]. However, financial inclusion is a multidimensional concept. This characteristic makes it difficult to draw a single, clear map of causal relationships between financial inclusion and sustainable development, although several authors have shown that such a relationship does exist [7,8,9]. Theory tells us that access to financial services on favorable terms makes it easier to plan spending, control consumption patterns, address health-related risks and make investments not only in productive ventures, but also in training and education [10]. Several authors have studied the benefits of financial inclusion. Generally speaking, most have analyzed specific dimensions based on cases and evaluations of particular programs implemented around the world. Klapper et al. [5] summarize the empirical evidence on how financial inclusion can help achieve the SDGs. Based on the case studies analyzed, the paper argues that some goals are promoted directly (goals 1, 2, 3, 4 and 5) while others (6, 7, 8, 9, 10 and 16) are promoted indirectly. Similarly, Demirguc-Kunt et. al. [6] conduct an analysis of the empirical evidence differentiating by categories of financial products.
However, the SDG with the strongest connection to financial inclusion is SDG 8: Decent work and economic growth; point 8.10 states the objective: Strengthen the capacity of domestic financial institutions to promote and expand access to banking, financial and insurance services for all. Therefore, the current situation of financial inclusion in Poland has been the subject of analysis in this article. To this end, we have first conducted a literature review on financial inclusion in Poland. Secondly, after extracting data from the Polish central bank, we have applied three methodologies to calculate financial inclusion. First, the application of the criteria of the Financial Access Survey (FAS), which is collected by the IMF at the voivodship level. Secondly, the Access to Cash Index methodology already tested by several authors on a city-by-city basis. Finally, the KNN nearest neighbor methodology to detect in each voivodship those points where it is most difficult (measured in km distance) to access banking services.
There are several studies on financial inclusion in Poland that show the importance of financial inclusion [11,12]. In [13] it is pointed out that in Poland there is a dominant position of cash payments in the payment system; and therefore the authorities should take this into account in order to promote financial inclusion, the same conclusion is endorsed by [14,15] in his study points out the importance of financial inclusion in Poland, especially among young people; [16], when studying the unbanked in Poland, detects a special need for protection of the elderly, young people and people living in rural areas. Additionally, it is precisely in these rural areas that financial inclusion is of great importance, as the study [17,18] points out that “financial inclusion is an essential component of the financial capability index in rural areas” as it determines economic development. Therefore, ensuring financial inclusion in Polish rural areas is necessary to fulfil sustained economic development [18,19], with access to banking services, ATMs, etc. in these areas being ensured, and financial education is also necessary for this [20]. It is also necessary to ensure financial inclusion through banking services to avoid the emergence of large groups of excluded people, as the results of this “non-use of banking services” clearly affect the economic development of a country [21].
As in any other place in the world, having access to banking institutions is essential to be able to carry out day-to-day tasks; however, while this seems so obvious, it is not always fulfilled in some rural municipalities of the country [20,21,22,23,24]. Financial inclusion ensures that the population has access to an appropriate level of financial services [22,23]. The significant reduction of bank branches in recent years has increased the risk of financial exclusion for some customers in rural areas [24,25]. In many cases, this reduction of banks is mainly due to two issues. On the one hand, the shrinking population, especially in municipalities with less than 10,000 inhabitants, and, on the other hand, the fact that the younger generation is increasingly using online banking [24,25]. Digitalization is playing an increasingly important role in this respect, but online banking needs to be brought closer to the population to help them carry out their daily transactions [26]. However, this is not enough, as the presence of bank branches in rural areas is vital for their population and for the survival of these areas [19,24].
To adequately answer this question, it is necessary to be aware of the profile of people in rural areas and the type of businesses that are developed in rural areas [27,28,29,30]. Firstly, we are talking about an ageing population, which finds it difficult to relate to digital banking and even “multi-function” ATMs, secondly, we also refer to agribusinesses, those that are attached to the land and need an advisor [17,18].
On the other hand, empirical evidence shows that rural areas subject to strong demographic stresses, in particular population ageing and low population density, are particularly at higher risk of financial exclusion [31,32].
The consequences of financial exclusion in rural areas have also been studied by academics. Sin Tian Ho & Berggren [29] examine the impact of bank branch closures on entrepreneurial activity beyond the administrative boundaries of a municipality. These authors identify some influence between proximity to bank branches and new firm formation. Along the same lines [30] conclude that a greater functional distance between banks and local economies tightens financing constraints, especially for SMEs. Moreover, this restriction is not compensated by a greater availability of credit due to the reduction of the operating distance. Other authors, such as Devlin or Coppock [31,32] focus their study on the impact of financial exclusion on households in rural England [33]; or Panigyrakis [34] do so in remote island territories located in Greece, where the dissatisfaction of citizens residing in these areas is identified. Other research has designed a methodology to identify areas affected by the difficulty of access to financial services. Náñez Alonso et al. [35] propose the construction of an index to detect rural areas at risk of financial exclusion, taking the Spanish region of Ávila as a case study. The results of this study show that more than 80% of the municipalities in this area have difficulties in accessing financial services. The authors also apply the same method to the less densely populated areas of the Spanish region of Castilla y León, known as “Empty Spain” [36]. On the other hand, accelerated economic digitalization is transforming traditional models of economic and social organization [37]. The financial sector is no stranger to this transformation. On the contrary, it is one of the sectors most affected by the changes and opportunities offered by digital technologies. In this context, several studies have analyzed the impact of banking digitalization on digital exclusion in rural areas. Authors such as [38] conducted a study to identify the degree of penetration of digital financial services in rural areas and the behavioral pattern of e-banking users. Others such as [39] analyses the possible acceptance of a Central Bank Digital Currency (CBDC) in rural areas as an alternative to the difficulties of access to cash in areas at risk of financial exclusion. As indicated in the introduction and at the beginning of this section, financial inclusion is a tool that enhances the generation of opportunities and strengthens the capacity to achieve the SDGs. Specifically, it contributes to increasing the wellbeing of people, especially those living in rural areas, through greater access to and use of financial services. Although these are areas of great socio-economic diversity, they have a major influence on the development of Poland [40]. Rural areas are of great importance for the Polish economy and are a key player in achieving sustainable development [41,42,43]. The objective of this article was to measure compliance with SDG 8.10 (ensuring access to banking services) by combining a three-pronged methodology based, first, on the FAS indicators (number of bank branches per 100,000 inhabitants and offices per 1000 m2). Secondly, by applying the Access to Cash index (ACI) methodology and thirdly by measuring the distance required from the furthest point to access this type of financial services.
2. Materials and Methods
2.1. Data Collection
Firstly, data was extracted from the Central Bank of Poland (Narodowy Bank Polski) through its website with an advanced data search engine [44]. After extracting data on bank branches by voivodeship, municipality, city and postcode, as well as on branches with ATMs, we generated a dataset with 10,677 records on bank branches and another one with 3279 records. Given the size of the dataset, it is available online as Supplementary Materials to this manuscript. All data available in the study and analyzed were extracted in January 2022.
2.2. Methodology of Analysis
After extracting the data from the Polish central bank, as described in the Section 2.1, we have applied three methodologies to calculate financial inclusion. Firstly, the application of the criteria of the Financial Access Survey (FAS), which is collected by the International Monetary Fund, but in this case the novelty lies in applying it at the voivodeship level [45]. The two key indicators we have used are: Firstly, the number of commercial offices per 100,000 adult inhabitants; and secondly bank offices per 1000 m2 [46].
Secondly, the Access to Cash Index (ACI) methodology by calculating a score that describes the situation of access to banking services according to certain items, and the number of kilometers to travel to obtain access to cash and banking services; it has been already tested by several authors and city-by-city studies; as shown in Table 1.

Table 1.
Studies on access to banking and financial services.
Thus, for the case of Poland, considering data availability, the equation (Equation (1)) for calculating access to cash would be denoted as follows:
Equation (1) is based on Tischer et al., Evans et al. and Náñez Alonso et al. [24,39,50] where ACI is the score obtained (Access to Cash Index), x1 would be the number of bank branches, and x2 would be the number of ATMS. The score assigned (1), to each bank, is derived from the limited opening hours (business hours), the fact that they only deliver cash to customers of the bank or savings bank and the collection of possible fees from customers of other banks/savings banks. The score assigned (3) to ATMs derives from their 24 h availability, their being available to anyone, not only to the operator’s customers and at no cost (withdrawal commission) to customers. Finally, the methodology nearest neighbor [56,57,58,59,60,61] to detect in each voivodeship those points where there is more difficulty (measured in km of distance) to access banking services. All of this was processed using Tableau Desktop professional edition software, which allowed the results to be displayed graphically, as shown in Figure 1.
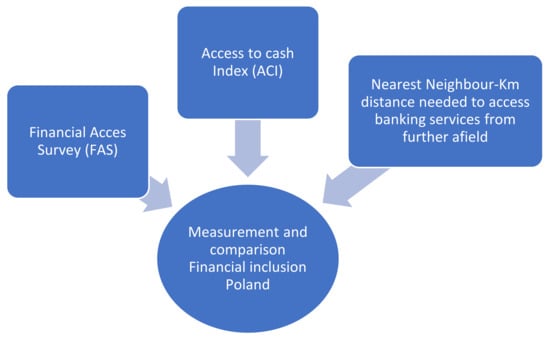
Figure 1.
Methodology applied. Source: own elaboration.
The application of this triple methodology and the results obtained will therefore allow us to verify the degree of compliance with SDG number 8.10, which consists of “strengthening the capacity of national financial institutions to promote and expand access to banking, financial and insurance services for all”. The application of this triple methodology and the results obtained will therefore allow us to verify the degree of compliance with SDG number 8.10, which consists of “strengthening the capacity of national financial institutions to promote and expand access to banking, financial and insurance services for all”. The use of this triple methodology of financial inclusion analysis will allow us to obtain a better picture of the real situation by combining purely technical criteria used by the MFI’s M&As, with geographical and spatial criteria derived from the ACI (which mixes economics and geography).
3. Results
3.1. Results Obtained from the Partial Application of the FAS
After extracting data from the Polish central bank, we have applied three methodologies to calculate financial inclusion. Firstly, the application of the criteria of the Financial Access Survey (FAS), which is collected by the International Monetary Fund, but in this case the novelty lies in applying it at the voivodeship level [45]. The two key indicators we have used are: the number of commercial offices per 100,000 adult inhabitants and bank offices per 1000 m2 [46]. The results obtained are shown in the figure below (Figure 2) and also in Table A1 in the Appendix A.
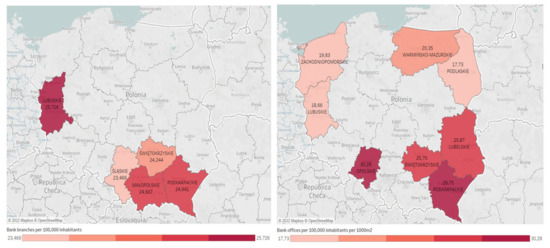
Figure 2.
Voivodeships with the fewest bank offices per 100,000 inhabitants and the fewest bank offices per 1000 m2. Source: Own elaboration based on data from Table A1 and Tableau Desktop Professional Edition.
As can be seen in Figure 2, left side, the voivodships that present a result furthest away from the Polish average (27.79 bank offices per 100,000 inhabitants) are Lubuskie (25.73), Małopolskie (24.94), Podkarpackie (24.94), Śląskie (23.47) and Świętokrzyskie (24.24). As can be seen, the southern part of Poland is clearly the worst performer in terms of bank branches per 100,000 inhabitants, and a pattern can be detected here, namely that the southern part, considering only this criterion, would be the most difficult to access banking services. The other area is the western area, bordering the German border. Although it is true that in the case of Małopolskie and Śląskie, which have high absolute values, the explanation is that they are also highly populated voivodships. In the rest of the voivodships below the average, the situation of access to cash and banking services may be more complicated. Additionally, from Figure 2, right-hand side, we can extract the result of those voivodeships that are further away from the Polish average (36.46) in terms of bank branches per 1000 m2. In this case, the voivodships Lubelskie (25.87), Lubuskie (18.66), Opolskie (30.28), Podkarpackie (29.75), Podlaskie (17.73), Świętokrzyskie (25.70), Warmińsko-Mazurskie (20, 35) and Zachodniopomorskie (19,83) are below or far below, so it is on these voivodships that we will focus the analysis through the other two methods. Again, there are three clear patterns in terms of possible difficulty in accessing banking services. Firstly, the south zone repeats this result and is configured as an area where there may be difficulties in accessing banking services and cash. Secondly, the western area bordering Germany repeats the result (and is even further extended) and is again identified as an area where there may be difficulties in accessing banking services and cash. In third place, the entire eastern area from the south to the north of the Polish–Ukrainian border appears by this criterion. From the combination of both results we can see that three voivodeships are below the average in both indicators: Lubuskie, Podkarpackie and Świętokrzyskie. In the Appendix B, the full maps for both items can be found as Figure A1 and Figure A2. If we consider, the population density of the voivodeships we can observe the relations between high concentration of inhabitants and access to banking services or high dispersion of inhabitants and their access.
The voivodeships with the highest population density, as shown in Table A1 in Appendix A, are Dolnośląskie, Łódzkie, Małopolskie, Mazowieckie, Podkarpackie and Śląskie. If we compare this higher value (which implies high concentration of inhabitants), we observe how there is a relationship between this high population density and also with the number of bank offices per 100,000 inhabitants except in Dolnośląskie and Małopolskie which are slightly below the average. If we compare this result with bank offices per 1000 m2, all voivodeships obtain high results. Therefore, in these voivodeships that are densely populated financial inclusion would be relatively easier.
On the contrary, the voivodeships with the lowest population density, as shown in Table A1 in the Appendix A would be Lubelskie, Lubuskie, Podlaskie, Warmińsko-Mazurskie and Zachodniopomorskie. If we compare this lower value (which implies great dispersion of inhabitants), we observe how there is a great relation between this dispersion and the number of bank offices per 100,000 inhabitants; Lubuskie, and Zachodniopomorskie are the ones that obtain a worse relation (higher population dispersion and lower number of bank offices). If we compare the data of population density per voivodeship with the number of bank offices per 1000 m2, we observe how in these voivodeships (Lubelskie, Lubuskie, Podlaskie, Warmińsko-Mazurskie and Zachodniopomorskie) there is again a strong relationship between population dispersion and worse results in terms of access to banking services. Additionally, all these voivodeships (again highlighting Lubuskie, and Zachodniopomorskie) have the worst results.
3.2. Results Derived from the Application of the ACI
The application of the Access to cash index methodology developed in the Section 2.2, has allowed us to generate a series of maps (Figure 3, Figure 4 and Figure 5), which represent in each Polish voivodeship, at province level, how easy or difficult it is to access financial services (bank office and ATM). Furthermore, as additional material, a dataset has been generated and can be accessed (see additional material), which shows the score province by province in each voivodeship. The interpretation of the maps to be made is as follows. First of all, the areas in each voivodeship that are shown in white mean that there is no score available in that area. Therefore, in this white area, there is no way to access financial services. Secondly, the light blue–dark blue color range is used for the scores (ranging from 1 to 73 points). Thus, the lighter the blue color, the lower the score in that area, the more difficult it is to access banking services. Conversely, the darker the color, the higher the score in this area, and, therefore, the easier it is to access banking services. Figure A3 in Appendix B shows the complete map of Poland.
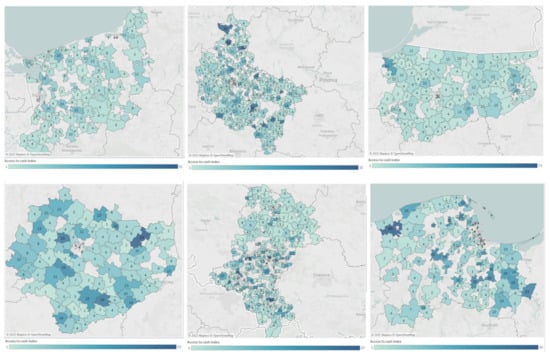
Figure 3.
Results of the Access to Cash index in Zachodniopomorskie, Wielkopolskie, Warmińsko-Mazurskie, Świętokrzyskie, Śląskie and Pomorskie voivodeships. Source: Prepared by the authors using Tableau Desktop Professional Edition.
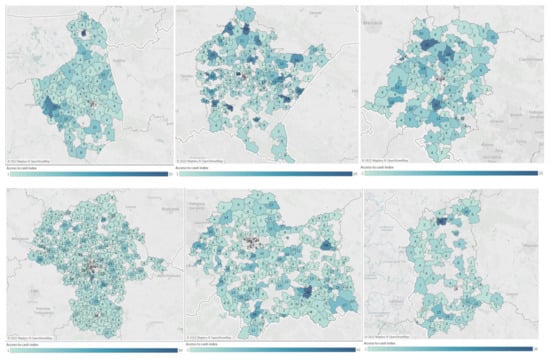
Figure 4.
Results of the Access to cash index in Podlaskie, Podkarpackie, Opolskie, Mazowieckie, Małopolskie and Lubuskie voivodships. Source: Prepared by the authors using Tableau Desktop Professional Edition.
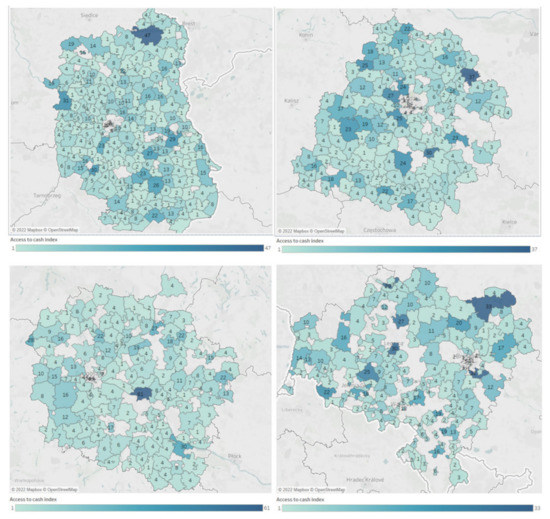
Figure 5.
Results of the Access to Cash index in Lubelskie, Łódzkie, Kujawsko-Pomorskie and Dolnośląskie voivodships. Source: Prepared by the authors using Tableau Desktop Professional Edition.
As can be seen in Figure 3, in Zachodniopomorskie voivodeship the highest ICA values are found in the capital city of Szczecin. There are, however, two areas in this voivodeship in white (no score), which indicate that financial services are not accessible. On the one hand, the central area east of Szczecin and on the other hand a curved line from the coast (Kolobzerg) to Walcz. As far as the Wielkopolskie voivodship is concerned, the distribution is quite good. The highest concentration is in Poznan and only a large area north of Kalisz is white, indicating that financial services are not accessible. In Warmińsko-Mazurskie, only a few isolated points are found, with access to financial services in this voivodeship having a very good spatial distribution. The highest values are concentrated in Olsztyn and Elblag. As for the Świętokrzyskie voivodeship, the same is true as in the previous case. Only a few isolated points are found, with access to financial services in this voivodeship having a very good spatial distribution. The highest values are concentrated in Kielce. In Śląskie voivodeship, we find high ACI scores and thus higher accessibility to financial services in Katowice, Gliwice, Bielsko-Biala and Czestochowa. Finally, in Pomorskie voivodeship we find an uneven distribution. On the one hand, Gdansk, Gdynia, and Sopot as well as the coastal area and the eastern area bordering Warmińsko-Mazurskie have a high concentration of points and therefore easy access to financial services. However, the south-western and central parts of the voivodeship have white areas indicating that financial services are not accessible.
As can be seen in Figure 4, in Podlaskie voivodeship the highest ICA values are found in the capital Bialystok as well as in Suwalki in the north and Lomza in the west. The distribution of financial services is in principle correct. There are, however, two white zones in this voivodeship in the area of the border with Belarus and Ukraine, and on the other hand in the southern hinterland. The Podkarpackie voivodeship concentrates large areas of access to financial services in Rzeszow and Mielec. However, in this southern voivodeship there are large white areas in the area of the border with Slovakia. In these areas it will be more difficult to access financial services. In the case of Opolskie voivodeship, the values are not very high. They are mainly concentrated in the capital Opole. The distribution of access to financial services is orderly, although there are three white areas, in the area of the border with Śląskie, with Dolnośląskie and on the southern border with the Czech Republic. The Mazowieckie voivodeship has the highest values in and around Warsaw, the capital of the voivodeship and Poland. Thus, the capital effect, which concentrates banking services, is noticeable. In the rest of the voivodeship only two areas are white. Firstly, in the north-eastern part of Warsaw, and secondly, a line in the south-eastern part bordering the voivodeships from Podlaskie in the east to Lubelskie in the south. In these areas it will be more difficult to access financial services. In the Małopolskie voivodeship there is a high concentration of access points to financial services in Kraków (the capital of the voivodeship) and adjacent areas and in other areas such as Tarnow and Nowy Sacz in the east. Precisely the white areas indicating that services are not accessible in this voivodship are located in the south-west of Tarnow and also in the west and south-west of Nowy Sacz. Lubuskie voivodeship has one of the lowest scores in Poland. While there are areas where access to financial services is easy, such as Zielona Gora Gorzów Wielkopolskie, there are also quite a few blank areas. Firstly, in the central Lubuskie area between Zielona Gora Gorzów Wielkopolskie, secondly, a whole parallel line in the northern area bordering the Wielkopolskie voivodship, thirdly, the whole area south-east and south-west of Zielona Gora, and fourthly and lastly, the area bordering Germany (Cottbus) in the west.
As far as Lubelskie voivodeship is concerned, as we can see in Figure 5, the distribution of access to financial services is orderly. There are few white areas and most of the access points to financial services are concentrated in Lublin (its capital) as well as in Biala Podlaskie in the north. As far as the Łódzkie voivodeship is concerned, the distribution of access to financial services is also orderly. There are few white areas and most of the access points to financial services are concentrated in Lodz (its capital). The most difficult area to access financial services is in the south-eastern part of Lodz, bordering Mazowieckie voivodeship. In Kujawsko-Pomorskie voivodeship the distribution of access to financial services is also orderly. There are few white areas and most of the access points to financial services are concentrated in Bydgoszcz (its capital). The area with the greatest difficulty in accessing financial services is in the central part of the voivodeship, as well as in the north-east and south-east. Finally, in the Dolnośląskie voivodeship, there is a high concentration of access points to financial services in Wroclaw and Legnica. There are three zones in white. Firstly, the north-east and south-east of Legnica, secondly, the area east and west of Wroclaw, and thirdly, the entire southern part of the voivodship bordering the Czech Republic. Figure A4 in Appendix B shows these points for the whole of Poland. The Appendix B also contains a table (Table A2) showing the highest ACI scores at the city level; Warsaw comes first with 770 points followed by Szczecin (648 points), Poznan (538 points) and Kraków (433 points).
A 3.3 km distance is needed to access financial services from the furthest point in each voivodship.
Finally, the application of the nearest neighbor methodology has allowed us to generate the following results. The points in each voivodeship where it is most difficult (measured in km distance to the nearest point) to access banking services have been detected. All this has been processed through the Tableau Desktop professional edition program, which has made it possible to display the results graphically. Figure 6 shows the results for all voivodships.
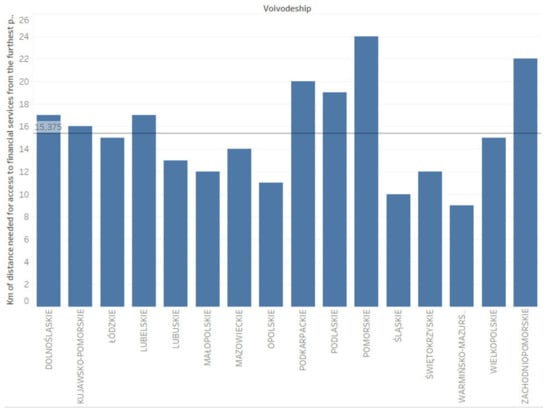
Figure 6.
Kilometers of distance needed for access to financial services from the furthest point in Zachodniopomorskie, Wielkopolskie, Warmińsko-Mazurskie, Świętokrzyskie, Śląskie, Pomorskie, Podlaskie, Podkarpackie, Opolskie, Mazowieckie, Małopolskie, Lubuskie, Lubelskie, Łódzkie, Kujawsko-Pomorskie and Dolnośląskie voivodships. Source: Prepared by the authors using Tableau Desktop Professional Edition.
In the case of Zachodniopomorskie, we have detected with our methodology that at the furthest point citizens have to travel up to 22 km if they want to access financial services from that furthest point. In the case of Wielkopolskie, the distance that must be travelled to access these financial services is set at 15 km. In Warmińsko-Mazurskie voivodeship, the distance is shorter than in the previous case and is set at 9 km. In Świętokrzyskie, the distance to access financial services is somewhat longer, up to 12 km, although it is shorter than in the first two voivodships analyzed. In Śląskie we find 10 km and in Pomorskie 24 km, the latter being the one with the longest distance to travel to access financial services. As we can see in Podlaskie voivodeship, the distance needed to access financial services is 19 km. In the case of Podkarpackie voivodeship, it takes up to 20 km to access financial services and to withdraw cash. In Opolskie voivodeship, it takes only 11 km from the furthest point of the voivodeship to access financial services. It is also the shortest distance from the furthest point of the voivodships analyzed in Figure 7. In the case of Mazowieckie, it takes 14 km to access financial services. It is the voivodeship with the highest number of financial institutions due to the capital effect of Warsaw. In Małopolskie voivodeship it takes 12 km to access financial services, which is very similar to Mazowieckie voivodeship. Finally, in Lubuskie Voivodeship, it takes 13 km to access financial services from the furthest point. This figure is very similar to that obtained in the previous voivodships. Figure 6 shows that in Lubelskie voivodeship, it takes up to 17 km from the furthest point to access financial services. In the case of Łódzkie voivodeship, the figure is 15 km. For Kujawsko-Pomorskie voivodeship, 16 km are needed to access financial services from the furthest point. Finally, in Dolnośląskie Voivodeship, the distance needed to access the above-mentioned financial services is 17 km. If we compare the population density of each voivodeship shown in Table A1 in Appendix A with the number of kilometers needed to travel from the farthest point to access banking services, we can observe the relationship between high concentration of inhabitants and access to banking services or high dispersion of inhabitants and mileage. If we take the voivodeships with a large population dispersion (lower population density): Lubelskie, Lubuskie, Podlaskie, Warmińsko-Mazurskie and Zachodniopomorskie; we observe how the distance to travel is considerable, although they are in some cases below the average for Poland. The two voivodeships with the worst results (low density and high number of kilometers) are: Zachodniopomorskie (22 km) and Podlaskie (19 km); followed by Lubelskie and Lubuskie, with 17 and 13 km, respectively.
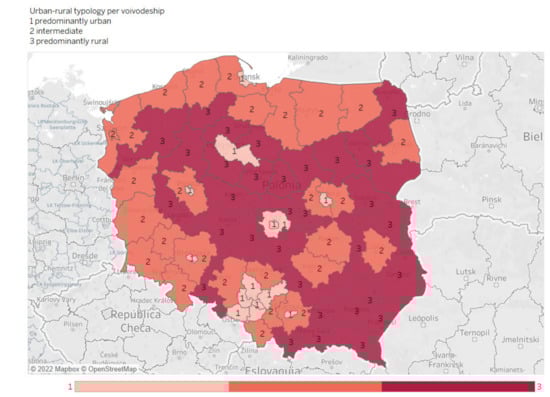
Figure 7.
Urban–rural typology for each voivodeship using NUTS-3. Source: own elaboration using Tableau Desktop professional edition based on data extracted from Eurostat.
To complete the analysis of kilometer distances from the farthest point of each voivodeship to access financial services, Figure 7 includes the delimitation of each voivodeship as a rural, intermediate or urban area. All this according to the classification made by Eurostat for each region at NUTS-3 level [62]. Eurostat defines these zones as follows: NUTS 3 regions are classified as follows, according to the proportion of their population in rural areas:
- “Predominantly rural” if the proportion of the population living in rural areas is more than 50%.
- “Intermediate” if the percentage of the population living in rural areas is between 20 and 50.
- Predominantly urban” if the proportion of the population living in rural areas is less than 20%.
If we compare the results obtained in the maps contained in Figure 1, with the results obtained in the map representation in Figure 7 there is a perfect match between rural areas (marked with the number 3 and in dark red) in Figure 7; with the voivodeships with the fewest bank offices per 100,000 inhabitants and the fewest bank offices per 1000 m2. As regards the result of bank offices per-100,000 inhabitants, the voivodeships with the worst result (and thus the greatest difficulty in accessing financial services) were Świętokrzyskie, Śląskie, Podkarpackie, Małopolskie and Lubuskie. These voivodeships according to the NUTS-3 classification are defined as rural, except partially Małopolskie and Lubuskie. As far as the result of bank offices per 1000 m2 is concerned, the voivodeships with the worst result (and thus the greatest difficulty in accessing financial services) were Zachodniopomorskie, Warmińsko-Mazurskie, Świętokrzyskie, Podlaskie, Podkarpackie, Opolskie, Lubuskie and Lubelskie. In the case of Świętokrzyskie, Podkarpackie and Lubelskie are defined by the NUTS-3 classification as rural. In the case of Zachodniopomorskie, Warmińsko-Mazurskie and Podlaskie are defined as intermediate and partly rural areas. If we compare the results obtained on the maps contained in Figure 6, with the results obtained on the map representation in Figure 7 there is a perfect coincidence between rural areas (marked with the number 3 and in dark red color) in Figure 7; with the voivodeships with the greatest kilometers distance from the farthest point to access financial services this we clearly observe in Podkarpackie, Lubelskie or Zachodniopomorskie. These voivodeships have areas defined as rural or intermediate for the most part and the kilometers to be covered are above average (20, 17 and 22 km, respectively).
4. Discussion
The financial sector is one of the main vectors in the transition towards full sustainable development. Proof of this can be found in the huge number of initiatives, networks and sectoral organizations that bring together financial institutions from all over the world. These include the United Nations Environment Program Finance Initiative (UNEPFI), the Ecuador Principles and the Principles for Responsible Investment (UNPRI). Since its beginnings, the financial sector has had a special link to the economic development of the different economic sectors [1,2,3,4]. The symbiosis between the financial sector and companies and regions has a direct impact on the SDGs and generates a greater net positive contribution to their fulfillment: around SDGs 2, 6, 8, 11, 12 and 17 [5]. This paper has measured financial inclusion in Poland from a spatial perspective. For this purpose, three methodologies have been applied. First, we have calculated according to the FAS methodology, Bank Offices per 100,000 inhabitants and Bank Offices per 1000 m2 for each voivodeship [45]. The voivodships with a result furthest away from the Polish average (27.79 Bank Offices per 100,000 inhabitants); are Lubuskie (25.73), Małopolskie (24.94), Podkarpackie (24.94), Śląskie (23.47) and Świętokrzyskie (24.24). As can be seen, the southern part of Poland is clearly the worst performer in terms of bank offices per 100,000 inhabitants. Nevertheless, these voivodships have higher figures than many EU countries, especially their neighbors in the Baltic Sea area, such as Lithuania (10.46), Latvia (6.99) or Estonia (7.92). They also have values much higher than those obtained in the Czech Republic (18.3), Romania (22.56) and values very close to those recorded by Slovakia (23.32) or Hungary (23.36). These values are also much higher than those obtained in Ukraine (0.41) or Belarus (0.35). However, when compared with southern European countries, such as Spain (45.53), Portugal (32.84) or Italy (37.63), they are far behind [45]. The voivodships that are furthest away from the Polish average (36.46) in terms of bank offices per 1000 m2 are the voivodships of Ljubljana and Lubelskie voivodeships (Ljubljana voivodeship, 2022); are Lubelskie (25.87), Lubuskie (18.66), Opolskie (30.28), Podkarpackie (29.75), Podlaskie (17.73), Świętokrzyskie (25.70), Warmińsko-Mazurskie (20.35) and Zachodniopomorskie (19.83) voivodships. However, these voivodships have higher values than many EU countries, especially their neighboring countries in the Baltic Sea area, such as Lithuania (3.94), Latvia (1.79) or Estonia (2.02). They also have higher values (except for Podlaskie and Zachodniopomorskie) than the Czech Republic (21.35), higher than Romania (15.98) and very close to those of Slovakia (22.36) or Hungary (21.53), except for Podlaskie and Zachodniopomorskie, which are below. These values are also much higher than those obtained in Ukraine (0.26) or Belarus (0.13). However, when compared with southern European countries, such as Spain (36.94), Portugal (32.13) or Italy (66.29), they are far behind [46].
Secondly, the application of the Access to Cash Index methodology has allowed us to generate a series of maps showing the zones for each voivodeship in white. This means that in that area there is no score available; and therefore, in that area, there is no way to access financial services. The following zones can be highlighted: In Pomorskie Voivodeship, the south-western zone and the central parts of the voivodeship. In the case of Lubuskie, the central area between Zielona Gora and Gorzów Wielkopolskie. A parallel line in the northern part bordering the Wielkopolskie Voivodship. The area south-east and south-west of Zielona Gora, the border area with Germany (Cottbus) in the west and, in the case of Dolnośląskie, three specific areas; firstly, the north-east and south-east of Legnica, secondly, the area east and west of Wroclaw and, thirdly, the entire southern part of the voivodship bordering the Czech Republic. This same methodology allowed [35] to detect the northwest and southwest of the province of Ávila as an area with difficult access to financial services. Additionally, [36] in their study on Castilla y León (Spain), using the same methodology, detected several areas in the provinces of Ávila, Segovia, Soria, Palencia and Zamora where it is difficult to access banking services, especially in rural areas. Other authors who following this same methodology detected areas where it is difficult to access financial services have been [51] applied to the region of Wales, in the United Kingdom, and [50] in the case of the English city of Bristol, at a more local level. In the case of Australia, this method has also been validated and used to detect remote areas where banking services are difficult to access by [53].
Thirdly, the application of the nearest neighbor methodology has allowed us to detect in each voivodeship those points where it is most difficult (measured in km distance to the nearest point) to access banking services. This gives an average across Poland of 15.375 km to reach from the furthest point.
These data show divergences with previous studies conducted in other countries. [47,63] finds in his study that 2.9% of the population of Austria (about 260,000 residents); have to travel more than 5 km to reach the nearest ATM. The municipalities with a high percentage of residents travelling more than 5 km are located in all nine provinces of Austria (except Vienna). If we compare these 5 km to be travelled in Austria with the kilometers to be travelled in the voivodships, all of them are above this distance. In Germany, it is somewhat more difficult to access the cash withdrawal service in rural regions than in cities. According to the Deutsche Bundesbank’s survey on payment behavior in Germany, the nearest cash source is on average 9.3 min away in urban areas (which is 8 km when driving at 50 km/h), and 10.7 min away in rural areas (which is 9.1 km when driving at 50 km/h) [64]. Again, compared to Germany (8 km and 9.1 km, respectively); the kilometers needed to be covered in the voivodeships are above this distance. In France, the majority of the population in these rural agglomerations (96%), do not have ATMs and are between 5 and 15 min away from the nearest ATM (which at a speed of 50 km/h would be between 4.2 and 8.4 km (Banque de France, 2019). Compared to France (4.2 and 8.4 km, respectively); the kilometers needed to travel in the voivodeships to access financial services are above this distance.
The authors of [53], in their study on Australia, show two realities. On the one hand, they estimate that 99% of the population has a cash withdrawal point within 15 km (and a cash deposit point within 17 km); but on the other hand, the remaining 1% (about 250,000 Australians) have to travel more than 15 km to the nearest cash access point. These data, compared to those obtained in our study for Poland, are very similar in terms of distance travelled. Caddy, et al. [54] in their study on Australia indicate that, in June 2020, 95% of the Australian population lived within 4.3 km of a cash withdrawal point and 5.5 km of a cash deposit point. These average distances were little changed compared to 2017, despite the fact that the total number of cash access points in Australia declined significantly during this period. However, some cities have poorer access to cash, with few alternative access points nearby. Compared to Australia (4.3 and 5.5 km, respectively), the kilometers needed to travel in the voivodships to access financial services are above this distance, except in rural areas which have similar data. Jiménez Gonzalo, et al. [65] note for the case of Spain that 249,407 inhabitants (2.7% of the Spanish population) do not have access to a bank branch. These municipalities are generally small and located in unpopulated areas. The regions with the highest number of municipalities without a branch are Castilla y León, Castilla-la Mancha, Catalonia and Aragón. Náñez Alonso, et al. [35] point out that more than 80% of the municipalities in Ávila have difficulties in accessing financial services and also Náñez Alonso, et al. [36] indicate that in the provinces of Ávila, Segovia, Soria, Palencia and Zamora it is difficult to access banking services, especially in rural areas, being necessary to travel between 9 and 16 km to access these services. Compared with these Spanish provinces (between 9 and 16 km), the kilometers needed to travel in the voivodeships to access financial services are close to this distance, except in rural areas, where the figures are somewhat higher. Financial inclusion is a tool that enhances the generation of opportunities and strengthens the capacity to achieve the Sustainable Development Goals (SDGs). Specifically, it contributes to increasing the well-being of people, especially those living in rural areas, through greater access to and use of financial services. The application of this triple methodology and the results obtained have therefore allowed us to verify the degree of compliance with SDG number 8.10, which consists of “strengthening the capacity of national financial institutions to promote and expand access to banking, financial and insurance services for all”. As we have seen, some areas, especially in rural areas of the different voivodeships, present certain problems when it comes to accessing banking services. Therefore, the fulfillment of SDG 8.10 will be more difficult to achieve in these areas. The public authorities must pay attention to this, in order to achieve the commitments acquired with the 2030 agenda, in terms of financial inclusion. One of the limitations that could influence our study is that derived from the data. Since it is not a dynamic evolution, but a situation at a given time that checks its situation, following the data extracted from the Central Bank of Poland.
Some solutions that could be adopted in Poland to reduce these distances could consist of the following. First, the implementation of bank-office buses [65]; which travel around the provinces offering banking services. Secondly, increasing access to cash by adding new cash-back points [39,66,67]. Third, other technology-based solutions can be leveraged; they can in principle help to reverse this situation in rural areas. Many central banks are considering the implementation of a CBDC (Central Bank Digital Currency) [35,66]. It is necessary to consider that, as a result of COVID 19, the ways of payment and use of financial services are changing around the world. Poland is no exception, as the use of mobile banking services has increased, which can generate certain barriers to certain groups, as it points out [67], in addition to the physical ones. However, its feasibility and acceptance should be analyzed first [68,69]. Access to financial services and financial inclusion can help to avoid bankruptcy situations, especially for SMEs in the Polish industrial sector [70], especially if they are located in areas where access to financial services is difficult; this same situation has been described and analyzed for other countries by [71,72]. Business development involves the ability to adapt to changing environmental conditions in order to survive and compete and generally involves a process of formulating, choosing directions and implementing development activities [73], which requires access to adequate financing, both for SMEs and large companies [74].
5. Conclusions
One of the main objectives of international organizations is to promote financial inclusion and for countries to have a financial system that is easily accessible to their citizens. Of course, this is all in line with SDG 8.10, which involves promoting and expanding access to banking and financial services. This objective is especially relevant in rural areas, where access to these services is more complicated, as citizens have to travel several kilometers to access them. In this study, based on Poland, and using data from the Polish Central Bank, we can conclude the following:
- Following the FAS methodology (Bank Offices per 100,00 inhabitants and Bank Offices per 1000 m2 per Voivodeship); the southern part of Poland is clearly the worst performer in terms of Bank Offices per 100,000 inhabitants. Nevertheless, these voivodships show higher figures than many EU countries, especially their neighboring countries in the Baltic Sea area (Lithuania, Latvia or Estonia). They also show much higher values than those obtained in the Czech Republic or Romania. Values very close to those recorded by Slovakia or Hungary and values much higher than those obtained in Ukraine or Belarus. However, they have much lower values compared to most Central European and especially Southern European countries.
- The application of the Access to Cash Index methodology has allowed us to generate a series of maps showing the areas for each voivodeship in white. This means that in that area there is no score available; and therefore, in that area, there is no way to access financial services. This has allowed us to detect some areas per voivodeship where there are difficulties in accessing banking services. The highest scores are concentrated in large Polish cities and the detected areas where access to financial services is not guaranteed are usually rural and sparsely populated areas.
- The application of the nearest neighbor methodology, via Tableau, has allowed us to detect in each voivodship those points where it is most difficult (measured in km distance to the nearest point) to access banking services. The voivodship where the most kilometers have to be travelled to access financial services is in Pomorskie, with 24 km. On the other hand, the voivodeship with the shortest distance (from the furthest point) to access financial services is Warmińsko-Mazurskie, with 9 km.
Some areas, especially in rural areas of the different voivodeships, present certain problems when it comes to accessing banking services. Therefore, the fulfillment of SDG 8.10 will be more difficult to achieve in these areas. The public authorities must pay attention to this, in order to achieve the commitments acquired with the 2030 agenda, in terms of financial inclusion. Some solutions that could be adopted in Poland to reduce these distances could be the implementation of bank-office buses; increasing access to cash by adding new cash-back points or the implementation of a CBDC (Polish digital currency, which could be called ePLN).
Supplementary Materials
The following are available online at: https://cutt.ly/EA4uwUf.
Author Contributions
Conceptualization, S.L.N.A.; Data curation, S.L.N.A., J.J.-V., K.K. and W.S.; Formal analysis, S.L.N.A., J.J.-V. and M.Á.E.F.; Investigation, S.L.N.A. and M.Á.E.F.; Methodology, S.L.N.A. and J.J.-V.; Project administration, K.K. and W.S.; Resources, M.Á.E.F. and W.S.; Software, S.L.N.A.; Supervision, J.J.-V. and W.S.; Validation, J.J.-V. and K.K.; Visualization, M.Á.E.F. and K.K.; Writing—original draft, S.L.N.A., M.Á.E.F. and K.K.; Writing—review and editing, J.J.-V., M.Á.E.F. and W.S. All authors have read and agreed to the published version of the manuscript.
Funding
This research was partially funded by the incentive granted to the authors by the Catholic University of Ávila and this research and publication was co-funded by a subvention granted to the Cracow University of Economics.
Data Availability Statement
The dataset generated for this study is available at: https://cutt.ly/EA4uwUf (accessed on 3 April 2022).
Acknowledgments
The authors, would like to thank Bernard Ziębicki director of the “Katedra Metod Organizacji i Zarządzania” for all his support during their stay at UEK-Cracow. The authors would also like to thank the UCAV for making available the statistical program SPSS; and finally, the company Tableau Inc. for allowing them to use this analysis program free of charge for scientific purposes.
Conflicts of Interest
The authors declare no conflict of interest.
Appendix A
Table A1.
Total bank branches, bank branches per 100,000 inhabitants and bank branches per 1000 m2 for each voivodeship, population, surface and density.
Table A1.
Total bank branches, bank branches per 100,000 inhabitants and bank branches per 1000 m2 for each voivodeship, population, surface and density.
| Voivodeship | Total Bank Branches | Bank Branches per 100,000 Inhabitants | Bank Offices per 1000 m2 | Population | Surface (km2) | Population Density (inhab/km2) |
|---|---|---|---|---|---|---|
| Dolnośląskie | 803 | 27.68 | 40.26 | 2,901,225 | 19,946.70 | 145.0 |
| Kujawsko-Pomorskie | 570 | 27.43 | 31.72 | 2,077,775 | 17,971.34 | 114.7 |
| Łódzkie | 725 | 29.40 | 39.79 | 2,466,322 | 18,218.95 | 133.8 |
| Lubelskie | 650 | 30.69 | 25.87 | 2,117,629 | 25,122.46 | 83.4 |
| Lubuskie | 261 | 25.73 | 18.66 | 1,014,548 | 13,987.93 | 72.0 |
| Małopolskie | 848 | 24.94 | 55.85 | 3,400,577 | 15,182.79 | 224.6 |
| Mazowieckie | 1730 | 32.02 | 48.65 | 5,403,412 | 35,558.47 | 152.6 |
| Opolskie | 285 | 28.89 | 30.28 | 986,506 | 9411.87 | 103.8 |
| Podkarpackie | 531 | 24.94 | 29.75 | 2,129,015 | 17,845.76 | 118.9 |
| Podlaskie | 358 | 30.30 | 17.73 | 1,181,533 | 20,187.02 | 58.1 |
| Pomorskie | 619 | 26.53 | 33.81 | 2,333,523 | 18,310.34 | 128.2 |
| Śląskie | 1064 | 23.47 | 86.27 | 4,533,565 | 12,333.09 | 364.3 |
| Świętokrzyskie | 301 | 24.24 | 25.70 | 1,241,546 | 11,710.5 | 103.8 |
| Warmińsko-Mazurskie | 492 | 34.43 | 20.35 | 1,428,983 | 24,173.47 | 58.6 |
| Wielkopolskie | 982 | 28.11 | 32.92 | 3,493,969 | 29,826.5 | 117.1 |
| Zachodniopomorskie | 454 | 26.69 | 19.83 | 1,701,030 | 22,892.48 | 73.7 |
| Poland | 10,673 | 27.79 | 36.46 | 38,411,158 | 292,732.97 | 122.4 |
Source: Own elaboration based on data from (Narodowy Bank Polski-Central Bank of Poland, 2022) and [75].
Appendix B

Figure A1.
Voivodeships with the fewest bank branches per 100,000 inhabitants. Source: Own elaboration based on data from Table A1 and Tableau Desktop Professional Edition.

Figure A2.
Voivodeships with the fewest bank offices per 1000 m2. Source: Own elaboration based on data from Table A1 and Tableau Desktop Professional Edition.

Figure A3.
Map with ACI results for the whole of Poland. Source: Prepared by the authors using Tableau Desktop Professional Edition.

Figure A4.
Map with access to banking services points for the whole of Poland Source: Prepared by the authors using Tableau Desktop Professional Edition.
Table A2.
Higher scores (per city) derived from applying the ACI.
Table A2.
Higher scores (per city) derived from applying the ACI.
| City | Score |
|---|---|
| Warszawa | 770 |
| Szczecin | 648 |
| Poznań | 538 |
| Kraków | 433 |
| Łódź | 356 |
| Rzeszów | 320 |
| Lublin | 262 |
| Katowice | 241 |
| Wrocław | 220 |
| Gdańsk | 212 |
| Bydgoszcz | 206 |
| Olsztyn | 198 |
| Białystok | 176 |
| Gdynia | 137 |
| Kielce | 125 |
Source: Own elaboration based on data from (Narodowy Bank Polski-Central Bank of Poland, 2022) and the application of the ACI.
References
- Chibba, M. Financial Inclusion, Poverty Reduction and the Millennium Development Goals. Eur. J. Dev. Res. 2009, 21, 213–230. [Google Scholar] [CrossRef]
- Prasad, E. Financial Sector Regulation and Reforms in Emerging Markets: An Overview; Institute for the Study of Labor (IZA): Bonn, Germany, 2010. [Google Scholar]
- Sachs, J.D.; Schmidt-Traub, G.; Mazzucato, M.; Messner, D.; Nakicenovic, N.; Rockström, J. Six Transformations to achieve the Sustainable Development Goals. Nat. Sustain. 2019, 2, 805–814. [Google Scholar] [CrossRef]
- Parkhouse, A. Agenda 2030 and the EU on migration and integration. In Implementing Sustainable Development Goals in Europe; Edward Elgar Publishing: Cheltenham, UK, 2020; pp. 79–98. [Google Scholar]
- Klapper, L.; El-Zoghbi, M.; Hess, J. Achieving the sustainable development goals: The role of financial inclusion. In UN Secretary General’s Special Advocate for Inclusive Finance for Development; CGAP (Consultative Group to Assist the Poor): Washington, DC, USA, 2017; pp. 1–20. [Google Scholar]
- Demirguc-Kunt, A.; Klapper, L.; Singer, D. Financial Inclusion and Inclusive Growth: A Review of Recent Empirical Evidence; The World Bank. 2017. Available online: https://openknowledge.worldbank.org/handle/10986/26479 (accessed on 10 January 2022).
- Sethi, D.; Acharya, D. Financial inclusion and economic growth linkage: Some cross country evidence. J. Financ. Econ. Policy 2018, 10, 369–385. [Google Scholar] [CrossRef]
- Kim, D.-W.; Yu, J.-S.; Hassan, M.K. Financial inclusion and economic growth in OIC countries. Res. Int. Bus. Financ. 2018, 43, 1–14. [Google Scholar] [CrossRef]
- Obayori, J.B.; Chioma Chidinma, G.-A.B. Financial Inclusion and Economic Growth in Nigeria. Bus. Perspect. Rev. 2020, 2, 46–56. [Google Scholar] [CrossRef]
- Van, L.T.-H.; Vo, A.T.; Nguyen, N.T.; Vo, D.H. Financial Inclusion and Economic GROWTH: An International Evidence. Emerg. Mark. Finance Trade 2021, 57, 239–263. [Google Scholar] [CrossRef]
- Miklaszewska, E. Economic Growth and the Financial Inclusion: The Case of Poland. In New Frontiers in Banking Services; Springer Science and Business Media LLC.: Berlin/Heidelberg, Germany, 2007; pp. 271–298. [Google Scholar]
- Buszko, M.; Krupa, D.; Chojnacka, M. Young people and banking products and services in Poland: The results of empirical studies. EÈkon. Prawo 2019, 18, 147–164. [Google Scholar] [CrossRef]
- Gatnar, E. Financial Inclusion Indicators in Poland. Acta Univ. Lodz. Folia Oecon. 2013, 286, 225–233. [Google Scholar]
- Świecka, B.; Terefenko, P.; Wiśniewski, T.; Xiao, J. Consumer Financial Knowledge and Cashless Payment Behavior for Sustainable Development in Poland. Sustainability 2021, 13, 6401. [Google Scholar] [CrossRef]
- Idzik, M. Financial inclusion in Poland in the segment of young consumers (Inkluzja finansowa w Polsce w segmencie młodych konsumentów). Prace Naukowe Uniwersytetu Ekonomicznego we Wrocławiu 2016, 439, 115–125. [Google Scholar] [CrossRef][Green Version]
- Szopinski, T. Who is Unbanked? Evidence from Poland. Contemp. Econ. 2019, 13, 415–424. [Google Scholar]
- Potocki, T.; Cierpiał-Wolan, M. Factors shaping the financial capability of low-income consumers from rural regions of Poland. Int. J. Consum. Stud. 2018, 43, 187–198. [Google Scholar] [CrossRef]
- Potocki, T. Financial capability among low-income households in rural parts of Poland. Argum. Oeconomic 2019, 2, 85–114. [Google Scholar] [CrossRef]
- Kata, R.; Walenia, A.; Pyrkos, D.S.; University of Rzeszow. Financial exclusion of the rural population in Poland. J. Agribus. Rural Dev. 2015, 4, 705–715. [Google Scholar] [CrossRef]
- Yue, X.-G.; Cao, Y.; Duarte, N.; Shao, X.-F.; Manta, O. Social and Financial Inclusion through Nonbanking Institutions: A Model for Rural Romania. J. Risk Financ. Manag. 2019, 12, 166. [Google Scholar] [CrossRef]
- Horská, E.; Szafranska, M.; Matysik-Pejas, R. Knowledge and financial skills as the factors determining the financial exclusion process of rural dwellers in Poland. Agric. Econ. Zemědělská Ekonomika 2013, 59, 29–37. [Google Scholar] [CrossRef]
- BUSZKO, M.; KRUPA, D.; CHOJNACKA, M. Why young people do not use bank products—The case of Poland. Sci. Pap. Sil. Univ. Technol. Organ. Manag. Ser. 2019, 2019, 23–34. [Google Scholar] [CrossRef]
- Jastrzębska, M.E. State action aimed at limiting financial exclusion in Poland in terms of sustainable and inclusive development. Optimum. Econ. Stud. 2019, 28–43. [Google Scholar] [CrossRef]
- Náñez Alonso, S.L.; Jorge-Vazquez, J.; Reier Forradellas, R.F. Detection of Financial Inclusion Vulnerable Rural Areas through an Access to Cash Index: Solutions Based on the Pharmacy Network and a CBDC. Evidence Based on Ávila (Spain). Sustainability 2020, 12, 7480. [Google Scholar] [CrossRef]
- Koku, P.S. Financial exclusion of the poor: A literature review. Int. J. Bank Mark. 2015, 33, 654–668. [Google Scholar] [CrossRef]
- Rajeev, M.; Vani, B.P. Financial Exclusion of the Poor: Global Experiences. In Financial Access of the Urban Poor in India: A Story of Exclusion; SpringerBriefs in Economics; Springer: Berlin/Heidelberg, Germany, 2017; pp. 15–37. [Google Scholar]
- Martin-Oliver, A. Financial exclusion and branch closures in Spain after the Great Recession. Reg. Stud. 2018, 53, 562–573. [Google Scholar] [CrossRef]
- Wang, X.; He, G. Digital Financial Inclusion and Farmers’ Vulnerability to Poverty: Evidence from Rural China. Sustainability 2020, 12, 1668. [Google Scholar] [CrossRef]
- Bonfim, D.; Nogueira, G.; Ongena, S. “Sorry, We’re Closed” Bank Branch Closures, Loan Pricing, and Information Asymmetries. Rev. Financ. 2020, 25, 1211–1259. [Google Scholar] [CrossRef]
- Srouji, J. Digital Payments, the Cashless Economy, and Financial Inclusion in the United Arab Emirates: Why Is Everyone Still Transacting in Cash? J. Risk Financ. Manag. 2020, 13, 260. [Google Scholar] [CrossRef]
- Argent, N.; Rolley, F. Financial Exclusion in Rural and Remote New South Wales, Australia: A Geography of Bank Branch Rationalisation, 1981–1998. Aust. Geogr. Stud. 2000, 38, 182–203. [Google Scholar] [CrossRef]
- Camacho, J.A.; Molina, J.; Rodríguez, M. Financial accessibility in branchless municipalities: An analysis for Andalusia. Eur. Plan. Stud. 2021, 29, 883–898. [Google Scholar] [CrossRef]
- Sin Tian Ho, C.; Berggren, B. The effect of bank branch closures on new firm formation: The Swedish case. Ann. Reg. Sci. 2020, 65, 319–350. [Google Scholar]
- Alessandrini, P.; Presbitero, A.; Zazzaro, A. Banks, Distances and Firms’ Financing Constraints. Rev. Finance 2008, 13, 261–307. [Google Scholar] [CrossRef]
- Devlin, J.F. A Detailed Study of Financial Exclusion in the UK. J. Consum. Policy 2005, 28, 75–108. [Google Scholar] [CrossRef]
- Coppock, S. The everyday geographies of financialisation: Impacts, subjects and alternatives. Camb. J. Reg. Econ. Soc. 2013, 6, 479–500. [Google Scholar] [CrossRef]
- Ozili, P.K. Financial inclusion research around the world: A review. Forum Soc. Econ. 2020, 50, 457–479. [Google Scholar] [CrossRef]
- Panigyrakis, G.G.; Theodoridis, P.K.; Veloutsou, C.A. All customers are not treated equally: Financial exclusion in isolated Greek islands. J. Financ. Serv. Mark. 2002, 7, 54–66. [Google Scholar] [CrossRef]
- Alonso, S.L.N.; Jorge-Vazquez, J.; Forradellas, R.F.R.; Dochado, E.A. Solutions to Financial Exclusion in Rural and Depopulated Areas: Evidence Based in Castilla y León (Spain). Land 2022, 11, 74. [Google Scholar] [CrossRef]
- Jorge-Vázquez, J.; Chivite-Cebolla, M.; Salinas-Ramos, F. The Digitalization of the European Agri-Food Cooperative Sector. Determining Factors to Embrace Information and Communication Technologies. Agriculture 2021, 11, 514. [Google Scholar] [CrossRef]
- Jorge-Vázquez, J.; Reier-Forradellas, R.; Náñez-Alonso, S.L.; Sáez-Herráez, I. La digitalización de los servicios bancarios y su incidencia en el medio rural. In Avances en Educación, TIC e Innovación: Aportaciones para la Mejora Empresarial y Social (Advances in Education, ICT and Innovation: Issues for Business and Social Enhancing); University Press of Florida: Gainesville, FL, USA, 2021; pp. 11–16. [Google Scholar]
- Náñez Alonso, S.L.; Jorge-Vázquez, J.; Reier-Forradellas, R.F. Adopción de una moneda digital (CBDC) para prevenir la exclusión financiera en el medio rural. In Advances in Education, ICT and Innovation: Issues for Business and Social Enhancing; Dykinson: Madrid, Spain, 2021; pp. 17–21. [Google Scholar]
- Stanny, M.; Komorowski, Ł.; Rosner, A. The Socio-Economic Heterogeneity of Rural Areas: Towards a Rural Typology of Poland. Energies 2021, 14, 5030. [Google Scholar] [CrossRef]
- Dudzińska, M.; Bacior, S.; Prus, B. Considering the level of socio-economic development of rural areas in the context of infrastructural and traditional consolidations in Poland. Land Use Policy 2018, 79, 759–773. [Google Scholar] [CrossRef]
- Adamowicz, M.; Zwolińska-Ligaj, M. The “Smart Village” as a Way to Achieve Sustainable Development in Rural Areas of Poland. Sustainability 2020, 12, 6503. [Google Scholar] [CrossRef]
- Adamowicz, M. The Potential for Innovative and Smart Rural Development in the Peripheral Regions of Eastern Poland. Agriculture 2021, 11, 188. [Google Scholar] [CrossRef]
- Narodowy Bank Polski—Central Bank of Poland. The list of numbers and identifiers financial institutions assigned by Narodowy Bank Polski. 2022. Available online: https://www.nbp.pl/homen.aspx?f=/srodeken.htm (accessed on 20 January 2022).
- International Monetary Fund (IMF). Financial Access Survey (FAS). 2022. Available online: https://data.imf.org/?sk=E5DCAB7E-A5CA-4892-A6EA-598B5463A34C (accessed on 20 January 2022).
- International Monetary Fund (IMF). Number of commercial bank branches per 100,000 adults. 2021. Available online: https://www.imf.org/en/Home (accessed on 10 January 2022).
- Tischer, D.; Evans, J.; Davies, S. Mapping the Availability of Cash—A Case Study of Bristol’s Financial Infrastructure; Bristol Poverty Institute, Personal Finance Research Centre (PFRC), University of Bristol: Bristol, UK, 2019. [Google Scholar]
- Khan, M.; Ding, Q.; Perrizo, W. K-Nearest Neighbor Classification on Spatial Data Streams Using P-trees. In Advances in Knowledge Discovery and Data Mining; Springer: Berlin/Heidelberg, Germany, 2002; pp. 517–528. [Google Scholar]
- Kolahdouzan, M.R.; Shahabi, C. Alternative Solutions for Continuous K Nearest Neighbor Queries in Spatial Network Databases. GeoInformatica 2005, 9, 321–341. [Google Scholar] [CrossRef]
- Lu, J.; Lu, Y.; Cong, G. Reverse spatial and textual k nearest neighbor search. In Proceedings of the 2011 International Conference on Management of Data—SIGMOD ’11, online. 12 June 2011; ACM Press: New York, NY, USA, 2011; p. 349. [Google Scholar]
- Chomboon, K.; Chujai, P.; Teerarassamee, P.; Kerdprasop, K.; Kerdprasop, N. An empirical study of distance metrics for k-nearest neighbor algorithm. In Proceedings of the 3rd International Conference on Industrial Application Engineering, Kitakyushu, Japan, 28–31 March 2015; pp. 280–285. [Google Scholar]
- Gou, J.; Ma, H.; Ou, W.; Zeng, S.; Rao, Y.; Yang, H. A generalized mean distance-based k-nearest neighbor classifier. Expert Syst. Appl. 2019, 115, 356–372. [Google Scholar] [CrossRef]
- Abu Alfeilat, H.A.; Hassanat, A.; Lasassmeh, O.; Altarawneh, A.S.A.; Alhasanat, M.B.; Salman, H.S.E.; Prasath, S. Effects of Distance Measure Choice on K-Nearest Neighbor Classifier Performance: A Review. Big Data 2019, 7, 221–248. [Google Scholar] [CrossRef]
- Eurostat Rural Development: Methodology. Available online: https://ec.europa.eu/eurostat/web/rural-development/methodology (accessed on 28 March 2022).
- Evans, J.C.N.; Tischer, D.; Davies, S.V. Geographies of Access to Cash—Identifying Vulnerable Communities in a Case Study of South Wales. 2020. Available online: https://www.researchgate.net/publication/338717001_Geographies_of_Access_to_Cash_Identifying_Vulnerable_Communities_in_a_Case_Study_Of_South_Wales (accessed on 10 January 2022).
- Delaney, L.; O’Hara, A.; Finlay, R. Cash Withdrawal Symptoms. 2019. Available online: https://www.nintione.com.au/resources/rao/cash-withdrawal-symptoms/ (accessed on 10 January 2022).
- Stix, H. A spatial analysis of access to ATMs in Austria. Monet. Policy Econ. 2020, 39–59. [Google Scholar]
- Stix, H. The Austrian Bank Branch Network from 2000 to 2019 from a Spatial Perspective; Oesterreichische Nationalbank: Vienna, Austria, 2020. [Google Scholar]
- Deutsche Bundesbank. Cash Withdrawals and Payments in Urban and Rural Areas. 2020. Available online: https://www.bundesbank.de/resource/blob/835308/883b0d7e02a4d9edbebb4069038fbebf/mL/2020-06-stadt-land-vergleich-data.pdf (accessed on 10 January 2022).
- Caddy, J.; Zhang, Z. How Far Do Australians Need to Travel to Access Cash? Reserv. Bank Aust. 2021, 10–17. [Google Scholar]
- Jiménez Gonzalo, C.; Tejero Sala, H. Bank Branch Closure and Cash access in Spain. Financ. Stab. Rev. 2018, 34. [Google Scholar]
- Beckmann, E.; Reiter, S.; Stix, H. A geographic perspective on banking in Central, Eastern and Southeastern Europe. Oesterreichische Natl. 2018, 1–22. [Google Scholar]
- Náñez Alonso, S.L.; Echarte Fernández, M.Á.; Sanz Bas, D.; Kaczmarek, J. Reasons Fostering or Discouraging the Implementation of Central Bank-Backed Digital Currency: A Review. Economies 2020, 8, 41. [Google Scholar] [CrossRef]
- Solarz, M.; Adamek, J. Determinants of digital financial exclusion as a barrier to the adoption of mobile banking services in Poland. Ekon. I Prawo 2022, 21. [Google Scholar]
- Kim, G. Why is China going to issue CBDC (Central Bank Digital Currency)? J. Internet Electron. Commer. Res. 2020, 20, 161–177. [Google Scholar] [CrossRef]
- Söilen, K.S.; Benhayoun, L. Household acceptance of central bank digital currency: The role of institutional trust. Int. J. Bank Mark. 2021, 40, 172–196. [Google Scholar] [CrossRef]
- Kaczmarek, J.; Alonso, S.L.N.; Sokołowski, A.; Fijorek, K.; Denkowska, S. Financial threat profiles of industrial enterprises in Poland. Oecon. Copernic. 2021, 12, 463–498. [Google Scholar] [CrossRef]
- Locurcio, M.; Tajani, F.; Morano, P.; Anelli, D.; Manganelli, B. Credit Risk Management of Property Investments through Multi-Criteria Indicators. Risks 2021, 9, 106. [Google Scholar] [CrossRef]
- Eletter, S.F.; Yaseen, S.G. Loan decision models for the Jordanian commercial banks. Glob. Bus. Econ. Rev. 2017, 19, 323. [Google Scholar] [CrossRef]
- Kolegowicz, K.; Krzemiński, P. The influence of financial condition on investment decisions in enterprises in Poland. Sci. Pap. Sil. Univ. Technol. Organ. Manag. Ser. 2019, 2019, 243–255. [Google Scholar] [CrossRef]
- Kolegowicz, K.; Sierpińska, M. Cash management in energy companies. J. Polish Miner. Eng. Soc. 2020, 2, 95–100. [Google Scholar] [CrossRef]
- GUS Główny Urząd Statystyczny. Statistics Poland. 2022. Available online: https://stat.gov.pl/ (accessed on 20 January 2022).
Publisher’s Note: MDPI stays neutral with regard to jurisdictional claims in published maps and institutional affiliations. |
© 2022 by the authors. Licensee MDPI, Basel, Switzerland. This article is an open access article distributed under the terms and conditions of the Creative Commons Attribution (CC BY) license (https://creativecommons.org/licenses/by/4.0/).