Article

Spatial and Temporal Changes of Landscape Patterns and Their Effects on Ecosystem Services in the Huaihe River Basin, China

1
College of Geography and Environmental Science, Henan University, Kaifeng 475004, China
2
Key Laboratory of Geospatial Technology for the Middle and Lower Yellow River Regions, Ministry of Education, Henan University, Kaifeng 475004, China
3
Zhejiang Development & Planning Institute, Hangzhou 310030, China
4
Henan Key Laboratory of Earth System Observation and Modeling, Henan University, Kaifeng 475004, China
*
Author to whom correspondence should be addressed.
Land 2022, 11(4), 513; https://doi.org/10.3390/land11040513
Submission received: 2 March 2022 / Revised: 26 March 2022 / Accepted: 31 March 2022 / Published: 1 April 2022
(This article belongs to the Special Issue Regional Sustainable Development of Yangtze River Delta, China)

Abstract

:
Landscape pattern changes caused by human activities are among the most important driving factors affecting ecosystem spatial structure and components, and significantly impact ecosystem services. Understanding the relationship between landscape patterns and ecosystem services is important for improving regional conservation and establishing ecosystem management strategies. Taking the Huaihe River Basin as an example, this study used land-use data, meteorological data, and topographic data to analyze the spatial and temporal changes in landscape patterns via landscape transfer matrix and landscape indices, and measured four ecosystem services (water retention, soil retention, carbon storage, and biodiversity conservation) with the InVEST models. Furthermore, correlation analysis and global spatial autocorrelation coefficient were used to analyze the impact of landscape pattern changes on ecosystem services. The results showed grassland and farmland areas had continuously decreased, while built-up land and affected water had significantly increased. Landscape fragmentation was reduced, the connectivity between patches was weakened, landscape heterogeneity, evenness, and patch irregularity were increased. Changes in landscape composition and configuration have affected the ecosystem services of the Huaihe River Basin. The reduction in grassland areas and the increase in built-up land areas have significantly reduced the capacity for soil retention, carbon storage, and biodiversity conservation. Spatially, regions with low landscape fragmentation and high patch connectivity had a higher water retention capacity and biodiversity conservation, while soil retention and carbon storage were opposite. Temporally, reduction of landscape fragmentation and increase of patch shape irregularity had a negative effect on water retention, carbon storage, and biodiversity conservation, while soil retention was not sensitive to these changes. The findings in this paper promote an understanding of the relationship between landscape patterns and ecosystem services on a large scale and provide theoretical guidance for ecosystem management and protection planning in the Huaihe River Basin, China.

1. Introduction

Landscape pattern refers to the landscape’s structural composition (type and proportion) and spatial configuration (patch size and spatial distribution), which can be greatly influenced by human activities and climatic factors [1,2,3]. At a regional scale, landscape pattern changes have led to a series of ecological problems and directly affected energy flow, hydrological cycles, primary productivity, species diversity, and so on [4,5,6,7]. They have been widely recognized as one of the most important driving forces of ecosystem service processes [8,9,10]. Previous studies have shown that landscape structural composition changes directly impact ecosystem services [11,12]. The increasing scale of conversion from natural and semi-natural landscape to built-up land and farmland results in a considerable decline in ecosystem services [13,14]. Moreover, landscape spatial configuration changes affect ecosystem services processes and the trade-offs between services [15,16,17].
Ecosystem services provide life-supporting goods and services, are directly or indirectly obtained from the process and function of natural ecosystems that are vital to human survival and development [18,19,20], and are a bridge between natural ecosystems and human well-being [2,8]. They can be categorized into four types: provisioning, regulating, cultural, and supporting services [21]. However, rapid urbanization and population growth have caused subsequent increases in human interference, which have profoundly altered landscape patterns [22,23,24], and these problems have greatly damaged the service functions of ecosystems [25,26,27,28]. The Millennium Ecosystem Assessment reported that global ecosystem services are declining at an unprecedented rate [21]. In this context, understanding the driving mechanism of ecosystem services is urgently needed to maintain their sustainable development [2,29,30].
Numerous studies have quantified the impacts of landscape pattern changes on ecosystem services to understand the interactions between landscapes and ecosystem services [31,32,33,34]. However, few studies have explored this phenomenon over long periods and in large geographic areas. The relationship between landscape patterns and ecosystem services depends on the spatial variability of drivers and stressors [5], and focusing on local or small catchment scales may ignore the impacts of broadscale drivers [35]. Therefore, exploring the relationship between landscape patterns and ecosystem services over larger geographic areas has important practical significance and can also provide theoretical guidance for landscape planning and ecologically sustainable development.
Rapid economic development and urbanization have led to changes in the environment [16,22,36], which has led to the reduction of the capability of ecosystem services [2,20]. The Huaihe River Basin has become an important agricultural and industrial base in China due to its suitable environment and rich natural resources [37,38,39]. Although huge investment has been made to improve the environment of the Huaihe River Basin, it is difficult to achieve great improvement in the short term [40,41,42,43]. In October 2018, the Chinese government released the “Huaihe River Economic Belt Development Plan” that emphasized the excellent location and important status of the Huaihe River Basin and considered accelerating the development of the Huaihe Ecological and Economic Belt which is of great significance in advancing ecological protection [44]. Therefore, the Huaihe River Basin was selected as a case study to explore the way changes in landscape patterns affect ecosystem services to meet governmental needs for scientific information and references to formulate policies that promote ecologically sustainable development and protection.
In this paper, we seek to explore the relationship between landscape patterns and ecosystem services through a case study of the Huaihe River Basin from 1990 to 2018. The objectives of this study are as follows: (1) to quantify the spatial and temporal changes of landscape patterns using a landscape transfer matrix and landscape indices, (2) to estimate the evolution of ecosystem services using InVEST models, and (3) to analyze the spatiotemporal relationship between the landscape and ecosystem services. The results will improve our understanding of the relationships between landscape patterns and ecosystem services on a broad scale, and provide theoretical guidance for ecosystem management and protection planning in the Huaihe River Basin, China.

2. Materials and Methods

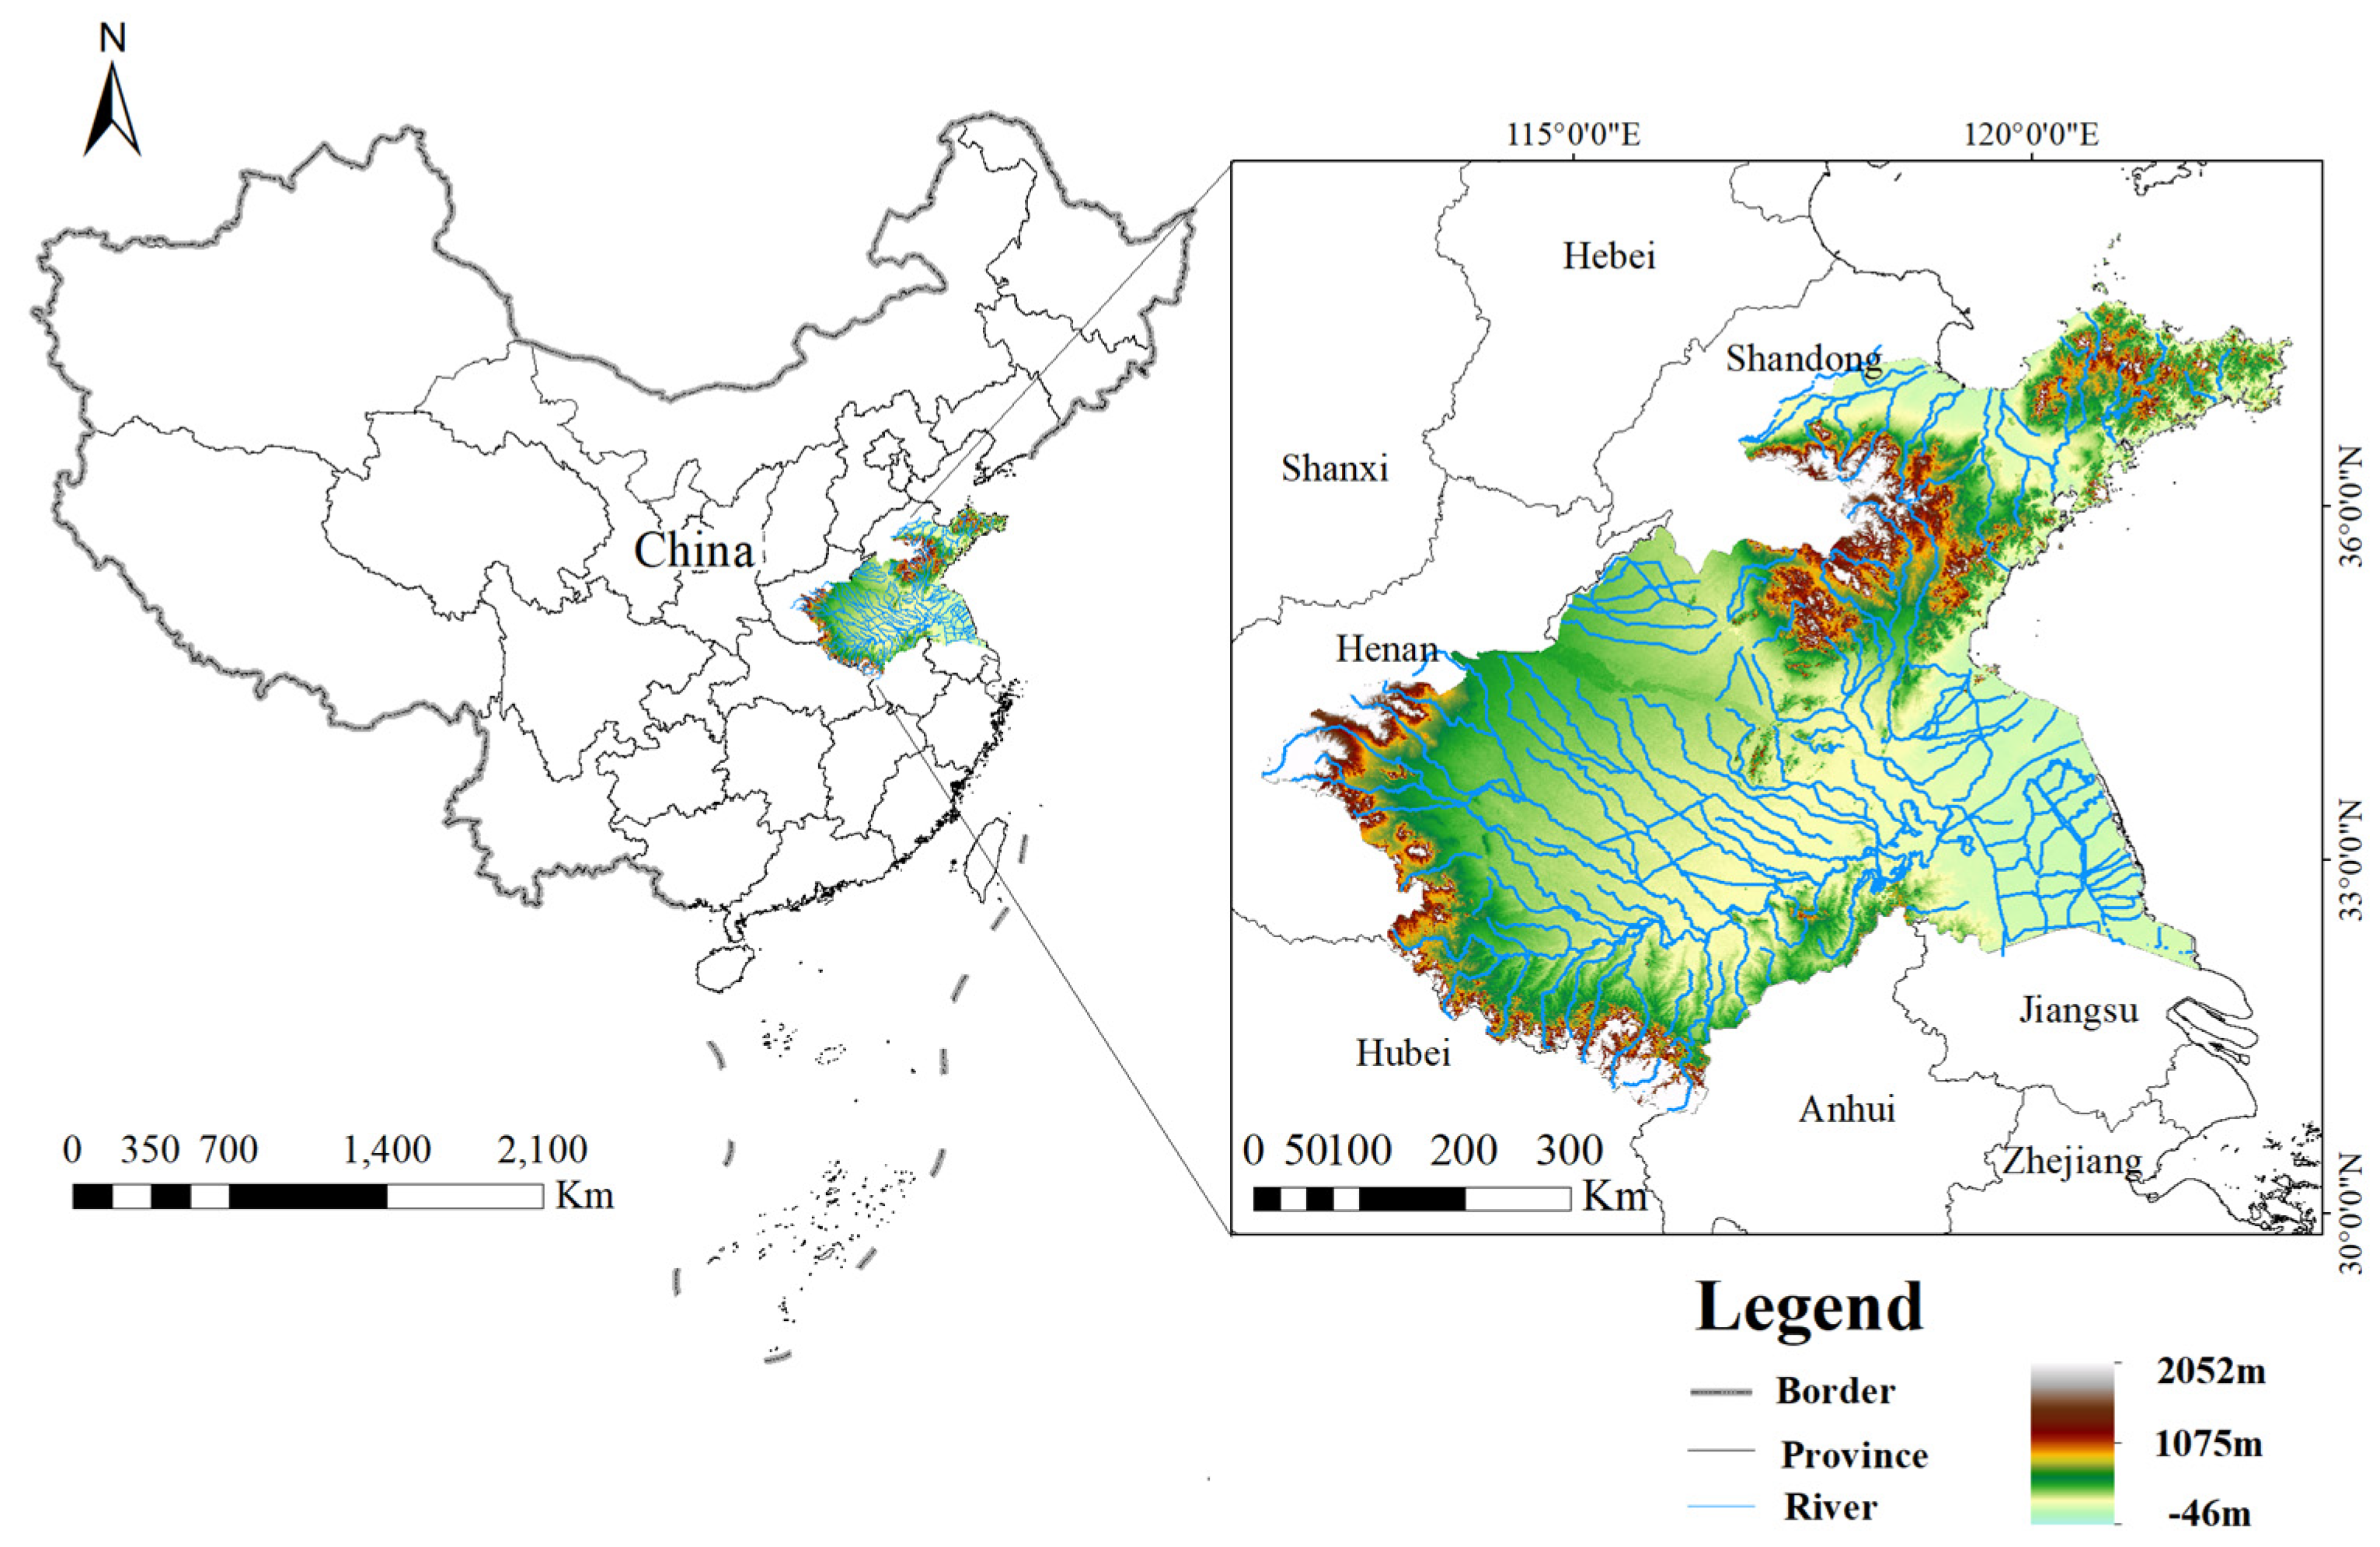
2.1. Description of the Huaihe River Basin

The Huaihe River Basin is located in eastern China, between 30°55′−37°50′ N and 111°55′−122°42′ E (Figure 1). It covers an area of approximately 3.3 × 10⁵ km2 crossing Henan, Hubei, Anhui, Jiangsu, and Shandong Provinces [45]. With a dense population of 600 person/km2, which is far higher than the national population density of 148 person/km2 [37,39]. The main stream of the Huaihe River originates from Tongbaishan Mountain in Henan Province, China, and flows eastward into the Yellow Sea [46]. The topography is dominated by low hills in the western and north-eastern parts of the basin, which cover 1/3 of the total area, and by extensive plains in the remaining 2/3 [47]. The basin is located in the South-North transition zone of China, where the mean annual precipitation and temperature are 883 mm and 11−16 °C [48], which provide a suitable living environment for organisms. With the high-intensity exploitation of resources, ecological systems have been under great pressure, and ecological and environmental problems such as subsidence and degradation of arable land quality are becoming more serious [47].

2.2. Data Sources and Preprocessing

Land use data (spatial resolution of 1 km) for 1990, 1995, 2000, 2005, 2010, 2015, and 2018 were sourced from the Resource and Environmental Science Data Center of the Chinese Academy of Sciences (http://www.resdc.cn, accessed on 11 December 2021). These Landsat remote sensing images generated a long time series land-use dataset using human visual interpretation, and the overall accuracy was greater than 90% [49]. Based on previous studies [2], we used ArcGIS software to further integrate the land use data into six landscape types: farmland, forest, grassland, water, built-up land, and unused land (Figure 2). Digital elevation model (DEM) data (spatial resolution of 1 km) was downloaded from the geospatial data cloud platform (http://www.gscloud.cn, accessed on 11 December 2021) and used to divide the watershed. Meteorological data such as temperature and precipitation, effective soil moisture, soil texture, etc., came from the National Earth System Science Data Center, National Science & Technology Infrastructure of China (http://www.geodata.cn, accessed on 13 December 2021). The rainfall erosivity factor (R factor) with a spatial resolution of 1 km came from the Climate Change Impact Assessment (CLICIA) Group at the Beijing Normal University (https://dx.doi.org/10.12275/bnu.clicia.rainfallerosivity.CN.001, accessed on 13 December 2021).

2.3. Landscape Transfer Matrix

The landscape transfer matrix has often been used to describe the mutual transfer of landscape types [32,50] and reveal the structural characteristics of landscape patterns [51]. This study calculated the mutual transfer of landscape types in the initial and final stages to reflect the temporal changes of landscape types in the Huaihe River Basin. The formula is written as:
S ij = S 11   S 12 S 1 n S n 1   S n 2 S nn
where S ij is the change in area from i to j ; n is the number of landscape types; and i and j are the landscape types at the beginning and end of the study period, respectively.

2.4. Calculation of Landscape Indices

Landscape indices are widely used to reflect landscape spatial configurations [3,4] and study landscape pattern changes [52]. Based on previous studies and the landscape structural characteristics in the Huaihe River Basin, and to avoid redundancy between landscape indices, conducted a multicollinearity test using SPSS 22 software [16], five landscape indices were chosen to quantify landscape pattern characteristics at the landscape level, including Mean Patch Area (AREA_MN), Mean Fractal Dimension Index (FRAC_MN), Shannon’s Diversity Index (SHDI), Aggregation Index (AI) and Contagion Index (CONTAG). Overall landscape indices and those in every sampling grid using a moving window were calculated using Fragstats 4.2 software. The ecological implications and mathematical expressions for each landscape index are as follows:
(1)
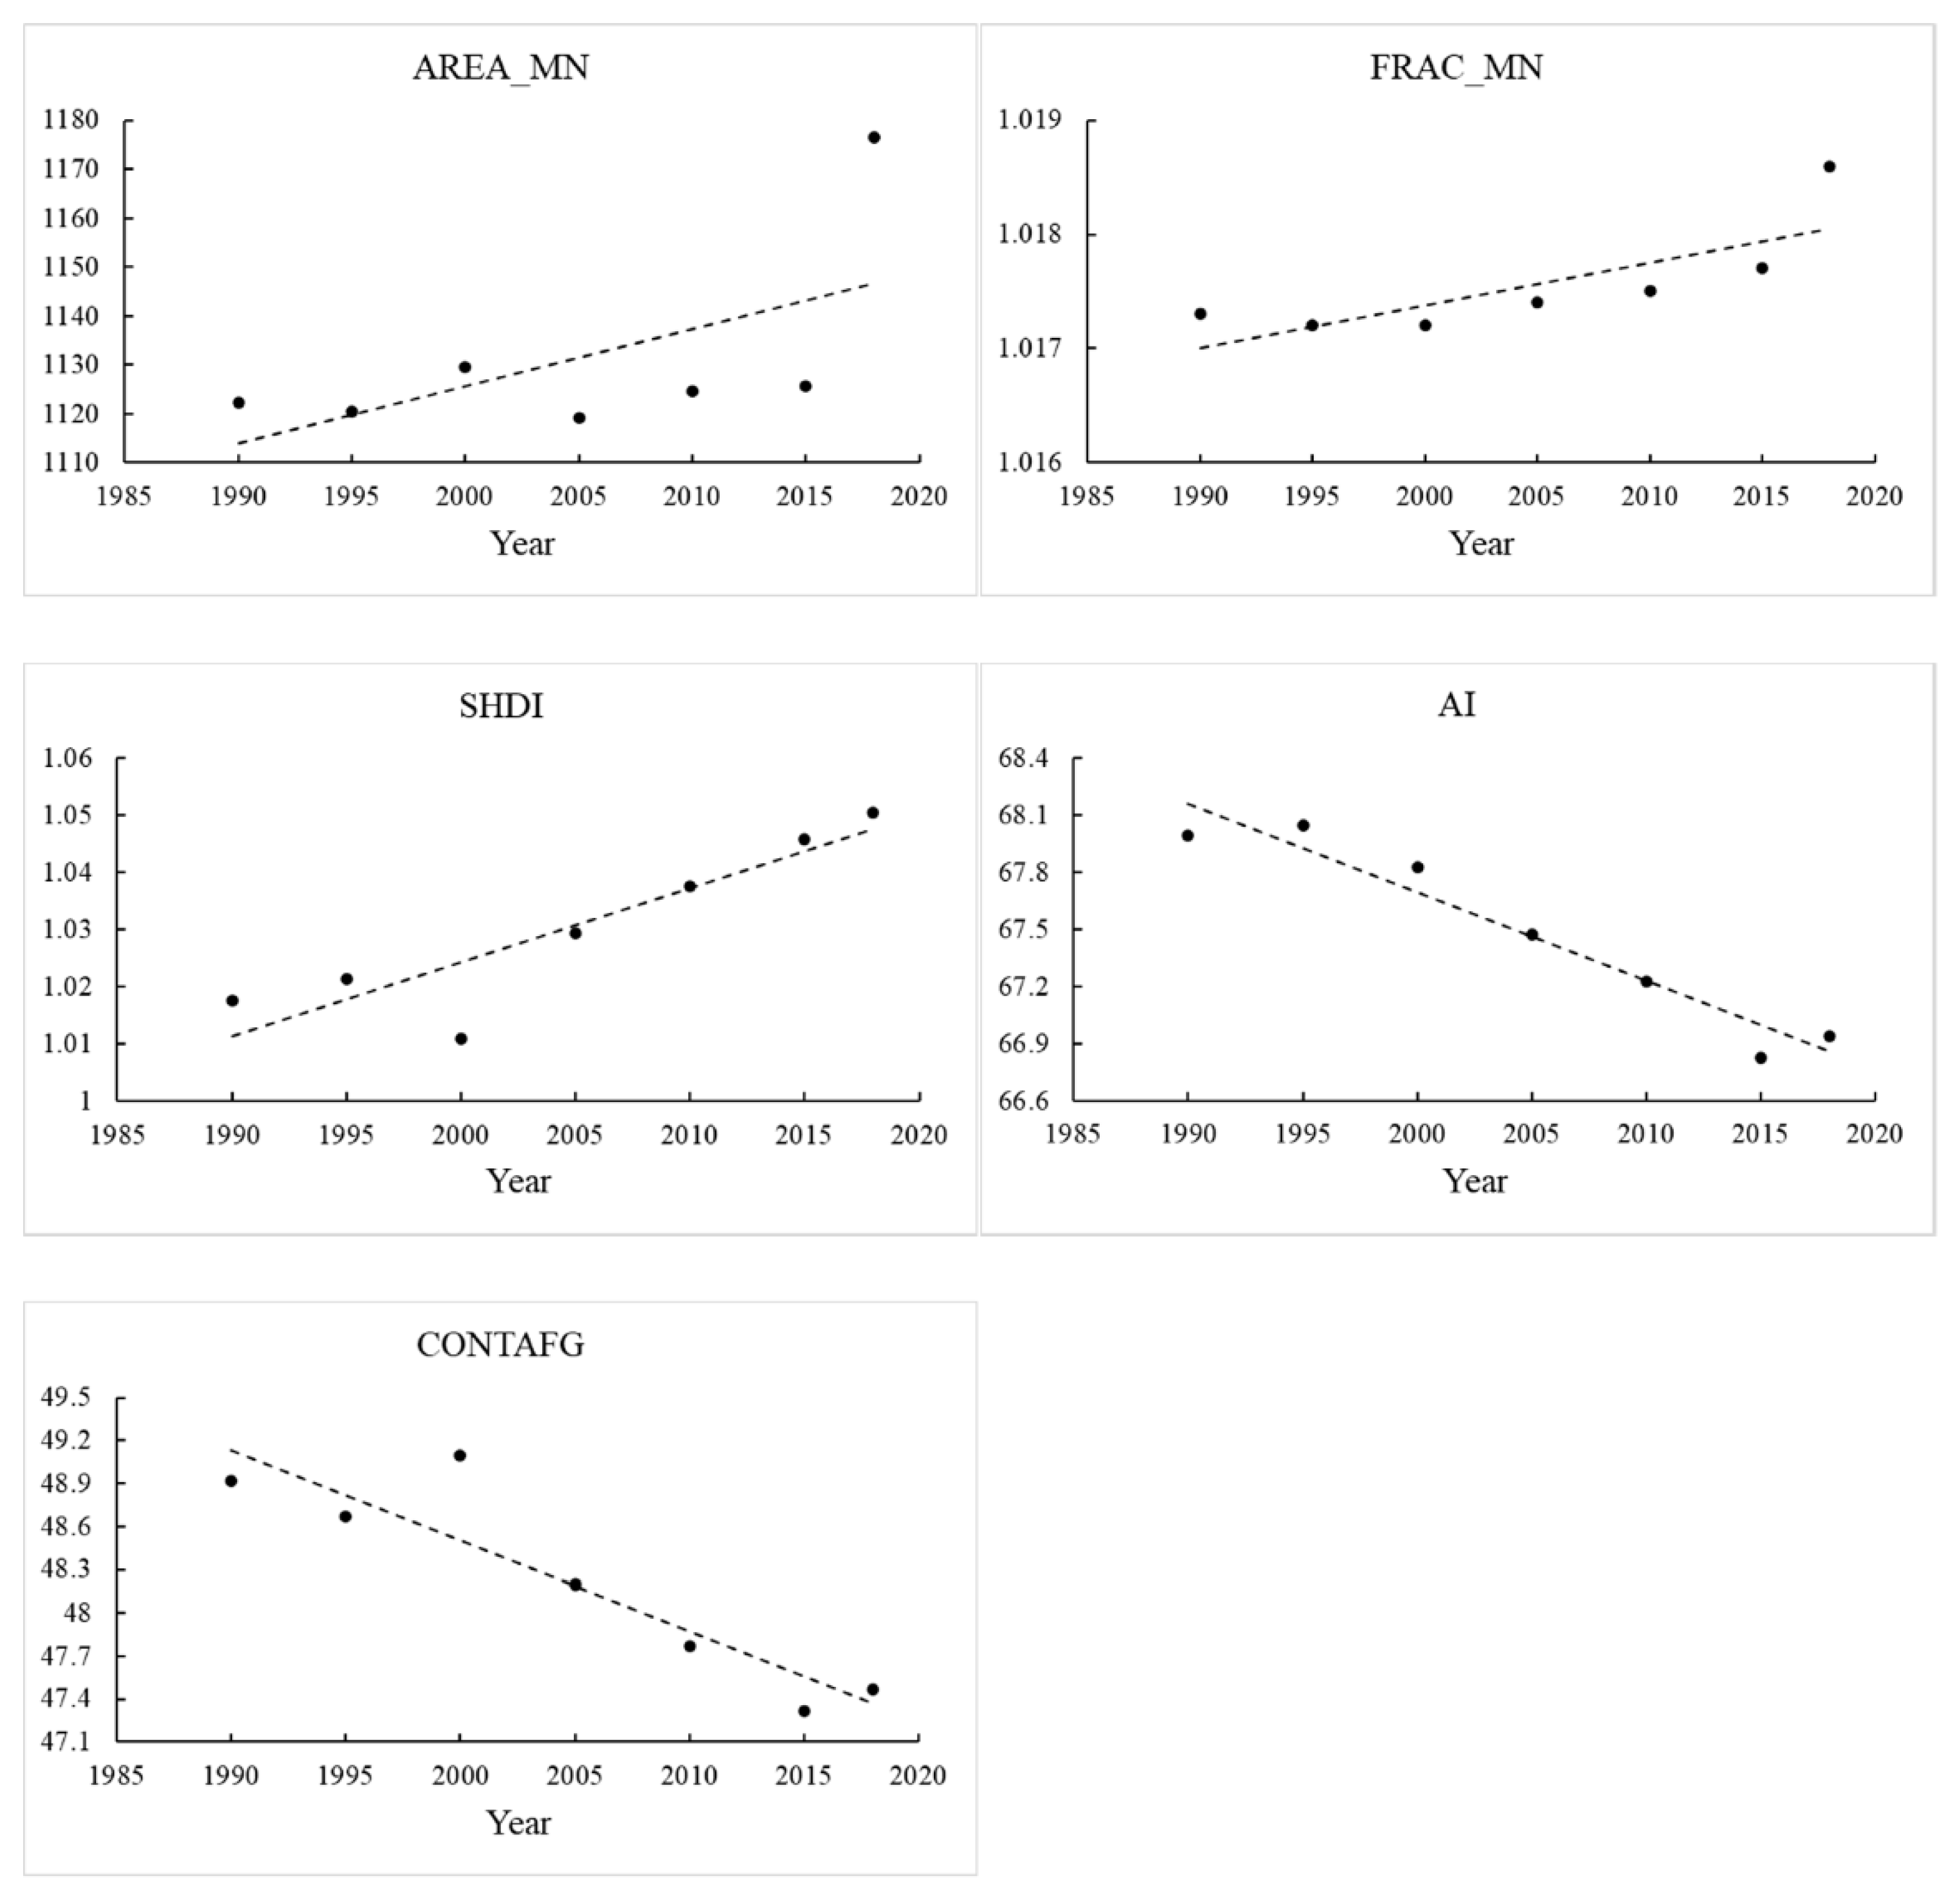
AREA_MN: A key index of the degree of landscape fragmentation. A smaller value represents a higher degree of fragmentation.
AREA _ MN = A N
where A is the total area of patches; and N is the number of patches.
(2)
FRAC_MN: An expression of patch shape complexity. The closer the expression is to 1, the simpler and more regular the patch shape is.
FRAC _ MN = i = j m j = 1 n 2 ln 0 . 25 pij ln Aij ni
where p ij is the perimeter (m) of patch ij ; A ij is the area (m2) of patch ij ;   n i is the number of patches in the landscape of each patch type i ; and 1 ≤ FRAC_MN ≤ 2.
(3)
SHDI: Describes the diversity and complexity of landscape patches. This value increases as the number of different patch types increases and/or the proportional distribution of area between patch types become more equitable.
SHDI = i = 1 m P i   ×   lnP i
where P i is the proportion of the landscape occupied by patch type i , m is the number of patch types in the present landscape, and SHDI ≥ 0, without limit.
(4)
AI: Indicates the degree of aggregation and non-randomness. The smaller the index value, the greater the dispersion of different types of patches in the landscape.
AI = 100   × i = 1 m g ii max g ii   ×   P i
where g ii is the number of similar adjacencies between pixels of patch type i based on the single-count method; max g ii is the maximum number of similar adjacencies between pixels of patch type i and is based on the single-count method; P i is the landscape proportion comprised of patch type i ; m is the number of patch types, and 0 ≤ AI ≤ 100.
(5)
CONTAG: Indicates the degree of aggregation or extension. The larger the index value, the higher the aggregation degree, and the better the connectivity.
CONTAG = 1   +   i = 1 m k = 1 m P i g ik k = 1 m g ik ln P i g ik k = 1 m g ik 2 ln m
where P i is the area percentage of type i patches; g ik is the number of adjacent patches of type i and type k ; m is the number of patches types of landscape, and 0 < CONTAG ≤ 100.

2.5. Calculation of Ecosystem Services

2.5.1. Ecosystem Services Selection

The topographic and climatic conditions of the Huaihe River Basin provide a wide range of essential ecosystem services to human society in the study area, including the supply of freshwater, maintaining biodiversity, soil retention, and carbon storage [53,54,55]. Freshwater supply and carbon storage have a direct influence on human survival [56], and biodiversity and soil retention promote and protect human well-being [8,57]. Taking into account the high-intensity resource development, agriculture, and other human activities that pose threats to the supply of ecosystem services, four ecosystem services were selected for measuring the ecosystem services capability of the Huaihe River Basin: water retention, soil retention, carbon storage, and biodiversity conservation.

2.5.2. Ecosystem Services Evaluation

There are various methods for evaluating ecosystem services capabilities, which mainly include monetary evaluation, GIS-based evaluation, and models such as InVEST, GLOBIO, and ARIES, of which monetary evaluation and InVEST models are the most commonly used [12,16,18,58,59,60]. However, monetary evaluation has been widely questioned and criticized since it was first proposed [61]. The InVEST models developed by the Natural Capital Project comprise nine terrestrial models and eight marine models and are capable of analyzing ecosystem service scenario predictions. They have been widely used to map ecosystem services provision and their spatial relationships, and are widely recognized as suitable for ecosystem services assessments [12,27,62,63,64].
InVEST (Version.3.9.2) is a GIS-based method for estimating ecosystem services across a landscape, given different land-use scenarios [65]. This study used the Water Yield model (for water retention), the Sediment Delivery Ratio model (for soil retention), the Carbon Storage and Sequestration model (for carbon storage), and the Habitat Quality model (for biodiversity conservation) to evaluate the ecosystem services in the Huaihe River Basin.
Water retention is defined as the ability of ecosystems to intercept or store water resources from precipitation, which is calculated as the amount of precipitation minus evapotranspiration and runoff [66]. Then the annual water yield for each pixel is estimated based on average annual precipitation and the Budyko curve [67].
Y x = 1 AET x P x   ×   P x
where Y x is the water yield of pixel x (m3); AET x is the pixel x annual actual evaporation (mm); P x is the annual precipitation of pixel x (mm).
Soil retention was calculated using the InVEST Sediment Delivery Ratio model as the average annual amount of soil loss from each parcel of land. The model uses the Universal Soil Loss Equation to identify a land parcel’s potential soil yield and capacity to retain sediment [67].
rusle x   =   R x   ×   K x   ×   LS x   ×   C x   ×   P x
where R x is rainfall erosivity(MJ·mm·hm−2·h−1·a−1); K x is soil erodibility (t·h·MJ−1·mm−1); LS x is a slope length-gradient factor (unitless); C x is a cover-management factor (unitless); and P x is a support practice factor (unitless).
Carbon storage was calculated using the InVEST Carbon Storage and Sequestration model to estimate aboveground biomass, belowground biomass, soil, and dead organic matter per landscape type [66]. We parameterized the model using biomass values from studies in the Huaihe River Basin and the Intergovernmental Panel on Climate Change Guidelines for National Greenhouse Gas Inventories (IPCC) [68].
S cx   =   C above   +   C below   +   C soil   +   C dead
where S cx is the amount of carbon stored in Mg in pixel x ; C above is the aboveground carbon value; C below is the belowground carbon value; C soil is the soil carbon value; C dead is the dead carbon value.
Biodiversity conservation was calculated using the InVEST model for Habitat Quality, which estimates the extent of suitable habitat for organisms by combining information on landscape suitability and threats to biodiversity [67]. The relative impact of each threat and the distance between habitats and sources of threats are referred to in the published literature [4,69,70].
Q xj   =   H j 1     D xj 2 D xj 2   +   K 2
where Q xj is habitat quality, H j is habitat suitability; D xj is the total threat level in pixel x with habitat type j ; K is a scaling parameter.

2.6. Analysis of the Relationships between Landscapes and Ecosystem Services

Spearman correlation analysis was used to study the relationships between temporal changes between landscape patterns and ecosystem services using SPSS 22 software [33]. The global bivariate spatial correlation represents spatial features at the entire scale through Moran’s I, which was used to analyze spatial relationships between ecosystem services and landscape patterns [22]. The spatial analyses were conducted using GeoDa software (http://geodacenter.github.io/, accessed on 3 December 2021). The formula is written as:
I sr = n i = 1 n j = 1 n W ij yi , s     y ¯ s σ   s yi , r     y ¯ r σ   r n 1 i = 1 n j = 1 n W ij )
where I sr is the bivariate global autocorrelation coefficient of landscape index s and ecosystem services characterization indicator r ; n is the amount of data; W ij is the spatial weight between elements i and j ; yi , s and yi , r are the landscape indices and ecosystem services at pixel i ; σ   s and σ   r are the variances;   y ¯ s and   y ¯ r are the average values of landscape indices and ecosystem services.

3. Results

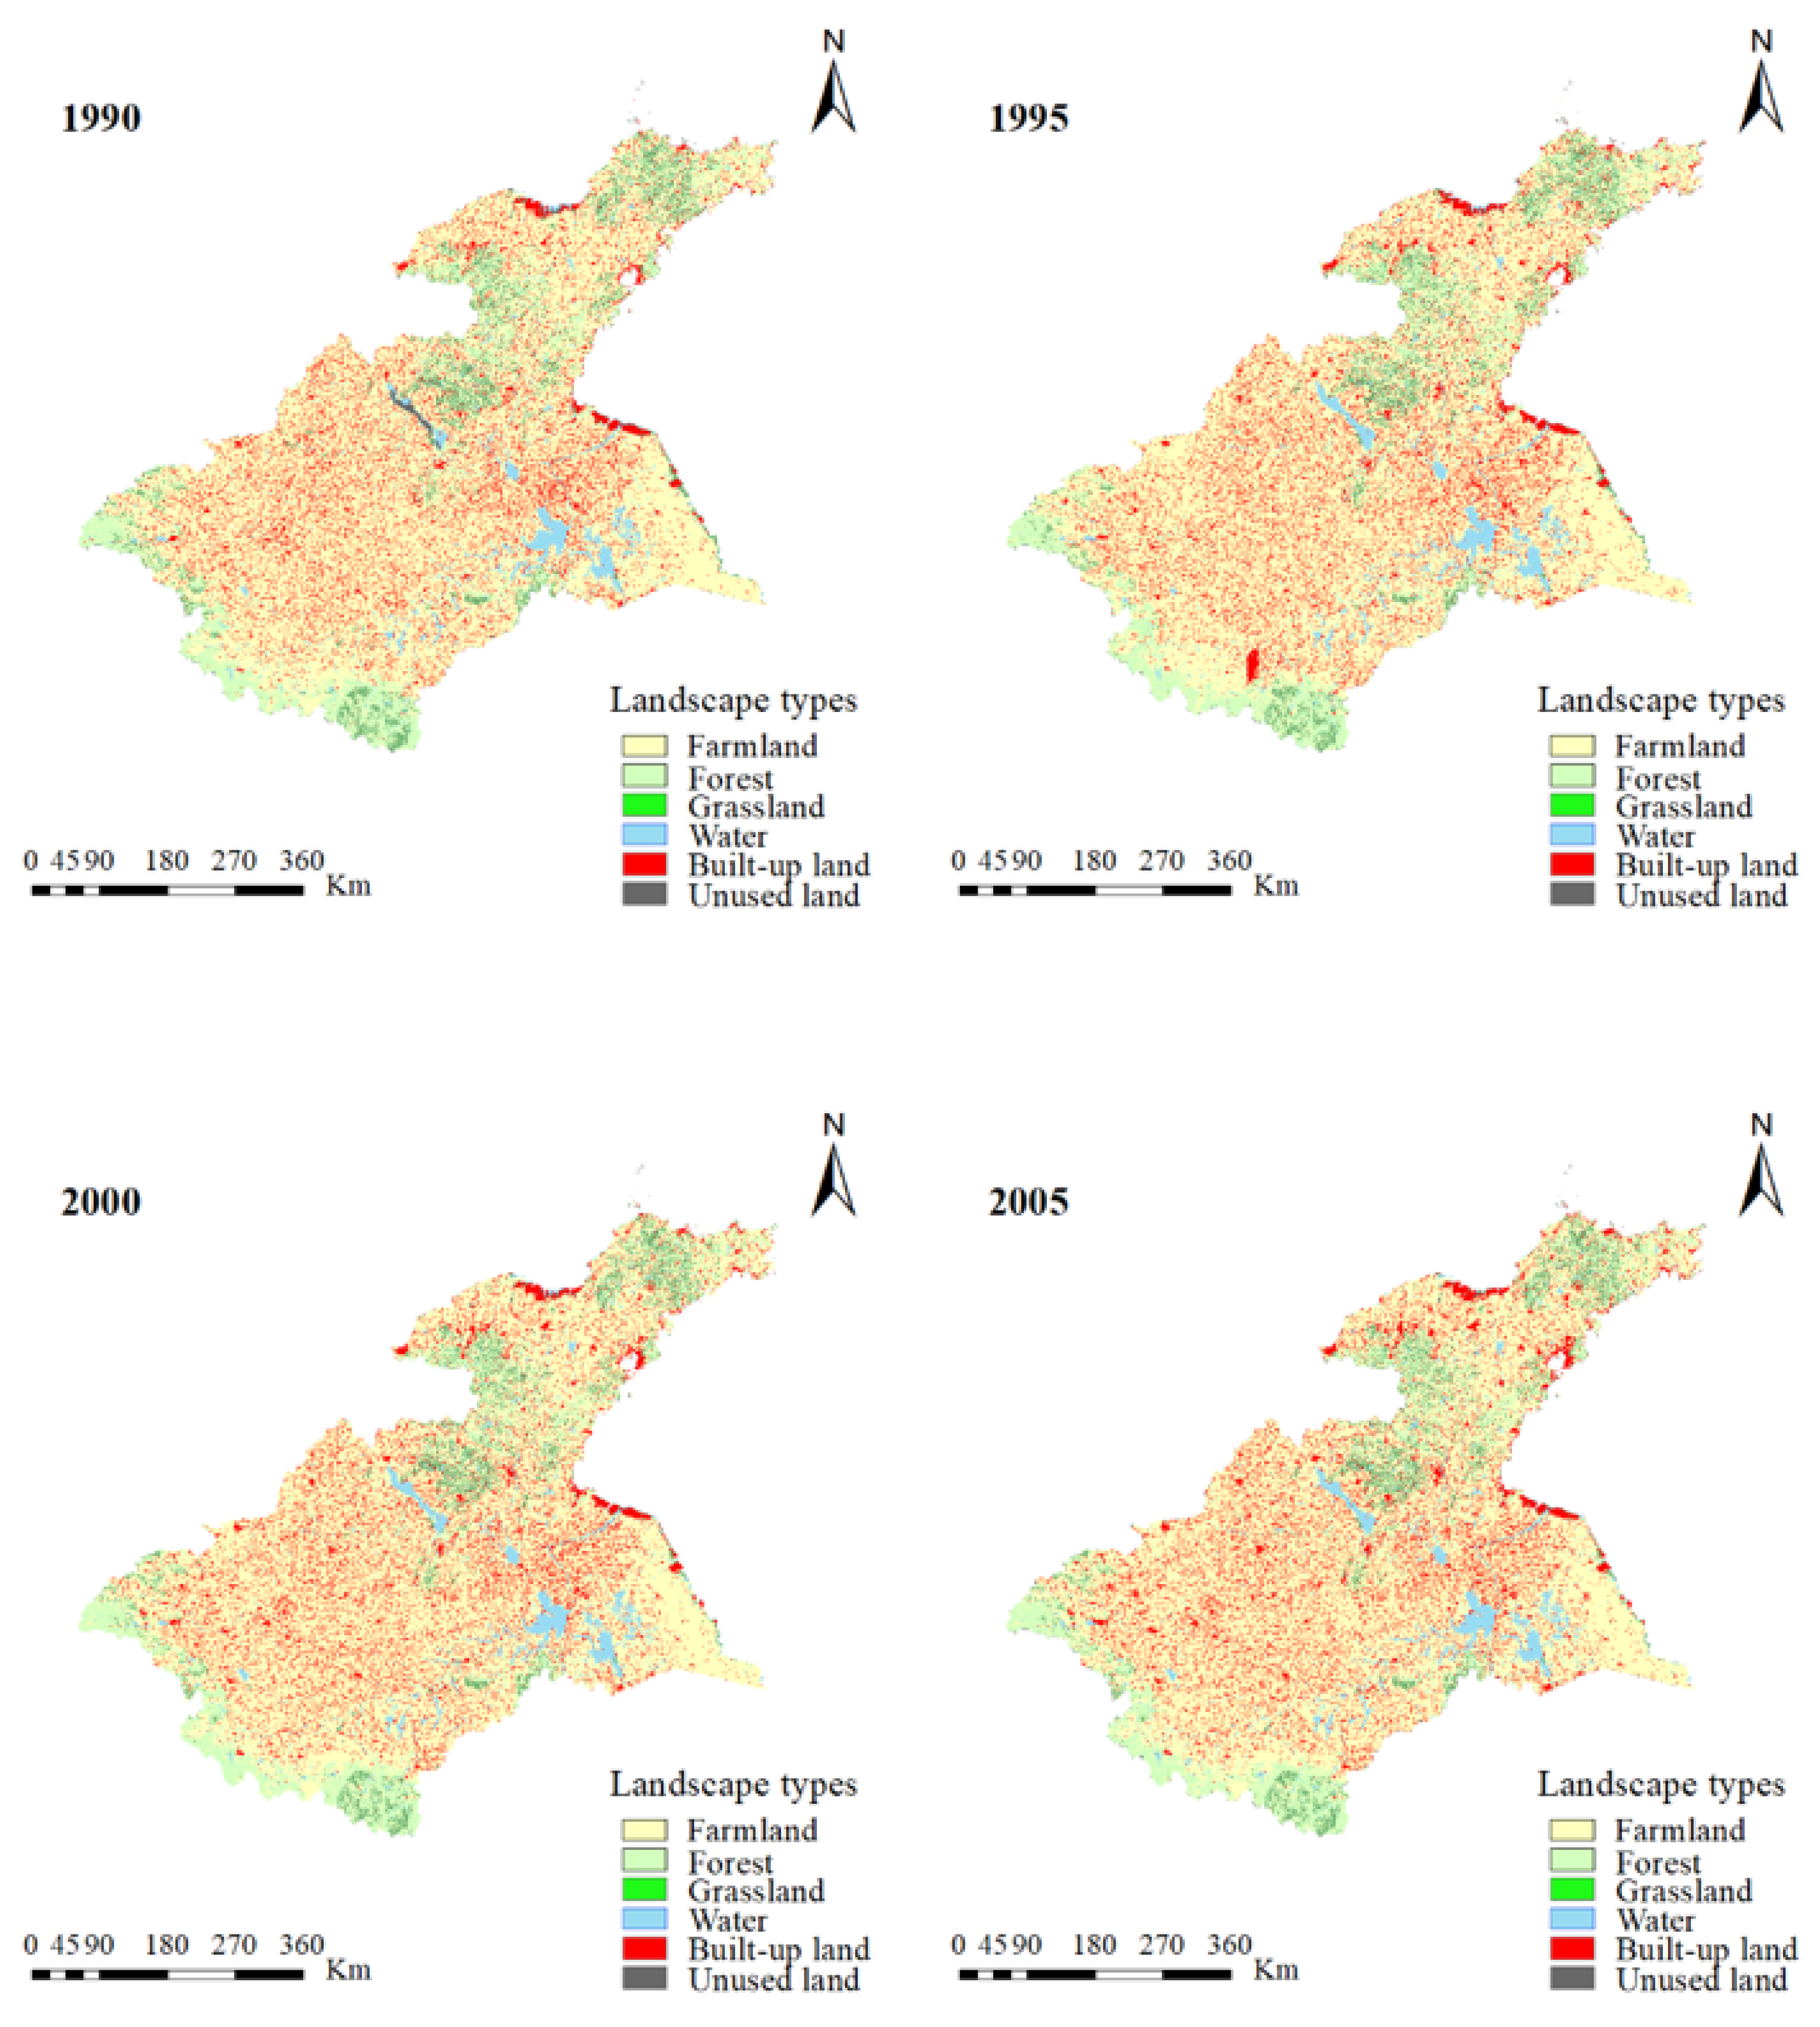
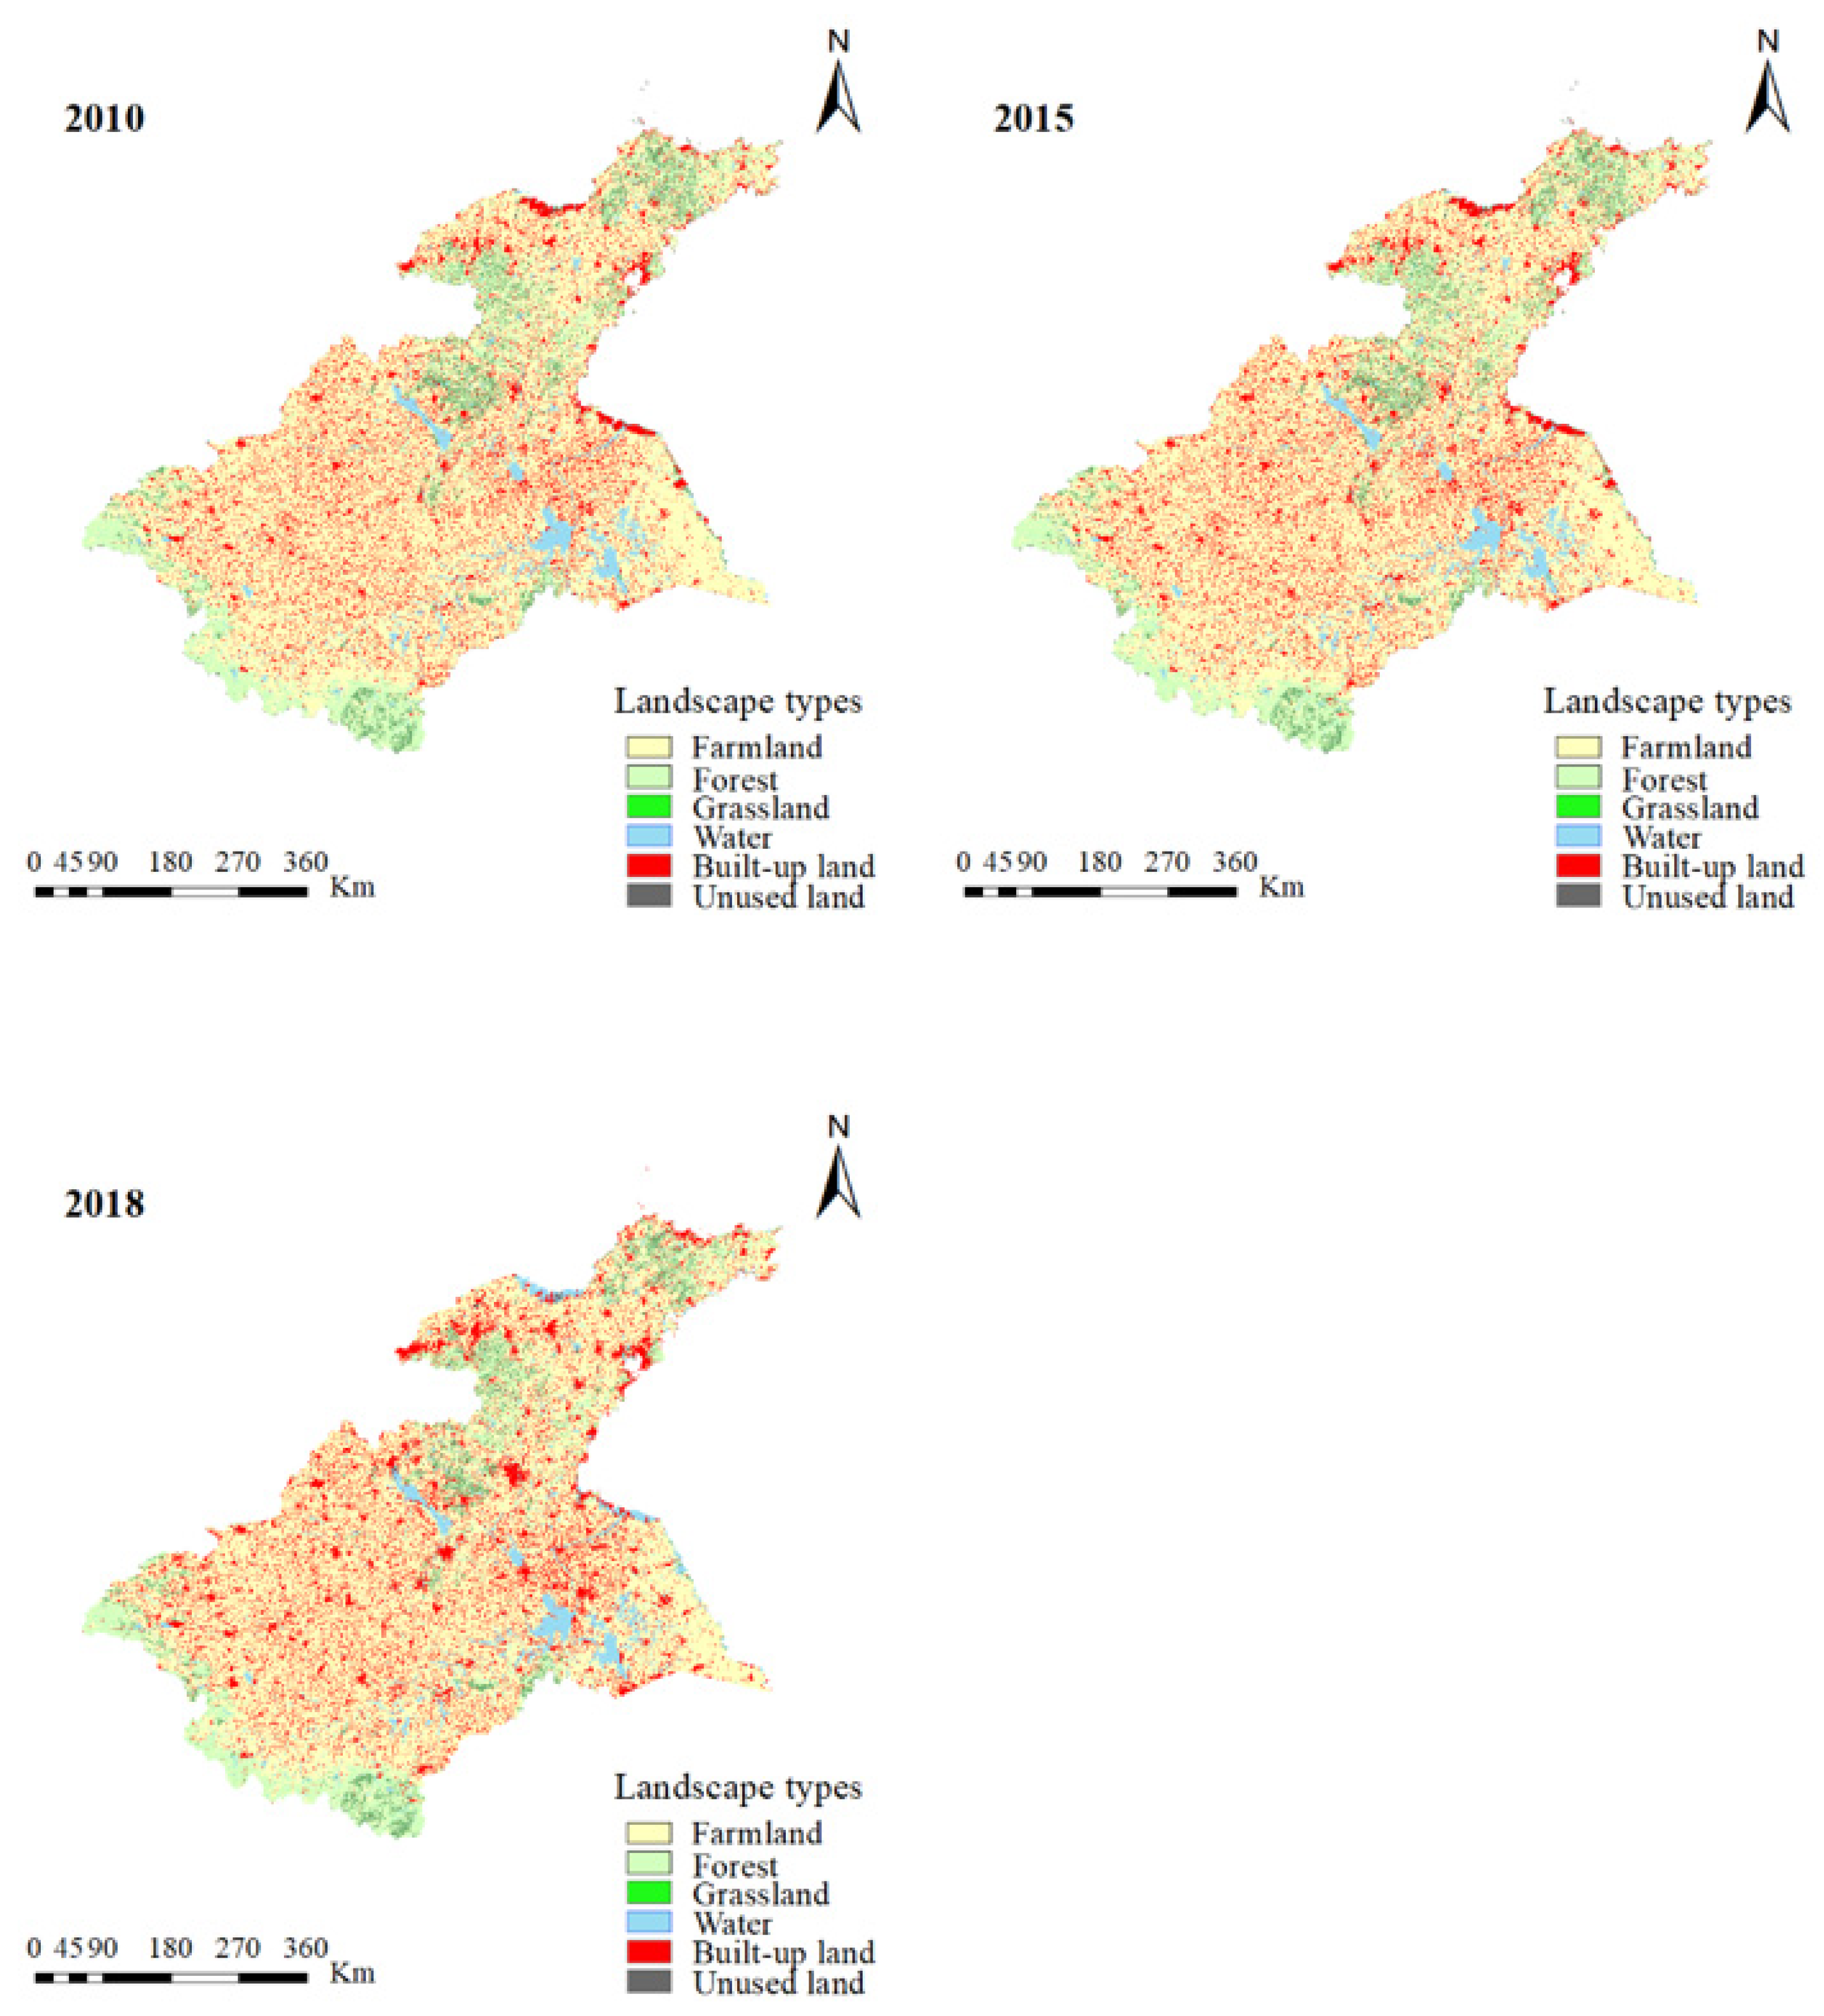
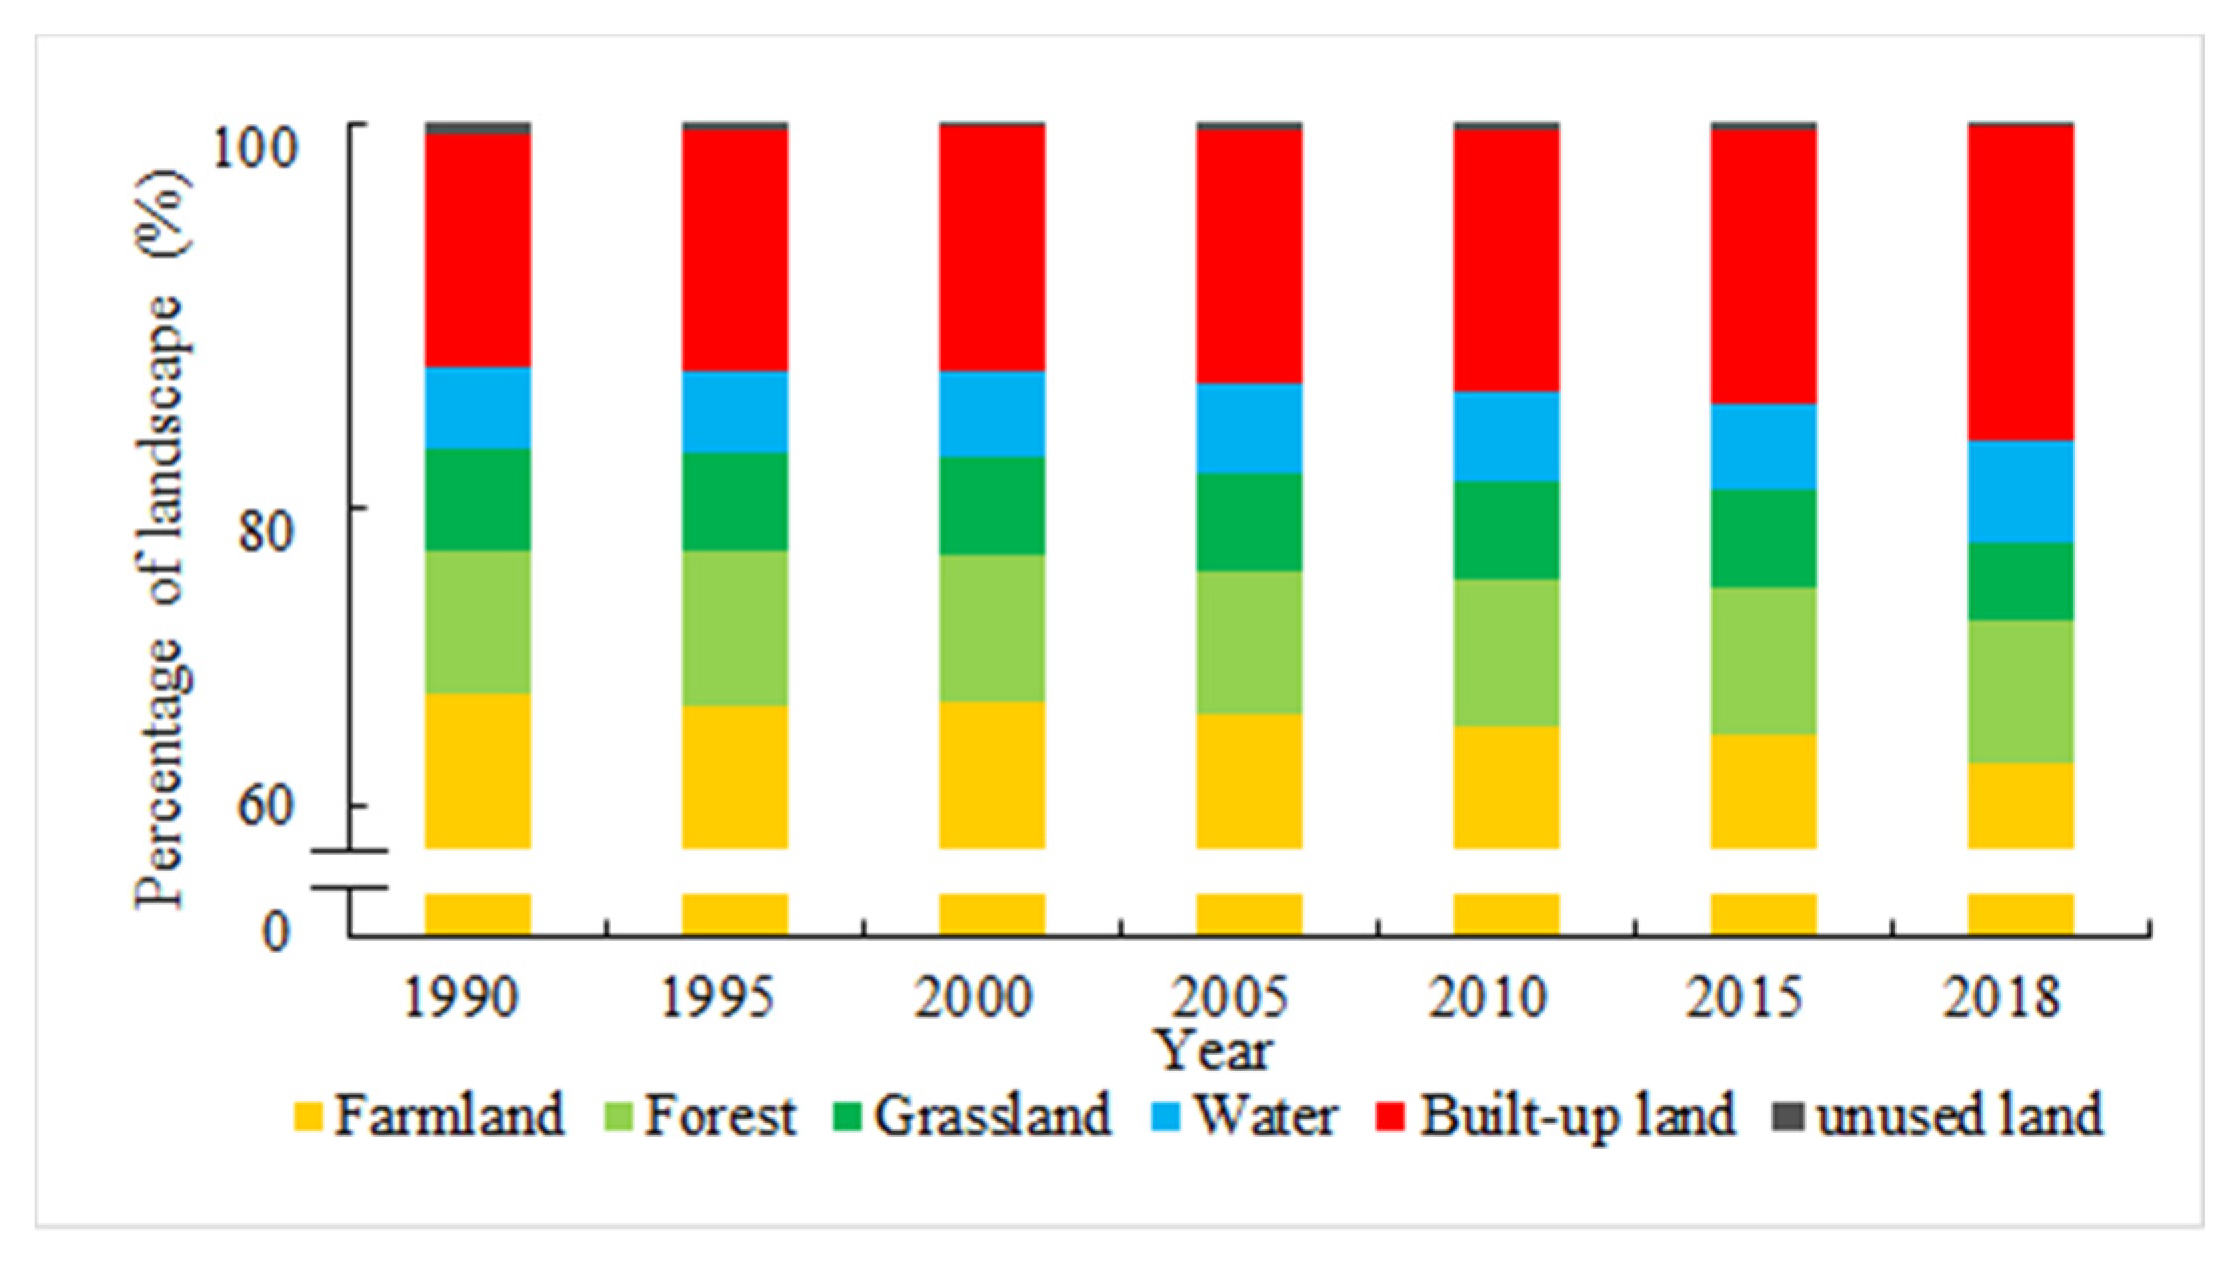
3.1. Landscape Composition Change

The landscape composition in the Huaihe River Basin during 1990–2018 was obtained according to the landscape type images (Figure 3). The results showed that farmland accounted for the major landscape type in the Huaihe River Basin, covering more than 66% of this area; the second was built-up land, covering more than 12% (except in 1990). The area of forest, grassland, and water were relatively small, and their total coverage in the study area is less than 16%. Combined with landscape change rates at 5-year intervals (Table 1), changes to landscape composition in the study area were characterized by the expansion of built-up land and water, the reduction of farmland and grassland, and forest and unused land were variable. From 1990 to 2018, area percentages of built-up land and water increased from 11.9% to 16.3% and 4.1% to 5.3%, respectively; farmland and grassland decreased from 70.3% to 66.8% and 5.4% to 3.9%, respectively.
The landscape transfer matrix (Table 2) showed that during the study period, the largest reduction in landscape type area was farmland. Around 48,794 km2 was transferred to other types, mainly to built-up land (33,519 km2). Less area was transferred to farmland, mainly from built-up land (19,844 km2). The Grassland area also decreased and was mainly transferred to farmland (6763 km2) and forest (2760 km2). Unused land was mainly transferred to water and farmland, and the transfer-out area was three times the transferred-in area, while only part of the area was reserved. The biggest increase in built-up land area was mainly from farmland (33,519 km2) and grassland (1154 km2), and the main transfer-out was to farmland (19,844 km2) and water (1839 km2). The area transferred out was only half of that transferred in. The water area also increased, mainly from farmland (5919 km2) and built-up land (1839 km2). The area of forest was unchanged. In general, changes in landscape types during the study period were dominated by decreases in farmland and grassland and increased built-up land and water. The transition of landscape types mainly occurs between farmland, built-up, grassland, and water.

3.2. Landscape Spatial Configuration Change

The landscape indices in the Huaihe River Basin at the landscape level were calculated using Fragstats 4.2 software (Figure 4).
From 1990 to 2018, the AREA_MN, FRAC_MN, and SHDI indices increased, whereas CONTAG and AI indices decreased (p < 0.05). AREA_MN increased from 1122 km2 to 1177 km2, implying that landscape fragmentation was reduced, and also suggesting that some small landscape patches gradually merged into larger patches. FRAC_MN increased slightly from 1.0173 to 1.0186, indicating that landscape patch shapes gradually became more complex and irregular. SHDI increased, revealing an increase in landscape heterogeneity and evenness. The AI decrease showed that connectivity within the same landscape type was weakened, and the degree of discreteness was enhanced. CONTAG declined from 48.9177 to 47.4691, indicating that the degree of aggregation between patches gradually weakened.

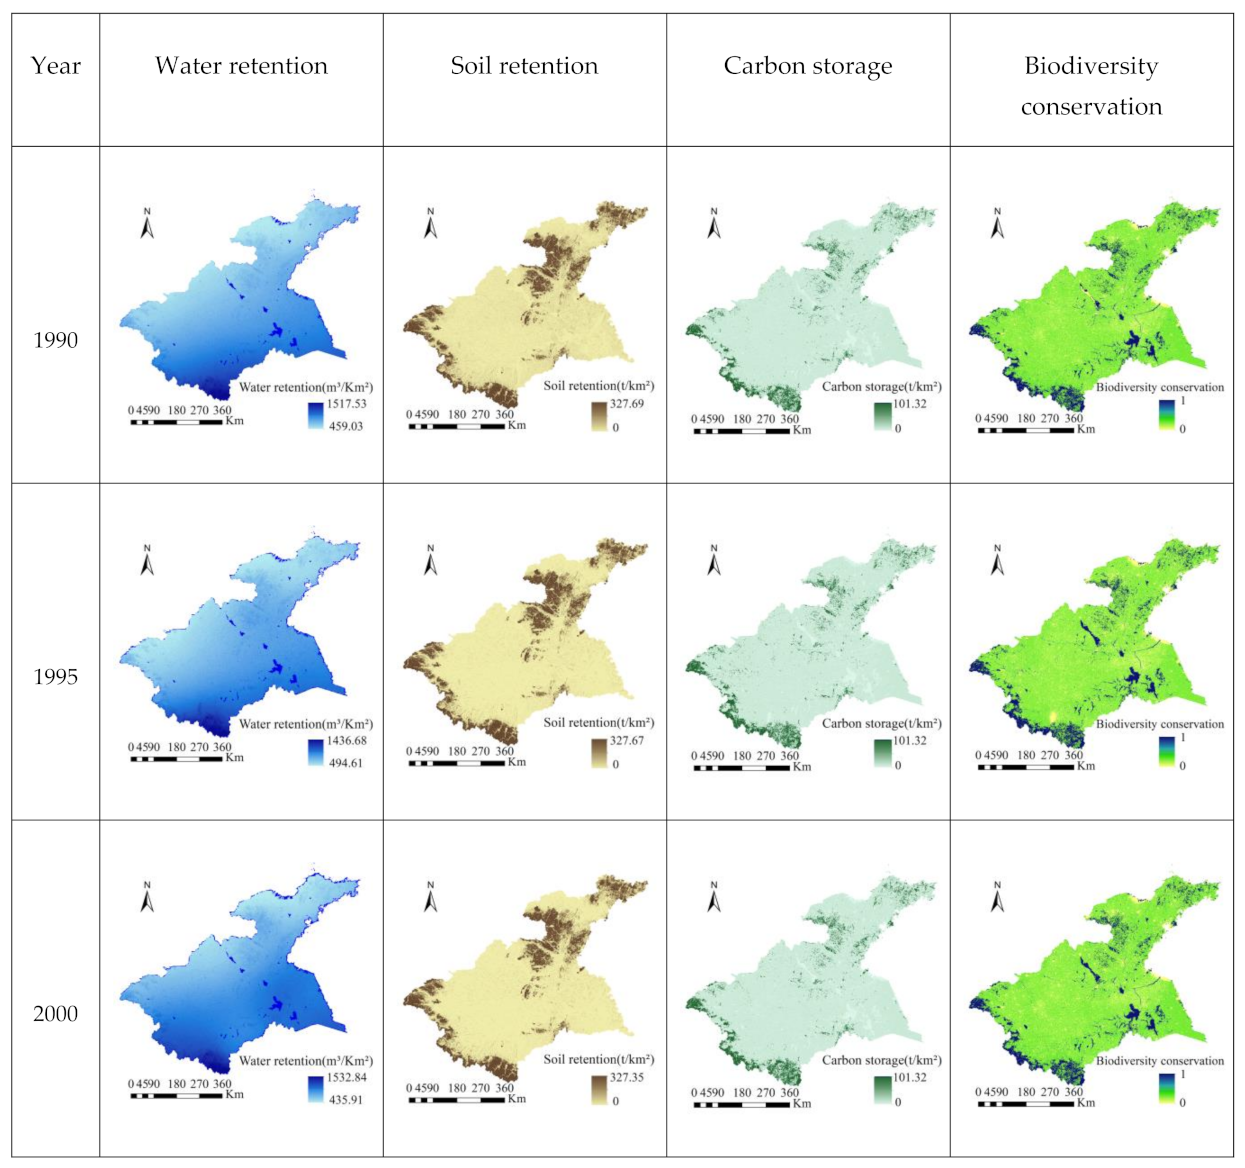
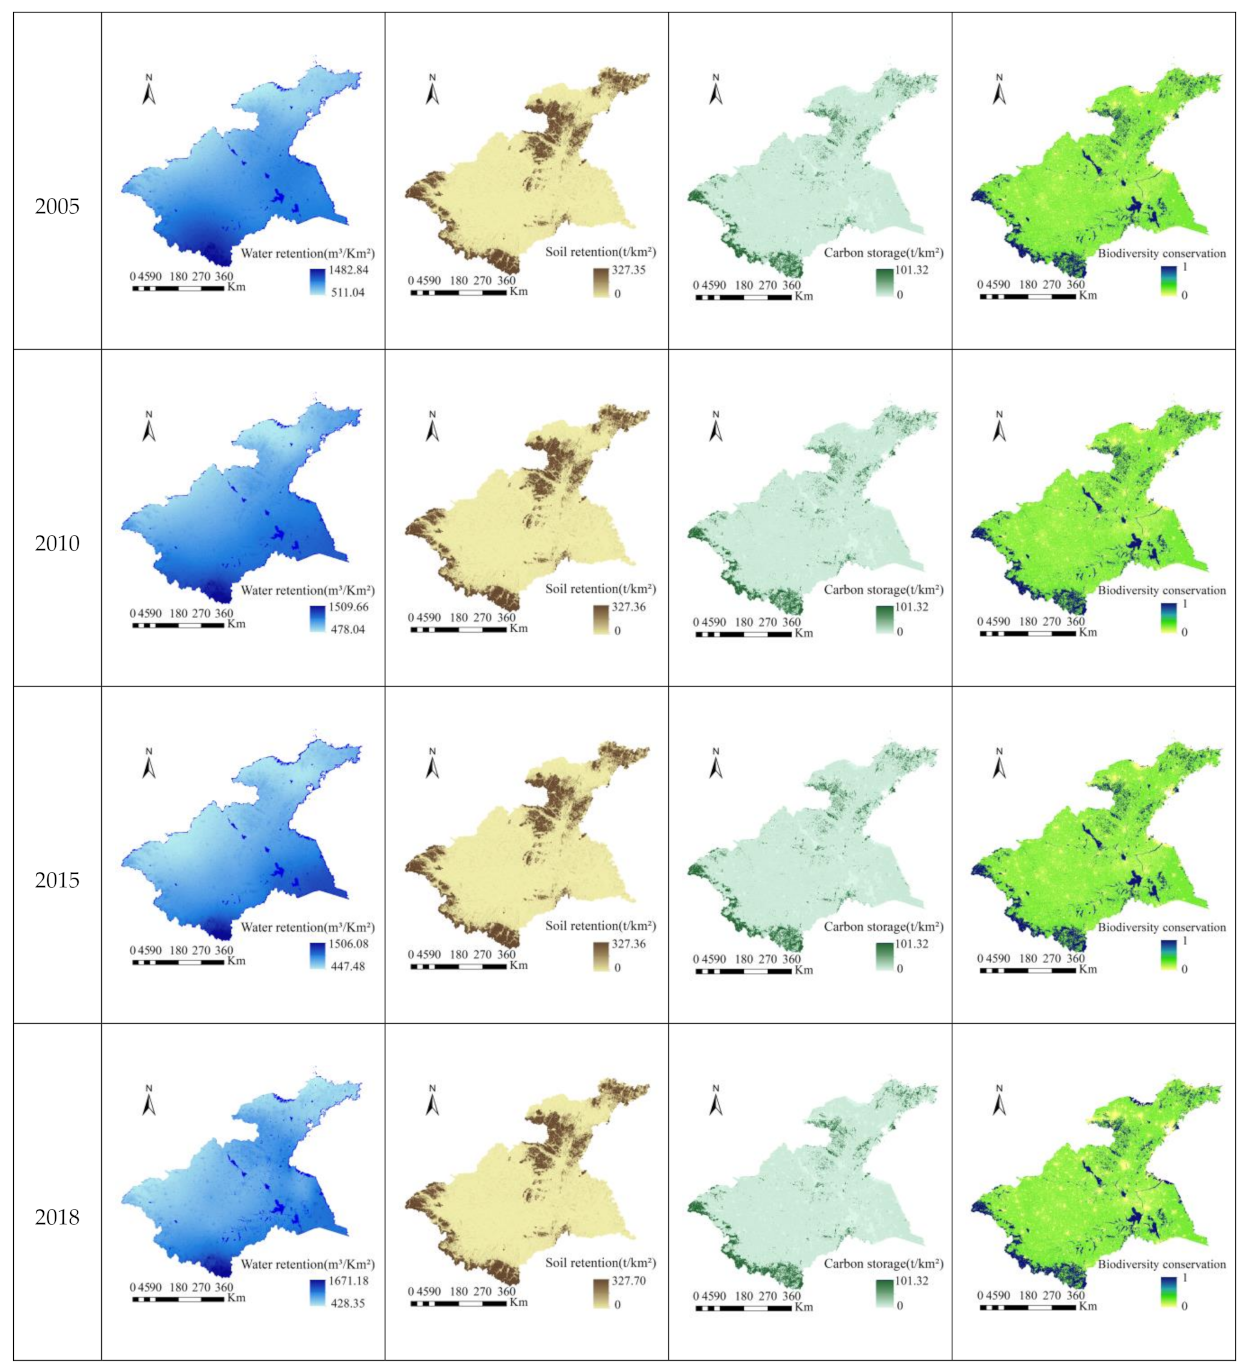
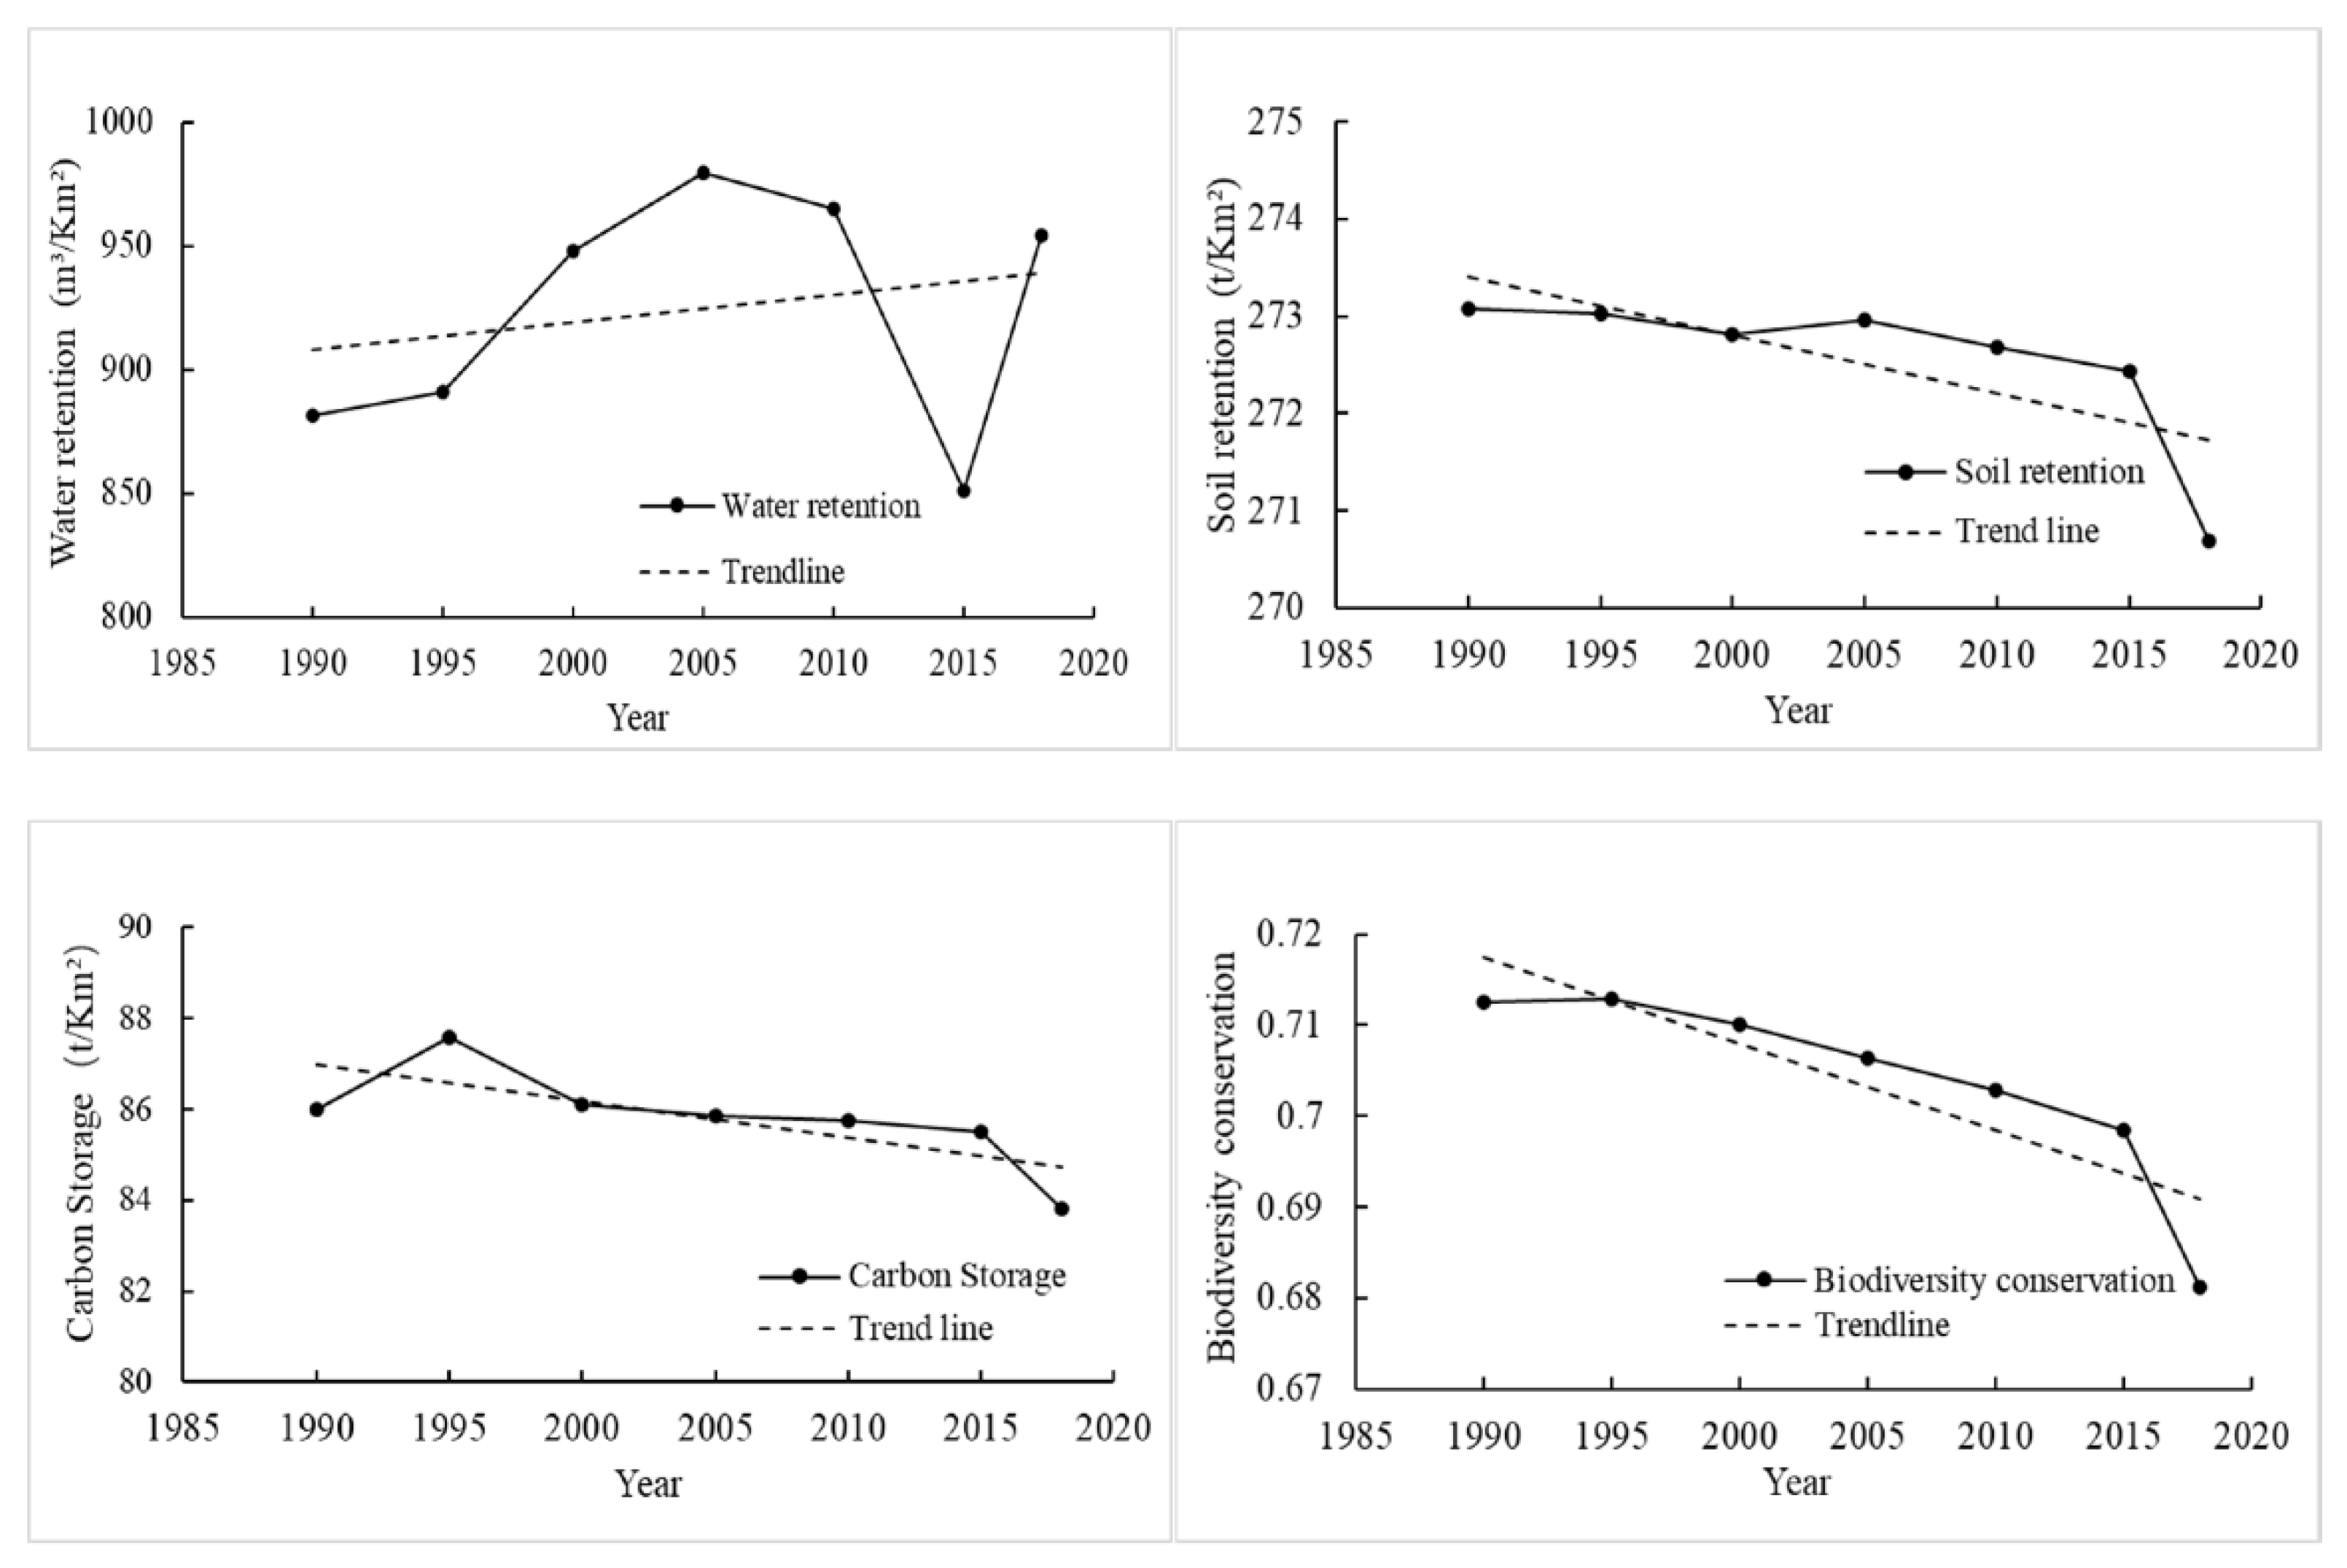
3.3. Ecosystem Services Changes

Based on meteorological, topographic, and landscape type data, ecosystem services of the Huaihe River Basin were calculated using the InVEST models (Figure 5).
Water retention increased from 1990 to 2018 (Figure 6). Total water retention for the study area was 23.4 × 10⁹ m3 in 1990 and 25.3 × 10⁹ m3 in 2018. The water retention capacity in the Huaihe River Basin increased from 881.55 m3/km2 in 1990 to 954.58 m3/km2 in 2018, an increase of about 8.3%. Water retention exhibited a spatial pattern of “high in the southwest and low in the northeast”, and the high-value area gradually increased and expanded from south to north during 1990–2018.
Soil retention was 217 × 106 t in 1990 and 216 × 106 t in 2018, a slight decline over time. The soil retention capacity also slightly decreased (Figure 6), declining from 273.07 t/km2 to 270.69 t/km2, and the drop was 0.9% from 1990–2018. The spatial distribution of soil retention in the Huaihe River Basin showed that high values were found in the west and northeast, low values in the central and southeast regions, and the spatial distribution area did not change significantly over the study period.
Total carbon storage in the Huaihe River Basin first increased from 71.9 × 10⁶ t in 1990 to 73.1 × 10⁶ t in 1995, then decreased to 70.0 × 10⁶ t in 2018. The carbon storage capacity overall decreased (Figure 6), with a maximum value in 1995 of 87.59 t/km2 and a minimum value in 2018 of 83.81 t/km2, a 4.3% decline. During the study period, the highest amount of carbon storage mainly occurred in the western region, with a sporadic distribution in the north, and the change of carbon storage per unit area in different regions was small.
The scoring of biodiversity conservation in the Huaihe River Basin clearly decreased during the study period (Figure 6), from 0.713 in 1990 to 0.681 in 2018, a reduction of 4.5%. The regions with high scores were mainly concentrated in the western and central Huaihe River Basin, and the areas with low scores expanded from 1990 to 2018.

3.4. Quantitative Relationships between Landscape Indices and Ecosystem Services

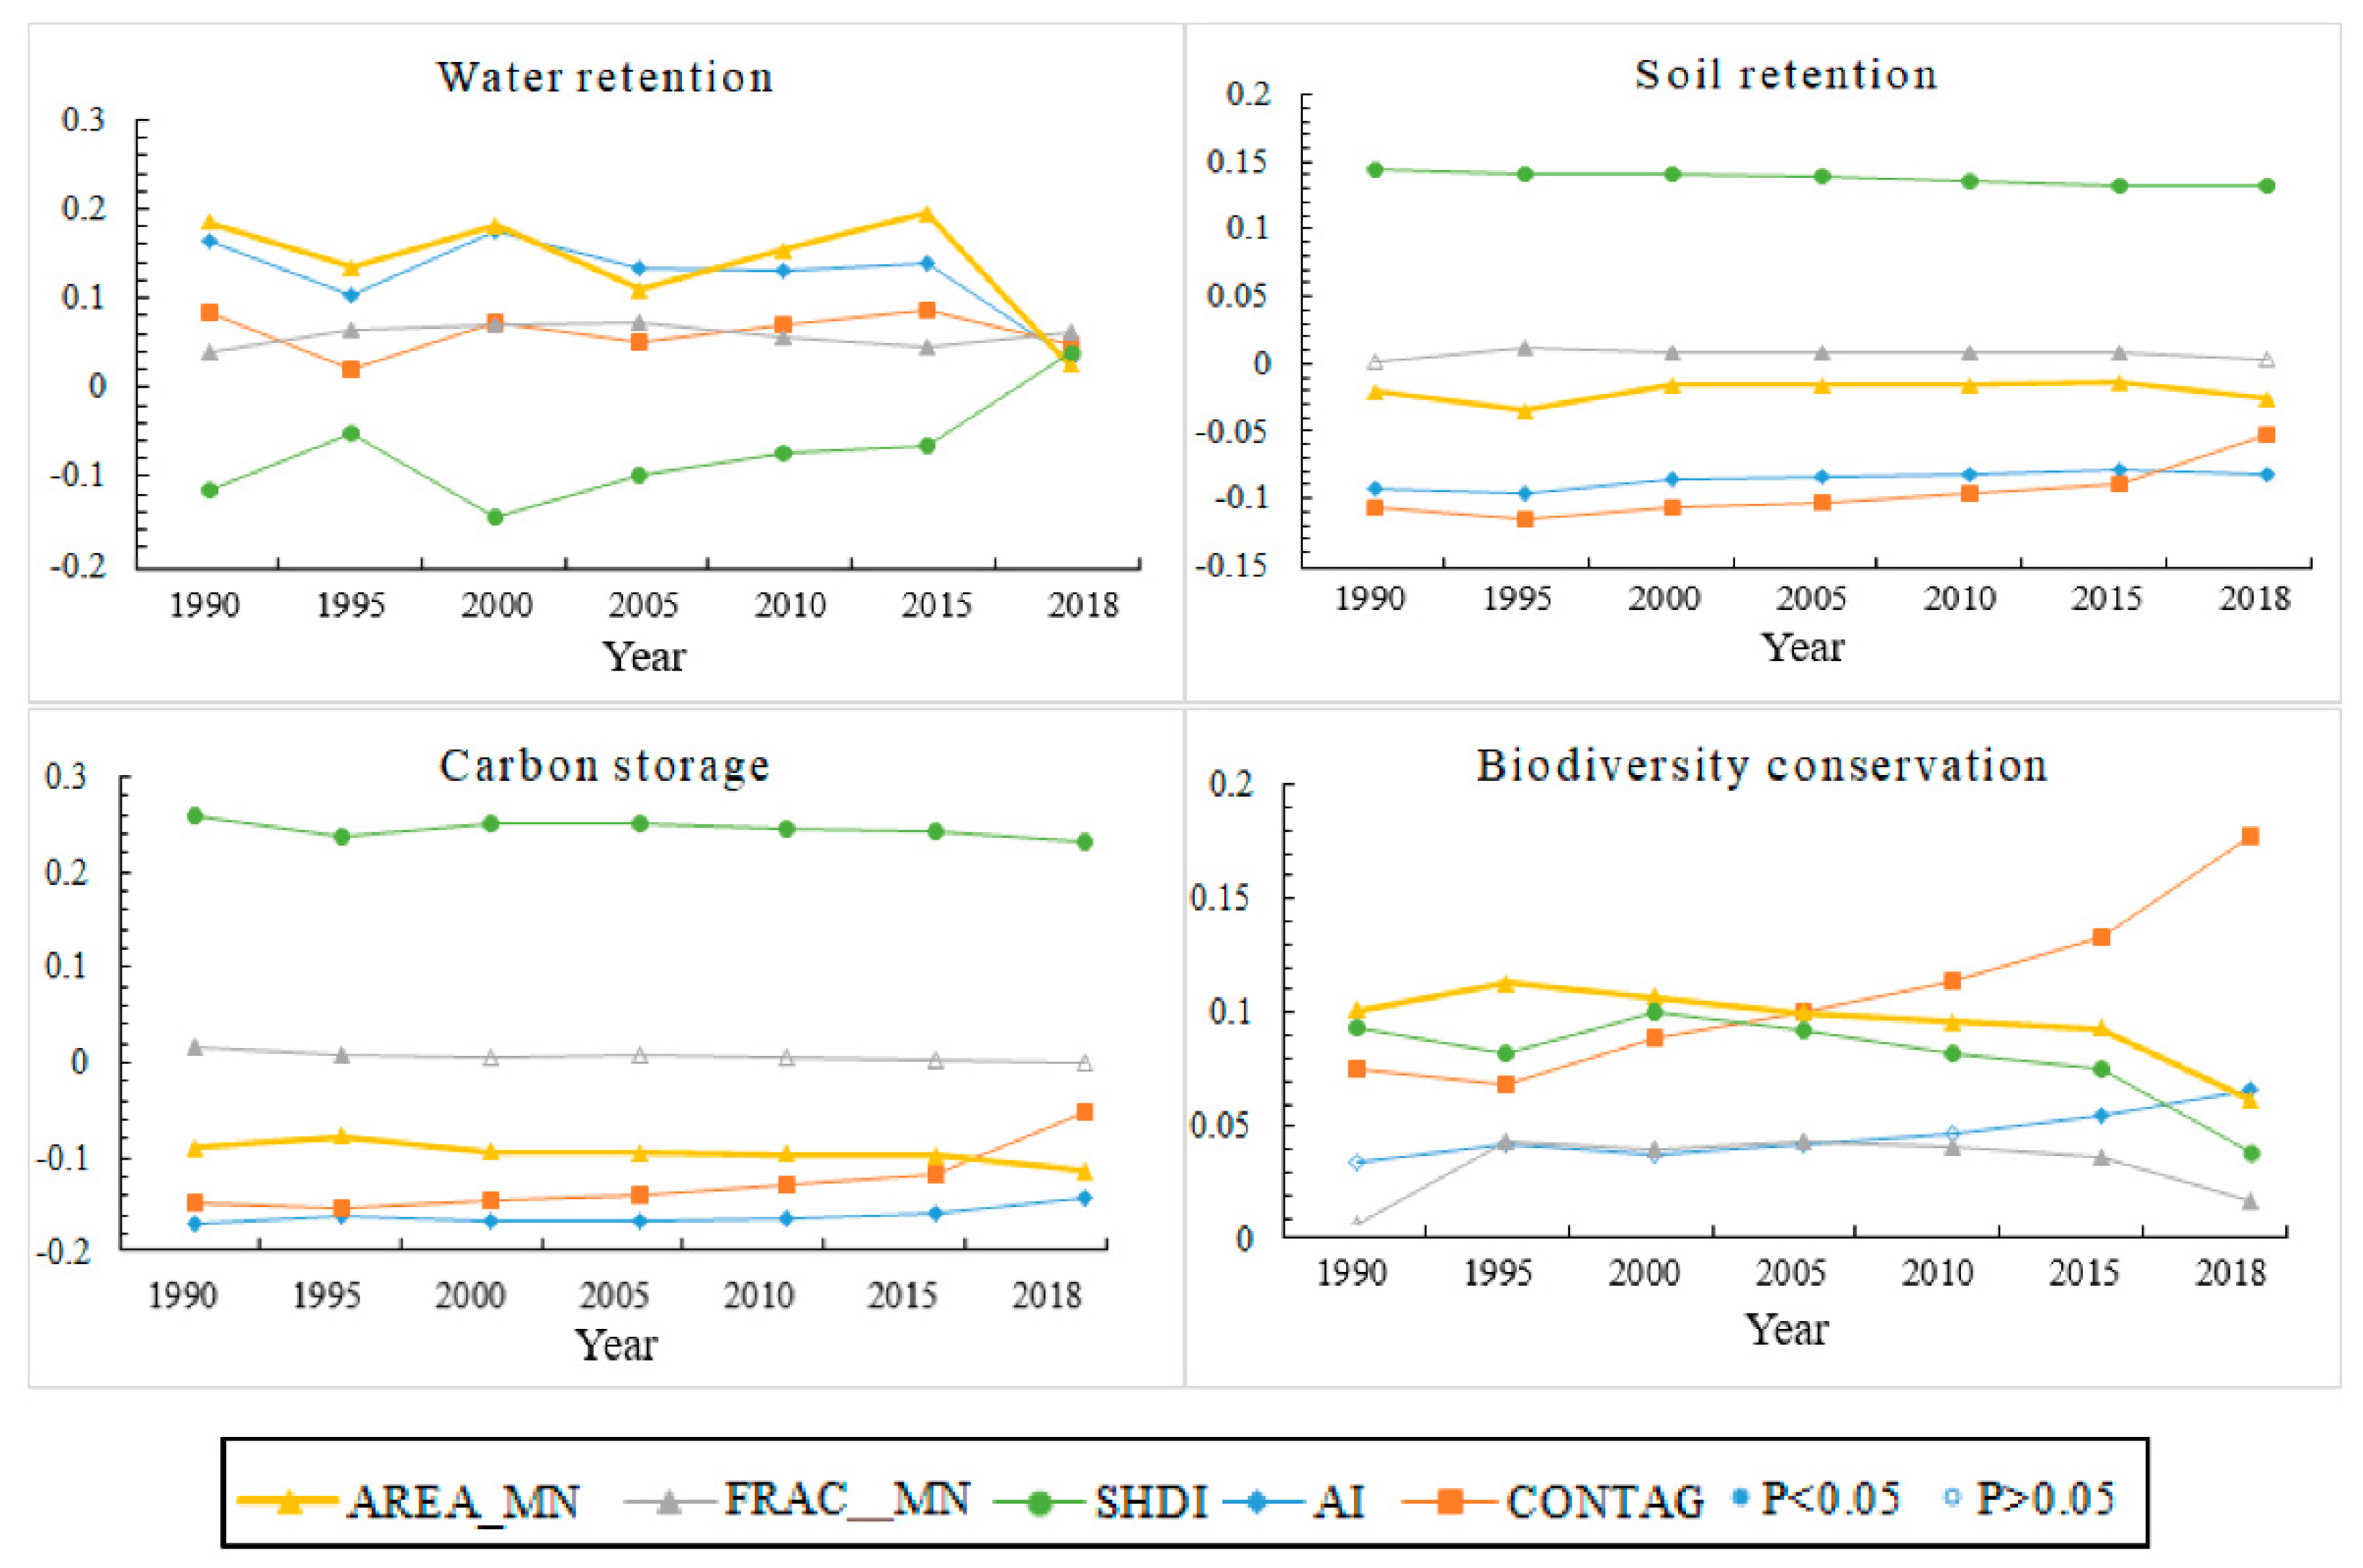
3.4.1. Temporal Relationships between Landscape Indices and Ecosystem Services

The temporal relationships between landscape indices and ecosystem services in the Huaihe River Basin were calculated using Spearman correlation analysis in SPSS 22 software (Table 3).
There was a significant positive correlation between water retention and AI (p < 0.05), a negative correlation with FRAC_MN (p < 0.01) and AREA_MN (p < 0.05), and no obvious relationship with CONTAG and SHDI. There were no obvious correlations between soil retention and the landscape pattern indices. Carbon storage was significantly negatively correlated with AREA_MN and FRAC_MN (p < 0.01) and had no obvious correlation with other landscape indices. Biodiversity conservation had clear positive correlations with CONTAG and AI (p < 0.05), and negative correlations with FRAC_MN, AREA_MN (p < 0.01), and SHDI (p < 0.05).

3.4.2. Spatial Relationships between Landscape Indices and Ecosystem Services

This study calculated Moran’s I values to explore the spatial relationships between landscape indices and ecosystem services in the Huaihe River Basin from 1990–2018 (Figure 7). Except for FRAC_MN, there were significant spatial correlations between water retention and the landscape indices. However, these correlations gradually decreased. The spatial correlations between soil retention, SHDI, and CONTAG were significant, spatial correlations between AI and AREA_MN with soil retention were weak, and there was no obvious relationship with FRAC_MN. The overall spatial correlations were very stable with little fluctuation. There were stronger correlations between water retention and ecosystem services, except for FRAC_MN, and all slightly declined over time. Biodiversity conservation and all landscape indices show a more or less spatial correlation. The spatial correlations for AI and CONTAG increased, AREA_MN and SHDI decreased, and FRAC_MN was small without fluctuation.

4. Discussion

4.1. Change of Landscape Pattern

Due to its rapid economic development and abundant natural resources, the Huaihe River Basin has become an important agricultural and industrial base in China [39,42]. In the present study, landscape type composition analysis, a landscape transfer matrix, and landscape indices were used to explore the changing characteristics of landscape patterns driven by human activities and the environment in the Huaihe River Basin from 1990 to 2018.
In the study period, farmland has consistently made up a high percentage of the total area in the Huaihe River Basin. Although the “Returning Farmland to Forest” policy led to the partial conversion from farmland to forest and grassland [30], the grassland area obviously reduced, and the forest area remained stable (Table 2). The reason for this phenomenon is that a large area of farmland has been converted to built-up land to meet the needs of economic development and urbanization, and the positive effects of the “Returning Farmland to Forest” policy have been weakened by anthropogenic disturbance during the study period. Meanwhile, to avoid the disaster of large floods, a large number of dams, reservoirs, and other water conservancy facilities have been built over the past few decades [37,65], causing in part the transfer of grassland and forest to water.
Five landscape indices (AREA_MN, FRAC_MN, SHDI, AI, CONTAG) were used to further quantify the landscape patterns and their changes due to human activities (Figure 4). The results indicated that there was little change in landscape fragmentation until 2015, after which there was a significant decrease. This indicated that the landscape fragmentation shows a trend of first increasing and then decreasing with urbanization [71]. This change may have been due to the development of agriculture and industries. The built-up area greatly increased and led to small patches of built-up land integrated into the large landscape patches (Figure 2). The result of the “Returning Farmland to Forest” policy allowed some sloping farmland to be converted to forest and grassland, making up larger areas of fragmented grassland and forest [8,16,30]. The increased built-up land area fragmented some of the intact natural landscape, resulting in landscape patches gradually becoming more complex and irregular in shape and weakening the connectivity between patches. Meanwhile, the increased land-use intensity resulted in a large amount of grassland, forest, and farmland being occupied and converted into artificial landscapes, which increased heterogeneity and evenness. This finding is generally consistent with previous studies [4,7,32].

4.2. Relationship between Landscape Patterns and Ecosystem Services

Quantification and mapping of ecosystem services based on integrating scenario analysis provide an efficient and powerful way to evaluate the relative importance and combined effects of factors on ecosystem services [2,27,72]. This study considered the distribution characteristics of the landscape and ecosystem services (Figure 2 and Figure 5) and used Spearman correlation analysis and global spatial correlation coefficient (Moran’s I) to further quantify the relationships between landscape indices and ecosystem services. The results showed significant differences in the impacts of landscape pattern changes on different ecosystem services.
In terms of spatial distribution, water retention capacity gradually decreased from south to north and was consistent with the rainfall characteristics of the Huaihe River Basin [73]. Regions of forest and grassland had high water retention, and the building of dams and reservoirs also increased the water retention capacity. The spatial distribution characteristics of water retention capacity showed that climate change had a greater impact on water retention than landscape type change in the study area [27,74,75]. Landscape type-changes play a large role in soil retention: forest and grassland also have a great soil retention capacity [67], and high soil retention capacity was distributed in the west and northeast of the study area, where there was high forest and grassland distribution. However, due to the decrease in forest and grassland area, total soil retention slightly declined. Carbon storage change was also consistent with the change in the natural landscape area, indicating that landscape change had a great impact on carbon storage. The regions with high biodiversity conservation scores were mainly concentrated in the western and central Huaihe River Basin, an area of forest, grassland, and water. However, the grassland loss led to a decline in the capacity of biodiversity conservation over the study period. The results showed that ecosystem services are sensitive to landscape composition change. The loss of grassland and farmland decreases the supply of ecosystem services for human society [15,76]. Moran’s I results further showed the impact of landscape spatial configuration on ecosystem services. The results indicated that reduced landscape fragmentation had a positive effect on water retention capacity and biodiversity conservation, reduced connectivity between patches had a negative effect, while reduced landscape fragmentation and irregular patch shapes had negative impacts on soil retention capacity and carbon storage. This finding is shared with previous studies [2,16,77].
In terms of time, the landscape spatial configuration impacts differed. The results showed that reduced landscape fragmentation and connectivity between patches, increased discreteness, and irregularity of patch shapes had negative impacts on water retention. Reduced landscape fragmentation and increased irregular patch shape negatively impacted carbon storage. Increased connectivity had a positive impact on biodiversity conservation, whereas reduced landscape fragmentation and increased patch shapes irregular had negative impacts. There were no significant correlations between soil retention and the landscape indices, showing that soil retention was not easily affected by landscape spatial configuration. This conclusion is different from previous studies; for example, Li et al. argued that irregular patch shape was positively correlated with ecosystem services [2]. Liu et al. demonstrated that enhanced discreteness was negatively related to provisioning and support services and positively related to regulatory and cultural services [12]. Their research was based on a small scale, whereas this study was based on a larger geographic area, illustrating the impact of scale on results.
Compared to spatial correlation, many temporal correlations between landscape patterns and ecosystem services were different, indicating little synergy between the spatial and temporal relationships between landscape patterns and ecosystem services.

5. Conclusions

This study used land-use data, meteorological data, and topographic data to quantify landscape change and ecosystem services and analyze the spatial and temporal relationship between landscapes and ecosystem services in the Huaihe River Basin from 1990 to 2018.
The results suggested that the ecosystem has changed greatly in the Huaihe River Basin from 1990 to 2018. Changes in the composition of the landscape are characterized by a decrease in farmland and grassland and an increase in built-up land and water. The capacity of water retention showed an increasing trend, while soil retention, carbon storage, and biodiversity conservation showed a decreasing trend. This shows that the positive effects of the “Returning Farmland to Forest” policy have been weakened by anthropogenic disturbance in the study area, while the construction of water facilities has promoted the area of water. Maintaining the areas of grassland, forest, and water plays an important role in providing ecosystem services. The capacity of water retention, soil retention, carbon storage, and biodiversity conservation can be improved by increasing the area of grassland and forest. At the same time, the improvment of ecosystem services needs to take into account the spatial and temporal differences in landscape configurations. Therefore, ecological managers and policymakers must consider the impact of landscape pattern changes comprehensively on ecosystem services, and control the disorderly expansion of built-up land to reduce the pressure on the land resources caused by population growth and economic development.
This paper quantified landscape patterns and ecosystem services and their spatiotemporal relationships. We cannot ignore some uncertainties that exist in this study: the InVEST models simplified the simulation of the process, the value of the InVEST results depended on the input data, and as a result, the relative value was not an absolute value, and there was a deviation from the true value. Landscape patterns will change according to spatial scale, and changing spatial scale also can affect the intensity of human disturbance. This may cause the results of our analysis of the relationship between landscapes and ecosystem services to differ from previous studies. Nevertheless, the findings of this study contribute to a better understanding of the impact of landscape change on ecosystem services at a large scale, and we believe this will encourage managers to enhance ecosystem services through landscape pattern planning.

Author Contributions

Conceptualization, Y.Z.; methodology, X.B.; formal analysis, H.W.; investigation, K.W.; data curation, M.Z., C.W. (Chuanying Wang), C.W. (Chen Wang), and Y.L.; writing—original draft, H.W.; writing—review and editing, Y.Z. and X.B.; funding acquisition, Y.Z. and X.B. All authors have read and agreed to the published version of the manuscript.

Funding

This work was sponsored by the Natural Science Foundation of Henan (grant number 212300410335).

Data Availability Statement

The land use data from 1990 to 2018 were downloaded from the Resource and Environmental Science Data Center of the Chinese Academy of Sciences (http://www.resdc.cn, accessed on 11 December 2021). The rainfall erosivity factor (R factor) was downloaded from the Climate Change Impact Assessment (CLICIA) Group at the Beijing Normal University (https://dx.doi.org/10.12275/bnu.clicia.rainfallerosivity.CN.001, accessed on 13 December 2021). The digital elevation model (DEM) data, temperature, and precipitation data, effective soil moisture data, soil texture data, soil erodibility data, etc., used in this study are not publicly available due to the constraint in the consent.

Conflicts of Interest

The authors declare no conflict of interest.

References

  1. Villamagna, A.M.; Angermeier, P.L.; Bennett, E.M. Capacity, pressure, demand, and flow: A conceptual framework for analyzing ecosystem service provision and delivery. Ecol. Complex. 2013, 15, 114–121. [Google Scholar] [CrossRef]
  2. Li, J.; Zhou, K.; Xie, B.; Xiao, J. Impact of landscape pattern change on water-related ecosystem services: Comprehensive analysis based on heterogeneity perspective. Ecol. Indic. 2021, 133, 108372. [Google Scholar] [CrossRef]
  3. Zhang, J.; Qu, M.; Wang, C.; Zhao, J.; Cao, Y. Quantifying landscape pattern and ecosystem service value changes: A case study at the county level in the Chinese Loess Plateau. Glob. Ecol. Conserv. 2020, 23, e01110. [Google Scholar] [CrossRef]
  4. Zhou, Y.; Ning, L.; Bai, X. Spatial and temporal changes of human disturbances and their effects on landscape patterns in the Jiangsu coastal zone, China. Ecol. Indic. 2018, 93, 111–122. [Google Scholar] [CrossRef]
  5. Johnson, B.G.; Zuleta, G.A. Land–use land–cover change and ecosystem loss in the Espinal ecoregion, Argentina. Agric. Ecosyst. Environ. 2013, 181, 31–40. [Google Scholar] [CrossRef]
  6. Zhang, Y.; Wang, T.; Cai, C.; Li, C.; Liu, Y.; Bao, Y.; Guan, W. Landscape pattern and transition under natural and anthropogenic disturbance in an arid region of northwestern China. Int. J. Appl. Earth Obs. 2016, 44, 1–10. [Google Scholar] [CrossRef]
  7. Wang, K.; Zhang, C.; Chen, H.; Yue, Y.; Zhang, W.; Zhang, M.; Qi, X.; Fu, Z. Karst landscapes of China: Patterns, ecosystem processes and services. Landsc. Ecol. 2019, 34, 2743–2763. [Google Scholar] [CrossRef] [Green Version]
  8. Hao, R.; Yu, D.; Liu, Y.; Liu, Y.; Qiao, J.; Wang, X.; Du, J. Impacts of changes in climate and landscape pattern on ecosystem services. Sci. Total Environ. 2017, 579, 718–728. [Google Scholar] [CrossRef]
  9. Fagerholm, N.; Käyhkö, N.; Ndumbaro, F.; Khamis, M. Community stakeholders’ knowledge in landscape assessments—mapping indicators for landscape services. Ecol. Indic. 2012, 18, 421–433. [Google Scholar] [CrossRef]
  10. Wang, Z.; Mao, D.; Li, L.; Jia, M.; Dong, Z.; Miao, Z.; Ren, C.; Song, C. Quantifying changes in multiple ecosystem services during 1992–2012 in the Sanjiang Plain of China. Sci. Total Environ. 2015, 514, 119–130. [Google Scholar] [CrossRef]
  11. Meng, W.; Xiao, S. Potential impact of land use change on ecosystem services in China. Environ. Monit. Assess. 2016, 188, 1–13. [Google Scholar]
  12. Liu, L.; Chen, X.; Chen, W.; Ye, X. Identifying the impact of landscape pattern on ecosystem services in the Middle Reaches of the Yangtze River Urban Agglomerations, China. Int. J. Environ. Res. Public Health 2020, 17, 5063. [Google Scholar] [CrossRef] [PubMed]
  13. Arowolo, A.O.; Deng, X.Z.; Olatunji, O.A.; Obayelu, A.E. Assessing changes in the value of ecosystem services in response to land-use/land-cover dynamics in Nigeria. Sci. Total Environ. 2018, 636, 597–609. [Google Scholar] [CrossRef] [PubMed]
  14. Mononen, L.; Auvinen, A.P.; Ahokumpu, A.L.; Rönkä, M.; Aarras, N.; Tolvanen, H.; Kamppinen, K.; Viirret, E.; Kumpula, T.; Vihervaara, P. National ecosystem service indicators: Measures of social–ecological sustainability. Ecol. Indic. 2014, 61, 27–37. [Google Scholar] [CrossRef]
  15. Li, J.; Zhou, Z. Coupled analysis on landscape pattern and hydrological processes in Yanhe watershed of China. Sci. Total Environ. 2015, 505, 927–938. [Google Scholar] [CrossRef] [PubMed]
  16. Chen, W.; Zeng, J.; Chu, Y.; Liang, J. Impacts of Landscape Patterns on Ecosystem Services Value: A Multiscale Buffer Gradient Analysis Approach. Remote Sens. 2021, 13, 2551. [Google Scholar] [CrossRef]
  17. Tolessa, T.; Senbeta, F.; Kidane, M. The impact of land use/land cover change on ecosystem services in the central highlands of Ethiopia. Ecosyst. Serv. 2017, 23, 47–54. [Google Scholar] [CrossRef]
  18. Costanza, R.; D’Arge, R.; de Groot, R.; Farber, S.; Grasso, M.; Hannon, B.; Limburg, K.; Naeem, S.; O’Neill, R.V.; Paruelo, J.; et al. The value of the world’s ecosystem services and natural capital. Nature 1997, 387, 253–260. [Google Scholar] [CrossRef]
  19. Turner, K.G.; Odgaarda, M.V.; Bøcher, P.K.; Dalgaard, T.; Svenning, J.C. Bundling ecosystem services in Denmark: Trade-offs and synergies in a cultural landscape. Landsc. Urban Plan. 2014, 125, 89–104. [Google Scholar] [CrossRef]
  20. Li, C.; Zhao, J. Investigating the Spatiotemporally Varying Correlation between Urban Spatial Patterns and Ecosystem Services: A Case Study of Nansihu Lake Basin, China. ISPRS Int. J. Geo-Inf. 2019, 8, 346. [Google Scholar] [CrossRef] [Green Version]
  21. Reid, W.V.; Mooney, H.A.; Cropper, A.; Capistrano, D.; Zurek, M.B. Millennium Ecosystem Assessment, Synthesis; World Resources Institute: Washington, DC, USA, 2005. [Google Scholar]
  22. Zalasiewicz, J.; Williams, M.; Steffen, W.; Crutzen, P. The new world of the anthropocene. Environ. Sci. Technol. 2010, 44, 2228–2231. [Google Scholar] [CrossRef] [PubMed]
  23. Geri, F.; Amici, V.; Rocchini, D. Human activity impact on the heterogeneity of Mediterranean landscape. Appl. Geogr. 2010, 30, 370–379. [Google Scholar] [CrossRef]
  24. Ning, J.; Liu, J.; Zhao, G. Spatio-temporal characteristics of disturbance of land use change on major ecosystem function zones in China. Chin. Geogr. Sci. 2015, 25, 523–536. [Google Scholar] [CrossRef]
  25. Yang, Y.; Zhang, H.; Zhao, X.; Chen, Z.; Wang, A.; Zhao, E.; Cao, H. Effects of Urbanization on Ecosystem Services in the Shandong Peninsula Urban Agglomeration, in China: The Case of Weifang City. Urban Sci. 2021, 5, 54. [Google Scholar] [CrossRef]
  26. Chen, W.; Chi, G.; Li, J. The spatial aspect of ecosystem services balance and its determinants. Land Use Policy 2020, 90, 104263. [Google Scholar] [CrossRef]
  27. Bai, Y.; Ochuodhoa, T.O.; Yang, J. Impact of land use and climate change on water-related ecosystem services in Kentucky, USA. Ecol. Indic. 2019, 102, 51–64. [Google Scholar] [CrossRef]
  28. Jones, K.B.; Zurlini, G.; Kienast, F.; Petrosillo, I.; Edwards, T.; Wade, T.G.; Li, B.L.; Zaccarelli, N. Informing landscape planning and design for sustaining ecosystem services from existing spatial patterns and knowledge. Landsc. Ecol. 2013, 28, 1175–1192. [Google Scholar] [CrossRef]
  29. Bai, Y.; Wang, M.; Li, H.; Huang, S.; Malatalo, J. Ecosystem service supply, and demand: Theory and management application. Acta Ecol. Sin. 2017, 37, 5846–5852. (In Chinese) [Google Scholar]
  30. Zhang, X.; Li, H.; Xia, H.; Tian, G.; Yin, Y.; Lei, Y.; Kim, G. The Ecosystem Services Value Change and Its Driving Forces Responding to Spatio-Temporal Process of Landscape Pattern in the Co-Urbanized Area. Land 2021, 10, 1043. [Google Scholar] [CrossRef]
  31. Bender, O.; Boehmer, H.J.; Jens, D.; Schumacher, K.P. Analysis of land-use change in a sector of upper Franconia (Bavaria, Germany) since 1850 using land register records. Landsc. Ecol. 2005, 20, 149–163. [Google Scholar] [CrossRef]
  32. Fan, Q.; Ding, S. Landscape pattern changes at a county scale: A case study in Fengqiu, Henan Province, China from 1990 to 2013. Catena 2016, 137, 152–160. [Google Scholar] [CrossRef]
  33. Wang, W.; Wu, T.; Li, Y.; Xie, S.; Han, B.; Zheng, H.; Ouyang, Z. Urbanization Impacts on Natural Habitat and ecosystem Services in the Guangdong Kong-Macao “Megacity”. Sustainability 2020, 12, 6675. [Google Scholar] [CrossRef]
  34. Jiao, Q.; Zhang, B.; Zhao, J.; Liu, L.; Hu, Y. Landscape pattern analysis of alpine steppe based on airborne hyperspectral imagery in Maduo county, Qinghai province. Acta Prataculturae Sin. 2012, 21, 43–50. [Google Scholar]
  35. Wiens, J.A. Landscape ecology as a foundation for sustainable conservation. Landsc. Ecol. 2009, 24, 1053–1065. [Google Scholar] [CrossRef]
  36. Wang, J.; Zhou, Y.; Bai, X.; Li, W. Effect of algal blooms outbreak and decline on phosphorus migration in Lake Taihu, China. Environ. Pollut. 2022, 296, 118761. [Google Scholar] [CrossRef]
  37. Wang, K.; Chu, D.; Yang, Z. Flood control and management for the transitional Huaihe River in China. Procedia Eng. 2016, 154, 703–709. [Google Scholar]
  38. Pan, Z.; Ruan, X.; Qian, M.; Hua, J.; Shan, N.; Xu, J. Spatio-temporal variability of streamflow in the Huaihe River basin, China: Climate variability or human activities. Hydrol. Res. 2018, 49, 177–193. [Google Scholar] [CrossRef] [Green Version]
  39. Tang, F.; Fu, M.; Wang, L.; Song, W.; Yu, J.; Wu, Y. Dynamic evolution and scenario simulation of habitat quality under the impact of land-use change in the Huaihe River Economic Belt, China. PLoS ONE 2021, 16, e0249566. [Google Scholar] [CrossRef]
  40. Cao, Y.; Xia, Y.; Mao, G. Research on regional development difference and collaborative development strategy of the Huaihe River Eco-economic Belt. Econ. Geogr. 2019, 39, 213–221. [Google Scholar]
  41. Gao, C.; Gemmer, M.; Zeng, X.; Liu, B.; Su, B.; Wen, Y. Projected streamflow in the Huaihe River Basin (2010–2100) using artificial neural network. Stoch. Environ. Res. Risk Assess. 2009, 24, 685–697. [Google Scholar] [CrossRef]
  42. Zhang, J.; Liu, G.; Wang, R.; Liu, J. Distribution and Source Apportionment of Polycyclic Aromatic Hydrocarbons in Bank Soils and River Sediments From the Middle Reaches of the Huaihe River, China. Clean-Soil Air Water 2015, 43, 1115–1266. [Google Scholar] [CrossRef]
  43. Yin, S.; Wu, C.; Wang, C.; Ma, W.; He, Y. Remote sensing assessment of ecological health of the riparian buffer along Huaihe River. China Environ. Sci. 2016, 36, 299–306. (In Chinese) [Google Scholar]
  44. Development Plan of the Huai River Economic Belt; National Development and Reform Commission: Beijing, China, 2018.
  45. Zhou, Y.; Ma, Z.; Wang, L. Chaotic dynamics of the flood series in the Huaihe River Basin for the last 500 years. J. Hydrol. 2002, 258, 100–110. [Google Scholar] [CrossRef]
  46. Zhang, Y.; You, W. Social vulnerability to floods: A case study of Huaihe River Basin. Nat. Hazards 2014, 71, 2113–2125. [Google Scholar] [CrossRef]
  47. Chen, J.; Ouyang, Z.; Zheng, H.; Xu, W. Ecosystem Characteristics and Regionalization of Vulnerable Ecological Region of Huaihe River Basin. China Popul. Resour. Environ. 2010, 20, 169–174. (In Chinese) [Google Scholar]
  48. Yang, M.; Chen, X.; Cheng, C. Hydrological impacts of precipitation extremes in the Huaihe River Basin, China. SpringerPlus 2016, 5, 1731. [Google Scholar] [CrossRef] [Green Version]
  49. Liu, J.; Kuang, W.; Zhang, Z.; Xu, X.; Qin, Y.; Ning, J.; Zhou, W.; Zhang, S.; Li, R.; Yan, C.; et al. Spatiotemporal characteristics, patterns, and causes of land-use changes in China since the late 1980s. J. Geogr. Sci. 2014, 24, 195–210. [Google Scholar] [CrossRef]
  50. Wang, H.; Qin, F.; Zhu, J.; Zhang, C. The effects of land use structure and landscape pattern change on ecosystem service values. Acta Ecol. Sin. 2017, 37, 1286–1296. (In Chinese) [Google Scholar]
  51. Lu, N.; Xiao, X. Analysis of Land Use in Jining City. E3S Web Conf. 2020, 198, 04024. [Google Scholar] [CrossRef]
  52. Yang, X.; Zheng, X.; Chen, R. A land-use change model: Integrating landscape pattern indexes and Markov-CA. Ecol. Model. 2014, 283, 1–7. [Google Scholar] [CrossRef]
  53. Kim, I.; Arnhold, S.; Ahn, S.; Le, Q.B.; Kim, S.J.; Park, S.J.; Koellner, T. Land use change and ecosystem services in mountainous watersheds: Predicting the consequences of environmental policies with cellular automata and hydrological modeling. Environ. Modell. Softw. 2019, 122, 103982. [Google Scholar] [CrossRef]
  54. Lian, X.; Qi, Y.; Wang, H.; Zhang, J.; Yang, R. Spatial pattern of ecosystem services under the influence of human activities in Qinghai Lake watershed. J. Glaciol. Geocryol. 2019, 41, 1254–1263. (In Chinese) [Google Scholar]
  55. Zhang, W.; Sun, X.; Zhou, J. Spatio-temporal dynamics of tradeoffs between crucial ecosystem services in Nansihu Lake Basin. Acta Ecol. Sin. 2021, 41, 8003–8015. (In Chinese) [Google Scholar]
  56. Bhaduri, B.; Harbor, J.; Engel, B.; Grove, M. Assessing watershed-scale, long term hydrologic impacts of land use change using a GIS-NPS model. Environ. Manag. 2000, 26, 643–658. [Google Scholar] [CrossRef] [PubMed]
  57. Bennett, E.M.; Peterson, G.D.; Gordon, L.J. Understanding relationships among multiple ecosystem services. Ecol. Lett. 2009, 12, 1–11. [Google Scholar] [CrossRef]
  58. Li, W.; Zhan, J.; Zhao, F.; Yan, H.; Zhang, F.; Wei, X. Impacts of urbanization-induced land-use changes on ecosystem services: A case study of the Pearl River Delta Metropolitan Region, China. Ecol. Indic. 2019, 98, 228–238. [Google Scholar] [CrossRef]
  59. Liu, S.; Sun, Y.; Wu, X.; Li, W.; Liu, Y.; Tran, L. Driving Factor Analysis of Ecosystem Service Balance for Watershed Management in the Lancang River Valley, Southwest China. Land 2021, 10, 522. [Google Scholar] [CrossRef]
  60. Xie, G.; Zhen, L.; Lu, C.; Xiao, Y.; Chen, C. Expert knowledge based valuation method of Ecosystem Services in China. J. Nat. Resour. 2008, 23, 911–919. (In Chinese) [Google Scholar]
  61. Paola, A.A.; Erik, G.B.; Berta, M.L.; Mario, P.R. Widening the Evaluative Space for Ecosystem Services: A Taxonomy of Plural Values and Valuation Methods. Environ. Value 2018, 27, 29–53. [Google Scholar]
  62. Tao, Y.; Wang, H.; Ou, W.; Guo, J. A land-cover-based approach to assessing ecosystem services supply and demand dynamics in the rapidly urbanizing Yangtze River Delta region. Land Use Policy 2018, 72, 250–258. [Google Scholar] [CrossRef]
  63. Wu, C.; Lin, Y.; Chiang, L.; Huang, T. Assessing highway’s impacts on landscape patterns and ecosystem services: A case study in Puli Township, Taiwan. Landsc. Urban Plan. 2014, 128, 60–71. [Google Scholar] [CrossRef]
  64. Lorencová, E.K.; Harmáčková, Z.V.; Landová, L.; Pártl, A.; Vačkář, D. Assessing impact of land use and climate change on regulating ecosystem services in the Czech Republic. Ecosyst. Health Sustain. 2016, 2, e01210. [Google Scholar]
  65. Hu, W.; Wang, G.; Wei, D.; Li, S. The influence of dams on ecohydrological conditions in the huaihe river basin, China. Ecol. Eng. 2008, 33, 233–241. [Google Scholar] [CrossRef]
  66. Bai, Y.; Zhuang, C.; Ouyang, Z.; Zheng, H.; Jiang, B. Spatial characteristics between biodiversity and ecosystem services in a human-dominated watershed. Ecol. Complex. 2011, 8, 177–183. [Google Scholar] [CrossRef]
  67. Sharp, R.; Chaplin-Kramer, R.; Wood, S.A.; Guerry, A.D.; Wood, S.A.; ChaplinKramer, R.; Nelson, E.; Ennaanay, E.; Wolny, S.; Olwero, N.; et al. InVEST + VERSION+ User’s Guide; The Natural Capital Project; Stanford University: Stanford, CA, USA; University of Minnesota: Minneapolis, MN, USA; The Nature Conservancy: Arlington County, VA, USA; WorldWildlife Fund: Gland, Switzerland, 2018. [Google Scholar]
  68. Intergovernmental Panel on Climate Change (IPCC). IPCC Guidelines for National Greenhouse Gas Inventories; Institute for Global Environmental Strategies: Kanagawa, Japan, 2006. [Google Scholar]
  69. Yi, L.; Yu, Z.; Qian, J.; Kobuliev, M.; Chen, C.; Xing, X. Evaluation of the heterogeneity in the intensity of human interference on urbanized coastal ecosystems: Shenzhen (China) as a case study. Ecol. Indic. 2021, 122, 107234. [Google Scholar] [CrossRef]
  70. Sanderson, E.W.; Jaiteh, M.; Levy, M.A.; Redford, K.H.; Wannebo, A.V.; Woolmer, G. The Human Footprint and the Last of the Wild. BioScience 2002, 52, 891–904. [Google Scholar] [CrossRef]
  71. Qiu, J.X.; Wang, X.K.; Lu, F.; Ouyang, Z.Y.; Zheng, H. The spatial pattern of landscape fragmentation and its relations with urbanization and socio-economic developments: A case study of Beijing. Acta Ecol. Sin. 2012, 32, 2659–2669. (In Chinese) [Google Scholar]
  72. Li, F.; Peng, D.; Wang, B. Application of Research on Ecosystem Services in Landscape Planning. Landsc. Archit. Front. 2019, 7, 56–69. [Google Scholar] [CrossRef]
  73. Wang, H.; Pan, Y.; Chen, Z. Spatial and Temporal Patterns of Temperature and Precipitation Extremes in the Huaihe River Basin, China in 1960–2014. Sci. Geogr. Sin. 2017, 37, 1900–1908. (In Chinese) [Google Scholar]
  74. Hoyer, R.; Chang, H.J. Assessment of freshwater ecosystem services in the Tualatin and Yamhill basins under climate change and urbanization. Appl. Geogr. 2014, 53, 402–416. [Google Scholar] [CrossRef]
  75. Castillo, C.R.; Güneralp, İ.; Güneralp, B. Influence of changes in developed land and precipitation on hydrology of a coastal Texas watershed. Appl. Geogr. 2014, 47, 154–167. [Google Scholar] [CrossRef]
  76. Schirpke, U.; Kohler, M.; Leitinger, G.; Fontana, V.; Tasser, E.; Tappeiner, U. Future impacts of changing land use and climate on ecosystem services of mountain grassland and their resilience. Ecosyst. Serv. 2017, 26, 79–94. [Google Scholar] [CrossRef] [PubMed]
  77. Wu, J. Landscape Ecology: Pattern, Process, Scale and Hierarchy; Higher Education Press: Beijing, China, 2002; pp. 26–27. [Google Scholar]
Figure 1. Location of the Huaihe River Basin.
Land 11 00513 g001
Figure 2. Spatial distribution of landscape types in Huaihe River Basin from 1990 to 2018.
Land 11 00513 g002aLand 11 00513 g002b
Figure 3. Landscape composition of the Huaihe River Basin during 1990–2018.
Land 11 00513 g003
Figure 4. Changes to landscape indices in the Huaihe River Basin from 1990–2018.
Land 11 00513 g004
Figure 5. Spatial distribution of ecosystem services in the Huaihe River Basin from 1990–2018.
Land 11 00513 g005aLand 11 00513 g005b
Figure 6. The capacity of ecosystem services in the Huaihe River Basin from 1990–2018.
Land 11 00513 g006
Figure 7. Global spatial correlation coefficient (Moran’s I) values between landscape indices and ecosystem services.
Land 11 00513 g007
Table 1. Change rates for different landscape compositions in the Huaihe River Basin in different periods (%).
1990–19951995–20002000–20052005–20102010–20152015–2018
Farmland−0.68−0.71231−0.07−0.71−0.74−2.39
Forest6.82−5.33−0.010.15−0.26−1.83
Grassland−5.15−0.71−0.19−0.20−0.27−22.44
Water2.452.743.170.540.5617.11
Built-up land2.832.144.383.573.7615.68
Unused land−28.76−52.8692.55−0.501.15−68.61
Table 2. Landscape transfer matrix of the Huaihe River Basin from 1990–2018 (km2).
2018FarmlandForestGrasslandWaterBuilt-Up LandUnused LandTransfer-Out Summation
1990
Farmland190,87555433643591933,51917048,794
Forest530714,8642433374900239038
Grassland67632760557860011545211,329
Water40953162606827942725685
Built-up land19,844368385183982862422,460
Unused land536182113682233741745
Transfer-in summation36,54691686833941436,747341
Table 3. Spearman correlations between landscape indices and ecosystem services in the Huaihe River Basin from 1990–2018.
AREA_MNFRAC_MNSHDIAICONTAG
water retention−0.818 *−0.899 **−0.7210.765 *0.648
soil retention−0.2590.1680.21−0.810.002
carbon storage−0.976 **−0.978 **−0.7350.6710.627
biodiversity conservation−0.89 **−0.984 **−0.869 *0.833 *0.794 *
Note: “**” indicates significant correlation at the 0.01 level (two tails); “*” indicates significant correlation at the 0.05 level (two tails).
Publisher’s Note: MDPI stays neutral with regard to jurisdictional claims in published maps and institutional affiliations.

