Article

Evaluating Impact of Farmland Recessive Morphology Transition on High-Quality Agricultural Development in China

1
College of Public Administration, Huazhong University of Science and Technology, Wuhan 430074, China
2
College of Public Administration, Central China Normal University, Wuhan 430079, China
3
Land Use Planning Review Center, China Land Surveying and Planning Institute, Beijing 100035, China
*
Author to whom correspondence should be addressed.
Land 2022, 11(3), 435; https://doi.org/10.3390/land11030435
Submission received: 15 February 2022 / Revised: 13 March 2022 / Accepted: 16 March 2022 / Published: 17 March 2022

Abstract

:
Recessive morphology transition (RMT) involves the smooth transition of farmland property rights, input structure, quality, and function. China’s agriculture has changed from a period of high-speed growth to a period of high-quality development. Compared with dominant morphology transition (DMT) characterized by quantitative focus, it is of more practical significance to explore the impact of RMT on high-quality agricultural development (HAD). This paper firstly constructed a multidimensional index system to quantify HAD. Based on analysis of the impact mechanism of RMT on HAD, a spatial econometric model was established to explore the impact by making use of the panel data of 27 provinces in China from 2003–2017. The results indicated that RMT and HAD both have positive geospatial correlation. Furthermore, the spatial econometric model provides more accurate results of the impact of RMT on HAD than panel models. If the RMT in a local province increases by 1%, HAD could be augmented by 0.13%. Likewise, RMT has a strong positive spatial spillover effect on HAD. If the RMT in a certain province increases by 1%, HAD could add 1.22% in neighboring provinces. The analysis suggests that spatial coordination of farmland use is an important foundation for constructing high-quality development association of regional agriculture. It is necessary to strengthen intergovernmental cooperation in the process of farmland recessive morphology transition and high-quality agricultural development.

1. Introduction

In essence, farmland use transition (FUT) could be defined as the process of farmland use from one morphology to others via economic and social development over a certain period [1,2]. It is further expanded into two morphological processes: dominant morphology transition (DMT) and recessive morphology transition (RMT) [3]. DMT and RMT are closely related but have their own emphases. DMT emphasizes the change of quantity and spatial patterns. Previous studies mainly focused on measurement and effect analysis of DMT. For instance, Popp [4] used global land cover change data from remote sensing image to explore the impact of land use transition on bioenergy and climate stabilization. Skog et al. [5] established an analytical framework to explore the impact of urbanization processes on farmland conversions in Norway. Ge et al. [6] used per capita cultivated land areas to quantify DMT and uncovered the inner link between FUT and grain production transition in China. With the enrichment and improvement of research frameworks of FUT, Long [7] and Song [8] proposed that FUT has spatial and non-spatial forms, and the research on FUT has gradually expanded from DMT to RMT. RMT is a multidimensional concept, and it refers to the quality attributes of farmland, including property rights, input structure, quality, function, etc. [9,10]. Compared with DMT, recessive morphology and its transition could better reflect the deep-seated problems of regional land use and cover change [11]. Therefore, RMT is the major research object of this paper. Some researchers have comprehensively measured RMT. Tang [12] defined recessive morphology transition as the evolution of farmland function and subdivided it into production function, life function, and ecological function. Ma et al. [13] evaluated recessive morphology transition by using the social transition index, economic transition index, and ecological transition index.
FUT is an important factor in changing the distribution pattern of agricultural development factors and influencing the state of agricultural development [1]. In order to adapt to the situation and requirements of agricultural development, a country or region should adjust land resource management policies and measures according to current land use patterns and existing problems. Because the Chinese government has protected farmland in terms of DMT by setting red lines for farmland protection and delimiting basic farmland, the revealing and depicting of RMT plays an important role in the innovation practice of land resource management [10,14]. Therefore, RMT has a more qualitative and significant impact on agricultural development. Current studies of agricultural development could be divided into three groups: agricultural quantity growth, agricultural quality growth, and high-quality agricultural development. Scholars have mainly focused on agricultural quantity growth and agricultural quality growth among these. Agricultural quantity growth is described development problem by quantitative indices such as agricultural product output or farmers’ income [15,16]. Based on these, some scholars also explored the impacts of RMT on agricultural quantity growth [17,18,19]. The history of recent world development has shown that high-quantity growth does not lead to a better social outcome; quality growth becomes an essential ingredient of any successful growth strategy [20]. Regarding the representation of agricultural quality growth, endogenous growth theory proposed that total factor productivity (TFP) is the power source of economic growth [21]. Thereby, scholars used agricultural total factor productivity (ATFP) to measure agricultural quality growth [22,23] and analyze the impact of RMT on ATFP [24,25,26].
Regarding studies of high-quality agricultural development, current studies remain in the period of theoretical analysis. Although the social systems and basic national conditions of each country are different, scholars still share many useful ideas of high-quality agricultural development. Martinez and Mlachila [27] proposed that high-quality development should coordinate the relationship between high growth levels and accelerating employment creation and poverty reduction. Bender [28] stressed that in the process of high-quality agricultural development, governments and policymakers should be encouraged to focus on the protection of biodiversity and ecological protection. Bartkowiak [29] argued that promoting innovation of agricultural production technology and realizing the conversion of agricultural development as a driving force are effective methods for high-quality agricultural development. Zulfiqar [30] considered crop diversification and the rationality of biochemical technology to evaluate high-quality agricultural development. These studies provided reference for us to clearly understand the basic impact mechanism of RMT on agricultural high-quality development. However, constructing a multidimensional index system to quantify HAD and the inner link between RMT and HAD has not been thoroughly studied.
Furthermore, Lesage [31] emphasized that while a regional explanatory variable potentially affects local dependent variables (called direct effect), it also potentially affects neighboring regions (called spillover effect). This means that localities cannot be treated as spatially independent observations and that spatial interactions should also be taken into consideration [32]. Scholars constructed spatial econometric model to explore direct effects and indirect effects on urban economic growth [33], public health [34], air pollution [35], and transport infrastructure [36]. In the research field of land use and agricultural development, Kumar [37] investigated the impacts of climate change on Indian agriculture and he also explored the spatial correlation of climate with agricultural production. With the help of the Moran index and spatial econometric model, Lu [38] found that farmland transition has a significant spatial spillover effect on agricultural economic growth, and the agricultural growth in a certain region can also promote agricultural growth in neighboring regions.
Above all, current studies have extensive research achievements in FUT theoretical framework and also pay attention to analyzing the impact of RMT on agricultural quantity growth and agricultural quality growth. However, the current studies have the following deficiencies. Firstly, although China’s economic development has stepped from a period of high-speed growth to a period of high-quality development, the definition and measurement of high-quality agricultural development have not been thoroughly studied. RMT reflects the “quality” transition of farmland use, which is consistent with the goal of high-quality agricultural development. Therefore, it is of great practical significance to analyze the impact of RMT on HAD and inform public policies designed for meeting the goals of HAD from the perspective of RMT in China and other countries. Moreover, the process of China’s high-quality agricultural development also shows characteristics of agricultural transformation from decentralized self-sufficient economic distribution to relatively concentrated market economic distribution. Therefore, spatial correlation of agricultural development in different regions is significantly enhanced and spatial correlation among regions should not be ignored in analysis of high-quality agricultural development. We intend to address two questions: 1. What is the concrete meaning of high-quality agricultural development and how can a scientific multidimensional index system be established to quantify it? 2. What is the impact mechanism of RMT on HAD and how can the impact be evaluated?
In order to solve the two problems above, this paper firstly constructed a multidimensional index system to quantify HAD. Based on analysis of the impact mechanism of RMT on HAD, a spatial econometric model was established to explore the impact by making use of the panel data of 27 provinces in China from 2003–2017. The remainder of this paper is as follows. Section 2 describes the definition of high-quality agricultural development and analyzes the impact mechanism of RMT on it. Section 3 depicts the research methods and data. Section 4 provides detailed discussion of the research results. Section 5 presents research conclusions and policy implications.

2. Theoretical Analysis Framework

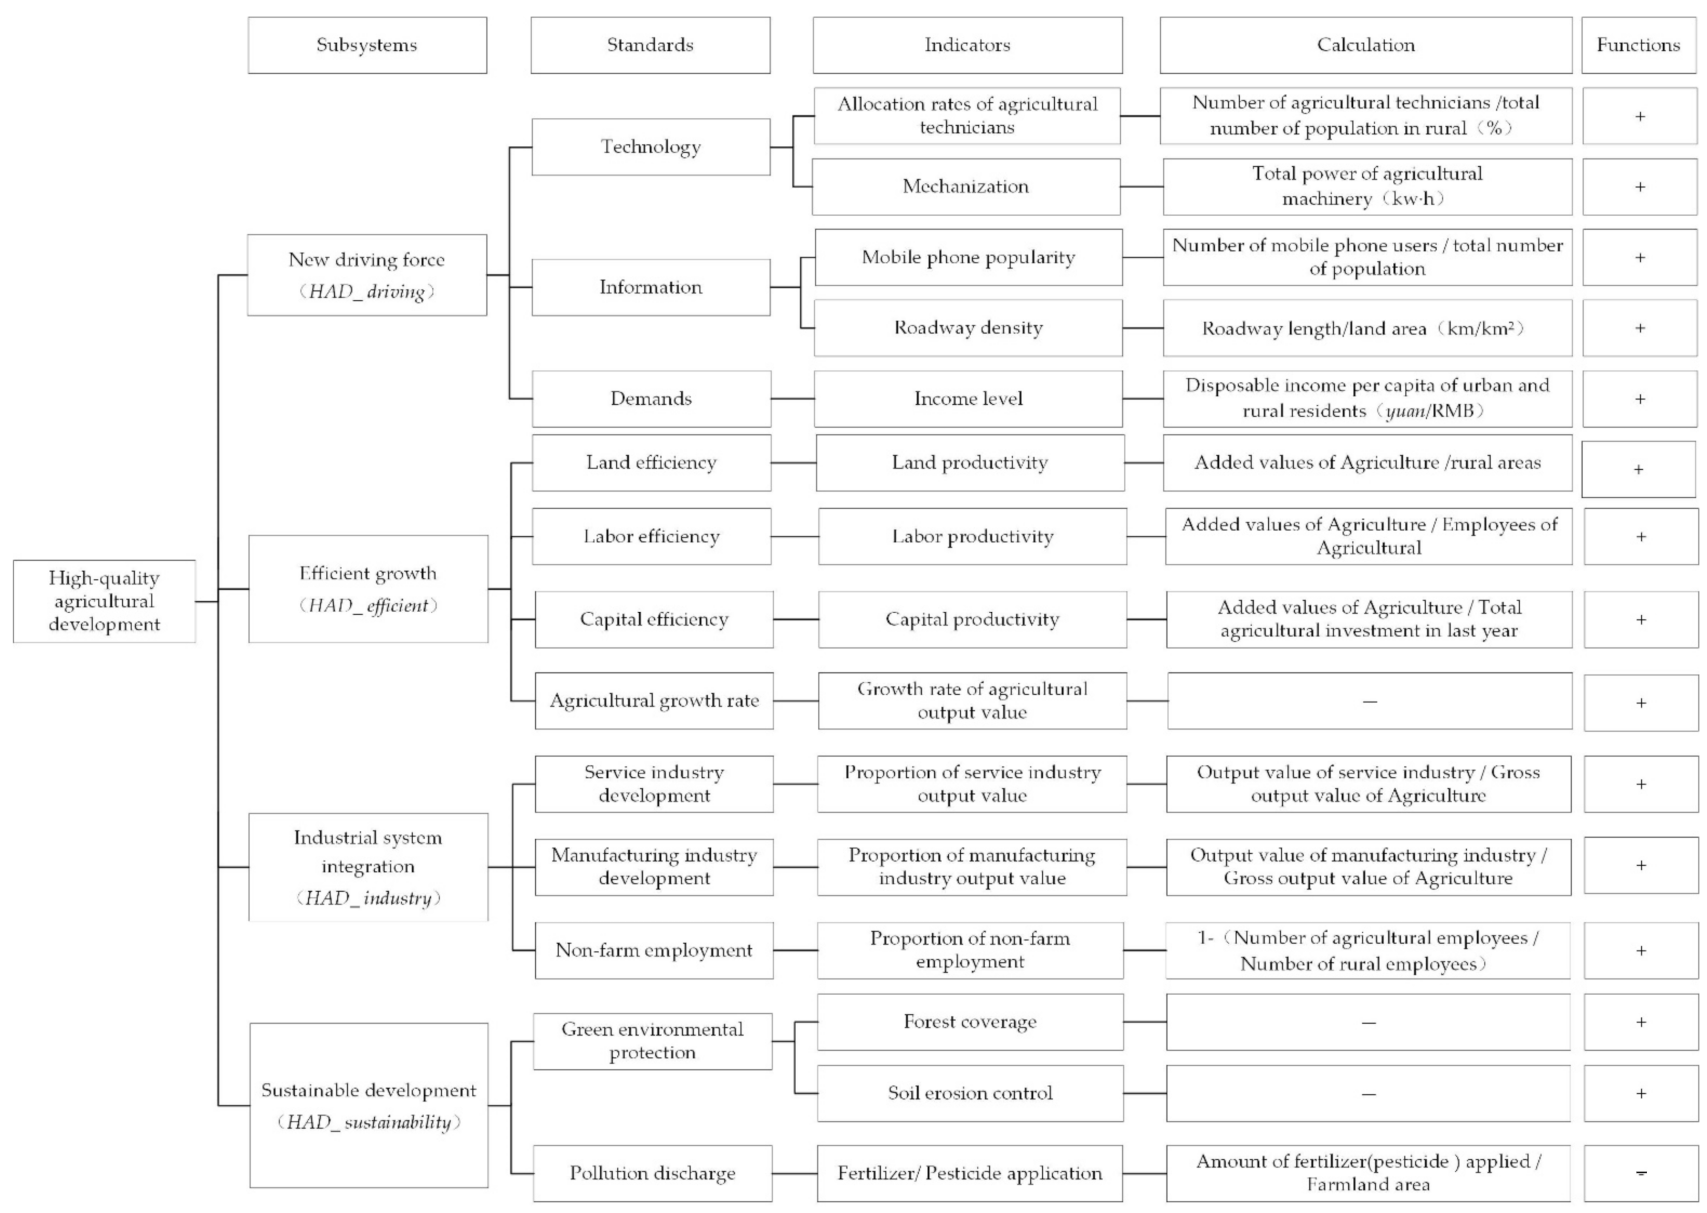
2.1. Definition of High-Quality Agricultural Development

China’s agriculture is in a period of transformation, development, and slow growth, and the agricultural development relies more on the quality and efficiency of agricultural growth than the quantity and speed [39]. Compared with agricultural quantity growth, agricultural quality growth and high-quality agricultural development both reveal the agricultural development effect from the perspective of quality, and they are seen as high-quality, durable, and socially friendly development [20]. Firstly, it is necessary for us to distinguish between agricultural quality growth and high-quality agricultural development. Agricultural quality growth reveals the quality of agricultural progress from the perspective of “growth”, while high-quality agricultural development focuses on reflecting the quality of agricultural progress from the perspective of “advancement”. This highlights new concepts and new requirements of China’s high-quality agricultural development in the new era [40]. HAD could be defined as the state, development mode, and structure of agriculture that can better meet the growing demands of residents in new era [41]. Combined with previous studies, we proposed that high-quality agricultural development could be divided into four aspects: new driving force, efficient growth, industrial system integration, and sustainable development.
(1) The new driving force of agricultural development is the strong support of high-quality agricultural development. R&D and application of agricultural machinery technology promote the development of an agricultural mechanization service market and break the traditional mode of agricultural production dominated by labor investment. Thus, agricultural machinery technology has become an important scientific and technological driving force to promote HAD. Meanwhile, agricultural technicians are the most critical and active subject in the agricultural technology extension system. They also play an important role in improving the efficiency of agricultural technology transformation in China. The driving force of agricultural informatization is an important driving factor for the progress and spread of agricultural technology, which promotes the transformation of agricultural production mode and the improvement of agricultural total factor production efficiency [42]. Since mobile communication technology has entered into the 3G and 4G eras, mobile phones have become the main carriers of modern information technology applications. The development of mobile application clients as agricultural information sharing, agricultural technology training, and agricultural product trading tools has promoted scientific production, visualized governance, intelligent living, and convenient consumption in rural areas. Market demand momentum provides a “power source” for agricultural development [43]. Additionally, HAD not only needs to meet the demands of urban and rural residents for “good food”, but also needs to meet the demands of “healthy, diversified, and personalized food” with the continuous increase of the income level of urban and rural residents. Hence, demand driving force is also an important part of agricultural development new driving force.
(2) High-efficiency agricultural growth is the major feature and embodiment of HAD. At present, China’s agricultural production efficiency is lower than other countries’ due to government policy distortions, limited input growth of capital, labor, and land investment since 2008 [44]. Therefore, it is necessary to promote the transformation from a traditional “extensive” agricultural growth mode to an “intensive” agricultural growth mode.
(3) Industrial system integration is the structural framework of high-quality agricultural development. Based on the diversified and advanced consumption structure of urban and rural residents, China’s high-quality agricultural development needs to break the low-end lock of its agricultural industrial structure. Additionally, it is vital to enhance the comprehensive competitiveness of China’s agricultural products in the international market by promoting the “ultimate manufacturing characteristic” and “service characteristic” of agricultural industry.
(4) Sustainable agricultural development is a necessary condition to ensure high-quality agricultural development. Chemical fertilizer, pesticide, and other production factors are the traditional driving forces to achieve high agricultural yield and increase production [45]. However, disorderly use of chemical fertilizer and pesticide has led to the decline of the quality of agricultural products, agricultural non-point source pollution, and other problems. Agricultural sustainability advocates green development and low carbon development modes. Meanwhile, sustainable development of agriculture also has the connotation of strengthening the coordination between agricultural production systems and the natural ecosystem, and constructing a new pattern of harmonious development between humans and nature.

2.2. Impact Mechanism Analysis of RMT on HAD

RMT mainly refers to the transition of farmland property rights, farmland use input structure, farmland quality and farmland function, etc. [10,14]. According to the theory and methods of spatial econometrics, the influence of explanatory variables on the explained variables of local units is called direct effects, and the effects of explanatory variables on the explained variables of surrounding units can be called spatial spillover effects [31]. Based on these, the theoretical analysis framework of RMT’s impact on HAD was established.

2.2.1. Direct Effects of RMT on HAD

The change of farmland property rights and transition of farmland input structure are RMT’s primary reflections. The core direction of the farmland property rights change is to clarify farmland property rights so that farmers can obtain sufficient rights. More stable farmland property rights could reduce the risk of farmland infringement and promote rural labor migrations. This has created better conditions for transferring land elements to more efficient agricultural management subjects [46]. Consequently, the change of farmland property rights could increase agricultural economic benefit and realize high-efficiency agricultural growth. Likewise, rural labor migrations and agricultural land transfer smash the traditional rural life pattern and improve market awareness of new types of agricultural management subjects. This is conducive to the improvement of the service system of agriculture production and promotes the diversified integration of agricultural industrial structure system [47,48]. On the basis of rural labor migrations greatly improving the income level of farmers, stable farmland property rights ensure the availability of farmers’ loans and broaden the options for farmers to utilize this new driving force [49,50]. Additionally, faced with the environmental problems caused by widespread use of chemical fertilizers and pesticides, the government makes policies to promote individuals and regions to change their farmland input structure and adopt more environmentally friendly farming methods.
Farmland quality has the characteristics of inheriting the soil quality of natural environments and transforming according to human demands, and farmland quality can be divided into natural quality, utilization quality, and economic quality [51]. In the process of RMT, farmers have protected farmland by using agricultural machinery or new fertilization technology. Under the strategy of “storing food in the land”, the Chinese government has constructed high-standard basic farmland through various investment channels such as farmland water conservancy construction, land remediation, as well as comprehensive agricultural development. These measures have achieved the result of improving farmland quality. Moreover, these measures also adapt to the needs of modern agricultural production and are conducive to agricultural efficient growth and sustainable development. From the perspective of supply, it can be understood that agricultural management subjects expand and upgrade functions by changing their way of using farmland or diversifying management activities so as to meet the diversified demands of consumers [8]. For instance, complying with the consumption demands of urban and rural residents for “healthy, diversified, and personalized food”, agricultural management subjects expand farmland function by building a nonpolluting base of grain production.
This paper puts forward:
Hypothesis 1 (H1).
RMT has a significant impact on HAD.

2.2.2. Spatial Spillover Effects of RMT on HAD

More importantly, the farmland use process and agricultural economic growth both have spatial correlation. On one hand, due to natural factors such as precipitation, wind, and the spatial proximity of farmland, farmers’ fertilization, irrigation, and production activities in their farmland space can not only affect their own farmland, but also affect the surrounding plots. On the other hand, with the improvement of China’s rural infrastructure, the reorganization and flow of production factors in urban and rural areas has been boosted. The construction of regional road infrastructure has created convenient conditions for large-scale cross-regional agricultural machinery services, and significantly improved farmland use efficiency [12]. The construction of rural telecommunications infrastructure promotes the flow of information and knowledge spillover between urban and rural areas, and farmers can quickly obtain market information and use modern agricultural knowledge for agricultural production. Therefore, under the influence of infrastructure construction, the impact of RMT on HAD can have significant spatial spillover effects.
Hence, this paper puts forward:
Hypothesis 2 (H2).
RMT has a significant spatial spillover effect on HAD.

3. Research Data and Methods

3.1. Data and Variables

This study selected 27 provinces of China as the study area (due to the relatively low proportion of agricultural industries in Beijing, Shanghai, Tianjinm and small farmland resources in Tibet, these four provinces were excluded from our study. The data of Taiwan, Hong Kong, and Macao are not available, so they are also not in the scope of study). Meanwhile, the farmland area data in the China Rural Statistical Yearbook is only updated to 2017, so the end year of our study is 2017. The sample used in this paper is the balanced panel data from 2003 to 2017. The majority of the data were extracted from the China Statistical Yearbook (2003–2017), China Rural Statistical Yearbook (2003–2017) and China Agricultural Products Processing Industries Yearbook (2003–2017).

3.1.1. Key Explanatory Variable

Recessive Morphology Transition (RMT): Combined with the attributes of RMT, we represented RMT with a multiple cropping index (MCI). The reasons are as follows: firstly, the change of China’s farmland property rights system endows farmers with more perfect farmland disposal rights and allocation rights of agricultural production factors, which could improve farmers’ enthusiasm for agricultural production and encourage farmers to diversify their planting structure. Meanwhile, the change of farmland property rights also provides favorable conditions for rural labor migration. Rural labor migration increases farmers’ income and provides financial support for the transition of farmland input structure [52]. As a result, the period of agricultural production is shortened significantly and farmland trends toward intensive use. The improvement of MCI is one of the most direct embodiments of intensive farmland use [53]. The transition of MCI is consistent with the transition of farmland quality and function [54,55]. On one hand, with the goal of sustainable agricultural development in recent years, China’s government implemented a policy of farmland rotation and fallow so as to improve farmland quality and production, which also leads to the MCI’s transition. On the other hand, since the acceleration of urbanization and industrialization leads to the scarcity of farmland, the demands of growing population force farmers to expand the function of farmland production by improving MCI [56]. Hence, a multiple cropping index could comprehensively reflect the attributes of RMT. The calculation method of MCI is as follows: planting area of crops/farmland area.

3.1.2. Explained Variable

High-quality agricultural development (HAD): This paper constructs a measurement system of HAD by complying with the definition of HAD on Section 2.1 and combining with the hierarchical measurement index and available data (Figure 1).

3.1.3. Control Variables

  • Industrialization ratio and urbanization ratio (industrialization and urbanization). The development of industrialization and urbanization could optimize the regional industrial structure and improve the per capita income level of residents, which may directly affect high-quality agricultural development. Added value of the industrial sector and proportion of urban population are used to measure industrialization and urbanization, respectively.
  • Economic development level (economic). The region of high-level economic development always has a more perfect agricultural service system, which could lead to the rational allocation of agricultural production factors and has an impact on high-quality agricultural development.
  • Government intervention (gov). This is represented by the ratio of local government’s public financial expenditure to GDP [9]. Economic performance competition is an important reason to encourage local governments to intervene in economic development in China; local government’s policy of farmland transfer and large-scale management may affect high-quality agricultural development.

3.2. Methods

3.2.1. Projection Pursuit Model

The projection pursuit model (PPM) is used to measure high-quality agricultural development. The core of PPM is to project high-dimensional data onto low-dimensional subspace, and then describe high-dimensional data through low-dimensional projection space analysis. In the process of data analysis, PPM automatically calculates the influence degree (i.e., weight) of each index on the comprehensive evaluation result, which reduces the influence of subjective determination of index weight [57]. The basic steps of PPM include: standardization of original index, construction of projection index function and projection objective function, determination of the best projection direction, and projection value. The calculation formula of the best projection direction vector is as follows:
m a x Q a = S z × D z a j = 1
In Equation (1), Q(a) represents projection objective function; S z = z i E z 2 n 1 1 2 represents inner-distance; Ez represents an average value of projection and eigenvalue zi; D z = i = 1 n j = 1 p R r i , j   ×   u R r i , j represents local density; R represents density window width, R = n, r i , j   =   z i z k ; u represents unit out of order function. a represents the n- dimensional unit projection direction vector. Meanwhile, the projection pursuit model can obtain the evaluation results of each subsystem by adding the product of the best projection direction vector and the standardized value of the corresponding evaluation index.

3.2.2. Panel Data Model

We construct the following panel model of high-quality agricultural development:
Yit = α0 + α1RMTit + α2Xit + εit
In Equation (2), Yit denotes the level of high-quality agricultural development and its four subsystems; RMTit denotes recessive morphology transition; Xit denotes the control variables; εit denotes random error term; i represents region; t represents time; α0 denotes constant; α1 and α2 denote coefficients of key explanatory variables and control variables, respectively.

3.2.3. Spatial Econometric Model

Undoubtedly, the similarity of climate and geography in a certain region have significantly enhanced the spatial interaction of farmland use and agricultural development. Meanwhile, the improvement of transportation and information infrastructure makes it more convenient for agricultural economic activities to be transferred to other regions [58]. Transportation infrastructure widens the service scope of agricultural mechanization and improves agricultural mechanization rate [59]. The development of communication technology promotes technology diffusion and information and knowledge spillover by improving the market docking ability of farmers and stimulating Internet consumption. Moreover, under the pressure of performance competition, one region formulates efficient agricultural development policies and achieved agricultural economic performance, which may induce other regions to imitate. Thereby, RMT and HAD may have a significant spatial correlation. We construct Spatial Econometric Model to modify Equation (2). The Spatial Econometric Model is as follows:
Y i t = β 1 R M T i t + β 2 X i t + ρ j = 1 n w i j Y i t + β 3 j = 1 n w i j R M T i t + β 4 j = 1 n w i j X i t + λ w i j μ + ε i
In Equation (3), the definitions of Yit, RMTit, Xit, t, and εit are consistent with Equation (2); β1 and β2 denote coefficients of explanatory variables and control variables, respectively; β3 and β4 denote spatial coefficients of explanatory variables and control variables, respectively; ρ represents spatial autoregressive coefficients of explained variables; wij denotes spatial weight matrix; λ denotes spatial error regression coefficient; i represents local regions; j represents neighboring regions. The spatial econometric model could be divided into a spatial lag model (SLM), spatial error model (SEM), and spatial Durbin model (SDM). In Equation (3), when ρ ≠ 0 but β = 0, Equation (3) extends to SLM; when λ ≠ 0 but ρ = 0, Equation (3) extends to SEM; when ρ ≠ 0 and β ≠ 0 but λ = 0, Equation (3) extends to SDM.
Spatial weight matrix wij can accurately measure the spatial correlation between regions. At present, the common spatial weight matrix includes adjacent matrix, geographic distance matrix and economic distance matrix. The adjacency matrix represents the spatial correlation of different regions by the adjacency of administrative boundaries. However, the adjacency matrix ignores the spatial correlation of geographically close but not connected regions. The geographic distance matrix and economic distance matrix reflect the correlation between regions in terms of geographical space and economic behavior mode, respectively, but spatial correlation between regions comes from the dual influence of geographical space and economic behavior. Based on the gravity model, we construct the comprehensive weight matrix of geographical space and economic connection [60]:
w i j = G i × G j / d 2 i j , i j 0 , i = j
In Equation (4), Gi and Gj denote GDP per capita of the two regions; dij represents the distance of gravity points between two regions.

4. Results and Discussions

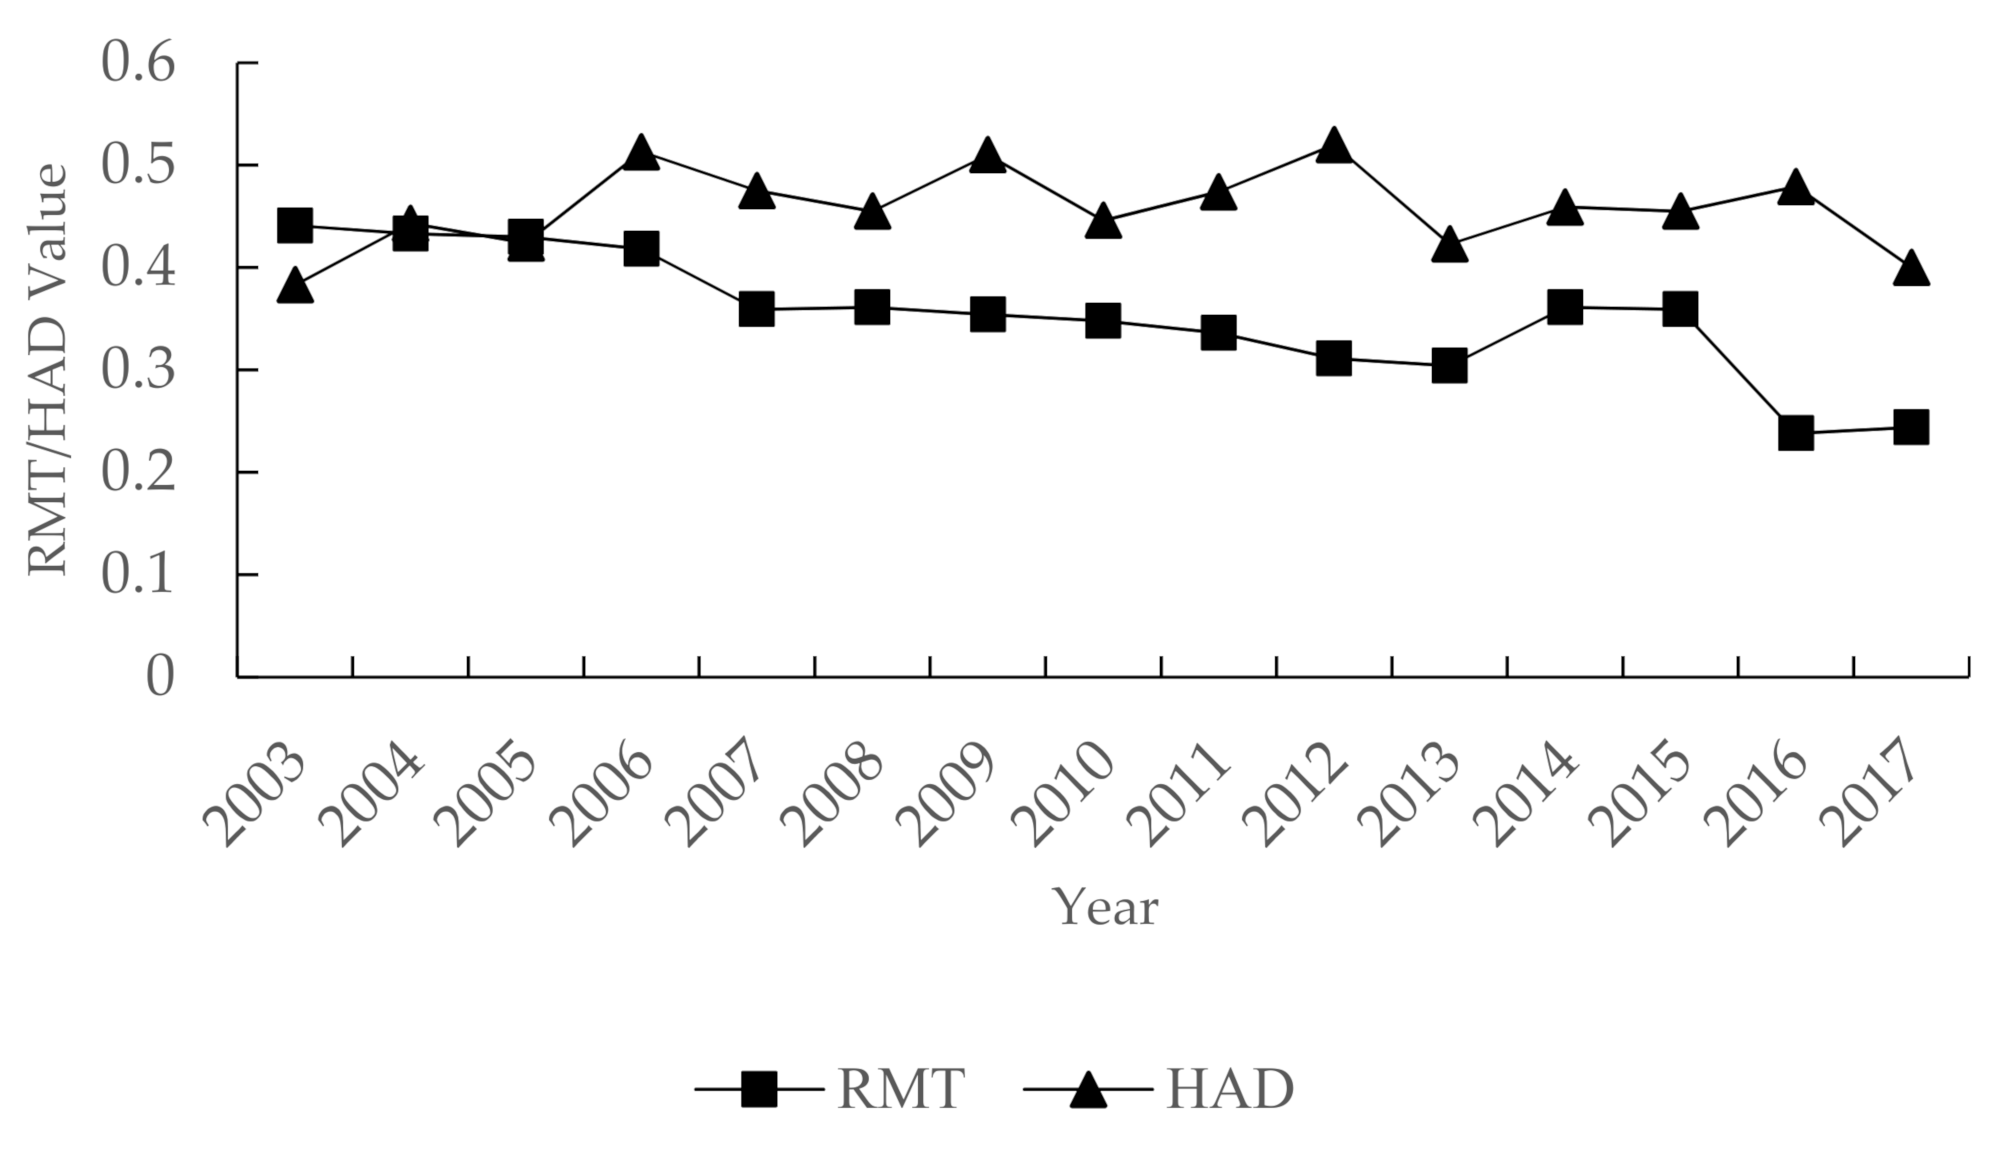
4.1. Temporal Evolution and Spatial Pattern of RMT

The results of RMT in 2003 and 2017 are shown in Figure 2. Regarding temporal evolution, RMT increased from 1.19 in 2003 to 1.24 in 2017. Average annual growth was 0.28%. Specifically, there were 18 provinces with increased RMT, accounting for 62.06% of the total. The top five provinces with the highest annual growth rate are Sichuan (2.61%), Inner Mongolia (2.57%), Qinghai (2.55%), Guizhou (2.10%), and Shaanxi (1.94%). These provinces are mainly clustered in Western China, where the agricultural production conditions are not superior and the economy is relatively backward. This indicated that the Western Development policy has improved the agricultural production environment, and the RMT has also increased rapidly. However, the top three provinces with the highest annual reduction rate are Fujian (−2.27%), Zhejiang (−1.70%), and Hainan (−1.17%).
We mainly analyze the spatial pattern in 2017. The province with the lowest RMT is Gansu (0.70), while the highest is Hunan (2.00), and the latter is 2.86 times higher than the former. Besides Hunan, the next top five provinces are Jiangxi (1.83), Henan (1.82), Guangdong (1.63), Hubei (1.52), and Anhui (1.49). These provinces are mainly located in Central and South China. However, besides Gansu, the provinces with relatively low RMT are mainly located in Western and Northeast China, including Liaoning (0.84), Jilin (0.87), Ningxia (0.88), Shanxi (0.88), and Qinghai (0.94).

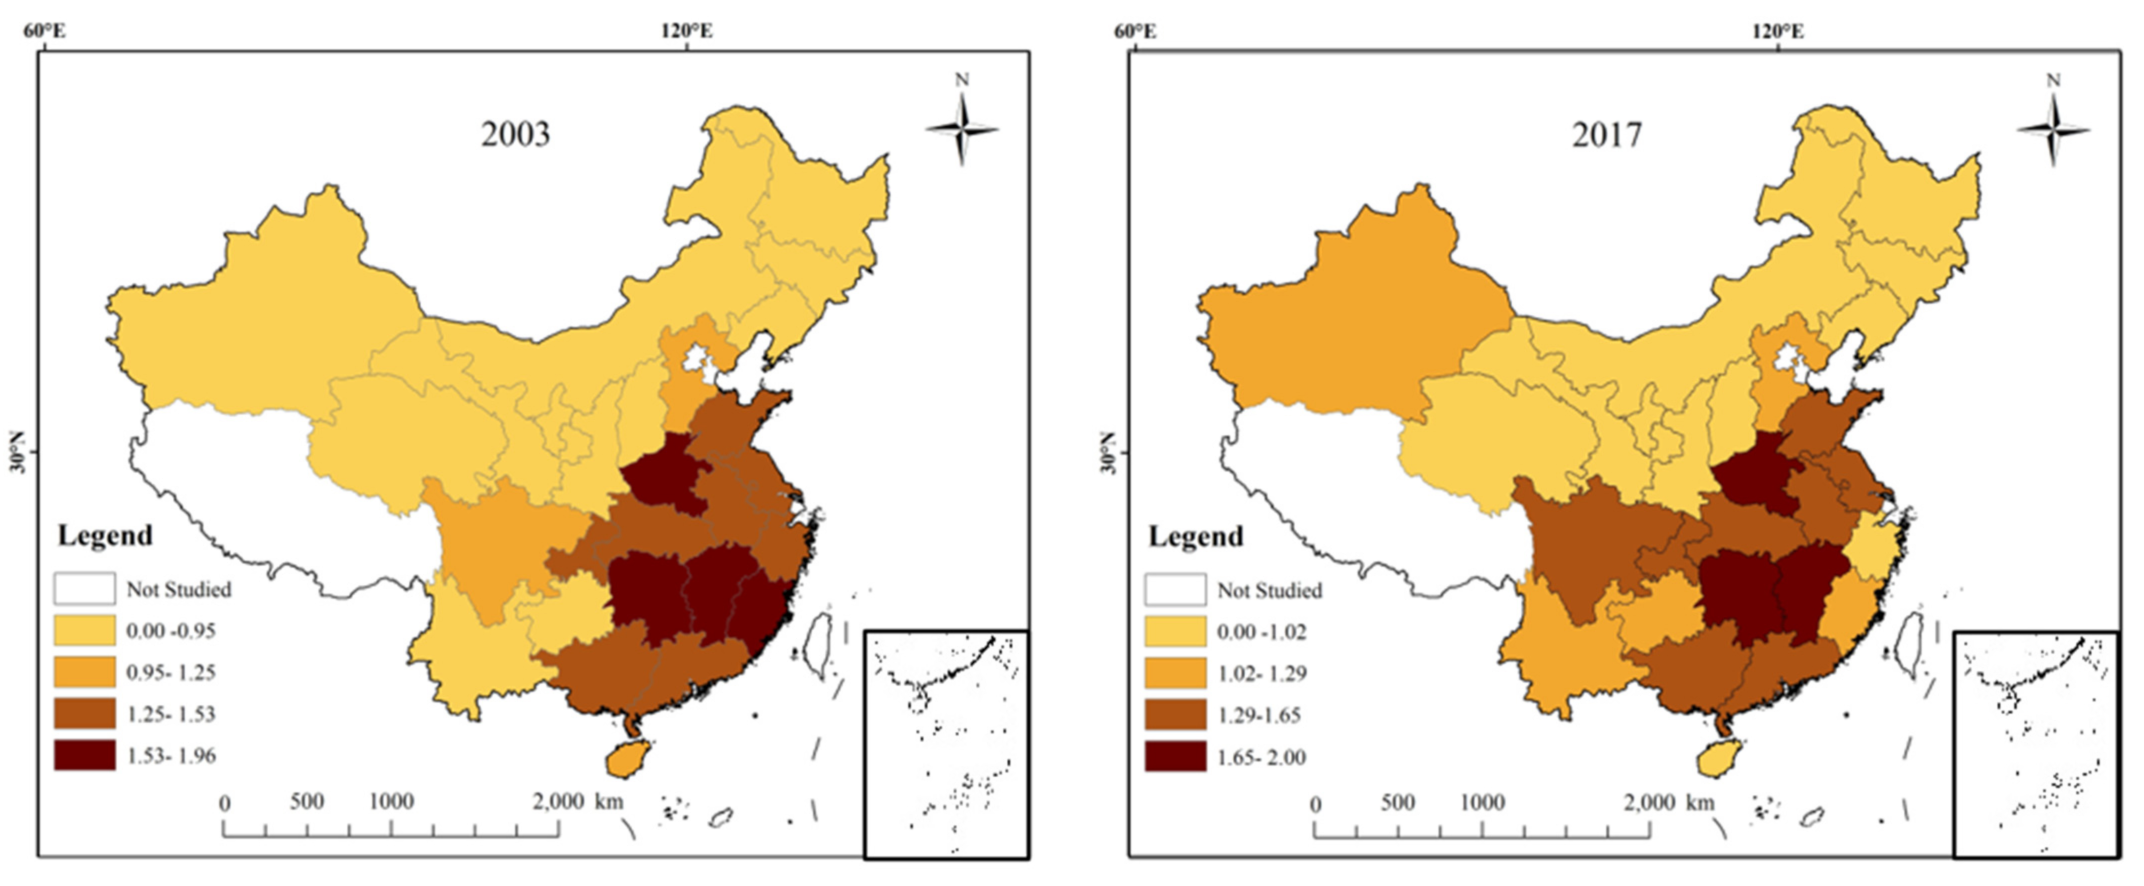
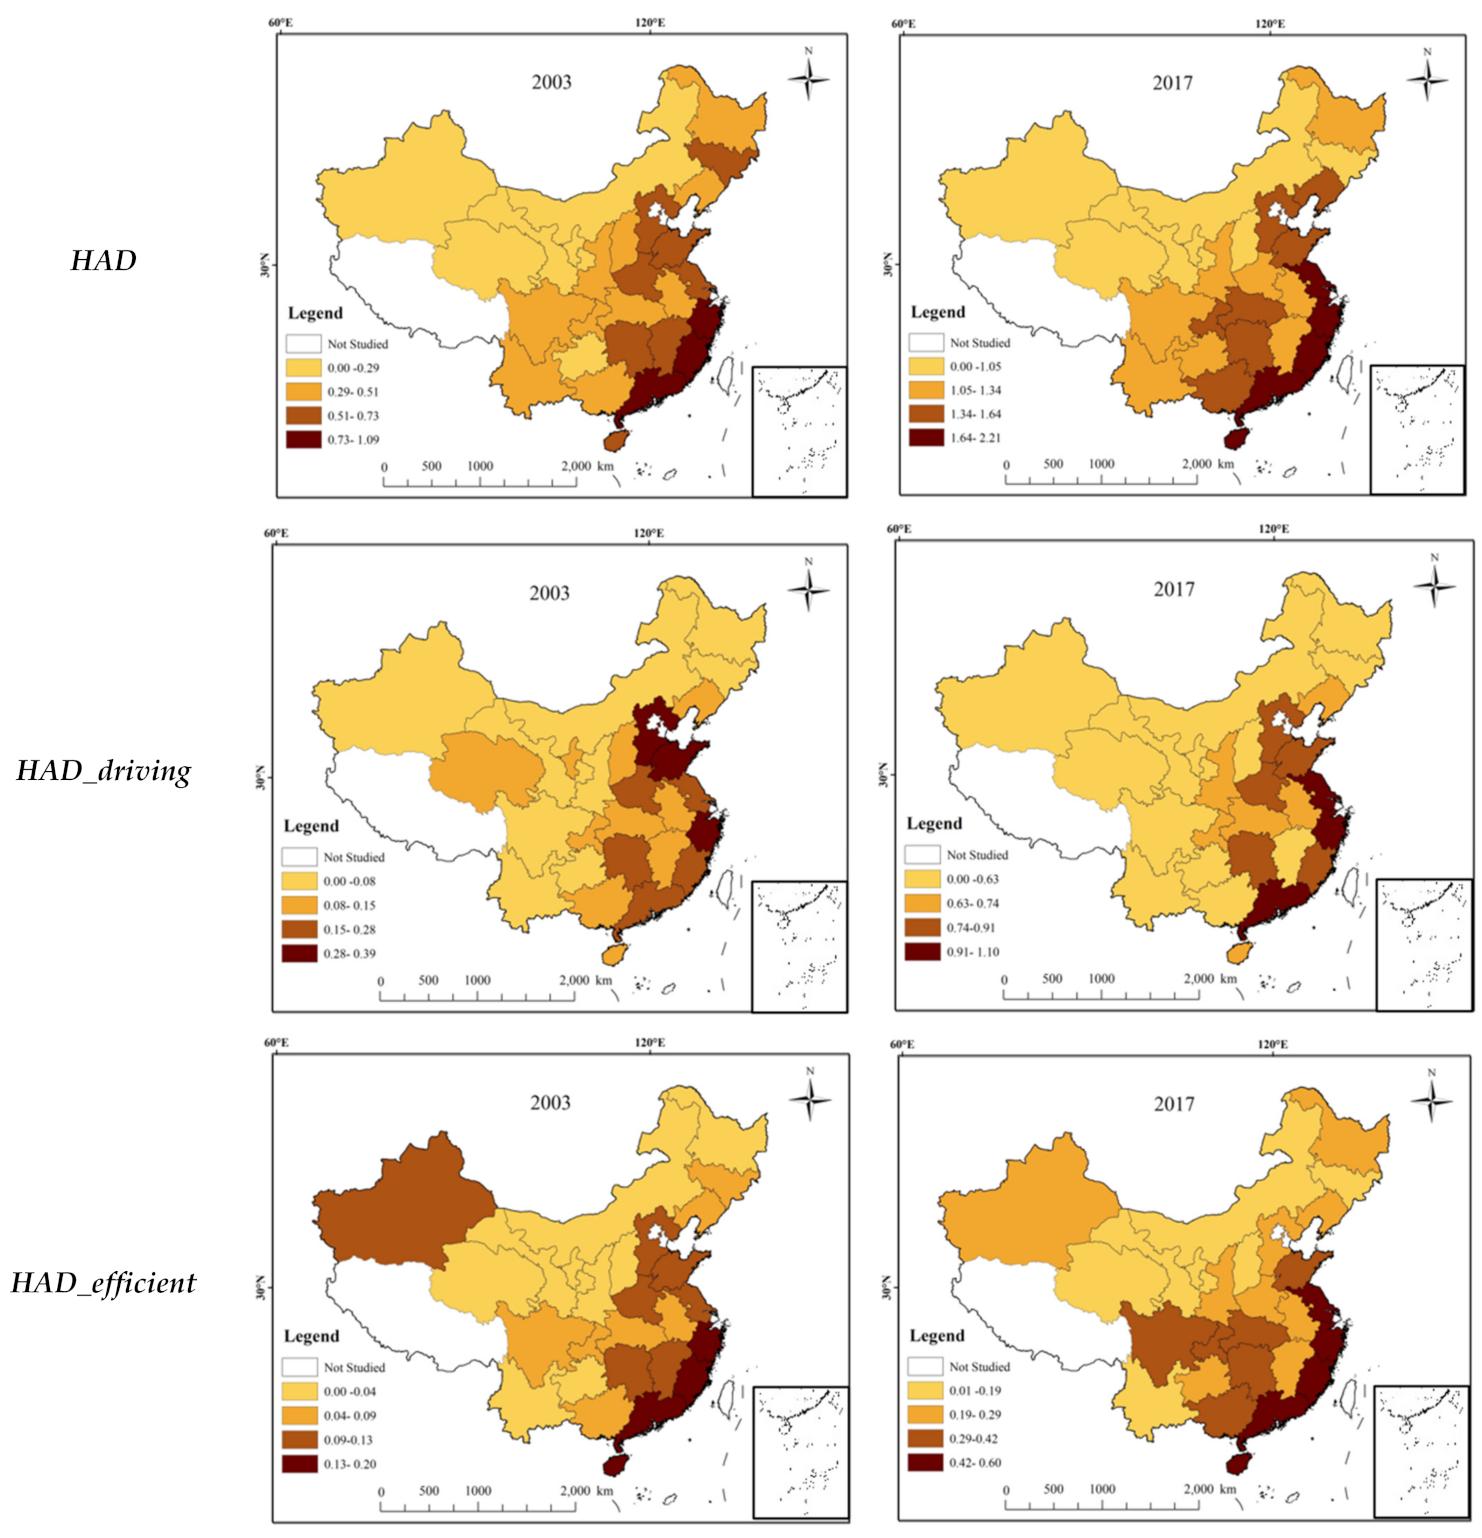
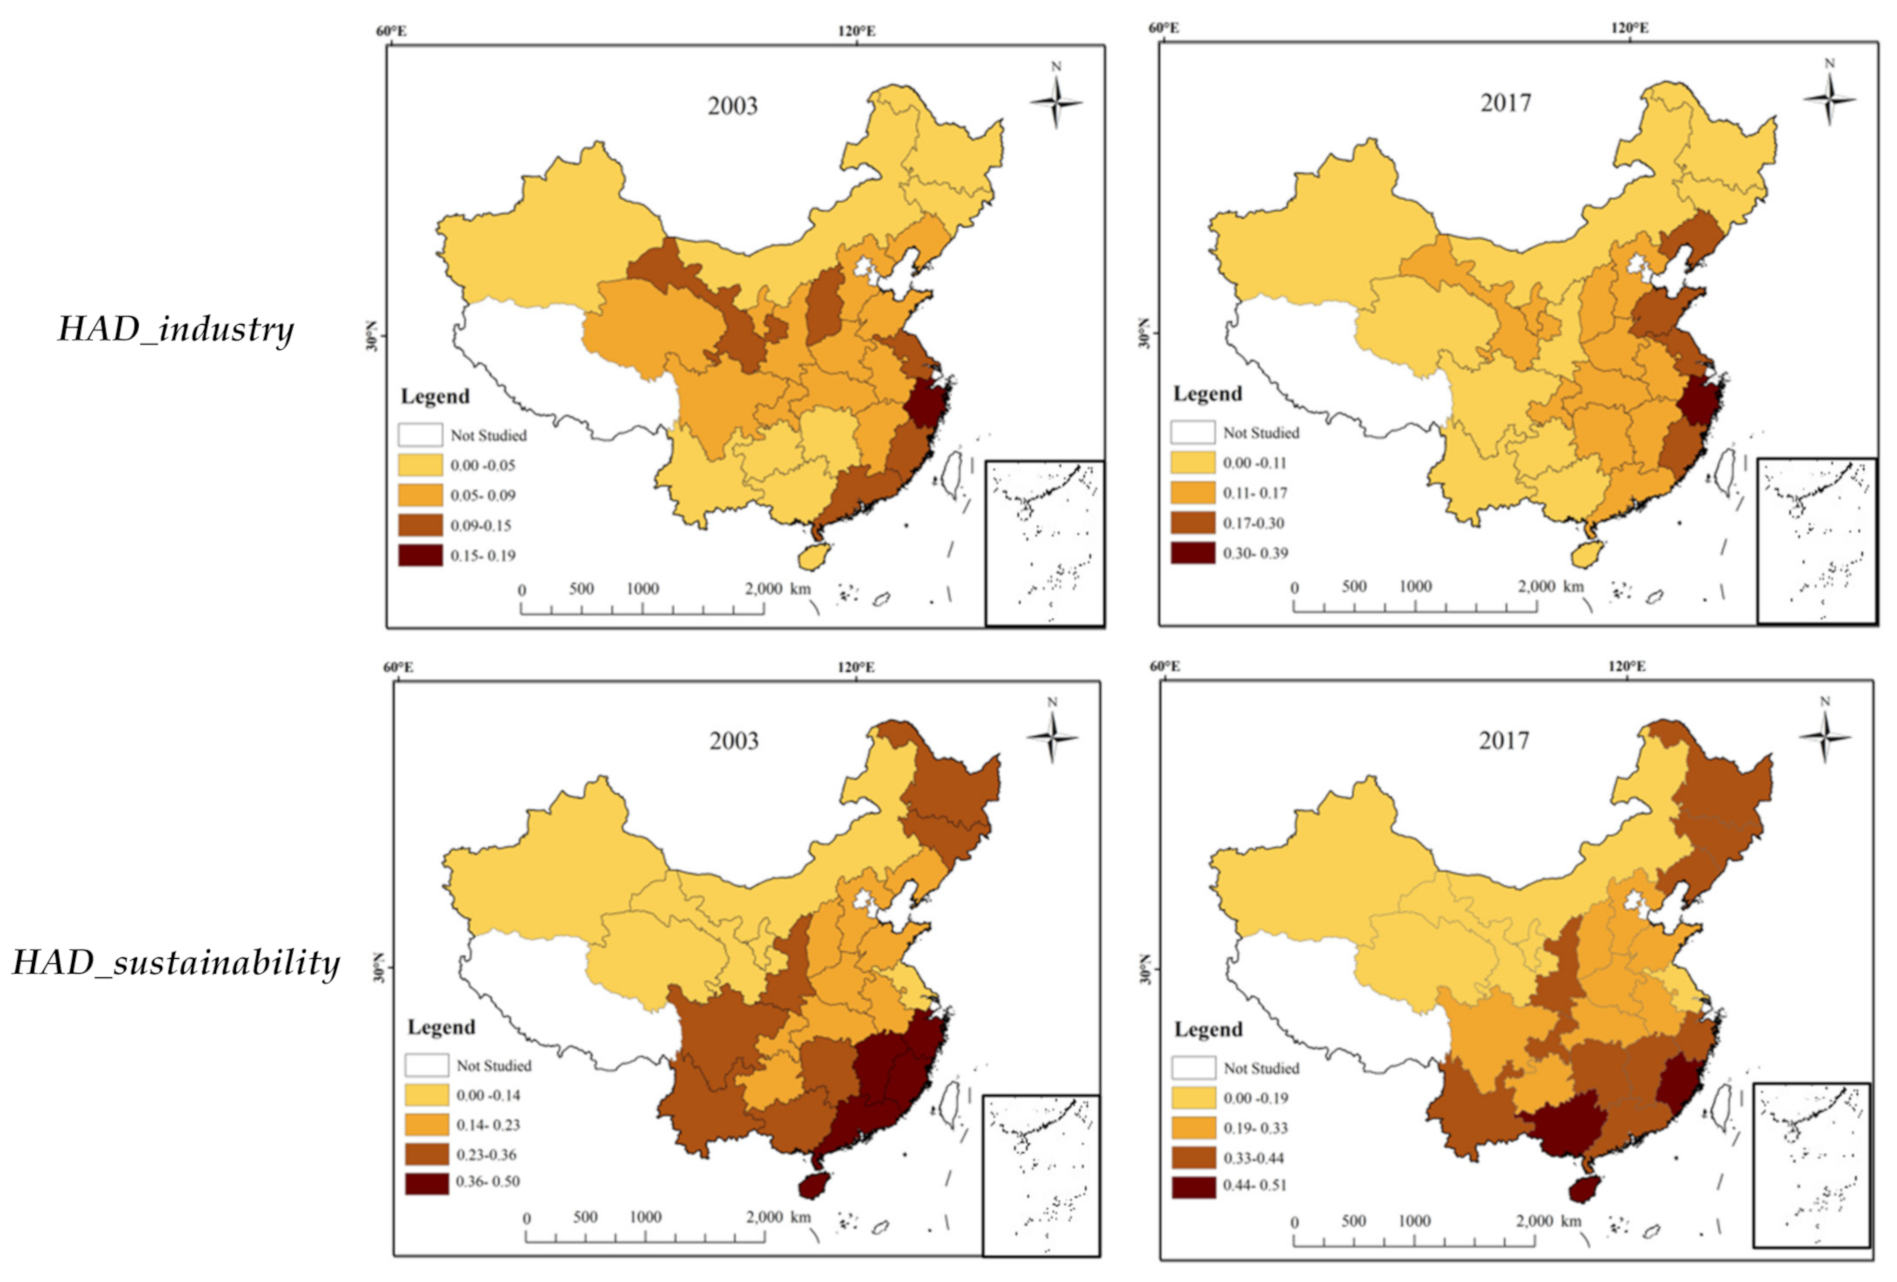
4.2. Temporal Evolution and Spatial Pattern of HAD

According to Figure 3, the average level of China’s high-quality agricultural development increased from 0.53 in 2003 to 1.37 in 2017, with an average annual growth rate of 14.85%. The top five provinces with the highest annual growth rate are Guizhou (20%), Inner Mongolia (18.77%), Ningxia (17.69%), Jiangsu (16.38%), and Chongqing (16.28%). We found that most of these provinces are also located in Western China. The result is consistent with RMT. Regarding the spatial pattern in 2017, the levels of high-quality agricultural development in Zhejiang, Jiangsu, and Fujian provinces are over 2.00, at 2.21, 2.04, and 2.03, respectively. The provinces with the lowest levels are Xinjiang (0.83), Gansu (0.89), and Qinghai (0.95). The levels of high-quality agricultural development in these provinces is lower than 1.00, which is quite different from those in Zhejiang, Jiangsu, and Fujian.
New driving force. The level of new driving force has increased from 0.14 to 0.71, with an average annual growth rate of 26.42%. In 2017, the three provinces with the highest levels of new driving force are Zhejiang, Jiangsu, and Guangdong. Their new driving force levels are higher than 1.00. The levels of new driving force in Shandong and Hunan are higher than 0.90. Although these two provinces are lower than Zhejiang, Jiangsu, and Guangdong, they have a certain leading edge over other provinces. Gansu has the lowest level of new driving force in China. In addition, Guizhou (0.55), Yunnan (0.55), Heilongjiang (0.54), Shanxi (0.53), and Xinjiang (0.52) are also significantly lower than Zhejiang, Jiangsu, and Guangdong.
Efficient growth. The efficient growth level increased from 0.08 in 2003 to 0.31 in 2017, with an average annual growth rate of 18.06%. In 2017, provinces with a high level of agricultural efficiency growth are mainly located in the Southeast Coastal of China, including Hainan (0.60), Fujian (0.59), Jiangsu (0.57), Guangdong (0.55), Zhejiang (0.50). In contrast, the three provinces with the lowest levels are Shanxi, Jilin, and Inner Mongolia. The levels of agricultural high efficiency growth in these provinces are lower than 0.20.
Industrial system integration. The level of industrial diversified integration increased from 0.08 in 2003 to 0.14 in 2017, with an average annual growth rate of 5.83%. In 2017, Zhejiang (0.39) has the highest level of industrial diversified integration, while Inner Mongolia (0.05) has the lowest level. Besides Zhejiang, the levels of Liaoning, Jiangsu, and Fujian are higher than 0.20. It could be inferred that the development of the agricultural service industry, agricultural processing industry, and rural non-agricultural employment of these provinces is relatively higher than other provinces.
Sustainable development. The level of agricultural sustainable development increased from 0.25 in 2003 to 0.31 in 2017, with an average annual growth rate of only 1.60%. In 2017, Hainan, Guangxi, and Fujian have the highest levels of sustainable development in China. Except for Hainan, Guangxi, and Fujian, the sustainable development levels of Zhejiang, Heilongjiang, Hunan, Guangdong and Yunnan all exceeded 0.40. However, the sustainable development levels of agriculture in Xinjiang, Qinghai, Ningxia, Jiangsu, and Inner Mongolia should be further improved.

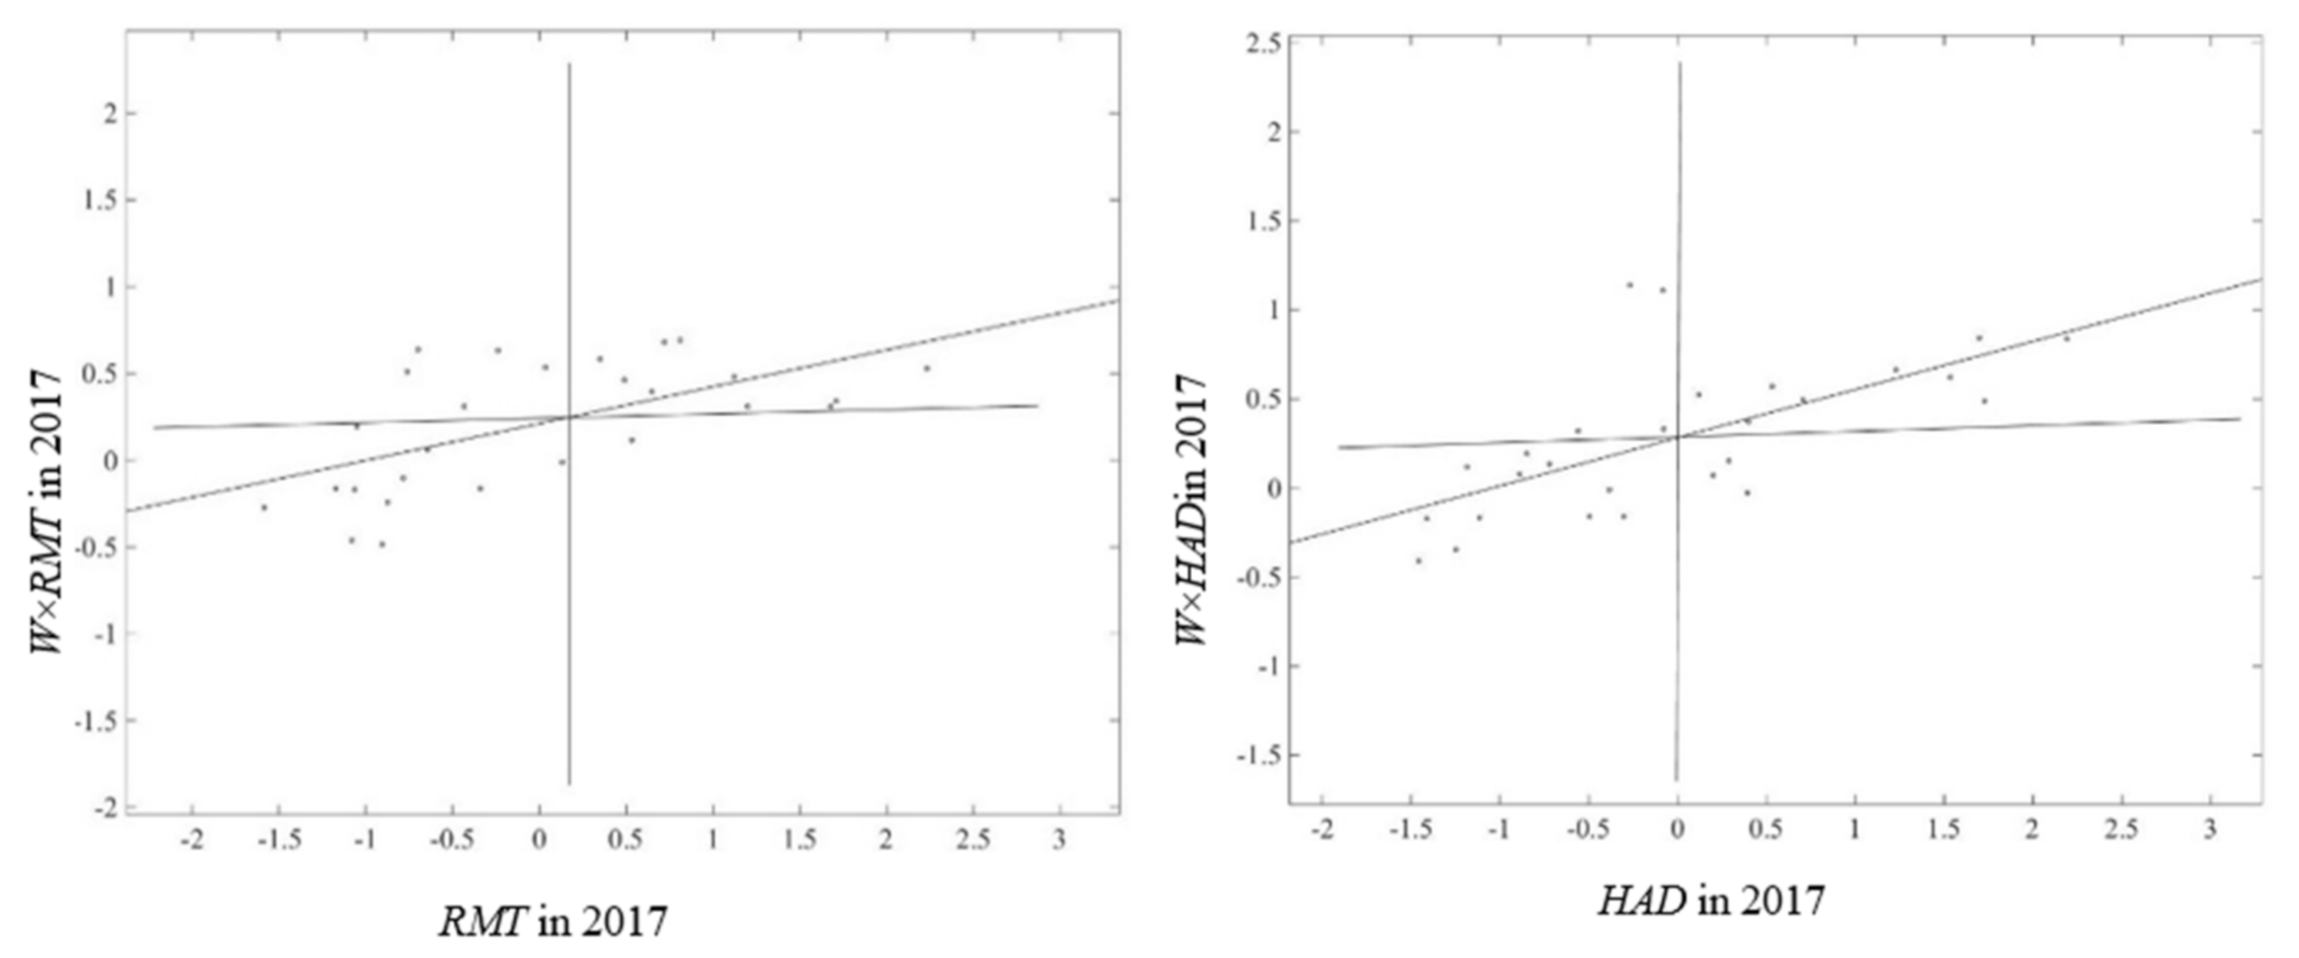
4.3. Spatial Correlation Analysis

Before establishing a spatial econometric model, global Moran’s index should be used to judge whether there is spatial autocorrelation on RMT and HAD. The results are shown in Figure 4. Global Moran’s index of RMT and HAD both has a fluctuating trend. Specifically, the global Moran’s index of RMT is concentrated in the range of 0.2–0.5, while the global Moran’s index of HAD is concentrated in the range of 0.35–0.45. It can be inferred that the similarity of climate, geography, and the mobility of production factors in a certain region leads to the spatial convergence of farmland use and agricultural development.
We further observe the Moran’s scatterplots’ similarities of RMT and HAD. Taking HAD in 2017 as an example, the scattered points located in the first (third) quadrant hint that the HAD level is also high (low) in neighboring regions, and scattered points located in second (fourth) quadrant indicate that HAD level is high (low) in the neighboring areas of low (high) agricultural development. As shown in Figure 5, the Moran’s scatterplots of RMT and HAD are distributed in all quadrants, but most of the scattered points are clustered in the first and third quadrants. On one hand, Shandong, Jiangsu, Hubei, Hunan, Guangdong, and Guangxi are all located in the first quadrants of RMT’s and HAD’s Moran’s scatterplots; on the other hand, Inner Mongolia, Heilongjiang, Shaanxi, Gansu, and Qinghai are all located in the third quadrant of RMT’s and HAD’s scatterplots. This could indicate that there is a spatial correlation between them, and the impact of RMT on HAD may have a spatial spillover effect. The result is consistent with the intuitive impression of Section 4.1 and Section 4.2.

4.4. Model Results Analysis

A panel model and spatial econometric model is constructed, and we compare their results so as to choose the perfect model. The principles of model selection are as follows: (1) A Hausman test could judge whether to choose a fixed effect or random effect of the panel model. (2) An LM Test, Wald test, and LR test determine whether SEM and SLM can be extended to SDM. (3) Based on R2, the goodness of fit of the model is determined. According to the above principles, the regression results of the random effect panel model are better, and the SDM with double fixed effects should be selected in the spatial econometric model. Table 1 and Table 2 respectively report the regression results of the random effect panel model and spatial Durbin model. The R2 result of the spatial Durbin model is higher than that of the panel model. Therefore, we should choose the SDM to analyze.
According to the results of Model (6) in Table 2, we found that: The spatial autoregressive coefficient ρ of HAD was 0.26 with a significant level of 1%. These results demonstrated that improvement of high-quality agricultural development in a neighboring province has a certain spatial spillover effect on the local province. There is a synergetic relationship on high-quality agricultural development of each province. Meanwhile, the spatial autoregressive coefficients ρ of Models (7)–(10) were 0.18, 0.15, 0.13, and 0.57, respectively, with a significant level of 1%. The spatial spillover effect also exists in each subitem of HAD. In addition, RMT has a positive effect on HAD and its subitems under the significant level of 5% and the results of RMT’s spatial regression coefficient are consistent with the direction and significance of spatial autoregressive coefficient ρ. This means that the results of SDM are reasonable and scientific.

4.5. Direct Effects and Indirect Effects

The regression results of SDM could not directly reflect the impact of explanatory variables on the explained variables. Lesage [61] proposed that a partial differential method should be used to calculate the specific direct and indirect effect values. The direct effect reveals the impact of RMT on HAD in local regions, while indirect (spatial spillover) effect reveals the impact of RMT on HAD in neighboring regions. These results are shown in Table 3.
RMT has a significant positive and direct effect on HAD with a significant level of 1%; the regression coefficient was 0.13. This means that if the RMT in a certain province increases by 1%, HAD level could increase by 0.13%. The indirect effect regression was 1.22, with a significant level of 1%. If RMT in a certain province increases by 1%, HAD increases by 1.22% in the neighboring province. Hypothesis (1) and Hypothesis (2) are verified. These results demonstrated that RMT with attributes of farmland property rights, farmland use input structure, farmland quality, and farmland function play an important role in high-quality agricultural development. Compared with the regression results of the panel model in Table 3, the regression coefficient and significance level are significantly improved. It could be demonstrated that if spatial interaction is not considered in the model, the promotion effect of RMT on HAD will be underestimated. According to the regression results of each subitem of agricultural high-quality development, RMT has the highest direct effect on the improvement of efficiency growth in local provinces, and the most significant effect on sustainable development in neighboring provinces.
The direct and indirect effects of industrialization on HAD failed to pass the significance test, indicating that industrialization had no significant impact on HAD. The reason is that GDP-oriented industrialization models of local governments in China are not conducive to the smoothing of channels for industrialization to feed agricultural development [62]. From the perspective of HAD subitems, industrialization has significantly improved the new driving force and industrial system integration in local provinces, but has no impact on neighboring provinces. Additionally, industrialization has no direct positive effect or spillover effect on efficient growth and sustainable development.
Urbanization not only improves the level of HAD in local provinces, but also has a positive impact on neighboring provinces. From the perspective of HAD subitems, urbanization has no significant direct or indirect effect on new driving force and industrial system integration. “Semi urbanization” and “high urban housing prices” take up too much of the income of residents, which makes it difficult to promote the transition of demand drivers for agricultural development, as well as the development of the agricultural service industry and manufacturing industry [63]. The direct and indirect effects of urbanization on efficient growth and agricultural sustainable development are significantly positive. This means that urbanization improves agricultural production efficiency and realizes sustainable development by alleviating human-land conflict in rural areas.
The level of economic development has improved HAD in local provinces but has no significant impact on neighboring provinces. From the perspective of high-quality agricultural development subitems, economic development has significantly improved new driving force, efficient growth, and industrial system integration in local provinces, but only has a significant spillover effect on the development of the new driving force of agriculture in neighboring provinces. Meanwhile, the direct and spillover effects of economic development on agricultural sustainable development were significantly negative, indicating that the coordinated development level of China’s economic development and sustainable development needs to be improved.
Government intervention has no positive impact on high-quality agricultural development e in local provinces. The reason is that the government is the leading decisionmaker and coordinator of high-quality agricultural development, so it can make up for the positive role of market allocation defects [64]. However, government policy deviation leads to “government failure”. Meanwhile, the spillover effect coefficient of government intervention was significantly positive, which indicated that local governments adopt the policy of “cooperation” between regions.

5. Discussion

Our research shows that the impact of RMT on HAD has significant direct effects and spatial spillover effects. Our previous research also verified the impact of FUT on grain production [12], agricultural economic growth [38], and farmers’ poverty reduction [65], and the results confirmed that the FUT has direct effects and spatial spillovers on social and economic development. Therefore, the spatial spillover effect caused by the spatial proximity of farmland and the mobility of production factors needs to be emphasized in the field of land use research. Especially for China’s agricultural development, with the construction of transportation infrastructure and telecommunication infrastructure, the industrial structure of China’s rural areas and the way of farmland use will be greatly changed, and rural areas will no longer be independent individuals. Therefore, the spatial spillover effect of RMT on HAD may become more significant.
In this paper, a spatial econometric model was constructed to explore the effect of RMT on HAD, and the direct effect and spatial spillover effect were incorporated into the regression model. Of course, in future research, the construction of the HAD indicator system needs to be improved, and the regional differences in the impact of RMT on HAD need to be considered.

6. Conclusions and Policy Implications

6.1. Conclusions

China’s agriculture has changed from a period of high-speed growth to a period of high-quality development. Farmland recessive morphology transition refers to the “quality” attribute of farmland use. It is necessary to consider if RMT could contribute to HAD. In order to answer that question, this paper used the multiple cropping index to represent RMT and constructed a multidimensional index system to quantify high-quality agricultural development from the perspective of new driving of agricultural development, efficient growth of agriculture, industrial system integration, and sustainable development. Then, we established econometric model to explore the impact of RMT on HAD by making use of the panel data of 27 provinces in China from 2003–2017. The results indicated that RMT and HAD both have positive geospatial correlation. Furthermore, the spatial econometric model provides more accurate results of the impact of RMT on HAD than the panel model. If RMT in a local province increases by 1%, HAD could increase by 0.13%. Likewise, RMT has a strong positive spatial spillover effect on HAD; if the RMT in a certain province increases by 1%, HAD could increase by 1.22% in neighboring provinces.

6.2. Policy Implications

RMT of farmland involves the change of farmland property rights, the change of farmland input structure, the improvement of farmland quality, and the upgrading of farmland function. High-quality agricultural development mainly reflects the quality of agricultural progress from the perspective of “advancement”. Therefore, compared with the dominant morphology transition characterized quantitatively, it is of more practical significance to explore the impact of RMT on HAD. Based on the conclusions of this paper, policy implications are as follows.
The change of farmland property rights is one of the important attributes of farmland use recessive morphology transition. Under the background of great changes in the social relationship between farmers and farmland, governments should enrich the connotation of agricultural land property rights and strengthen the role of agricultural property rights in optimizing the allocation of production factors. In terms of farmland use input structure, most developing countries in the world still rely on traditional agricultural development momentum such as chemical fertilizer and agriculture, which obviously does not meet the requirements of high-quality agricultural development. Governments should guide farmers to change their concepts of agricultural development and put the quality and safety of agricultural products in an important position. Meanwhile, it is necessary for governments to accelerate the cultivation of new agricultural and rural industries and promote the innovation and promotion of agricultural science and technology. In terms of farmland quality, although the increase of multiple cropping index can meet the increasing food demand of people, it may also damage farmland quality. Governments and policymakers should choose the suitable regional pattern of rotation and fallow according to the characteristics of regional agricultural resource endowment and ecological environment. In terms of farmland function, based on the consumption demand of urban and rural residents, farmland quality should also be improved by means of comprehensive agricultural development and high-standard farmland construction, so as to realize diversified development of farmland function.
Moreover, we also found that RMT of farmland and HAD have spatial correlation. Therefore, it is necessary to improve the ability of coordinated development among regions. Firstly, in order to provide convenience for cross-regional agricultural machinery service and agricultural material flow, the government should increase investment in the construction of substandard roads related to rural areas and eliminate the traffic bottleneck restricting the development of rural areas. Then, governments should innovate the diversified integration of rural industries, promote effective connection between farmers and the market by making use of modern information technology. Additionally, governments should clarify their function boundary in agricultural development and avoid microintervention in agricultural development. Governments should strengthen cooperation with neighboring regions in agricultural technology development and extension, rural infrastructure construction, and land transfer markets so as to improve the positive direct effect and spillover effect of the government on high-quality agricultural development.

Author Contributions

Supervision, funding acquisition, writing—review & editing, X.L.; conceptualization, software, methodology, writing—original draft & editing, Z.L.; writing—review & editing, software, data curation, H.W.; writing—original draft & editing, formal analysis, visualization, resources, Y.T.; writing—review & editing, B.H.; software, visualization, M.G.; software, data curation, Y.L. All authors have read and agreed to the published version of the manuscript.

Funding

This study was supported by National Social Science Foundation of China (21FGLA003), National Natural Science Foundation of China (Nos. 42101263) and National 985 Project of Non-traditional Security at Huazhong University of Science and Technology.

Institutional Review Board Statement

Not applicable.

Informed Consent Statement

Not applicable.

Data Availability Statement

The data presented in this study are available upon request from the corresponding author.

Acknowledgments

The authors sincerely thank the anonymous reviewers for their valuable comments and suggestions to improve the quality of this paper.

Conflicts of Interest

The authors declare no conflict of interest.

References

  1. Lambin, E.F.; Meyfroidt, P. Land use transitions: Socio-ecological feedback versus socio-economic change. Land Use Policy 2010, 27, 108–118. [Google Scholar] [CrossRef]
  2. Grainger, A. National Land Use Morphology: Patterns and Possibilities. Geography 1995, 80, 235–245. [Google Scholar]
  3. Long, H.; Li, T. Analysis of the Coupling of Farmland and Rural Housing Land Transition in China. Acta Geogr. Sin. 2012, 67, 201–210. [Google Scholar]
  4. Popp, A.; Rose, S.K.; Calvin, K.; Van Vuuren, D.P.; Dietrich, J.P.; Wise, M.; Stehfest, E.; Humpenöder, F.; Kyle, P.; Van Vliet, J.; et al. Land-use transition for bioenergy and climate stabilization: Model comparison of drivers, impacts and interactions with other land use based mitigation options. Clim. Change 2014, 123, 495–509. [Google Scholar] [CrossRef]
  5. Skog, K.L.; Steinnes, M. How do centrality, population growth and urban sprawl impact farmland conversion in Norway? Land Use Policy 2016, 59, 185–196. [Google Scholar] [CrossRef]
  6. Ge, D.; Long, H.; Zhang, Y.; Ma, L.; Li, T. Farmland transition and its influences on grain production in China. Land Use Policy 2018, 70, 94–105. [Google Scholar] [CrossRef]
  7. Qu, Y.; Long, H. The economic and environmental effects of land use transitions under rapid urbanization and the implications for land use management. Habitat Int. 2018, 82, 113–121. [Google Scholar] [CrossRef]
  8. Song, X.; Wu, Z.; Ouyang, Z. Route of cultivated land transition research. Geogr. Res.-Aust. 2014, 33, 403–413. [Google Scholar]
  9. Chen, K.; Long, H.; Liao, L.; Tu, S.; Li, T. Land use transitions and urban-rural integrated development: Theoretical framework and China’s evidence. Land Use Policy 2020, 92, 104465. [Google Scholar] [CrossRef]
  10. Long, H.; Qu, Y. Land use transitions and land management: A mutual feedback perspective. Land Use Policy 2018, 74, 111–120. [Google Scholar] [CrossRef]
  11. Zhang, B.; Gao, J.; Gao, Y.; Cai, W.; Zhang, F. Land use transition of mountainous rural areas in China. Acta Geogr. Sin. 2018, 73, 503–517. [Google Scholar]
  12. Tang, Y.; Lu, X.; Wang, M.; Jiang, B.; Chen, D.; Ge, K. Assessing the threshold effects of road infrastructure construction on farmland use transition: An empirical study in China. Environ. Sci. Pollut. Res. 2022. [Google Scholar] [CrossRef] [PubMed]
  13. Ma, L.; Long, H.; Tu, S.; Zhang, Y.; Zheng, Y. Farmland transition in China and its policy implications. Land Use Policy 2020, 92, 104470. [Google Scholar] [CrossRef]
  14. Qu, Y.; Long, H. A framework of multi-disciplinary comprehensive research on recessive farmland transition in China. Acta Geogr. Sin. 2018, 73, 1226–1241. [Google Scholar]
  15. Neumann, K.; Verburg, P.H.; Stehfest, E.; Müller, C. The yield gap of global grain production: A spatial analysis. Agric. Syst. 2010, 103, 316–326. [Google Scholar] [CrossRef]
  16. Zhang, X.; Yang, J.; Thomas, R. Mechanization Outsourcing Clusters and Division of Labor in Chinese Agriculture. China Econ. Rev. 2015, 43, 184–195. [Google Scholar] [CrossRef]
  17. Feng, S.; Heerink, N.; Ruben, R.; Qu, F. Land rental market, off-farm employment and agricultural production in Southeast China: A plot-level case study. China Econ. Rev. 2010, 21, 598–606. [Google Scholar] [CrossRef]
  18. Tang, Y.; Lu, X.; Yi, J.; Wang, H.; Zhang, X.; Zheng, W. Evaluating the spatial spillover effect of farmland use transition on grain production–An empirical study in Hubei Province, China. Ecol. Indic. 2021, 125, 107478. [Google Scholar] [CrossRef]
  19. Alonso-Carrera, J.; Raurich, X. Labor mobility, structural change and economic growth. J. Macroecon. 2018, 56, 292–310. [Google Scholar] [CrossRef] [Green Version]
  20. Mlachila, M.; Tapsoba, R.; Tapsoba, S.J.A. A Quality of Growth Index for Developing Countries: A Proposal. Soc. Indic. Res. 2017, 134, 675–710. [Google Scholar] [CrossRef]
  21. Alwyn, Y. Gold into Base Metals: Productivity Growth in the People’s Republic of China during the Reform Period. J. Polit. Econ. 2003, 111, 1220–1261. [Google Scholar]
  22. Hoang, V.; Coelli, T. Measurement of agricultural total factor productivity growth incorporating environmental factors: A nutrients balance approach. J. Environ. Econ. Manag. 2011, 62, 462–474. [Google Scholar] [CrossRef] [Green Version]
  23. Dias Avila, A.F.; Evenson, R.E. Chapter 72 Total Factor Productivity Growth in Agriculture: The Role of Technological Capital. In Handbook of Agricultural Economics; Elsevier: Amsterdam, The Netherlands, 2010; Volume 4, pp. 3769–3822. [Google Scholar]
  24. Ghatak, M.; Roy, S. Land reform and agricultural productivity in India: A review of the evidence. Oxf. Rev. Econ. Pol. 2007, 23, 251–269. [Google Scholar] [CrossRef]
  25. Lawry, S.; Samii, C.; Hall, R.; Leopold, A.; Hornby, D.; Mtero, F. The impact of land property rights interventions on investment and agricultural productivity in developing countries: A systematic review. J. Dev. Effect. 2017, 9, 61–81. [Google Scholar] [CrossRef] [Green Version]
  26. Baldos, U.L.C.; Viens, F.G.; Hertel, T.W.; Fuglie, K.O. R&D Spending, Knowledge Capital, and Agricultural Productivity Growth: A Bayesian Approach. Am. J. Agric. Econ. 2018, 101, 291–310. [Google Scholar]
  27. Martinez, M.; Mlachila, M. The Quality of the Recent High-Growth Episode in Sub-Saharan Africa; International Monetary Fund: Washington, DC, USA, 2013. [Google Scholar]
  28. Bender, S.F.; Wagg, C.; van der Heijden, M.G.A. An Underground Revolution: Biodiversity and Soil Ecological Engineering for Agricultural Sustainability. Trends Ecol. Evol. 2016, 31, 440–452. [Google Scholar] [CrossRef] [PubMed]
  29. Bartkowiak, A.; Bartkowiak, P. Technical and Technological Progress in the Context of Sustainable Development of Agriculture in Poland. Procedia Eng. 2017, 182, 66–75. [Google Scholar] [CrossRef]
  30. Zulfiqar, F.; Thapa, G.B. Agricultural sustainability assessment at provincial level in Pakistan. Land Use Policy 2017, 68, 492–502. [Google Scholar] [CrossRef]
  31. James, L.; Robert, K.P. Introduction to Spatial Econometrics + Reference; CRC Press/Taylor & Francis Group: New York, NY, USA, 2009. [Google Scholar]
  32. Ertur, C.; Koch, W. Growth, technological interdependence and spatial externalities: Theory and evidence. J. Appl. Economet. 2007, 22, 1033–1062. [Google Scholar] [CrossRef] [Green Version]
  33. Thang, T.T.; Thang, T.T.; Pham, T.S.H.; Barnes, B.R. Spatial Spillover Effects from Foreign Direct Investment in Vietnam. J. Dev. Stud. 2016, 52, 1431–1445. [Google Scholar] [CrossRef]
  34. Chen, X.; Shao, S.; Tian, Z.; Xie, Z.; Yin, P. Impacts of air pollution and its spatial spillover effect on public health based on China’s big data sample. J. Clean. Prod. 2017, 142, 915–925. [Google Scholar] [CrossRef]
  35. Li, M.; Zhang, M.; Du, C.; Chen, Y. Study on the spatial spillover effects of cement production on air pollution in China. Sci. Total Environ. 2020, 748, 141421. [Google Scholar] [CrossRef] [PubMed]
  36. Fragoso Januário, J.; Costa, Á.; Oliveira Cruz, C.; Miranda Sarmento, J.; Faria E Sousa, V. Transport infrastructure, accessibility, and spillover effects: An empirical analysis of the Portuguese real estate market from 2000 to 2018. Res. Transp. Econ. 2021, 90, 101130. [Google Scholar] [CrossRef]
  37. Kumar, K.S.K. Climate sensitivity of Indian agriculture: Do spatial effects matter? Camb. J. Reg. Econ. Soc. 2011, 4, 221–235. [Google Scholar] [CrossRef] [Green Version]
  38. Lu, X.; Tang, Y.; Yi, J.; Jiang, X. Study on the Impact of Cultivated Land Use Transition on Agricultural Economic Growth based on Spatial Econometric Model. China Land Sci. 2019, 33, 53–61. [Google Scholar]
  39. Mei, L.; Chen, Z. The Convergence Analysis of Regional Growth Differences in China: The Perspective of the Quality of Economic Growth*. J. Serv. Sci. Manag. 2016, 9, 453–476. [Google Scholar] [CrossRef] [Green Version]
  40. Ren, B. Theoretical Interpretation and Practical Orientation of China’s Economy from High Speed Growth to High Quality Development. Acad. Mon. 2018, 50, 66–74. [Google Scholar]
  41. Jin, B. Study on the “High-Quality Development” Economics. China Ind. Econ. 2018, 1, 163–180. [Google Scholar]
  42. Aker, J.C.; Ghosh, I.; Burrell, J. The promise (and pitfalls) of ICT for agriculture initiatives. Agric. Econ. Blackwell 2016, 47, 35–48. [Google Scholar] [CrossRef]
  43. Rosenberg, N. Science, Invention and Economic Growth. Econ. J. 1974, 84, 90–108. [Google Scholar] [CrossRef]
  44. Sheng, Y.; Tian, X.; Qiao, W.; Peng, C. Measuring agricultural total factor productivity in China: Pattern and drivers over the period of 1978–2016. Aust. J. Agric. Resour. Econ. 2019, 64, 82–103. [Google Scholar] [CrossRef]
  45. Li, G. On Transformation of Ways in Driving China’s Agricultural Development. China Rural. Econ. 2017, 7, 2–14. [Google Scholar]
  46. Holden, S.T.; Deininger, K.; Ghebru, H. Impact of Land Certification on Land Rental Market Participation in Tigray Region, Northern Ethiopia. In Proceedings of the Nordic Development Economics Conference, Copenhagen, Denmark, 18–19 June 2007. [Google Scholar]
  47. Jin, S.; Jayne, T.S. Land Rental Markets in Kenya: Implications for Efficiency, Equity, Household Income, and Poverty. Land Econ. 2013, 89, 246–271. [Google Scholar] [CrossRef]
  48. Zhang, S. Land transfer and agricultural modernization. Manag World. 2010, 7, 66–85. [Google Scholar]
  49. Besley, T. Property Rights and Investment Incentives: Theory and Evidence from Ghana. J. Polit. Econ. 1995, 103, 903–937. [Google Scholar] [CrossRef] [Green Version]
  50. Feder, G.; Feeny, D. Land Tenure and Property Rights: Theory and Implications for Development Policy. World Bank Econ. Rev. 1991, 5, 135–153. [Google Scholar] [CrossRef]
  51. Kong, X.; Li, C.; Zhao, J.; Wang, H.; Tan, M.; Li, T.; Zhang, Q. Method and empirical research on the realization degree of arable land production capacity at town level. Trans. Chin. Soc. Agric. Eng. 2010, 26, 345–351. [Google Scholar]
  52. Ge, D.; Long, H.; Qiao, W.; Wang, Z.; Sun, D.; Yang, R. Effects of rural–urban migration on agricultural transformation: A case of Yucheng City, China. J. Rural Stud. 2020, 76, 85–95. [Google Scholar] [CrossRef]
  53. Cao, Z.; Dawson, R. Modeling circulation function in agroecosystems. Ecol. Model. 2005, 181, 557–565. [Google Scholar] [CrossRef]
  54. Yu, Q.; Wu, W.; You, L.; Zhu, T.; van Vliet, J.; Verburg, P.H.; Liu, Z.; Li, Z.; Yang, P.; Zhou, Q.; et al. Assessing the harvested area gap in China. Agric. Syst. 2017, 153, 212–220. [Google Scholar] [CrossRef]
  55. Spera, S.A.; Galford, G.L.; Coe, M.T.; Macedo, M.N.; Mustard, J.F. Land-use change affects water recycling in Brazil’s last agricultural frontier. Glob. Change Biol. 2016, 22, 3405–3413. [Google Scholar] [CrossRef] [PubMed]
  56. Boserup, E. The Conditions of Agricultural Growth: The Economics of Agrarian Change under Population Pressure; Allen & Unwin: London, UK, 1965. [Google Scholar]
  57. Friedman, J.H.; Tukey, J.W. A projection pursuit algorithm for exploratory data analysis. IEEE Trans. Comput. 1974, 23, 881–890. [Google Scholar] [CrossRef]
  58. Cantos, P.; Gumbau Albert, M.; Maudos, J. Transport infrastructures, spillover effects and regional growth: Evidence of the Spanish case. Transp. Rev. 2005, 25, 25–50. [Google Scholar] [CrossRef] [Green Version]
  59. Yang, J.; Huang, Z.; Zhang, X.; Reardon, T. The Rapid Rise of Cross-Regional Agricultural Mechanization Services in China. Am. J. Agric. Econ. 2013, 95, 1245–1251. [Google Scholar] [CrossRef]
  60. Li, L.; Tian, Y.; Zhang, G.; Zhang, H. Spatial weights matrix construction and econimoic space gravitational effects analysis. Syst. Eng.-Theory Pract. 2015, 35, 1918–1927. [Google Scholar]
  61. LeSage, J.; Kelley, P.R. Introduction to Spatial Econometrics; CRC Press: Boca Raton, FL, USA, 2009. [Google Scholar]
  62. Lu, Q.; Liang, F.; Bi, X.; Duffy, R.; Zhao, Z. Effects of urbanization and industrialization on agricultural land use in Shandong Peninsula of China. Ecol. Indic. 2011, 11, 1710–1714. [Google Scholar] [CrossRef]
  63. Li, T.; Cheng, S.; Ni, L.; Qian, J. The consumption effects of urbanization: Evidence from China. China J. Popul. Sci. 2013, 23, 19–27. [Google Scholar]
  64. Ndikumana, L. Distributional conflict, the state and peace building in Burundi. Round Table 2005, 94, 413–427. [Google Scholar] [CrossRef]
  65. Lu, X.H.; Wang, H.; Tang, Y.F.; Jiang, X. Study on the Spatial Spillover Effect of the Transformation of Farmland Utilization on Farmers’ Income in Hubei Province. Resour. Environ. Yangtze Basin 2021, 30, 1757–1767. [Google Scholar]
Figure 1. High-quality agricultural development measurement index system.
Land 11 00435 g001
Figure 2. The evaluation results of RMT in 2003 and 2017.
Land 11 00435 g002
Figure 3. The evaluation results of HAD in 2003 and 2017.
Land 11 00435 g003aLand 11 00435 g003b
Figure 4. Evolution of RMT and HAD Global Moran’s Index.
Land 11 00435 g004
Figure 5. Moran’s scatterplots of RMT and HAD.
Land 11 00435 g005
Table 1. Results of Panel Model.
Model (1)Model (2)Model (3)Model (4)Model (5)
constant−3.07 *** (0.16)−2.45 *** (0.07)−0.71 *** (0.07)−0.10 *** (0.03)−0.07 (0.06)
RMT0.09 * (0.05)0.05 * (0.02)0.07 *** (0.02)0.04 *** (0.01)0.03 * (0.02)
urbanization0.91 *** (0.25)0.26 ** (0.12)0.39 *** (0.10)0.18 *** (0.05)0.08 (0.10)
industrialization−0.72 *** (0.12)−0.45 (1.27)−0.33 *** (0.05)−0.07 *** (0.02)0.04 (0.04)
economic0.85 *** (0.07)0.65 *** (0.03)0.16 *** (0.03)0.05 *** (0.01)0.06 ** (0.03)
gov0.36 (0.30)0.13 (0.14)0.25 (0.12)−0.15 ** (0.06)−0.13 (0.12)
R20.680.780.650.630.62
Models (1)–(5) represents the panel data model results of HAD, HAD_driving, HAD_efficient, HAD_industry, HAD_sustainability. *, **, and *** represent the significances at 10%, 5%, and 1% levels, respectively. Value in parentheses is t test value.
Table 2. Results of SDM.
Model (6)Model (7)Model (8)Model (9)Model (10)
RMT0.26 *** (4.79)0.18 *** (2.71)0.15 *** (2.09)0.13 *** (2.33)0.57 *** (10.68)
industrialization0.10 *** (2.98)0.05 *** (2.99)0.10 *** (7.99)0.03 *** (3.38)0.04 *** (2.70)
urbanization−0.17 (−1.16)0.10 (1.27)−0.44 *** (−7.66)0.12 ** (2.71)0.05 (0.69)
economic0.71 *** (3.41)−0.14 (−1.23)0.11 (1.46)0.09 (1.58)0.67 *** (7.34)
gov0.79 *** (6.81)0.57 *** (8.97)0.41 *** (9.57)0.08 ** (2.48)−0.22 (−4.37)
w × RMT−0.74 ** (−2.28)−0.41 ** (−2.33)−0.01 (−0.11)−0.18 ** (−1.99)−0.32 (−2.26)
w × industrialization0.86 *** (8.26)0.22 *** (3.96)0.09 ** (2.28)0.20 *** (7.21)0.41 *** (9.02)
w × urbanization0.76 (0.87)−0.29 (−0.62)−1.00 *** (−3.04)0.29 (1.20)−0.30 (−0.78)
w × economic2.32 *** (2.63)−1.39 *** (−2.92)1.09 *** (3.53)−0.38 (−1.58)2.84 *** (7.29)
w × gov−0.73 (−1.25)0.87 *** (2.73)−0.70 *** (−3.20)0.03 (0.18)−0.77 (−3.02)
R26.29 *** (4.19)1.42 * (1.73)2.70 *** (4.79)−0.16 (−0.38)2.94 *** (4.47)
Models (6)–(10) represents the SDM results of HAD, HAD_driving, HAD_efficient, HAD_industry, HAD_sustainability. *, **, and *** represent the significances at 10%, 5%, and 1% levels, respectively. Value in parentheses is t test value.
Table 3. Results of direct effects and indirect effects.
VariablesHADHAD_DrivingHAD_EfficientHAD_IndustryHAD_Sustainability
Direct effectsRMT0.13 *** (4.56)0.06 ** (2.70)0.11 *** (7.88)0.08 *** (4.23)0.05 *** (1.40)
industrialization−0.17 (−1.01)0.11 ** (2.16)−0.44 *** (−7.49)0.12 ** (2.76)−0.01 (−0.14)
urbanization0.75 *** (3.54)−0.12 (−1.07)0.13 ** (2.23)0.07 (1.03)0.89 *** (3.02)
economic0.77 *** (6.75)0.57 *** (8.31)0.40 *** (9.62)0.09 ** (2.53)−0.28 *** (−5.02)
gov−0.60 (−1.86)−0.38 * (−2.04)0.03 (0.15)−0.19 * (−1.72)−0.16 (−1.16)
Indirect effectsRMT1.22 *** (6.53)0.27 *** (4.00)0.11 ** (2.57)0.25 *** (6.40)0.85 *** (2.19)
industrialization0.99 (0.91)−0.32 (−0.55)−1.17 *** (−3.04)0.35 (1.08)−0.97 (−1.04)
urbanization3.60 *** (3.12)−1.71 *** (3.03)1.33 *** (3.42)−0.56 * (−1.77)2.75 *** (3.25)
economic−0.79 (−1.07)1.18 ** (2.75)−0.77 *** (−2.78)0.13 (0.58)−1.66 *** (−3.61)
gov8.01 *** (3.79)1.81 ** (2.11)3.19 *** (4.81)−0.27 (−0.44)2.95 *** (2.05)
*, **, and *** represent the significances at 10%, 5%, and 1% levels, respectively. Value of parentheses is t test value.
Publisher’s Note: MDPI stays neutral with regard to jurisdictional claims in published maps and institutional affiliations.

