Article

Construction of Ecological and Recreation Patterns in Rural Landscape Space: A Case Study of the Dujiangyan Irrigation District in Chengdu, China

College of Landscape Architecture, Sichuan Agricultural University, Chengdu 611130, China
*
Author to whom correspondence should be addressed.
Land 2022, 11(3), 383; https://doi.org/10.3390/land11030383
Submission received: 31 January 2022 / Revised: 1 March 2022 / Accepted: 2 March 2022 / Published: 5 March 2022
(This article belongs to the Special Issue Ecosystem Services of Rural Landscapes and Green Infrastructures)

Abstract

:
The rapid expansion of urbanization has promoted the prosperity of the economy and society but has also caused rural ecological problems. This study takes the Dujiangyan Irrigation District as an example, to construct ecological and recreation patterns, and it breaks through the pattern construction mode of using a single ecological factor that has been used in previous studies. We analyzed the impact of landscape connectivity and area thresholds at different scales on the selection of source areas, and integrated urban construction and human disturbance factors into resistance surface construction. Finally, a comprehensive landscape network combining “ecology and recreation” was determined through the minimum cumulative resistance model. Multiscale landscape connectivity analysis and area threshold setting greatly promoted the results of source identification. After optimization, we identified four ecological corridors and twenty-seven recreational corridors, and the regional landscape security pattern was significantly improved compared with the previous upper planning content. Therefore, this study provides a reference for regional long-term planning and has reference significance for the spatial protection and utilization of rapidly urbanizing areas.

1. Introduction

Since the 1980s, China’s rural land has expanded unprecedentedly with the development of society and the economy. This expansion trend has replaced the traditional farming and living space in rural areas with more modern and highly intensive production and lifestyles and has led to a series of ecological environment problems, such as the intensification of landscape fragmentation and the weakening of ecosystem services [1,2]. In this context, China has proposed the rural revitalization strategy, taking “ecological revitalization” as an important part of rural revitalization, bringing opportunities for the development of rural areas [3,4]. Therefore, from the perspective of landscape patterns, it is of great significance to explore the risks faced by landscape patterns, balance the relationship between rural ecological environmental protection and development and solve the contradiction in development from the perspective of environmental friendliness to optimize resource allocation, and promote the coordinated development of space.
At present, landscape pattern research is mature in ecology, and the application scenarios are also more extensive. By analyzing the characteristics and driving factors of spatio-temporal changes in landscape patterns, some researchers have discussed and analyzed the contribution degree of various elements in landscape patterns to space and the correlation, among various factors [5,6]. By analyzing the coupling degree between landscape patterns and ecosystem service function and value, some scholars have proposed key elements and specific measures to improve ecosystem service function [7]. However, most existing landscape pattern research relies on landscape index analysis, and landscape pattern research combined with spatial analysis is limited. At the same time, from the perspective of a single landscape characteristic and ecological functions, comprehensive consideration of all elements in an ecosystem is lacking, resulting in the analysis of the results of fragmentation. Based on the above problems, the ecological security pattern (ESP) has emerged at a historic moment. As an important part of a landscape pattern, the ESP plays a significant role in habitat patch arrangement, biodiversity maintenance, rational allocation of green infrastructure and the relationship between contents [8,9,10]. At the same time, related research on landscape patterns has gradually changed from the analysis of characteristics and factors to spatial allocation, function and structure [10,11].
With the continuous development of ESP theory, the “source identification; resistance surface construction; corridor extraction” method based on the minimum cumulative resistance model (MCR) and circuit theory has formed the basic pattern of pattern construction [12,13]. The principle is to identify the path of minimum cumulative resistance by analyzing the resistance of matter and energy diffusing through landscape space from the source. This method can better identify the connectivity between ESP internal and ecological processes [14]. Its advantage lies in the comprehensive consideration of the horizontal connection between landscape units rather than the vertical process within the landscape, so it can better reflect the organic connection within the ESP and has high practicability and wide application [15]. Some researchers use the MCR model to construct ESPs and propose methods and approaches for regional ecological restoration, which can provide useful reference for future regional development [16,17]. However, existing research on ESPs still has some problems. First, most existing studies on landscape security patterns focus on ESPs, which cannot fully reflect the comprehensive characteristics of landscape space under the influence of multiple factors, which makes the evaluation content one-sided. Second, for source identification, some studies directly select large-area habitat patches of good quality as the ecological source, and some studies comprehensively evaluate and identify the ecological source by constructing ecological security and sensitivity evaluation systems [11,18,19]. However, these methods pay too much attention to the functional attributes of the ecosystem itself and ignore the impact of landscape connectivity at different scales on the ecological process, making the identification results of ecological sources subjective [20,21,22]. Finally, resistance surfaces are constructed. In relevant studies, methods such as expert rating, the entropy weight method and resistance estimation are often used to classify a single factor of a land type through professional knowledge and experience [23,24]. However, such methods ignore the internal differences of similar land types and do not consider the impact of human activities on ecological resistance [25].
Based on the above literature analysis, firstly, this study hopes to solve the problem of a too subjective source identification through objective data analysis, so as to make the source identification results more scientific [26,27]. Secondly, for the construction of the resistance surface, the research expects to solve the problem of element singleness caused by the construction of the resistance surface only by land type, by integrating multi-factor combinations such as nature and the social economy, so as to realize the complete expression of resistance in the process of material and energy transfer [28,29,30]. Finally, this study expects to build a comprehensive pattern through the MCR model and solve the problem of single content in the research of spatial security patterns through the composite landscape pattern. At the same time, the comprehensive pattern also reflects the relationship between protection and construction and development, which can provide a reference for the future development of the region

2. Methods

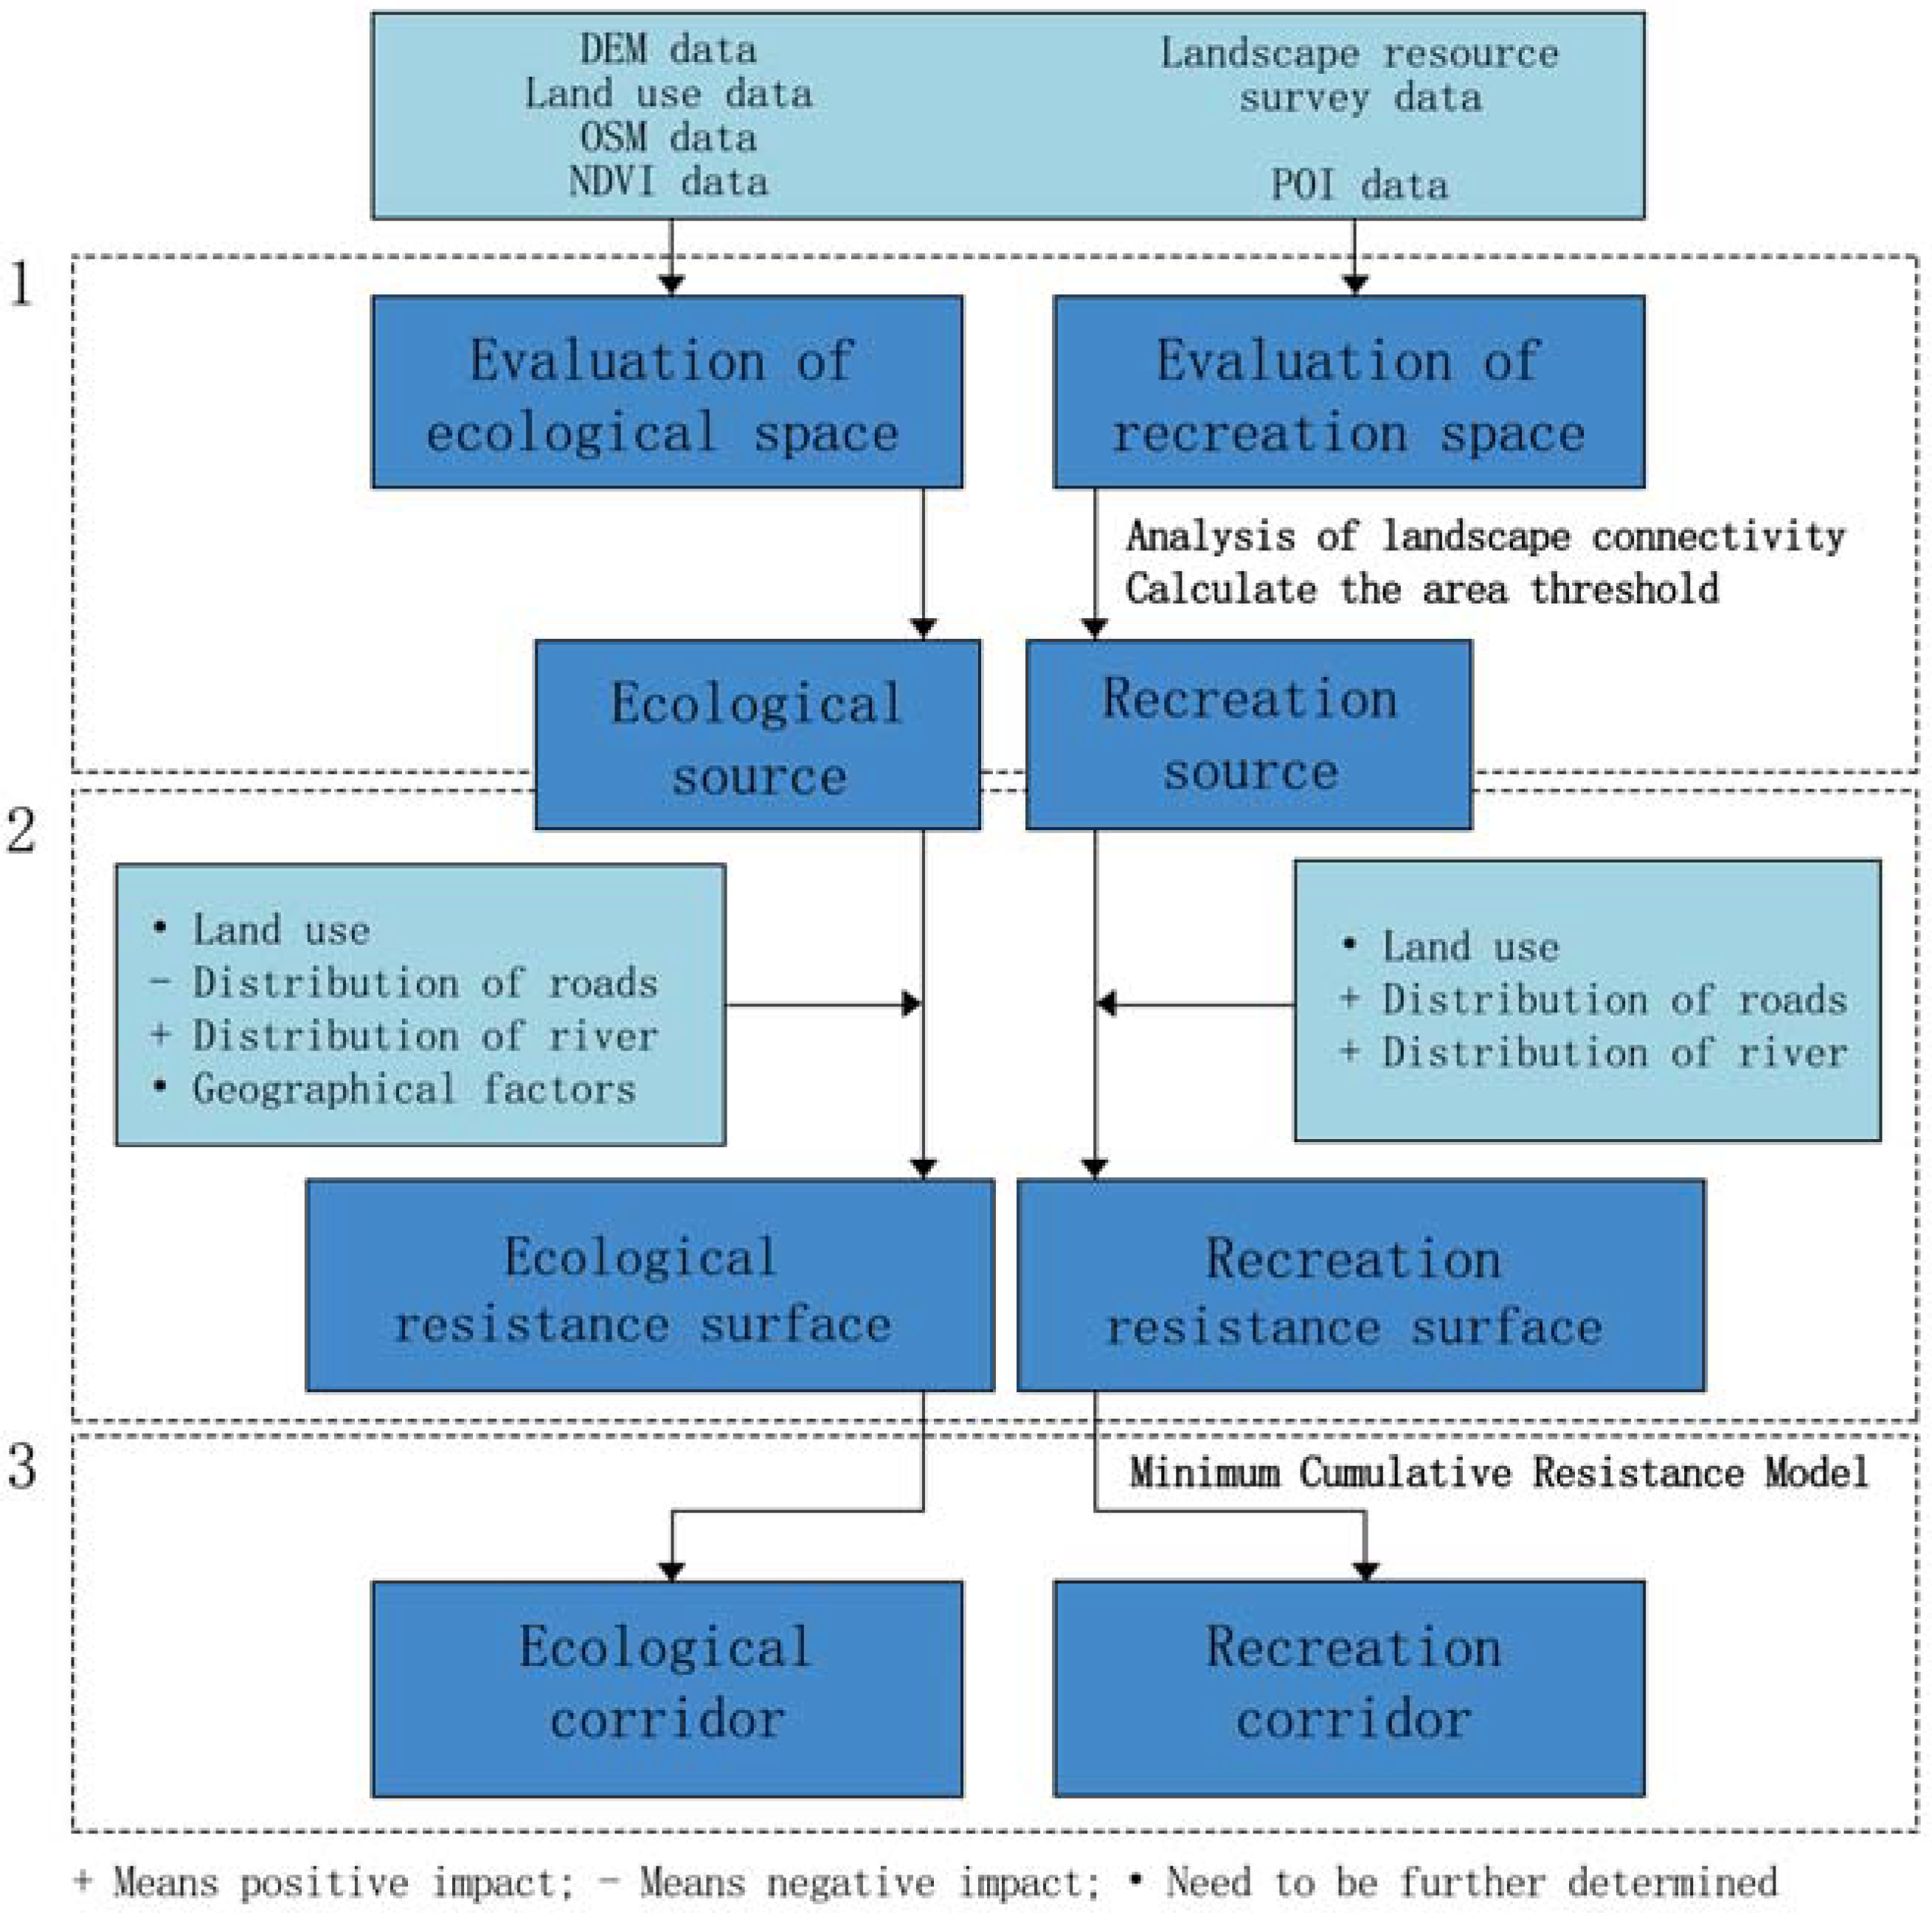
2.1. Research Design
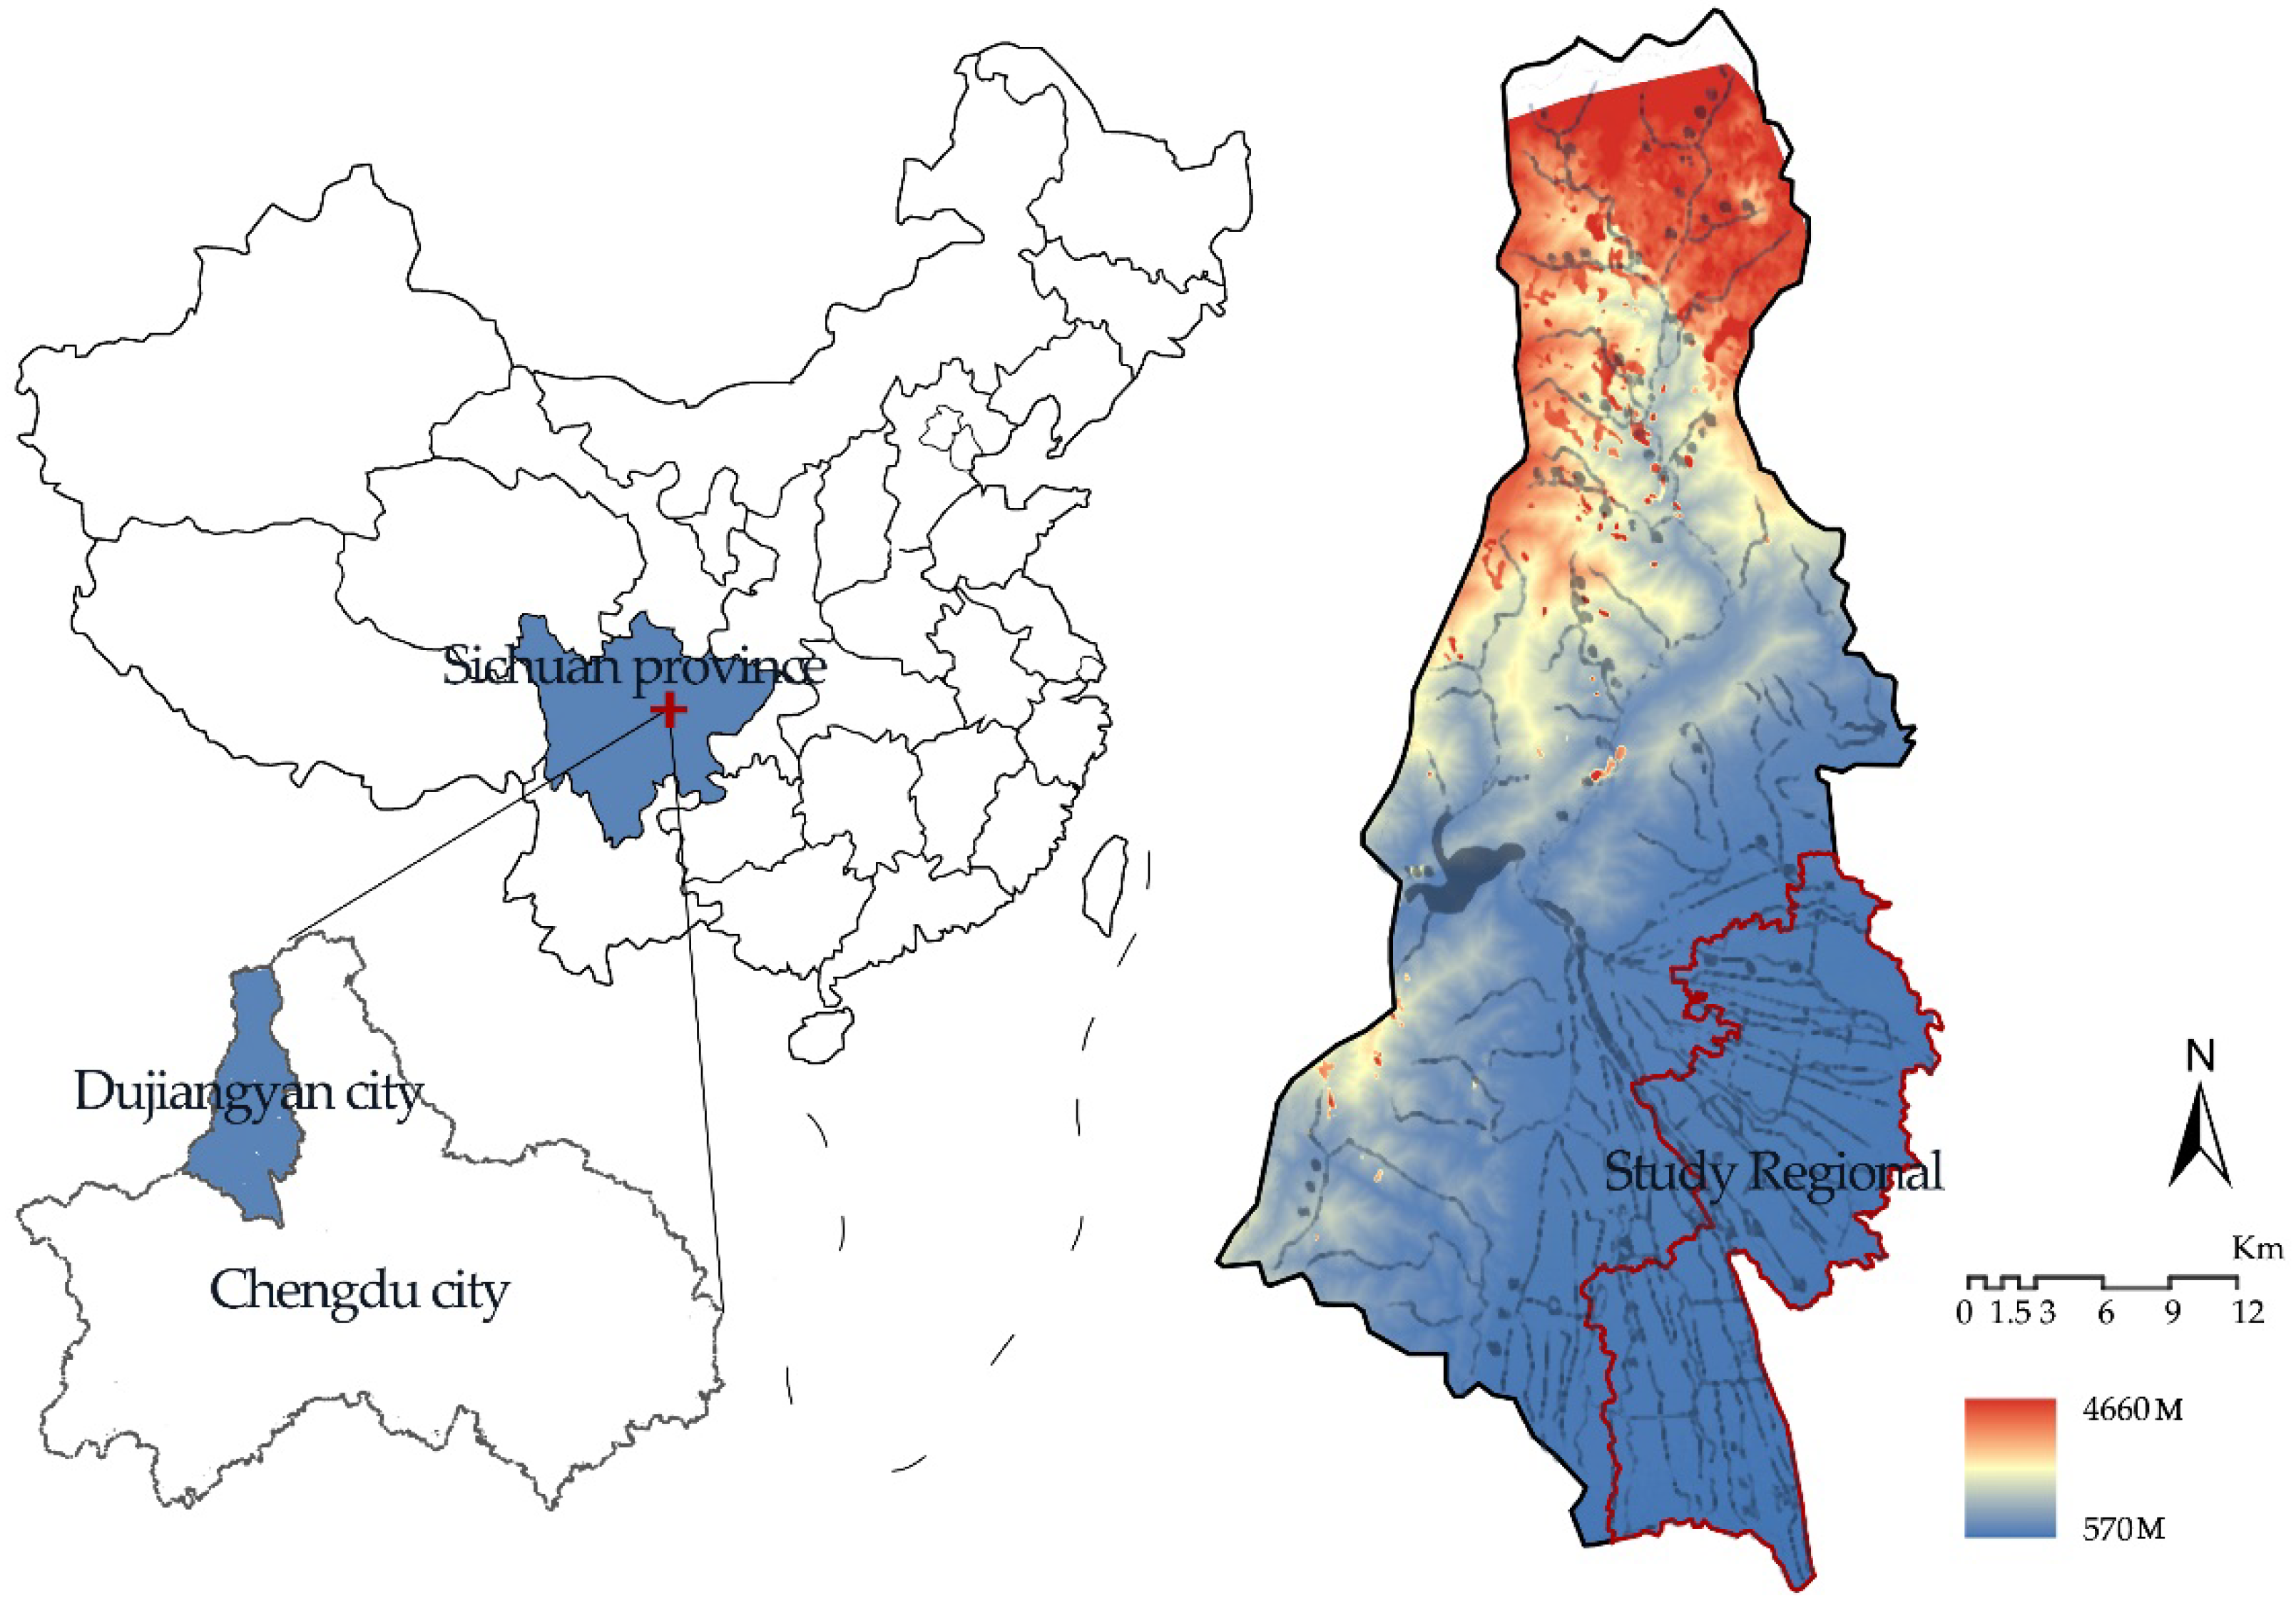
Relying on the basic model of “source identification; resistance surface construction; corridor extraction”, this study expects to build a comprehensive pattern integrating ecology and recreation, so as to realize the coordinated development of ecological protection and recreation development in this area. Firstly, for the identification of source areas, this study relies on the landscape evaluation results, selects the landscape index to analyze the landscape pattern connectivity and area threshold, and determines the scope of ecological and recreational source areas, respectively, with objective data, hoping to improve the accuracy and scientific nature of source area identification [31,32,33]. Secondly, based on the data of land-use types, roads, water systems, landform and geomorphic conditions, the ecological and recreational resistance surfaces are constructed, respectively, and the resistance surfaces integrating multiple elements can make the expression of ecological process closer to the real space [34]. Finally, the ecological and recreational corridors are identified based on the MCR model, and the comprehensive expression of spatial development, protection and utilization is realized by the compound landscape corridor [35] (Figure 1).

2.2. Study Area

Dujiangyan city is located west of Chengdu, the capital of China’s Sichuan Province. It received its name from the world-famous Dujiangyan Irrigation System. Dujiangyan Irrigation System is one of the few world heritage sites and has three main categories: World Natural Heritage, World Cultural Heritage and World Irrigation Engineering Heritage. Its water conservancy culture enjoys a strong reputation worldwide. The irrigation area affected by the Dujiangyan Irrigation System exceeds 7100 km2. Approximately 254 km2 of land is within the eastern plain area of Dujiangyan city, which in turn is located within the core area of the Dujiangyan Irrigation System (30°44′–31°02′ N, 103°0′–103°47′ E). The area has the geomorphological characteristics of a typical plain irrigation area and was selected as the scope of the study in this paper. The region covers three towns (approximately 80 villages) with a total population of 242,100. This area is an important implementation area of the rural revitalization strategy of Chengdu. By choosing this area as the research focus of this paper, we have a clear understanding of how landscape space should be protected and utilized under the background of the rural revitalization strategy (Figure 2).

2.3. Types of Data

The data types of this paper mainly include: (1) digital elevation model (DEM) data from the geospatial data cloud (http://www.gscloud.cn/ (accessed on 6 July 2021)), which are mainly used for the calculation of topographic factors; (2) land-use remote sensing images from the geospatial Data Cloud Platform of the Computer Network Information Center, Chinese Academy of Sciences (http://www.gscloud.cn/ (accessed on 8 July 2021)). The Landsat 8 OLI-TIRS image for 28 July 2020 (Scene No. 129-039), during a period of good plant growth and low cloud cover, was selected as the interpretation data source, which was mainly used for processing and analysis to obtain land-use types; (3) Open Street Map (OSM) data from the Open Street Map website (https://www.openstreetmap.org/ (accessed on 25 November 2020)), which were used for spatial network analysis and human activity disturbance analysis; (4) the Normalized Difference Vegetation Index (NDVI), which originated from the Chinese Academy of Sciences Resources and Environment Data Service Center (http://www.resdc.cn/Default.aspx (accessed on 8 July 2021)) and was mainly used for measuring regional vegetation coverage; (5) point of interest (POI) data that were derived from AmAP (https://lbs.amap.com/ (accessed on 27 May 2021)) and mainly used to analyze the distribution of various service facilities in the region; (6) the water system map of the Dujiangyan Irrigation District (including the irrigation system) and survey data of landscape resources, which were obtained from the Dujiangyan Irrigation District Management Committee and mainly used for water system analysis; and (7) the survey data of landscape space feeling, which were mainly used for the evaluation of recreational space. The usage method and process of specific data sources are specifically introduced in the research methods.

2.4. Analysis

2.4.1. Construction of Ecological and Recreational Space

Spatial construction is the cornerstone used to realize pattern optimization. In view of the current situation of natural and cultural landscapes in the research region, considering the accessibility of data and referring to relevant literature, the study started from the two aspects of the “natural environment and degree of human disturbance”. The evaluation factors of ecological space included elevation, slope, slope aspect, water area, land use, vegetation coverage, disturbance of development and construction to the ecological environment (road distribution, residential area and population density distribution). For recreational space, this paper selected five recreational factors: distribution of tourism resources and facilities, distribution of cultural relics and historical sites and potential tourism resources, human demand for recreational activities and leisure space. Finally, the evaluation framework of ecological and recreational space was constructed based on the elements and references of relevant literature [36,37,38,39,40,41,42].
Then, for the weight determination of each index, the weighting method of subjective and objective combinations of the weighting method (analytic hierarchy process (AHP) and entropy weight method) was performed using ArcGIS software to achieve layer stacking to complete the construction of ecological and recreational spaces. Among them, the weight result calculated by the AHP method shows that the heterogeneity ratio of the criterion layer (B) combination CR = 0.0518 and that the consistency ratio of the sub-criterion layer (C) combination CR = 0.0538, both of which are less than the threshold value of 0.1, indicating that the judgment matrix passes the consistency test and the weight calculated is meaningful. Finally, according to the result of superposition, the natural discontinuities’ classification method (Jenks) on spatial analysis level 5 drawings was used for classification; the categories included the following values: 1 (not sensitive area); 3 (low sensitivity); 5 (moderately sensitive area); 7 (highly sensitive area); and 9 (extremely sensitive area), with lower grades indicating less sensitive landscape space and more benefits for the development of the space and construction (see details from Table A1 in Appendix A) [41,42].

2.4.2. Analysis of Multiscale Landscape Connectivity

Landscape connectivity refers to the degree to which landscape promotes or hinders material flow, energy flow and information flow. Maintaining good landscape connectivity has a dominant influence on regional ecological process development [36,41]. However, landscape connectivity has a strong scale dependence. When the scale changes, smaller patches in landscape space are constantly fused by adjacent or connected patches to form new spatial patches, and landscape connectivity changes [43,44,45]. Therefore, through repeated attempts at landscape spatial suitability at different scales, seven grid files with different sampling scales of 30, 60, 120, 240, 480, 960 and 1800 m were set. Based on previous research experience, six landscape indices, CONHESION, AI, CONTAG, SHDI, SHEI and DIVISION, were selected. The changes in landscape connectivity under different scale conditions were calculated in Fragstats [43,46,47,48,49]. Notably, CONHESION, AI and CONTAG indicate that dominant patches in landscape space are well connected, while larger SHDI and DIVISION values indicate the landscape is more fragmented and less connected.

2.4.3. Principal Component Analysis

Principal component analysis (PCA) is a method used to simplify and assign weights to high-dimensional variables. PCA can assign the influence degree of relevant variables to corresponding principal component factors. This study used this method to objectively evaluate the overall connectivity of landscape space at different scales and calculated the comprehensive index within the research scope, according to the index of each constraint factor. The composite index is defined as a weighted sum of the principal component, and the right to reuse a variance contribution rate of each principal component is related; finally, this method obtains the ecological source to identify the best space dimension [36,49]. The formula is as follows:
E S I = j = 1 m p i j w j
where ESI is the spatial index of unit i, Pij is the Jth index of unit i, wj is the weight of each index.
However, because the sources and dimensions of different indicators are not unified, the indicators are not comparable; thus, they need to be standardized. Then, the landscape index can be substituted into the weight formula of the spatial PCA results to complete the calculation of the overall connectivity composite index. The min–max normalization method was used [50]. The formula is as follows:
Direct   indicator : K i = ( X i X m i n ) ( X m a x X m i n ) Contrary   indicator : K i = ( X m a x X i ) ( X m a x X m i n )
where Xi is the measured value of index i, Xmax is the maximum value of index i, Xmin is the minimum value of index i, and Ki is the standardized value of the indicator.

2.4.4. Construction of the Resistance Surface

The resistance surface refers to the carrier of the obstructed degree of species migration in the corridor, and its construction principle is constructed by calculating the cost of material flow, energy flow and information flow spreading among different landscape patches under the action of various resistance elements [29]. Relevant studies usually adopt land-use type data and set different resistance coefficients for different land-use types, such as forestland, water systems and other green space resistance coefficients, which take the minimum value, and construction land and other land-use types, which take the maximum value [34,35]. Therefore, the method of using land-use type as a dominant factor in the resistance surface, and using road classification, water and terrain factors as auxiliary correction, was completed by referencing the relevant literature to determine the assignment of elements. The resistance value was incorporated into the data to form the resistance surface (Table 1). After the construction of the resistance surface was completed, the Jenks method was adopted to divide the cumulative cost of the landscape into the three resistance grades of low, medium and high according to the overall resistance [48,49].

2.4.5. Identification of Corridors

A corridor is a channel connecting different sources and an important guarantee to meet the flow of regional matter, energy and information. The identification and optimization of corridors is conducive to enhancing the stability and integrity of regional functions [50,51]. The MCR model is usually used to analyze the identification of corridors. Its principle is to determine the minimum cost distance between different “sources” and connecting targets through resistance, which has wide adaptability. Therefore, this paper uses the MCR model to calculate ecological and recreational corridors [12,13,14,52]. The formula is as follows:
M C R = f min j = n i = 1 D i j × R i
where MCR is the minimum cumulative resistance value, Dij is the spatial distance of species from source j to landscape unit i, and Ri is the resistance coefficient of landscape unit i to species movement. ƒ represents a positive correlation between minimum cumulative resistance and ecological processes.

3. Results

3.1. Spatial Distribution of Ecological and Recreational Patterns

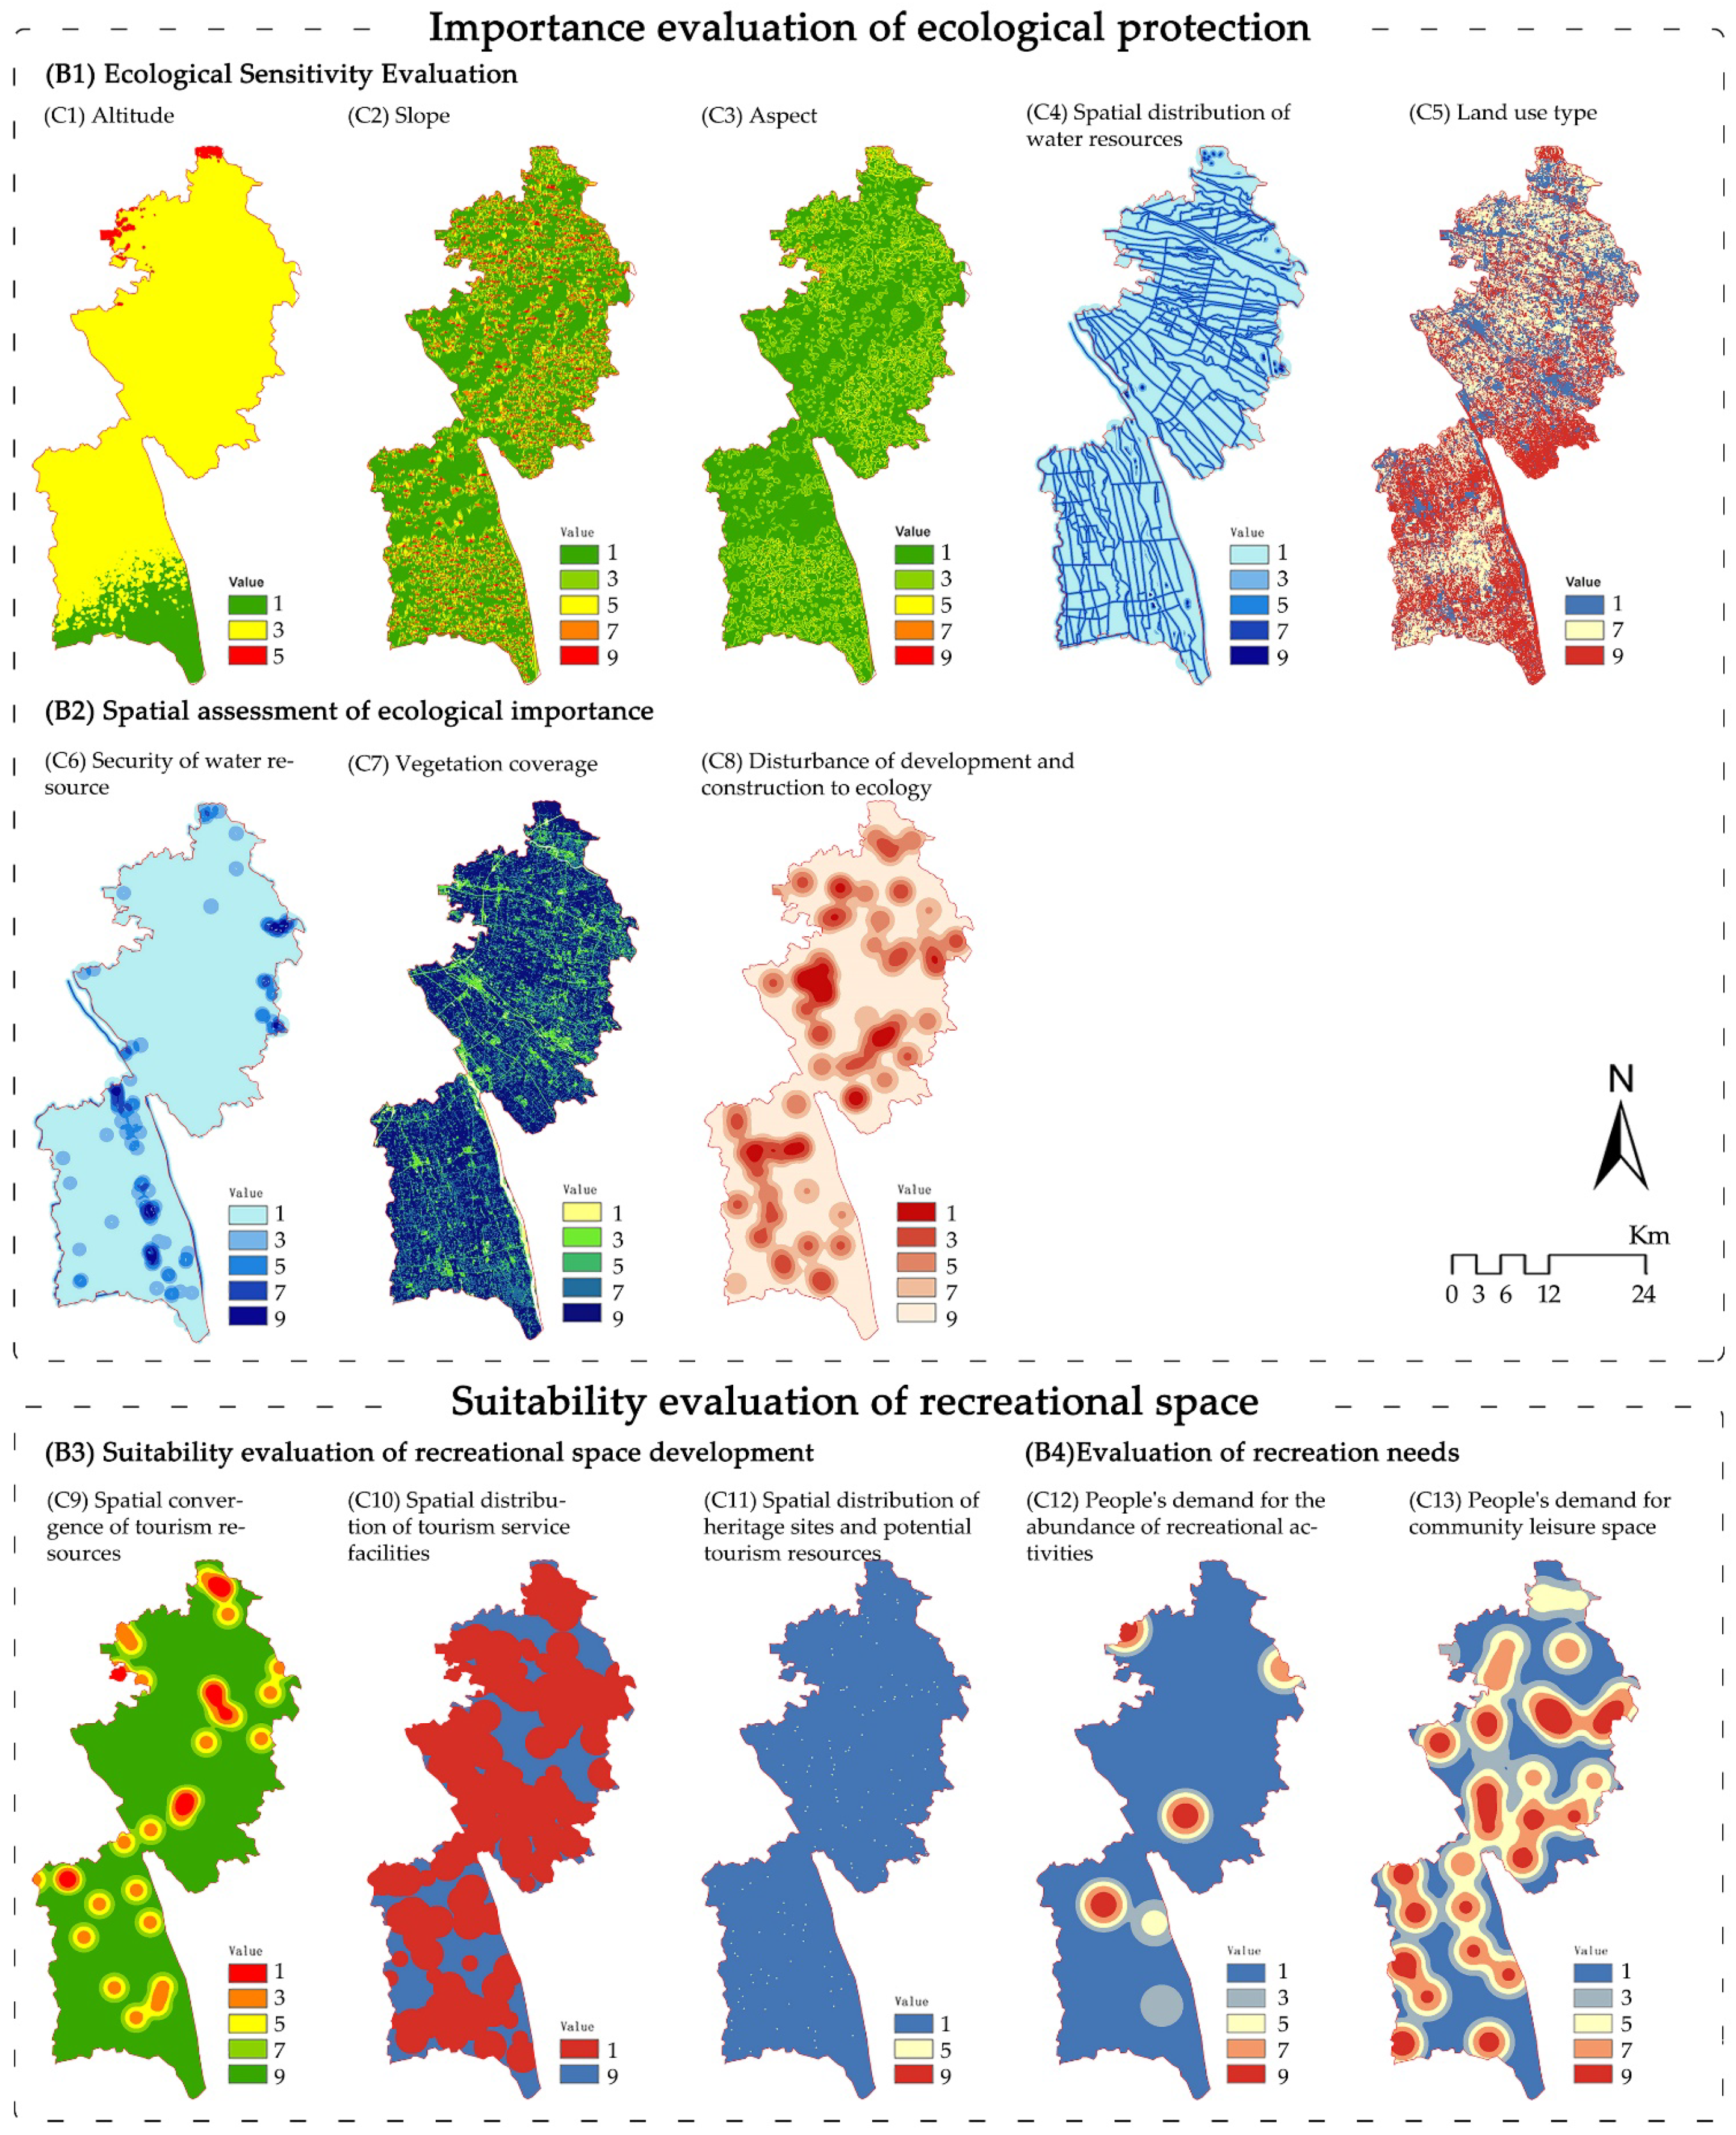
3.1.1. Spatial Analysis of a Single Factor

The spatial distribution of single elements in the Dujiangyan Irrigation District revealed the influence and effect of different influence factors on the overall ecology and recreational space of the region (Figure 3). Among the 13 data indicators, except C8 and C9, the data were all positively distributed (that is, the higher the value was, the higher the spatial sensitivity was). On the overall spatial distribution, the single factors of C1, C2 and C4 were natural factors, such as distribution in the space, and were relatively fragmented. C5, C7, C8 and other factors were greatly influenced by human activities, as evident in the town domain space and the surrounding space. The difference in the C5 and C7 of the two drawings, the central areas and the northern areas showed obvious low information. Additionally, C8 showed obvious aggregation in the high-value area around the town affected by human activities.
According to the eight single factor analysis drawings of ecological protection importance, it was found that the regional water network was densely covered, there were good water landscape resources and the vegetation coverage was high, showing a good aggregation of ecological resources. However, the influence range of disturbance factors has exceeded the limits of the towns, which is not conducive to the protection of ecological space.

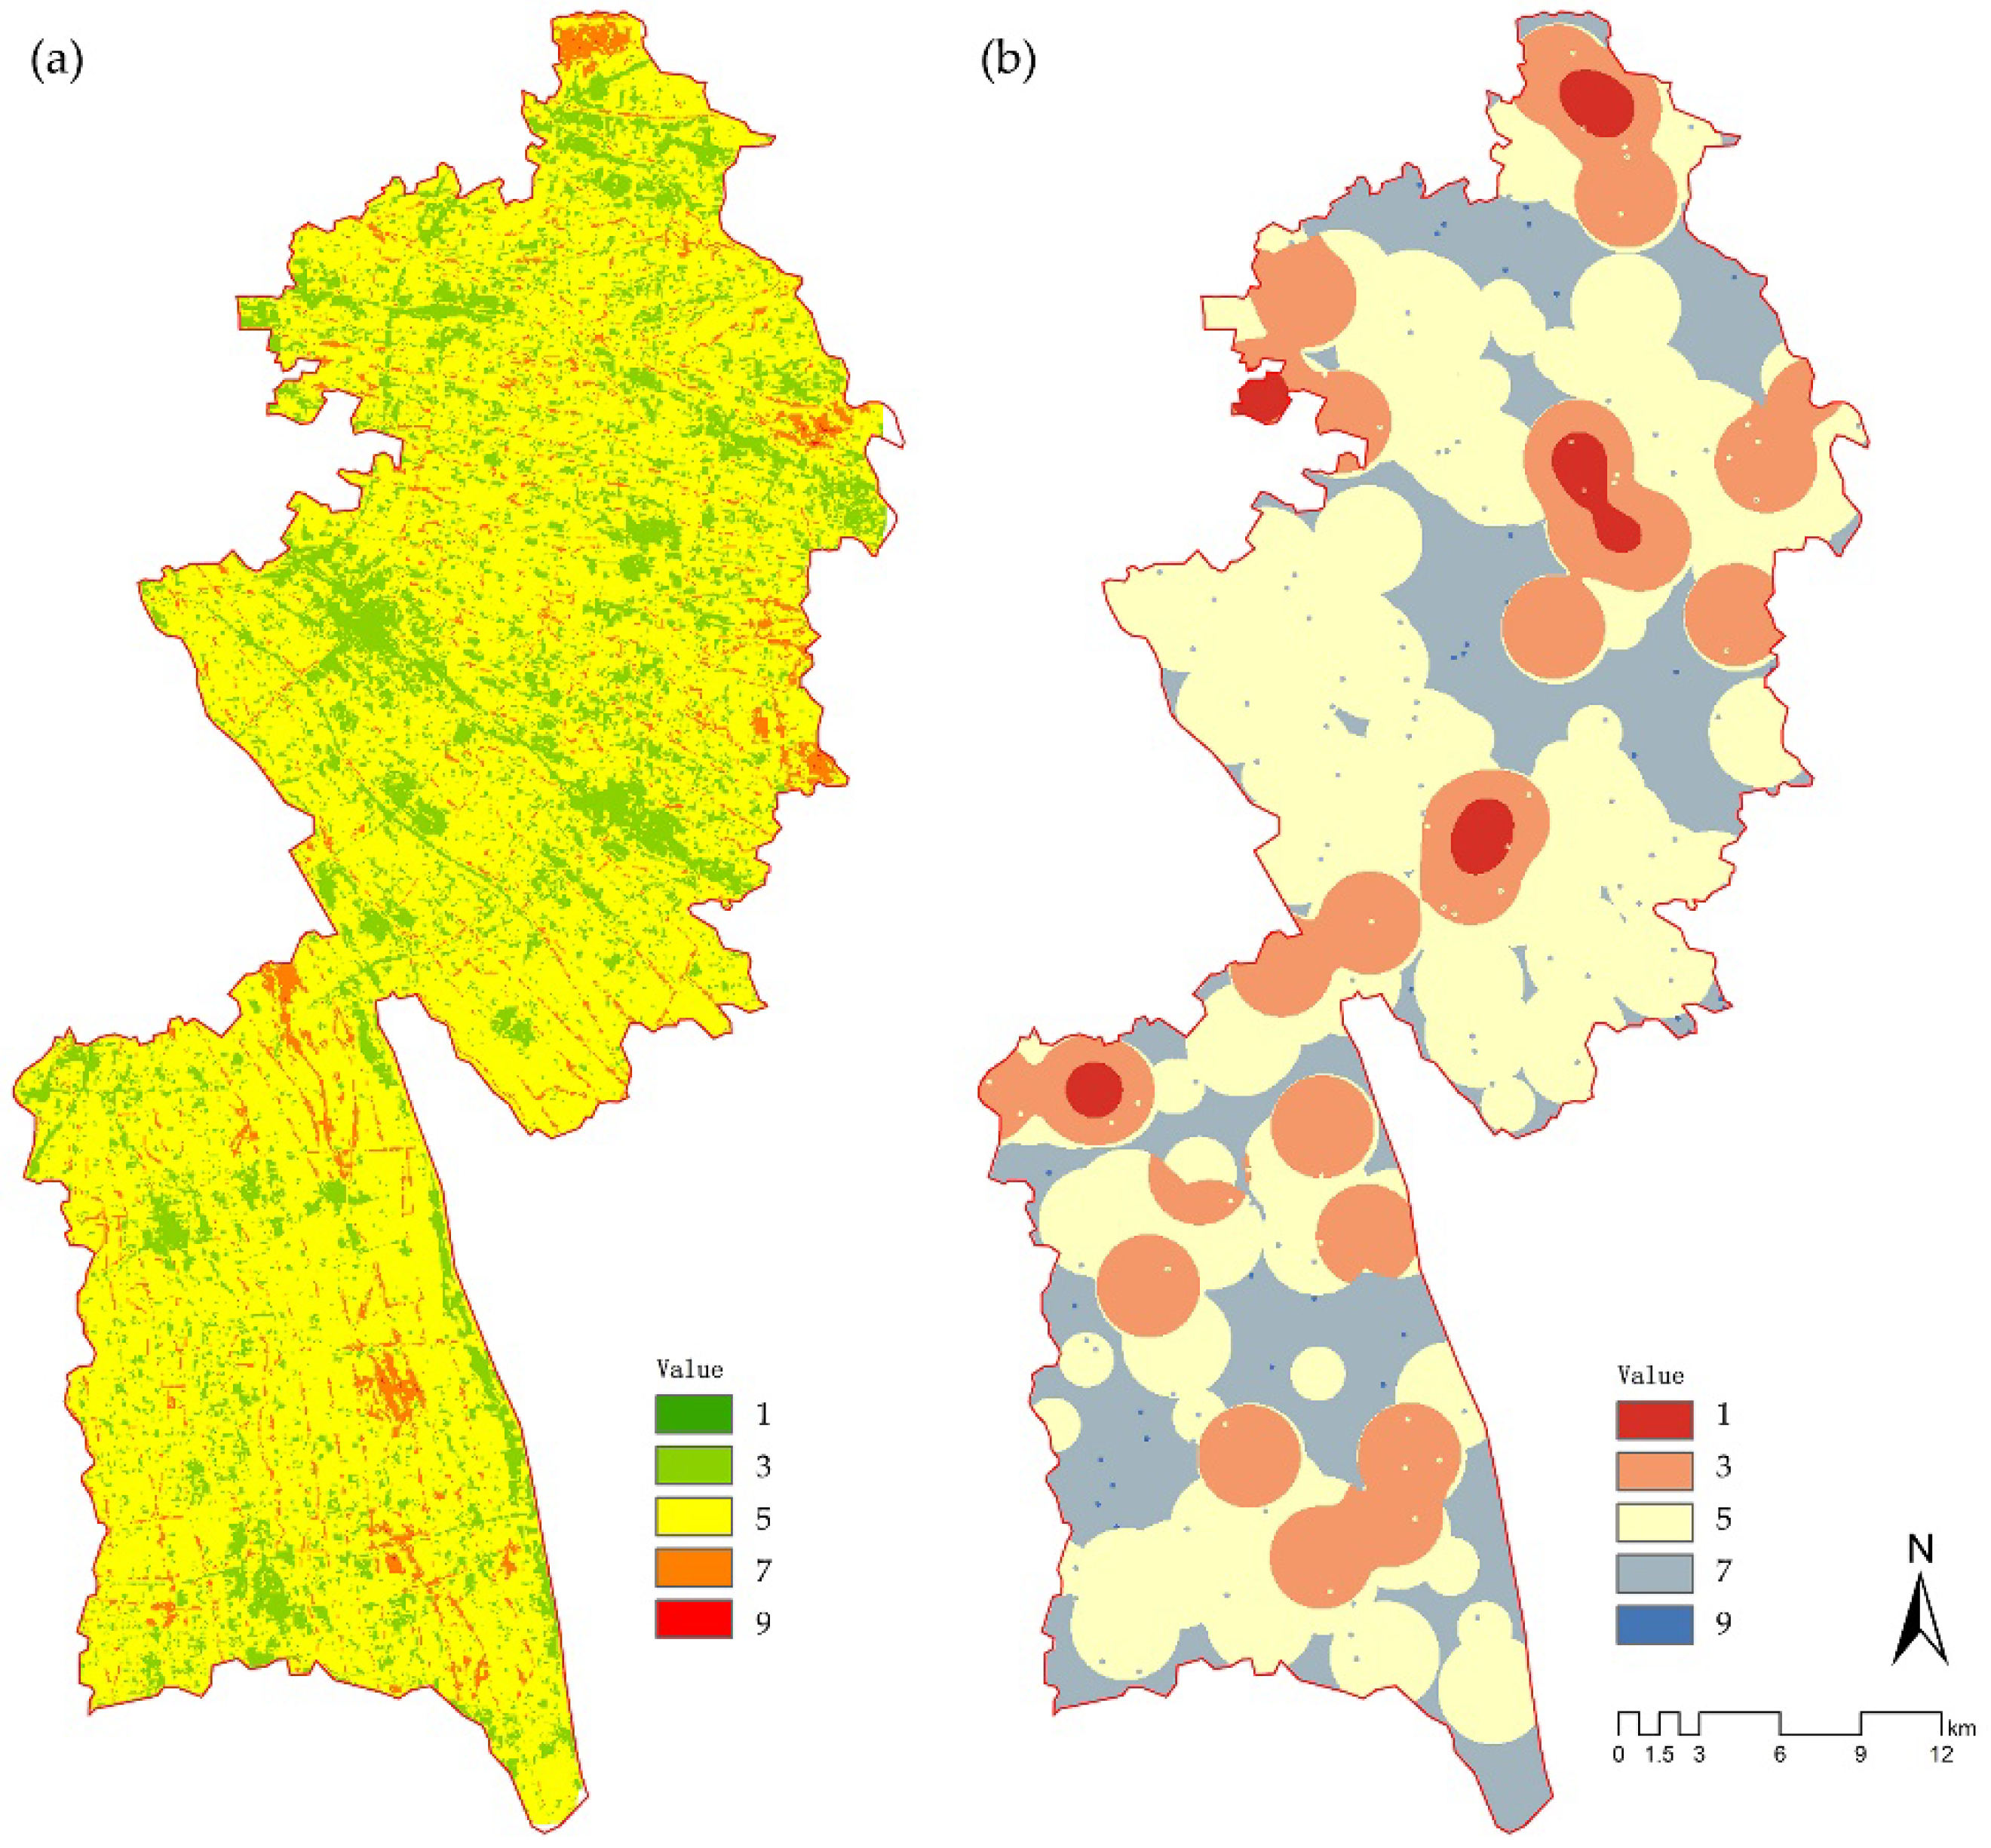
3.1.2. Analysis of Ecological and Recreational Spatial Patterns

The spatial pattern of the evaluation results of the study area in accordance with the sensitivity was divided into five grades, 1, 3, 5, 7, and 9 (the higher the value was, the higher the sensitivity), to obtain the spatial pattern of the ecology and tourism of the Dujiangyan Irrigation District. The proportion of ecological space grades from low to high was 0.001%, 20.59%, 74.21%, 5.18%, and 0.02%, respectively (Figure 4a). The proportion of recreational space grade from low to high was 2.21%, 22.59%, 50.61%, 24.49% and 0.10%, respectively (Figure 4b).
Regarding the sensitive areas on the spatial distribution of ecological space, highly sensitive areas were mainly concentrated in the northern area, the eastern mountain area and the southern area along the river, and the ecological safety space was relatively low. The areas with low sensitivity were mainly located in the middle, north and southwest of the region and formed a more obvious spatial boundary with the town. The grades of recreational space were scattered in space, showing an obvious trend of spatial aggregation.

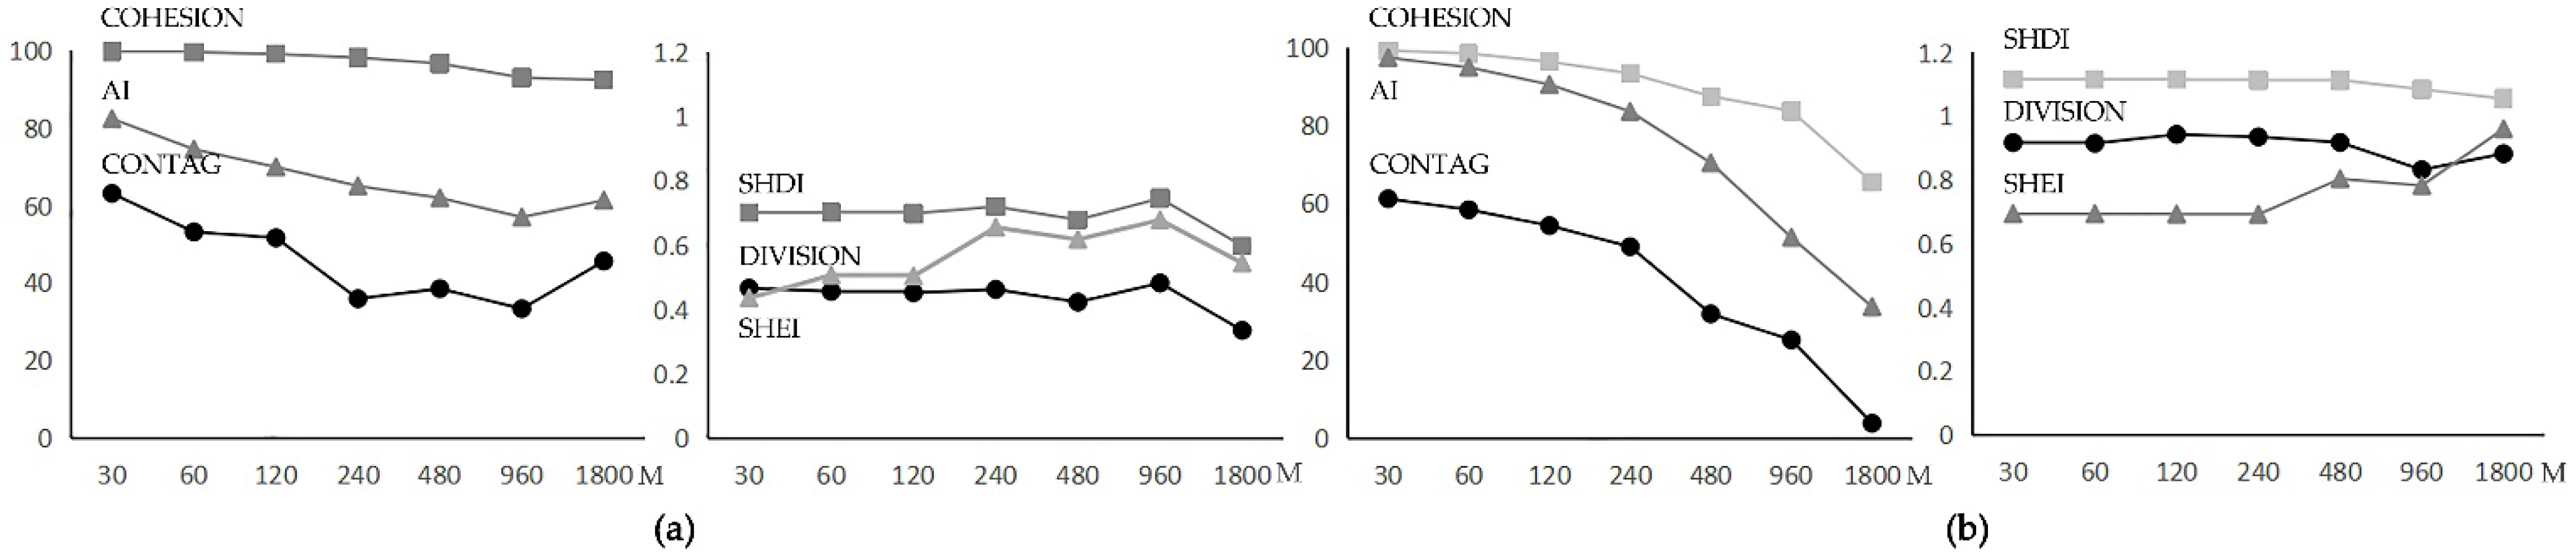
3.2. Changes in Landscape Connectivity and Scale

By analyzing the different scales of landscape ecology and the tourism connectivity index, the CONHESION, AI, CONTAG, SHDI, SHEI, and DIVISION landscape connectivity measure indices were selected, and different scales were obtained by computing the scatterplot [31,32,33,38]. The connectivity of ecological and recreational spaces showed obvious differences in scale. The AI and CONTAG indices of ecological space both first decreased and then increased, and the CONTAG index decreased sharply at the 120 m scale and then showed a fluctuating trend. The SHDI, DIVISION and SHEI all first increased and then decreased, with high values at the 960 m scale (Figure 5a). For recreational space, except for SHEI, the other indices showed a downward trend, and SHEI showed almost no change at 30–240 m but increased gradually after the 240 m and 1800 m peaks (Figure 5b).
Based on the index analysis results of the six indicators of ecological and recreational spaces corresponding to different scales, PCA was further conducted. By analyzing the statistical results of the variance contribution rate (see details from Appendix A, Table A2), the principal component matrix of one ecological space and two recreational spaces was extracted (Table 2). Principal component 1 of ecological and recreational space had higher loading coefficients of AI, CONTAG and COHESION, which reflected the aggregation connectivity of the ecological security zone. The higher DIVISION of recreational space reflected the degree of separation and fragmentation of recreational space. This was also consistent with the spatial distribution of recreational sensitivity mentioned above.
In this study, the weight was calculated by the PCA method, and then the relationship between principal components and research items was calculated to obtain the “component score coefficient matrix”. The expression order of the principal component function of ecological (4) and recreational (5) factors is as follows:
Ecological principal component factor 1 = 0.187 ∗ CONTAG + 0.187 ∗ COHESION + 0.136 ∗ DIVISION + 0.183 ∗ SHDI − 0.181 ∗ SHEI + 0.189 * AI
Recreational principal component factor 1 = 0.269 ∗ CONTAG + 0.246 ∗ COHESION + 0.092 ∗ DIVISION + 0.036 ∗ SHDI − 0.256 ∗ SHEI+ 0.286 ∗ AI
Recreational principal component factor2 = −0.144 ∗ CONTAG + 0.147 ∗ COHESION + 0.416 ∗ DIVISION + 0.436 ∗ SHDI + 0.194 ∗ SHEI − 0.006 ∗ AI
Since recreation includes two principal component matrices, its comprehensive score should be calculated by multiplying the variance interpretation rate and component score [53]. The formula is as follows:
0.605 ∗ Recreational principal component factor 1 + 0.395 ∗ Recreational principal component factor 2
Then, standardized landscape index data of ecological space were substituted into Formula (4), and recreational space data were substituted into Formulas (5) and (6) to obtain the overall connectivity composite index at different scales [43,54]. Based on the comprehensive index of ecological and recreational space, this study selected the inflection point (120 m) of ecological space decline as the best scale for ecological source identification (Figure 6a). For recreational space, the overall declining trend was significant, so the 30 m scale was selected as the best scale for recreational space source identification (Figure 6b).

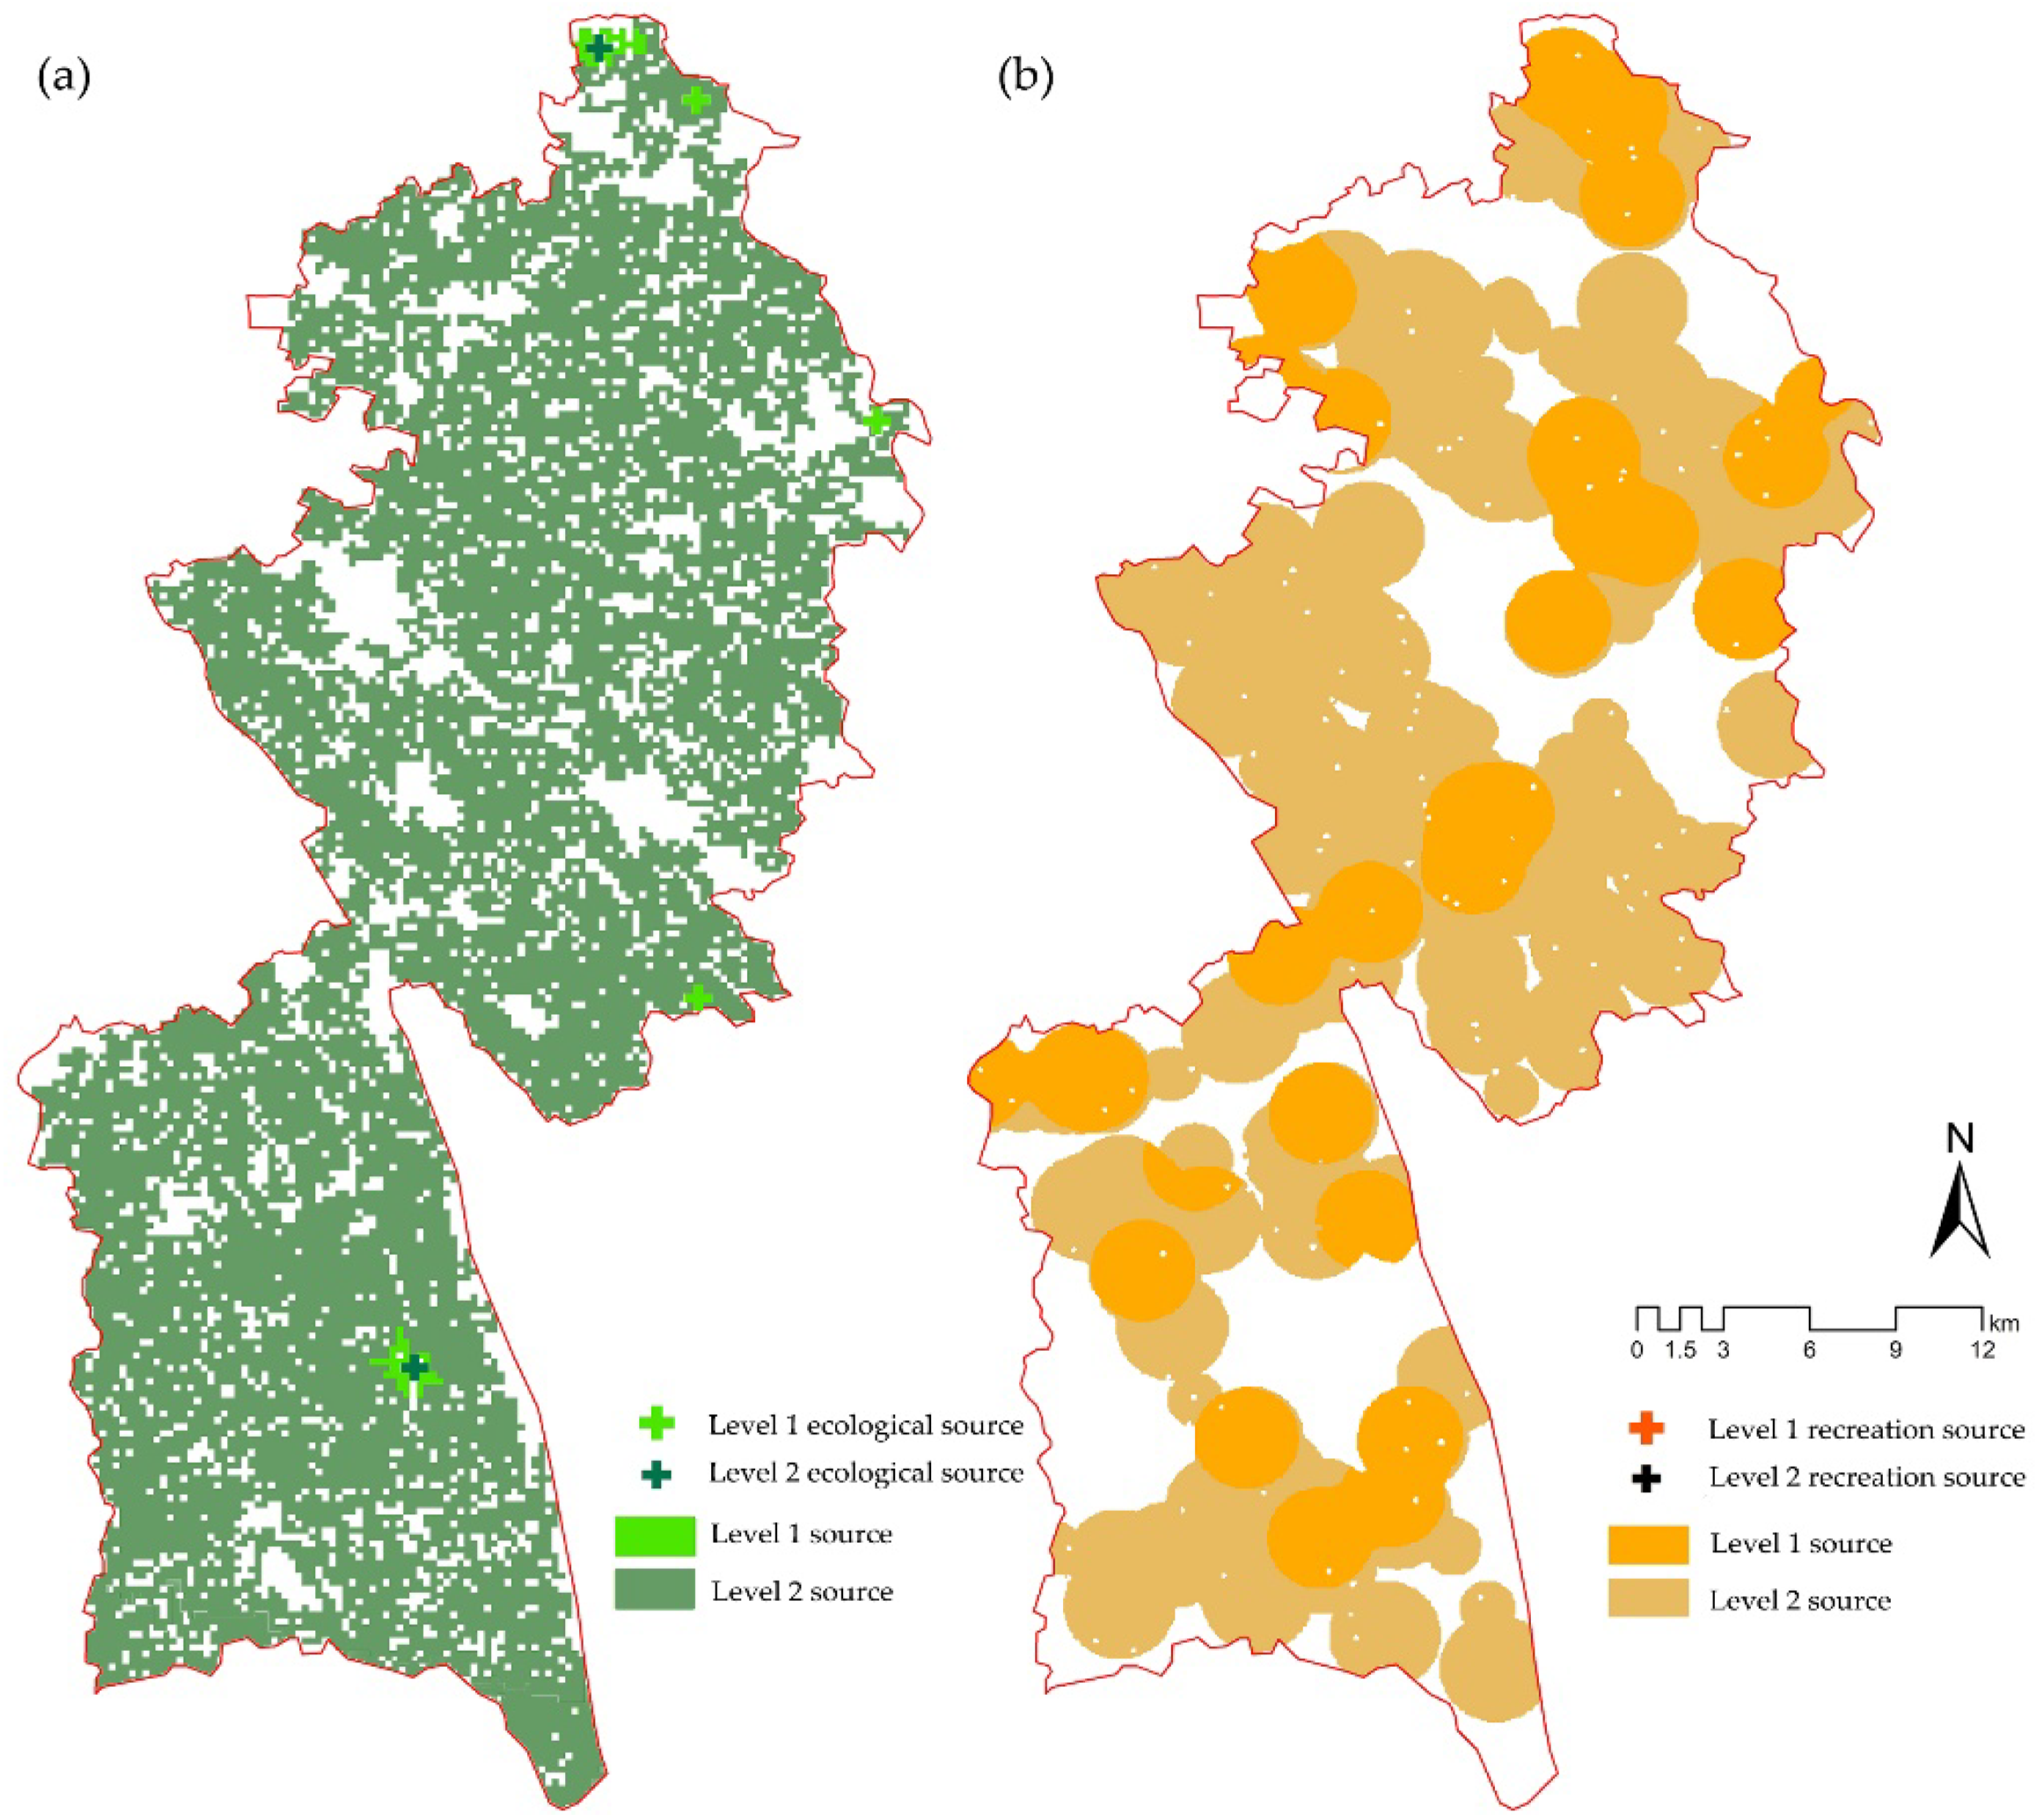
3.3. Identify Ecological and Recreational Sources

3.3.1. Set the Minimum Area Threshold

The size of landscape patches will have an impact on the integrity of space, so it is necessary to determine the minimum patch area in the process of source identification [48]. In this study, by setting different area thresholds, the number of patches above the threshold was statistically analyzed to obtain a scatter diagram of the change in patch number and area ratio in ecological and recreational space. For ecological space, when the area threshold increased to 0.6 km2, the proportion of ecological patches and area decreased gently, indicating that although more patches were removed with the increase in area, the area of these patches was small and had little impact on the overall ecological pattern. Therefore, 0.6 km2 was selected as the area threshold for ecological source identification (Figure 7a). For the recreational space, the decrease ratio between the number of spatial patches and area gradually decreased after 0.8 km2, so 0.8 km2 was selected as the area threshold of the recreational space (Figure 7b).

3.3.2. Source Identification

After completing the screening of the scale and minimum area threshold, the spatial patches in this study were further screened by querying the evaluation and assignment attributes of patches, taking five points (moderately sensitive area) as the boundary, and a total of 32 source patches were obtained, including 5 ecological source patches and 27 recreational source patches, which were divided into 2 levels of source patches through sensitivity classification. Among them, the ecological source area was 182.6 km2 (accounting for 71.89% of the total area), and the recreational source area was 185.95 km2 (accounting for 73.21% of the total area). Among the ecological sources, the secondary ecological sources covered a large area, while the primary sources were distributed on the slopes in the north of the region and a small amount in the areas with rich vegetation in the south (Figure 8a). The spatial distribution of recreational sources was basically consistent with the evaluation content, showing the characteristics of a clustered distribution in space (Figure 8b). Finally, this study identified the ecological/recreational source points at each level through the ArcGIS point transfer tool. The regional ecological/recreational source points were mainly concentrated in the east and south, and the source points were less distributed in the west due to their proximity to the Dujiangyan city area and more cities and towns.

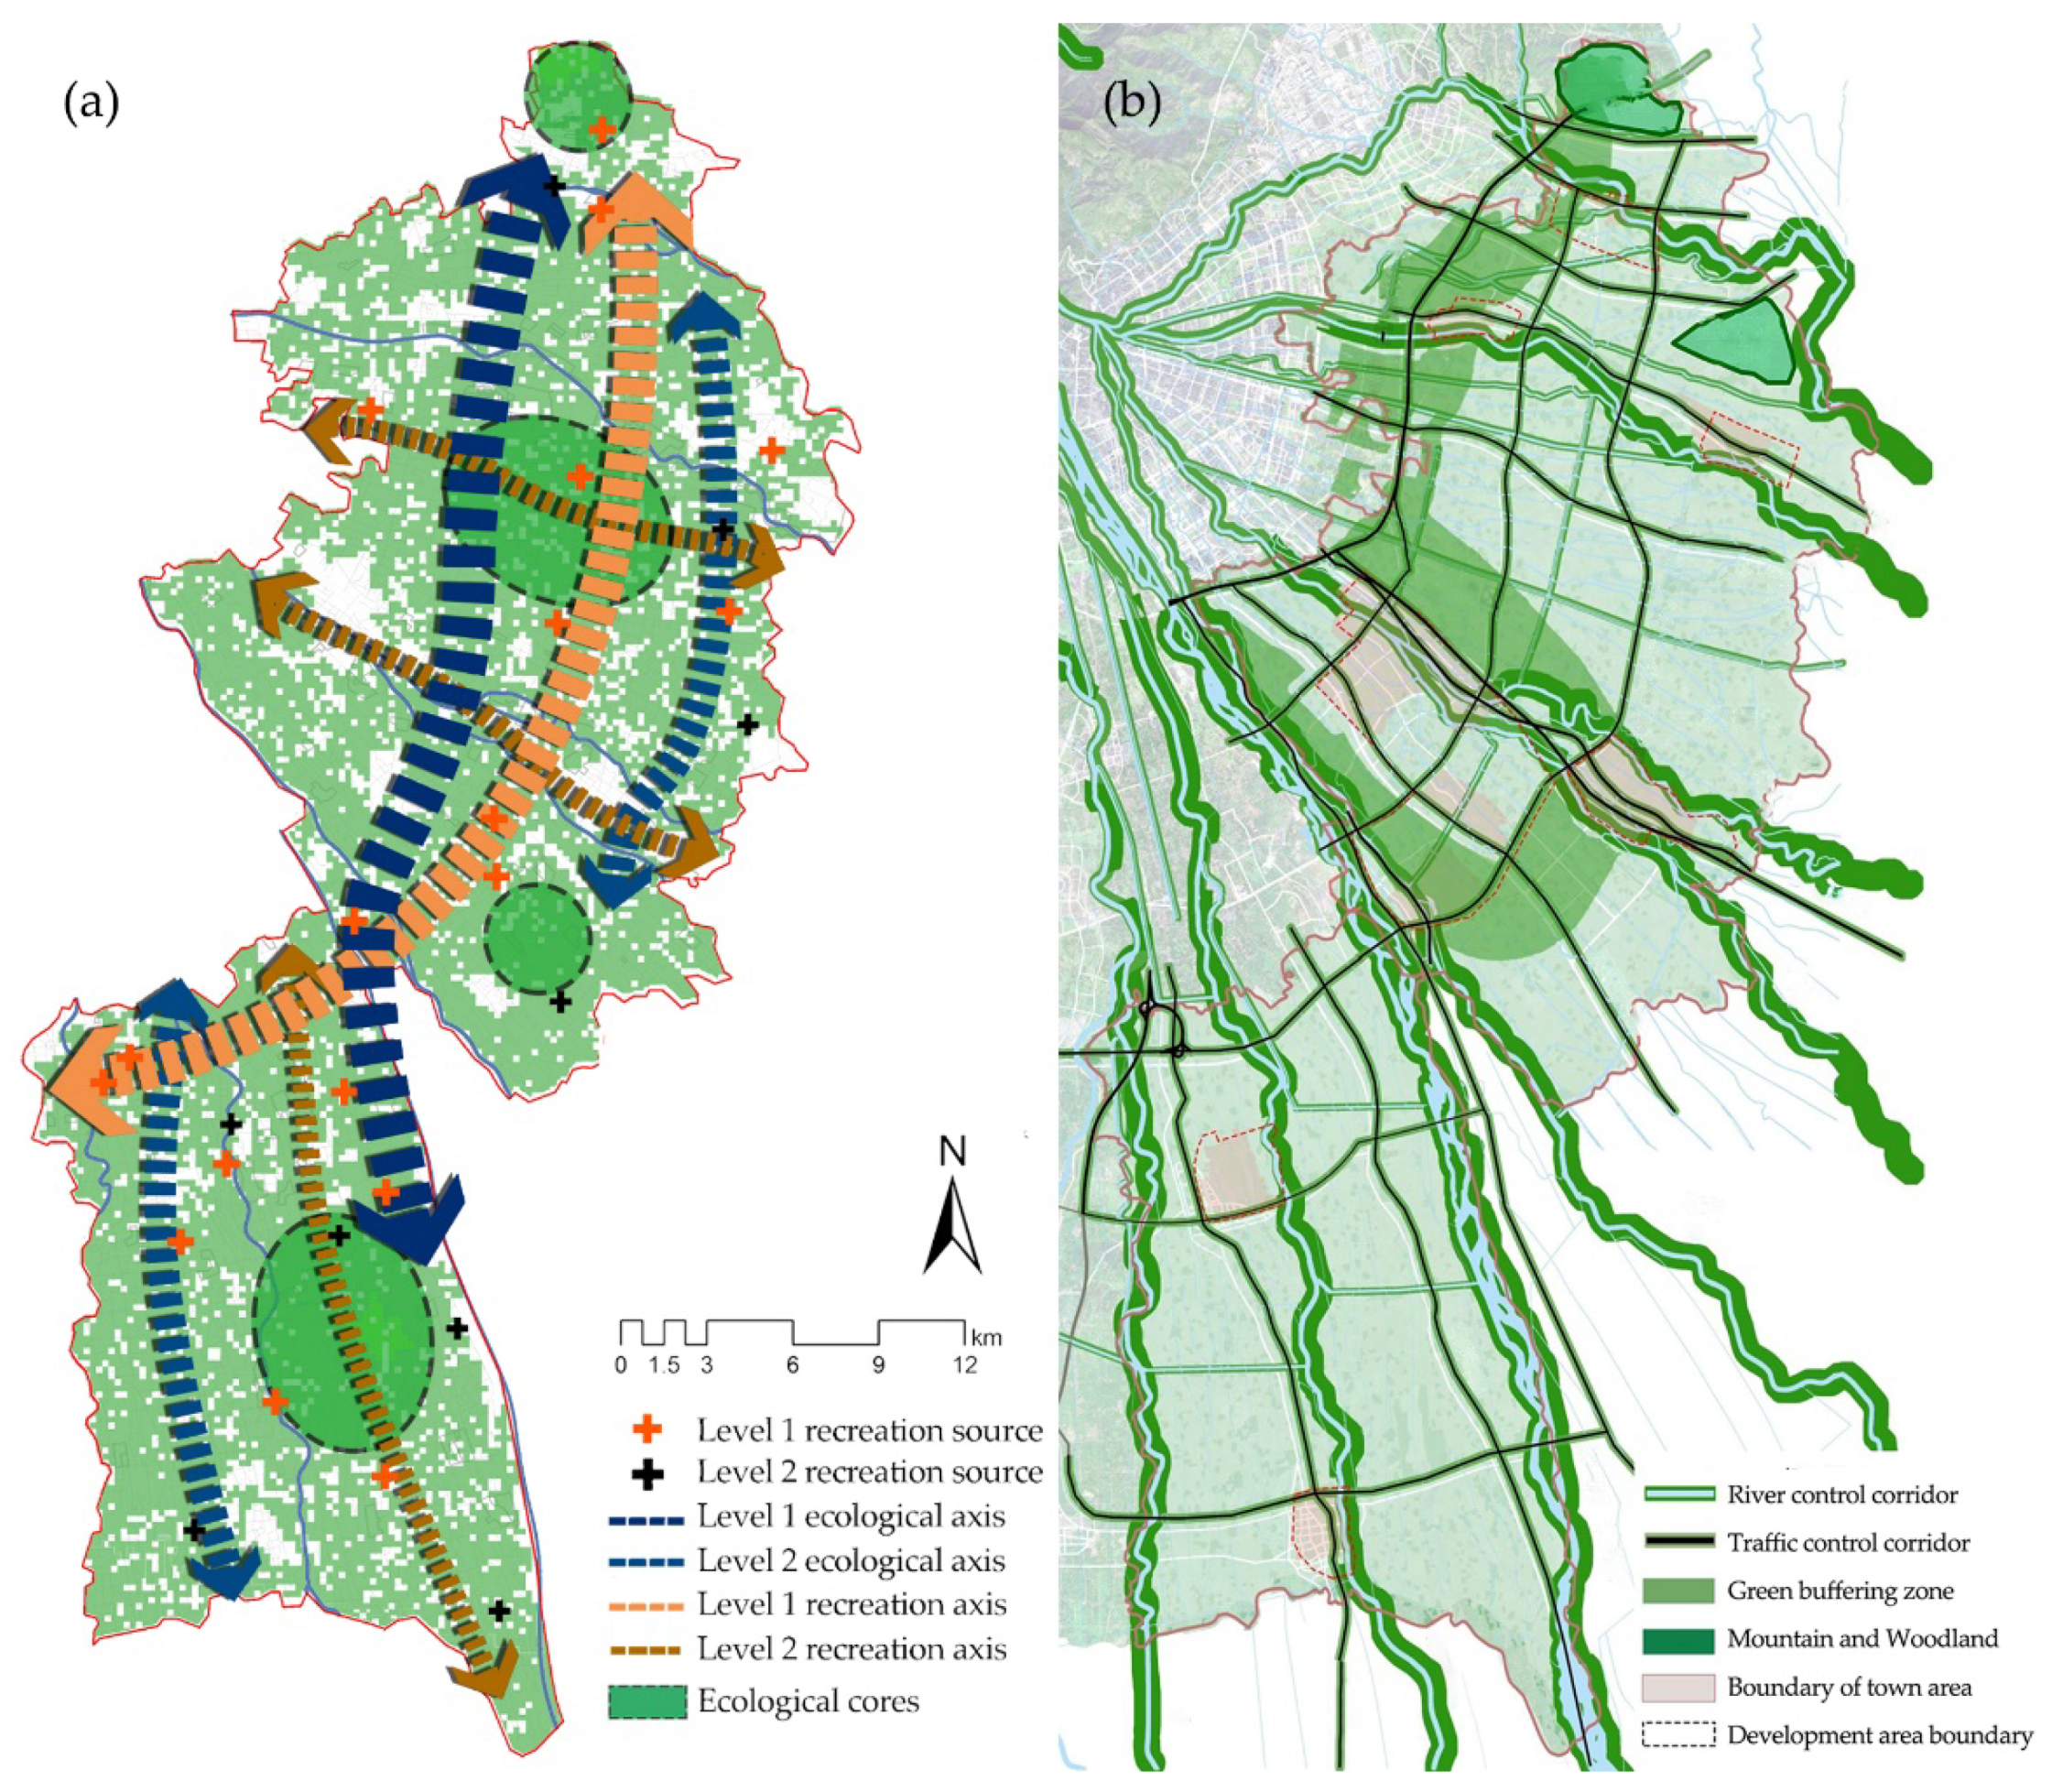
3.4. Identification of Ecological and Recreational Corridors

The resistance surface is an important factor that hinders the extension and diffusion of the corridor. In this study, the resistance surface was generated according to the mosaic superposition of resistance interference factors, and it was reclassified into high-, medium- and low-resistance areas. The areas of ecological high-, medium- and low-resistance areas were 58.07 (22.86%), 111.06 (43.72%) and 85.32 km2 (33.59%), respectively. The areas of high-, medium- and low-resistance areas of recreation were 7.08 (2.79%), 64.91 (25.55%) and 182.51 km2 (71.86%), respectively. In the ecological space, the higher resistance value was mainly distributed in the middle of the region. There are more expressways, urban expressways and construction land in the region, which greatly hinders the migration of species. Additionally, the towns in the south of the region contribute more high resistance space. In the recreational space, there are few high-resistance areas, and only a few expressways are distributed in the middle of the region, which is due to the small number of regional expressway entrances and exits.
According to the MCR model, the minimum cost path of flow between the central points of ecological/recreational sources was calculated, that is, the corridor between the sources. There were four ecological corridors in the Dujiangyan Irrigation District, with a total length of 158.38 km. A total of 27 recreational corridors with a total length of 245.29 km were obtained, including 18 primary corridors and 9 secondary corridors. The final result integrated the main rivers in the region as a supplement to the ecological/recreational sources and the identification of corridors was completed. Overall, the regional ecological corridor avoided the main urban construction land and was mainly distributed along farmland and forestland. In terms of ecological corridor classification, one primary corridor ran through the north and south. A secondary ecological corridor was mainly located in the east of the region. In the south, because the ecological space is relatively fragile and there are few central points of ecological sources, there was no distribution of corridors (Figure 9a). The recreational corridor was not limited by the resistance of towns and roads and showed a more miscellaneous spatial distribution structure. Such distribution will increase the construction cost of the region and is not conducive to the sustainable development of space. Therefore, the corridor needs to be further optimized to make the corridor space adapt to local development (Figure 9b).

3.5. Comprehensive Pattern of Ecology and Recreation in the Dujiangyan Irrigation District

Since the construction and development of recreational corridors mostly relies on urban and rural roads, greenways and other elements, the study adopted the proximity principle, combined the original miscellaneous recreational corridor network with the regional road network, and extended the relevant recreational corridors to form the final ecological and recreational space patterns (Figure 10). After the comprehensive analysis of the ecological and recreational patterns of the Dujiangyan Irrigation District, the recreational corridors formed a regular network distributed along the road, with a total length of 155.03 km. The ecological and recreational corridors also showed a certain degree of stacking area in space, especially in the first-class ecological corridor.

4. Discussion

4.1. Analysis of Regional Landscape Patterns

Through the evaluation and construction of ESPs in the ecological and recreational spaces of the Dujiangyan Irrigation District, the evaluation results showed that the ecological level of the region was relatively low, and the average value was downstream of the five-level classification, which was 3.36 (positive distribution). The grade distribution of recreational space of 2.97 (negative distribution) was high. Therefore, in the existing space of rapid development, how to protect and repair the ecological environment and improve the overall ecological environment quality, especially in cities and towns and around roads and water system corridors, is an urgent problem to be solved in regional development. There were also a large number of expressways and urban truck roads running in the east–west direction of the region, which reduced spatial connectivity, seriously breaking up the ecological space on both sides of the road, and increasing the resistance to the ecological process [55,56,57].
Using the MCR model, this paper determined the ecological and recreational corridors, which are an important part of landscape patterns, and obtained the comprehensive spatial pattern of the combination of points, lines and surfaces. By sorting the ecological and recreational corridors and the relationship between nodes and elements in space, we proposed the ecological spatial pattern of “three axes, two belts and four cores” and the recreational spatial pattern of “four axes and multiple points”. Specifically, the primary ecological axis runs through the site from northeast to south, maintaining the ecological connectivity between cultivated land and forestland. Additionally, the secondary axis extends from the north to the middle and runs through the place with large ecological source coverage in the south, ensuring the multidirectional continuation of the regional ecological space. The recreational main axis connects the north along the road to the west of the region, forming an important route for regional tourism, while the recreational secondary axis is composed of two lines running from east to west in the north and one line running from north to south in the south, ensuring the integrity of the connection between regional rural tourism and scenic resources (Figure 11a).

4.2. Optimization of the Source Identification Method

4.2.1. Optimization of Multiscale Landscape Connectivity

For source identification, in the past, the identification of ecological source sites was mostly used to directly select patches with large areas and good habitat quality as the source sites, or the traditional particle size analysis method was usually used for screening. There was little consideration of the scale problem and some subjectivity was involved [58,59]. This paper used the three-step source identification method of “connectivity index analysis; patch threshold determination; evaluation result classification”, which greatly improved the objectivity and accuracy of source identification. This study used the landscape connectivity indices of CONHESION, AI, CONTAG, SHDI, SHEI, and DIVISION to obtain the best research scale. The scale of 120 m ecological space and 30 m recreational space selected in the text were used as the scales of source identification. The two-scale spaces had good landscape connectivity, and the comprehensive connectivity value reached 0.8, indicating that the regional ecology and recreational sources had been best displayed on the spatial scale, which had a good relevance for guiding the construction of regional ecological space. Subsequent research can make the fitting degree of the final, overall, connectivity comprehensive index higher through the selection of more scales and indices to improve the accuracy of the final scale selection results.

4.2.2. Effect of Patch Size on Source Recognition

The determination of patch scale has a great impact on the number of patches and the functions carried by a single patch area, and the determination of its area should adapt to the local space [60]. Most of the relevant studies are aimed at cities and other such administrative spatial units. The determination of the spatial patch area was mostly in the range of 0.1–10 km2, but the total area of the study area in this paper was only 254 km2. After the area threshold analysis, the patch area scale of an ecological source area of 0.6 km2 and a recreational source area of 0.8 km2 could more accurately retain the source patch [61,62]. Under such a scale, follow-up urban and rural planning and construction can, according to such a scale, be used to carry out ecological restoration projects of ecological space and ecological sources, integrate tourism resources and reasonably develop rural tourism to realize the protection of regional ecological space and the development of recreational space to improve the level of regional ecological security. However, the final identification result of this paper is that there were only five patches in the ecological source, which was significant compared with the number of recreational patches. In a follow-up study, more screening conditions can be added to reduce the difference in the patch area identification of multiple indicators and improve the balance between the data.

4.2.3. Optimization of the Multifactor Resistance Surface Construction Method

For the identification of resistance surfaces, relevant studies often use a single type of land-use data to construct the resistance surfaces [51,52]. This leads to the separation of the resistance surface from the real space. Therefore, the geographical factors, water areas and road factors in this study strengthen the connection with the real space to a certain extent. However, there are still some problems in this study. The most important problem is that the road cannot fully reflect the impact of rich human activities in real space on the flow process of material and energy. Therefore, follow-up research should consider more social development factors, such as socio-economic differences and functional spatial differences in different regions, and should realize the complete expression of resistance factors in real space.

4.3. Implications to the Development of the Dujiangyan Irrigation District

By analyzing the ecological corridor planning mentioned in the relevant upper planning, the establishment of an ecological corridor in the upper planning was based on the river corridor. The similarity between the two landscape patterns lies in the addition of a water space corridor with the water system as the main body, which reflects the water network characteristics of the Dujiangyan Irrigation District. It also shows similarity in a small number of slope areas in the northern part of the area. The difference is that the corridor in the upper planning involves fewer elements and shows a relatively single ecological space, while our research results integrate factors such as land use, development and construction interference in the evaluation stage, reflecting the complexity of space under the influence of multiple factors. Therefore, our research results can be used as a reference and can supplement the construction of regional ecological and recreational space (Figure 11).
In the follow-up development of the Dujiangyan Irrigation District, it is necessary to propose a new long-term optimization plan for landscape space, emphasizing forward-looking protection and utilization. In terms of specific improvement content, the protection and restoration of the source area should be considered first, with cultivated land, forestland and the water area as matrix elements for protection and restoration, to improve the quality and coverage rate of the ecological source area. At the same time, the fragmented ecological land should be integrated to improve the stability of the ecosystem through scale change. Second, the connectivity between the source areas should be improved, green space construction along the corridor and the connectivity on both sides of the road should be strengthened, and the ecological environment quality should be improved. Finally, for the areas requiring recreational development, the construction content should be strictly controlled to reduce interference with the ecological environment and the coordinated development of ecological environment protection and development should be realized.

5. Conclusions

Taking Dujiangyan Irrigation District as an example, this study constructed regional comprehensive landscape patterns through ESPs from two dimensions of ecology and recreation. Based on the multiscale connectivity analysis and area threshold identification, the source area was constructed and the resistance surface was resolved to obtain the “eco-recreation” integrated landscape network based on the corridor.
The results show that (1) The development of regional recreation space has a good foundation, but the average value of the ecological space grade is only 3.36, which is low. In subsequent regional development, special attention should be paid to the construction of ecological landscapes in towns, roads, water corridors and other low-grade areas; (2) The study identified 120 and 30 m as the most suitable scales for ecological and recreational space and 0.6 and 0.8 km2 as the minimum area threshold of ecological and recreational space, which had a great promotion effect on the accuracy of source identification. At the same time, the construction of resistance surfaces can improve the accuracy of resistance surfaces to a certain extent by integrating roads, water systems and topographies; and (3) By constructing ecological and recreational networks, this study identified four ecological corridors with a total length of 158.38 km in the Dujiangyan Irrigation District and 27 recreational corridors with a total length of 245.29 km, which can be used as an important space for subsequent regional development.
Based on the ecological network analysis, this study suggested that in the future ecological space planning of the region, priority should be given to ecological land consolidation, integration of scattered ecological sources and delineation of protected areas. Meanwhile, ecological corridors should be planned to improve the connectivity of ecological space, so as to ensure the ecological security pattern. In terms of recreation space, this study suggests that appropriate development should be carried out according to the recreation corridor, under the premise of maintaining ecological protection, so as to better utilize regional recreation resources and promote the coordinated development of space protection and utilization.

Author Contributions

Conceptualization, Q.D. and J.C.; methodology, Q.D.; software, Q.D.; formal analysis, L.W.; investigation, L.W.; resources, D.L.; data curation, D.L.; writing—original draft preparation, Q.D.; writing—review and editing, J.C. and Q.C.; visualization, D.L.; supervision, Q.C. All authors have read and agreed to the published version of the manuscript.

Funding

(1) Transformation and demonstration of key technological achievements of Sichuan bamboo industry chain (Demonstration projects for popularizing forest and grass science and technology financed by the central government), (2020) no. 9; (2) Research project on industrial integration and innovation of beautiful bamboo forest scenic spot, T202101.

Data Availability Statement

The data presented in this study are availadle on request from the corresponding author. The data are not publicly available due to privacy.

Conflicts of Interest

The authors declare no conflict of interest.

Appendix A

Table A1. Grade assignment and spatial evaluation weight.
Criterion Layer (A)Sub-Criterion Layer (B)WeightFactor Layer (C)Conditions for ReclassificationValueWeight
Importance evaluation of ecological protectionEcological Sensitivity Evaluation (B1)0.6410Elevation (C1)Elevation > 700 m50.1644
600 m < Elevation < 700 m3
Elevation < 600 m1
Slope (C2)Slope > 25°90.1833
15° < Slope < 25°7
8° < Slope < 15°5
3° < Slope < 8°3
Slope < 3°1
Aspect (C3)North90.1356
Northeast, Northwest7
East, West5
Southeast, Southwest3
South1
Spatial distribution of water resources (C4)0–20 m buffer for rivers, 0–10 m buffer for ponds90.3052
20–50 m buffer for rivers, 10–20 m buffer for ponds7
50–100 m buffer for rivers, 20–50 m buffer for ponds5
100–200 m buffer for rivers, 50–100 m buffer for ponds3
>200 m buffer for rivers, >100 m buffer for ponds1
Land-use type (C5)Waters, woodland90.2114
Farmland7
Land for construction, wasteland1
Spatial assessment of ecological importance (B2)0.3590Security of water resources (C6)Large area of water, distance <20 m90.5666
Medium-area waters, distance <50 m7
Relatively concentrated small waters, distance <100 m5
Dispersed small waters, distance ≤150 m3
No water, distance >150 m1
Vegetation coverage (C7)Coverage > 60%90.2833
45% < Coverage ≤ 60%7
35% < Coverage ≤ 45%5
20% < Coverage ≤ 35%1
Disturbance of development and construction to ecology (C8)The density of traffic, villages and towns is very low, 1000 < population ≤ 200090.1501
The density of traffic and villages is low, with a population of 2000–30007
The density of traffic, villages and towns is moderate, 3000 < population ≤ 40005
The density of traffic, villages and towns is high, 4000 < population ≤ 50003
The density of traffic, villages and towns is very high, and the population is more than 50001
Suitability evaluation of recreational spaceSuitability evaluation of recreational space development (B3)0.5564Spatial distribution of tourism resources (C9)Jenks Level 5 classification-0.3100
Spatial distribution of tourism service facilities (C10)Coverage, no coverage1, 90.2728
Spatial distribution of heritage sites and potential tourism resources (C11)Place of protection90.4172
50 m buffer in the protected area5
100 m buffer of the protected land1
Evaluation of recreation needs (B4)0.4436People’s demand for the abundance of recreational activities (C12)Jenks Level 5 classification-0.7407
People’s demand for community leisure space (C13)-0.2593
Table A2. Statistical table of variance explained.
Principal ComponentEcological Principal ComponentRecreational Principal Component
EigenvalueContribution Rates/%Accumulative Contribution Rate/%EigenvalueContribution Rates/%Accumulative Contribution Rate/%
15.25087.49787.4973.45257.53257.532
20.5989.95997.4562.25537.59095.122
30.1051.74399.1990.2554.24499.367
40.0470.78699.9860.0370.62199.988
50.0010.01499.9990.0010.012100.000
60.0000.001100.0000.0000.000100.000

References

  1. Li, Y.L.; Sun, X.; Zhu, X.D.; Cao, H.H. An early warning method of landscape ecological security in rapid urbanizing coastal areas and its application in xiamen, china. Ecol. Model. 2010, 221, 2251–2260. [Google Scholar] [CrossRef]
  2. Lovell, S.T.; Taylor, J.R. Supplying urban ecosystem services through multifunctional green infrastructure in the United States. Landsc. Ecol. 2013, 28, 1447–1463. [Google Scholar] [CrossRef]
  3. Liu, Y.S. Research on the urban-rural integration and rural revitalization in the new era in China. Acta Geogr. Sin. 2018, 73, 637–650. [Google Scholar] [CrossRef]
  4. Zhou, Y.; Shen, Y.; Yang, X.; Wang, Z.; Xu, L. Where to Revitalize, and How? A Rural Typology Zoning for China. Land 2021, 10, 1336. [Google Scholar] [CrossRef]
  5. Liu, X.; Zhang, Y.; Dong, G.; Hou, G.; Jiang, M. Landscape Pattern Changes in the Xingkai Lake Area, Northeast China. Int. J. Environ. Res. Public Health 2019, 16, 3820. [Google Scholar] [CrossRef] [Green Version]
  6. Weng, H.; Gao, Y.; Su, X.; Yang, X.; Cheng, F.; Ma, R.; Liu, Y.; Zhang, W.; Zheng, L. Spatial-Temporal Changes and Driving Force Analysis of Green Space in Coastal Cities of Southeast China over the Past 20 Years. Land 2021, 10, 537. [Google Scholar] [CrossRef]
  7. Fang, Y.; Zhai, T.; Zhao, X.; Chen, K.; Guo, B.; Wang, J. Study on the Comprehensive Improvement of Ecosystem Services in a China’s Bay City for Spatial Optimization. Water 2021, 13, 2072. [Google Scholar] [CrossRef]
  8. Liu, Y.; Meng, J.-J.; Zhu, L.-K. Progress in the research on regional ecological security pattern. Acta Ecol. Sin. 2010, 30, 6980–6989. [Google Scholar]
  9. Peng, J.; Zhao, H.J.; Liu, Y.X.; Jiansheng, W. Research progress and prospect on regional ecological security pattern construction. Geogr. Res. 2017, 36, 407–419. [Google Scholar] [CrossRef]
  10. Chen, X.; Peng, J.; Liu, Y.X.; Yang, Y.; Li, G. Constructing ecological security patterns in Yunfu city based on the framework of importance-sensitivity-connectivity. Geogr. Res. 2017, 36, 471–484. [Google Scholar] [CrossRef]
  11. Peng, J.; Guo, X.N.; Hu, Y.; Liu, Y. Constructing ecological security patterns in mountain areas based on geological disaster sensitivity: A case study in Yuxi City, Yunnan Province, China. Chin. J. Appl. Ecol. 2017, 28, 627–635. [Google Scholar] [CrossRef]
  12. Yu, C.L.; Liu, D.; Feng, R.; Tang, Q.; Guo, C.L. Construction of ecological security pattern in Northeast China based on MCR model. Acta Ecol. Sin. 2021, 41, 12. [Google Scholar] [CrossRef]
  13. Huang, J.; Hu, Y.; Zheng, F. Research on recognition and protection of ecological security patterns based on circuit theory: A case study of Jinan City. Environ. Sci. Pollut. Res. 2020, 27, 12414–12427. [Google Scholar] [CrossRef] [PubMed]
  14. Zhong, S.Y.; Wu, J.; Li, Y.; Cheng, J. Reconstruction of urban land space based on minimum cumulative resistance model: A case study of Xintang Town, Guangzhou City. Chin. J. Appl. Ecol. 2012, 23, 3173–3179. [Google Scholar]
  15. Jing, L.I.; Jijun, M.; Xiyan, M. MCR Based Model for Developing Land Use Ecological Security Pattern in Farming-Pastoral Zone: A Case Study of Jungar Banner, Ordos. Beijing Daxue Xuebao Ziran Kexue Ban Acta Sci. Nat. Univ. Pekin. 2013, 49, 707–715. [Google Scholar]
  16. Wang, Z.; Shi, P.; Zhang, X.; Tong, H.; Zhang, W.; Liu, Y. Research on Landscape Pattern Construction and Ecological Restoration of Jiuquan City Based on Ecological Security Evaluation. Sustainability 2021, 13, 5732. [Google Scholar] [CrossRef]
  17. Hu, C.; Wang, Z.; Wang, Y.; Sun, D.; Zhang, J. Combining MSPA-MCR Model to Evaluate the Ecological Network in Wuhan, China. Land 2022, 11, 213. [Google Scholar] [CrossRef]
  18. Li, H.; Yi, N.; Yao, W.J.; Wang, S.Q.; Li, Z.; Yang, S.H. Shangri-La county ecological land use planning based on landscape security pattern. Acta Ecol. Sin. 2011, 31, 5928–5936. [Google Scholar]
  19. Yu, K. Security patterns and surface model in landscape ecological planning. Landsc. Urban Plan. 1996, 36, 1–17. [Google Scholar] [CrossRef]
  20. Sun, X.B.; Liu, H.Y. Optimization of wetland landscape patterns based on ecological function evaluation: A case study on the coastal wetlands of Yancheng, Jiangsu Province. Acta Ecol. Sin. 2010, 30, 1157–1166. [Google Scholar]
  21. Peng, J.; Pan, Y.; Liu, Y.; Zhao, H.; Wang, Y. Linking ecological degradation risk to identify ecological security patterns in a rapidly urbanizing landscape. Habitat Int. 2018, 71, 110–124. [Google Scholar] [CrossRef]
  22. Yang, S.S.; Zou, C.X.; Shen, W.S.; Shen, R.P.; Xu, D.L. Construction of ecological security patterns based on ecological red line: A case study of Jiangxi Province. Chin. J. Ecol. 2016, 35, 250–258. [Google Scholar] [CrossRef]
  23. Gurrutxaga, M.; Lozano, P.J.; del Barrio, G. GIS-based approach for incorporating the connectivity of ecological networks into regional planning. J. Nat. Conserv. 2010, 18, 318–326. [Google Scholar] [CrossRef]
  24. Ye, Y.; Su, Y.; Zhang, H.-O.; Liu, K.; Wu, Q. Construction of an ecological resistance surface model and its application in urban expansion simulations. J. Geogr. Sci. 2015, 25, 211–224. [Google Scholar] [CrossRef]
  25. Peng, J.; Yang, Y.; Liu, Y.; Hu, Y.N.; Du, Y.Y.; Meersmans, J.; Qiu, S.J. Linking ecosystem services and circuit theory to identify ecological security patterns. Sci. Total Environ. 2018, 644, 781–790. [Google Scholar] [CrossRef] [Green Version]
  26. Jia, Z.Y.; Chen, C.D.; Tong, X.X.; Wu, S.J.; Zhou, W.Z. Developing and optimizing ecological networks for the towns along the Three Gorges Reservoir: A case of Kaizhou New Town, Chongqing. Chin. J. Ecol. 2017, 36, 782–791. [Google Scholar] [CrossRef]
  27. Saura, S.; Torné, J. Conefor Sensinode 2.2: A software package for quantifying the importance of habitat patches for landscape connectivity. Environ. Model. Softw. 2009, 24, 135–139. [Google Scholar] [CrossRef]
  28. Spear, S.F.; Balkenhol, N.; Fortin, M.-J.; Mcrae, B.H.; Scribner, K. Use of resistance surfaces for landscape genetic studies: Considerations for parameterization and analysis. Mol. Ecol. 2010, 19, 3576–3591. [Google Scholar] [CrossRef]
  29. Zhang, L.; Peng, J.; Liu, Y.; Wu, J. Coupling ecosystem services supply and human ecological demand to identify landscape ecological security pattern: A case study in Beijing-Tianjin-Hebei region, China. Urban Ecosyst. 2017, 20, 701–714. [Google Scholar] [CrossRef]
  30. Zhang, Y.-Z.; Jiang, Z.-Y.; Li, Y.-Y.; Yang, Z.-G.; Wang, X.-H.; Li, X.-B. Construction and Optimization of an Urban Ecological Security Pattern Based on Habitat Quality Assessment and the Minimum Cumulative Resistance Model in Shenzhen City, China. Forests 2021, 12, 847. [Google Scholar] [CrossRef]
  31. Gao, Y.; Bi, R.T. Effects on Changing Grain Size of Landscape Indices in Sushuihe Watershed. Chin. Agric. Sci. Bull. 2010, 26, 396–400. [Google Scholar]
  32. Weijun, S.; Jianguo, W.; Yongbiao, L.; Hai, R.; Qinfen, L. Effects of changing grain size on landscape pattern analysis. Acta Ecol. Sin. 2003, 23, 2506–2519. [Google Scholar]
  33. Wu, M.Q.; Hu, M.M.; Wang, T.; Fan, C.; Xia, B. Recognition of urban ecological source area based on ecological security pattern and multi-scale landscape connectivity. Acta Ecol. Sin. 2019, 39, 4720–4731. [Google Scholar] [CrossRef]
  34. Kong, F.H.; Yin, H.W. Developing green space ecological networks in Jinan City. Acta Ecol. Sin. 2008, 1711–1719. [Google Scholar] [CrossRef]
  35. Li, Y.; Wang, X.; Dong, X. Delineating an Integrated Ecological and Cultural Corridor Network: A Case Study in Beijing, China. Sustainability 2021, 13, 412. [Google Scholar] [CrossRef]
  36. Pan, J.H.; Liu, X. Assessment of landscape ecological security and optimization of landscape pattern based on spatial principal component analysis and resistance model in arid inland area: A case study of Ganzhou District, Zhangye City, Northwest China. J. Appl. Ecol. 2015, 26, 3126–3136. [Google Scholar] [CrossRef]
  37. Hong, B.T.; Ren, P. Assessment of Ecological Suitability for Rural Residential Land Based on Minimum Cumulative Resistance Model: A Case Study in Dujiangyan City. Resour. Environ. Yangtze Basin 2019, 28, 1386–1396. [Google Scholar]
  38. Wei, B.J.; Su, J.; Hu, X.J.; Xu, K.H.; Zhu, M.; Liu, L. Comprehensive identification of eco-corridors and eco-nodes bansed on principle of hydrological analysis and Linkage Mapper. Acta Ecol. Sin. 2022, 7, 1–15. [Google Scholar]
  39. Huang, M.Y.; Yue, W.Z.; Feng, S.R.; Cai, J.J. Analysis of spatial heterogeneity of ecological security based on MCR model and ecological pattern optimization in the Yuexi county of the Dabie Mountain Area. J. Nat. Resour. 2019, 34, 771–784. [Google Scholar] [CrossRef]
  40. Chen, L.; Fu, B.; Zhao, W. Source-sink landscape theory and its ecological significance. Front. Biol. China. 2008, 3, 131–136. [Google Scholar] [CrossRef]
  41. Xie, H.L.; Li, X.B. Spatial assessment and zoning regulations of ecological importance based on GIS for rural habitation in Changgang Town, Xinguo county. Acta Ecol. Sin. 2011, 31, 230–238. [Google Scholar] [CrossRef]
  42. Li, F.Z.; Lu, S.S.; Sun, Y.N.; Li, X.; Xi, B.Y.; Liu, W.Q. Integrated Evaluation and Scenario Simulation for Forest Ecological Security of Beijing Based on System Dynamics Model. Sustainability 2015, 7, 13631–13659. [Google Scholar] [CrossRef] [Green Version]
  43. Zang, Z.; Zhang, Y.N. Study on Landscape Pattern and Connectivity with Different Scale of Urban Green Space. Chin. Agric. Sci. Bull. 2011, 49–55. [Google Scholar]
  44. Shi, X.; Qin, M.; Li, B.; Zhang, D. A Framework for Optimizing Green Infrastructure Networks Based on Landscape Connectivity and Ecosystem Services. Sustainability 2021, 13, 10053. [Google Scholar] [CrossRef]
  45. Lin, Y.; An, W.; Gan, M.; Shahtahmassebi, A.; Ye, Z.; Huang, L.; Zhu, C.; Huang, L.; Zhang, J.; Wang, K. Spatial Grain Effects of Urban Green Space Cover Maps on Assessing Habitat Fragmentation and Connectivity. Land 2021, 10, 1065. [Google Scholar] [CrossRef]
  46. Wei, S.; Pan, J.; Liu, X. Landscape ecological safety assessment and landscape pattern optimization in arid inland river basin: Take ganzhou district as an example. Hum. Ecol. Risk Assess. Int. J. 2018, 26, 782–806. [Google Scholar] [CrossRef]
  47. Zuo, W.; Wang, Q.; Wang, W.J.; Liu, J.J.; Yang, Y.P. Study on Regional Ecological Security Assessment Index and Standard. Geogr. Geo Inf. Sci. 2002, 18, 67–71. [Google Scholar] [CrossRef]
  48. Zheng, Q.; Zeng, J.X.; Luo, J.; Cui, J.; Sun, X. Spatial Structure and Space Governance of Ecological Network in Wuhan City. Econ. Geogr. 2018, 38, 191–199. [Google Scholar] [CrossRef]
  49. Xu, J.; Fan, F.; Liu, Y.; Dong, J.; Chen, J. Construction of Ecological Security Patterns in Nature Reserves Based on Ecosystem Services and Circuit Theory: A Case Study in Wenchuan, China. Int. J. Environ. Res. Public Health 2019, 16, 3220. [Google Scholar] [CrossRef] [Green Version]
  50. Grafius, D.R.; Corstanje, R.; Warren, P.H.; Evans, K.L.; Hancock, S.; Harris, J. The impact of land use/land cover scale on modelling urban ecosystem services. Landsc. Ecol. 2016, 31, 1509–1522. [Google Scholar] [CrossRef] [Green Version]
  51. Peng, J.; Li, H.L.; Liu, Y.X.; Yang, Y. Identification and optimization of ecological security pattern in Xiong’an New Area. Acta Geogr. Sin. 2018, 73, 701–710. [Google Scholar] [CrossRef]
  52. Luo, Y.; Wu, J.; Wang, X.; Wang, Z.; Zhao, Y. Can policy maintain habitat connectivity under landscape fragmentation? A case study of Shenzhen, China. Sci. Total Environ. 2020, 715, 136829. [Google Scholar] [CrossRef]
  53. Ding, C.; He, X. K-Means Clustering via Principal Component Analysis. In Proceedings of the Twenty-First International Conference on Machine learning, Banff, AB, Canada, 4–8 July 2004. [Google Scholar]
  54. Zhao, W.W.; Fu, B.J.; Chen, L.D. The effects of grain change on landscape indices. Quat. Sci. 2003, 23, 326–333. [Google Scholar] [CrossRef]
  55. Shi, H.; Shi, T.; Yang, Z.; Wang, Z.; Han, F.; Wang, C. Effect of Roads on Ecological Corridors Used for Wildlife Movement in a Natural Heritage Site. Sustainability 2018, 10, 2725. [Google Scholar] [CrossRef] [Green Version]
  56. Miao, Z.; Pan, L.; Wang, Q.; Chen, P.; Yan, C.; Liu, L. Research on Urban Ecological Network Under the Threat of Road Networks—A Case Study of Wuhan. ISPRS Int. J. Geo Inf. 2019, 8, 342. [Google Scholar] [CrossRef] [Green Version]
  57. Liu, R.C.; Shen, C.Z.; Jia, Z.Y.; Wang, J.X.; Lu, C.F.; Zhou, S.L. Construction and optimization of ecological network under the stress of road landscape in coastal beach area: A case study of Dafeng District, Yancheng City. Chin. J. Ecol. 2019, 38, 828–837. [Google Scholar] [CrossRef]
  58. Xie, D.X.; Chen, H.Q. Land Problems and Reflecting in Highly Urbanized Areas: A Case Study of Shenzhen. Ecol. Econ. 2013, 48–51, 57. [Google Scholar] [CrossRef]
  59. Lu, Y.; She, J.Y.; Luo, G.G.; Chen, C.H.; She, Y.C.; Li, C.Q. Landscape pattern optimization based on granularity inverse method and GIS spatial analysis. Chin. J. Ecol. 2018, 37, 534–545. [Google Scholar] [CrossRef]
  60. Xiao, D.N.; Bu, R.C.; Liu, X.Z. Spatial ecology and landscape heterogentity. Acta Ecol. Sin. 1997, 17, 453–461. [Google Scholar]
  61. McFarland, J.H. A National plan study brief. by Warren H. Manning. published as a special supple-published as a special supplement to landscape archifeclure for july, 1923. Natl. Munic. Rev. 1924, 13, 366. [Google Scholar] [CrossRef]
  62. Yu, K.J.; Li, H.L.; Li, D.H.; Qiao, Q.; Xi, X.S. National scale ecological security pattern. Acta Ecol. Sin. 2009, 29, 5163–5175. [Google Scholar] [CrossRef]
Figure 1. Research framework.
Land 11 00383 g001
Figure 2. Geographical location of the Dujiangyan Irrigation District.
Land 11 00383 g002
Figure 3. Spatial analysis of a single factor.
Land 11 00383 g003
Figure 4. Ecology and recreation spatial pattern: (a) importance evaluation of ecological protection; and (b) suitability evaluation of recreational space.
Land 11 00383 g004
Figure 5. Spatial connectivity indices at different scales: (a) ecological connectivity index; and (b) recreation connectivity index.
Land 11 00383 g005
Figure 6. Synthesis index of integral connectivity: (a) synthesis index of ecological connectivity; and (b) synthesis index of recreational connectivity.
Land 11 00383 g006
Figure 7. Effect of setting minimum area thresholds on plaque: (a) setting minimum area thresholds of ecological patches; and (b) setting minimum area thresholds on recreational patches.
Land 11 00383 g007
Figure 8. Source distribution: (a) determination of the ecological source and (b) determination of the recreation source.
Land 11 00383 g008
Figure 9. Distribution of corridors: (a) preliminary determination of ecological corridors; and (b) preliminary identification of recreational corridors.
Land 11 00383 g009
Figure 10. Ecological and recreational security patterns in the Dujiangyan Irrigation District.
Land 11 00383 g010
Figure 11. Landscape spatial structure: (a) analysis of the landscape spatial structure of the Dujiangyan Irrigation District; (b) ecological function zoning in the Master plan of Dujiangyan Irrigation District (Revised by the Dujiangyan Irrigation District Management Committee (2018).
Land 11 00383 g011
Table 1. Assignment of resistance elements.
Interference FactorResistance Value
Ecological ResistanceRecreational Resistance
Land-use typeWater8010
Woodland55
Farmland5020
Land for construction15080
Wasteland10150
Road classificationFreeway200200
Arterial highway150100
Feeder highway10050
Village road-10
Water-8010
TopographicSlope > 25°150-
8° < Slope < 15°10
Slope < 3°5
Table 2. Principal component analysis.
Index NamePrincipal Component Factor
Ecological Principal Component FactorRecreational Principal Component Factor 1Recreational Principal Component Factor 2
CONTAG0.9830.929−0.324
COHESION0.9810.8480.332
DIVISION0.7120.3170.939
SHDI0.9620.1230.983
SHEI−0.952−0.8830.438
AI0.9910.988−0.013
Publisher’s Note: MDPI stays neutral with regard to jurisdictional claims in published maps and institutional affiliations.

