
User Perception of Public Parks: A Pilot Study Integrating Spatial Social Media Data with Park Management in the City of Chicago


Abstract
:1. Introduction
1.1. Urban Parks and Parks-and-Recreation in Cities
1.2. Current Park Management Strategy Challenges
- (a)
- New methods are required to keep information up to date.
- (b)
- Data collection and park performance measurements require improvement.
- (c)
- Environmental justice problems and efforts from planning.
- (d)
- Insufficient budget and financial investment.
1.3. User-Generated Content and Its Potential to Contribute to Landscape Governance
2. Data and Methods
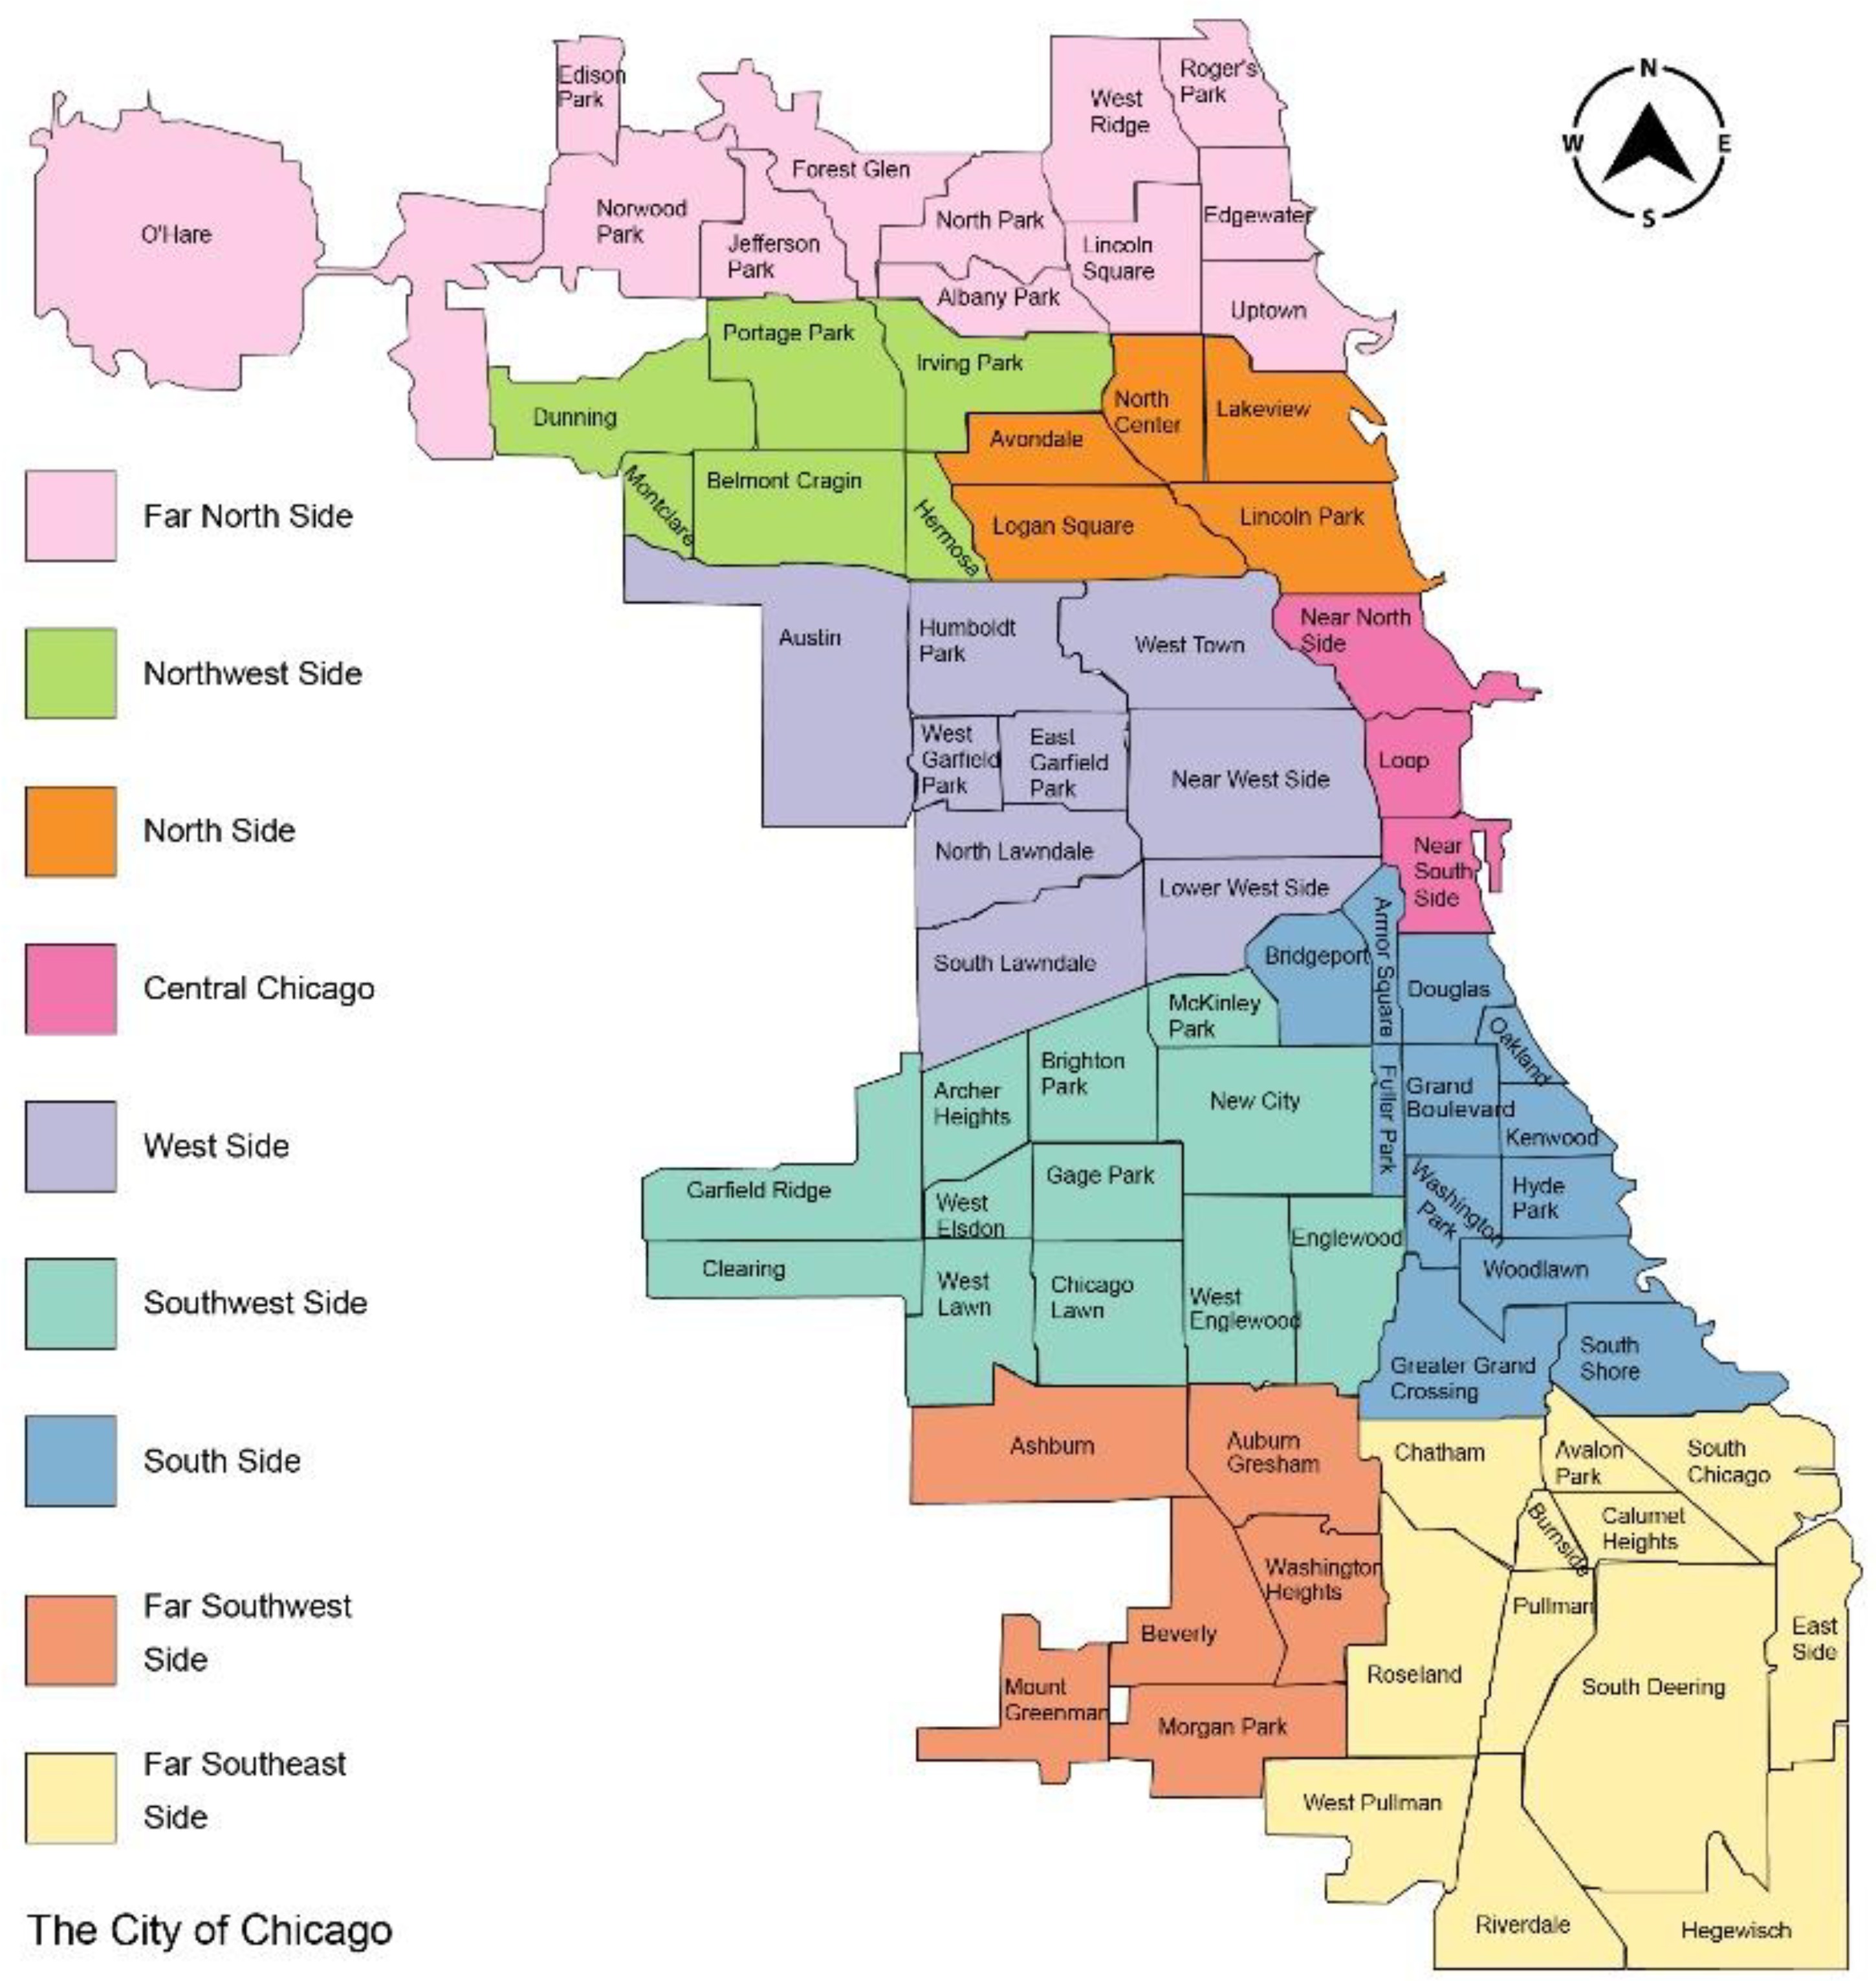
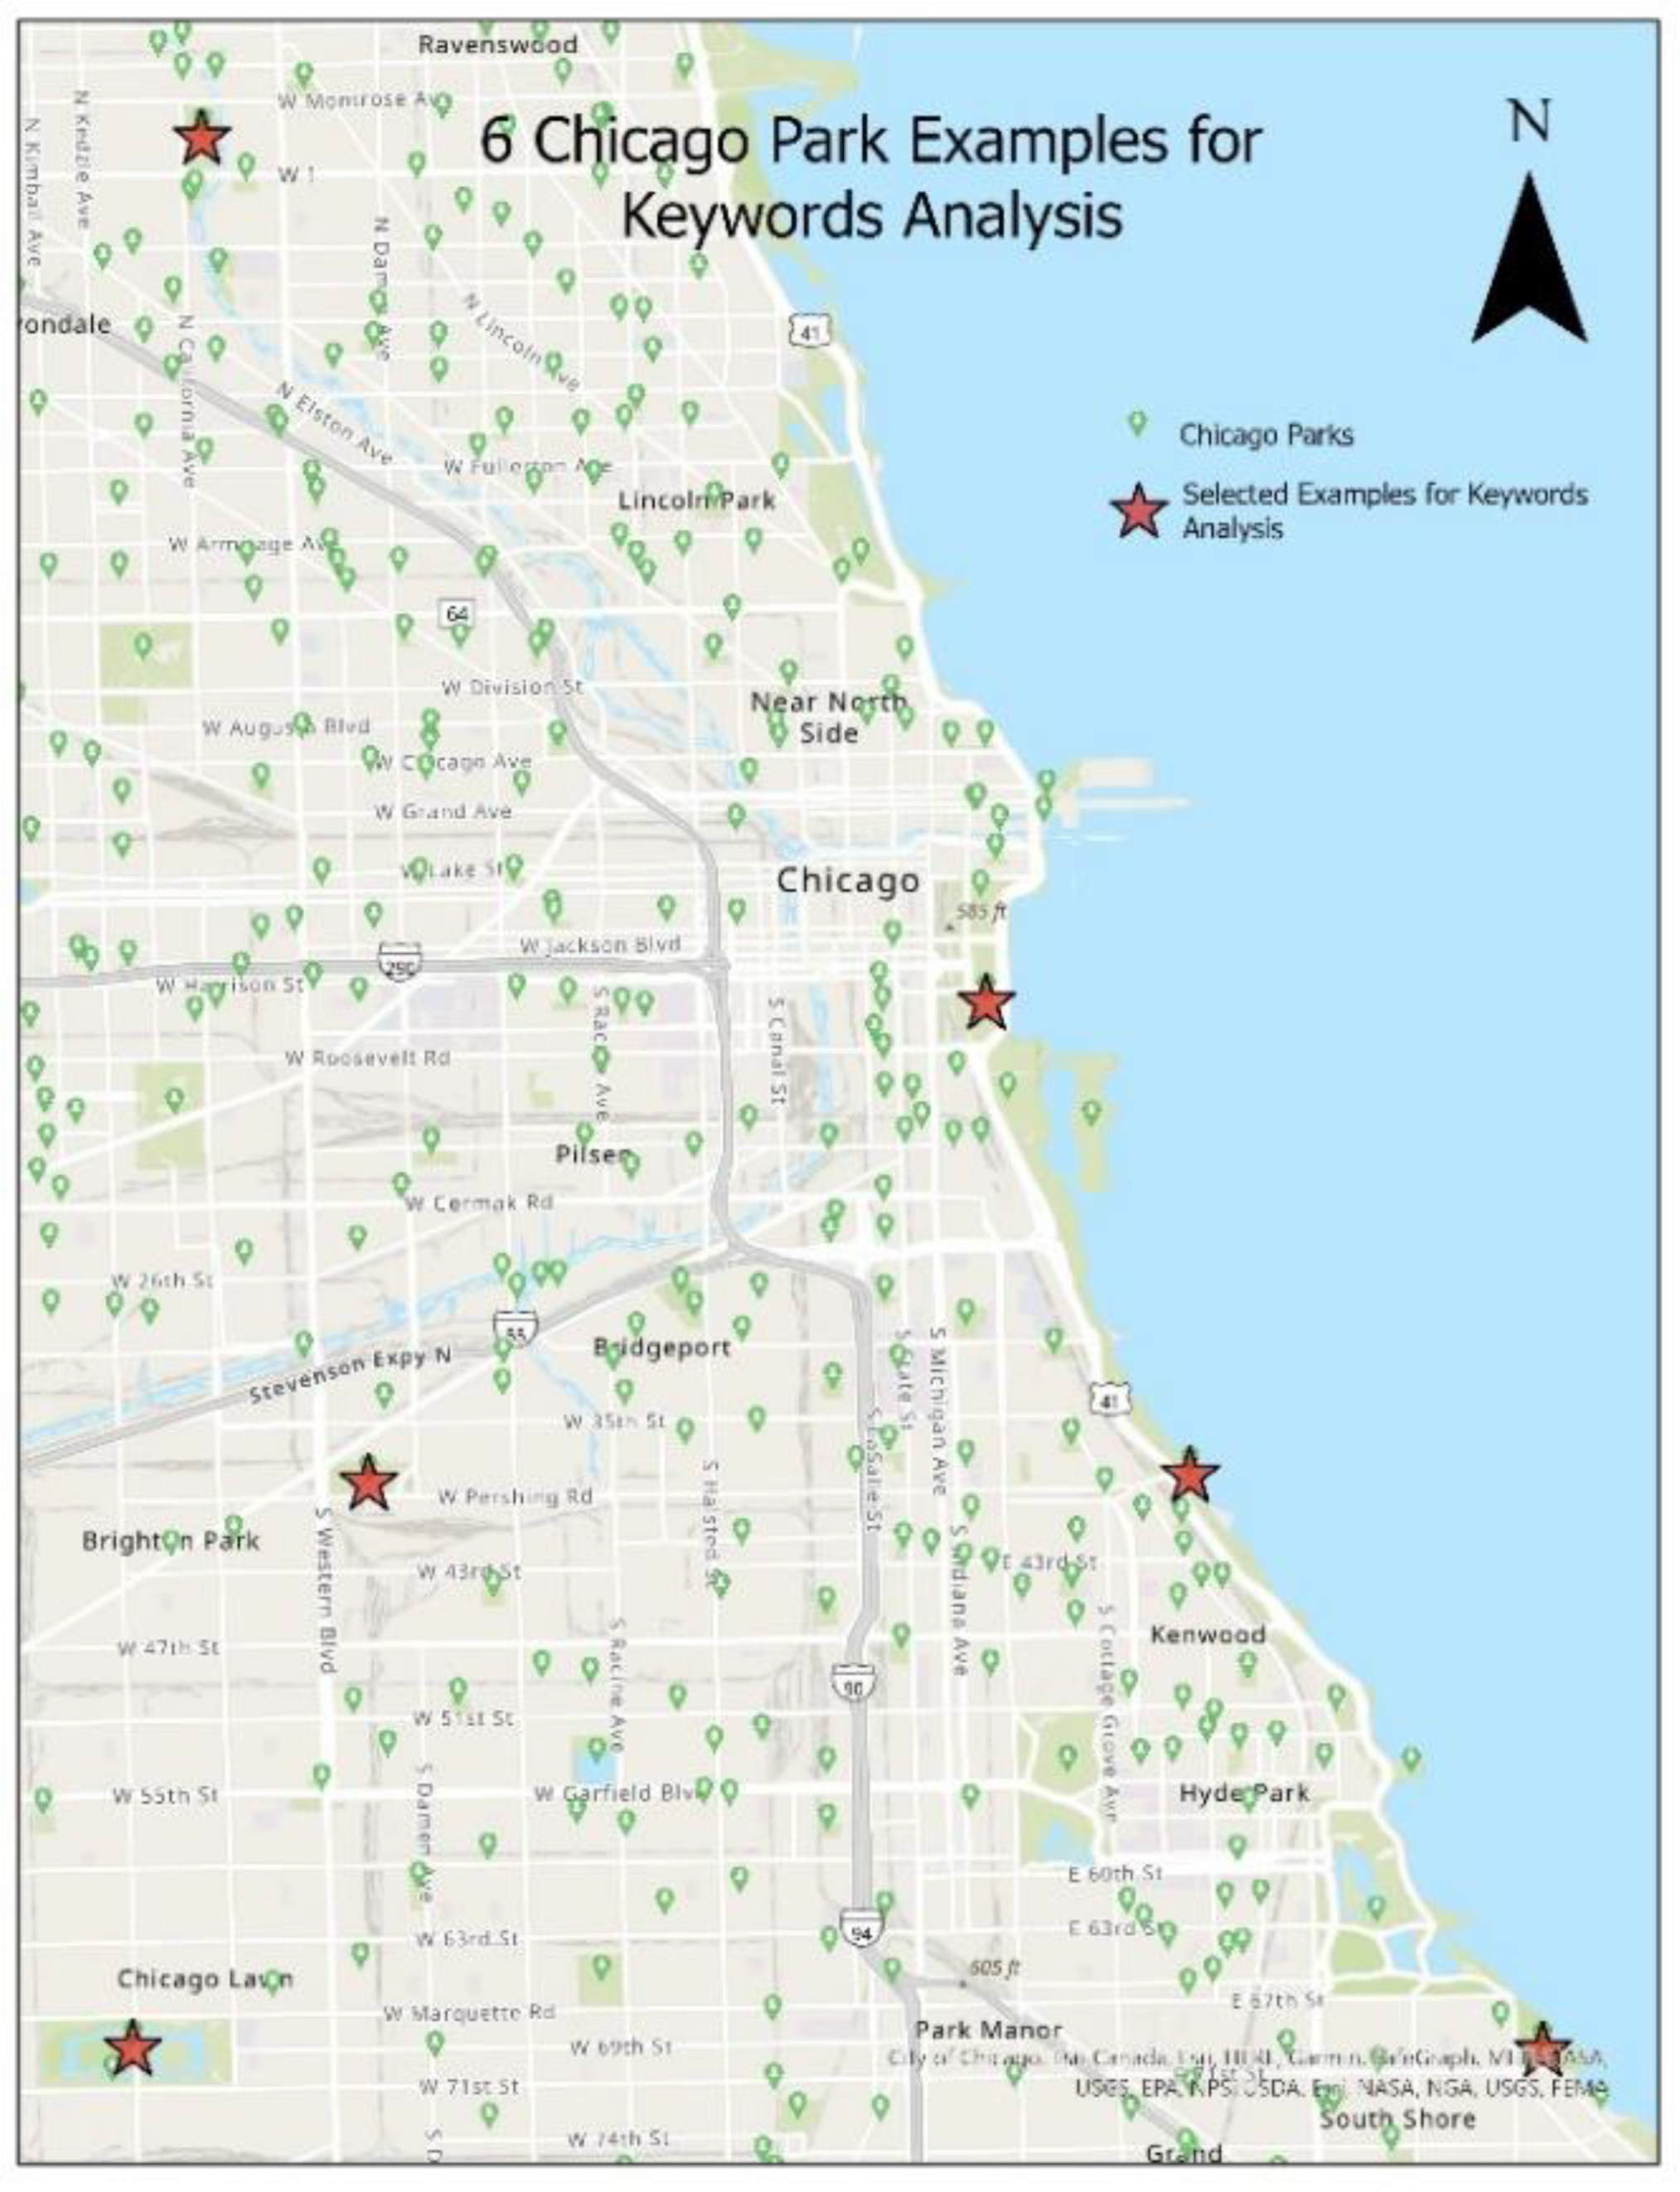
2.1. Study Area
2.2. Data Collection
2.3. Methods
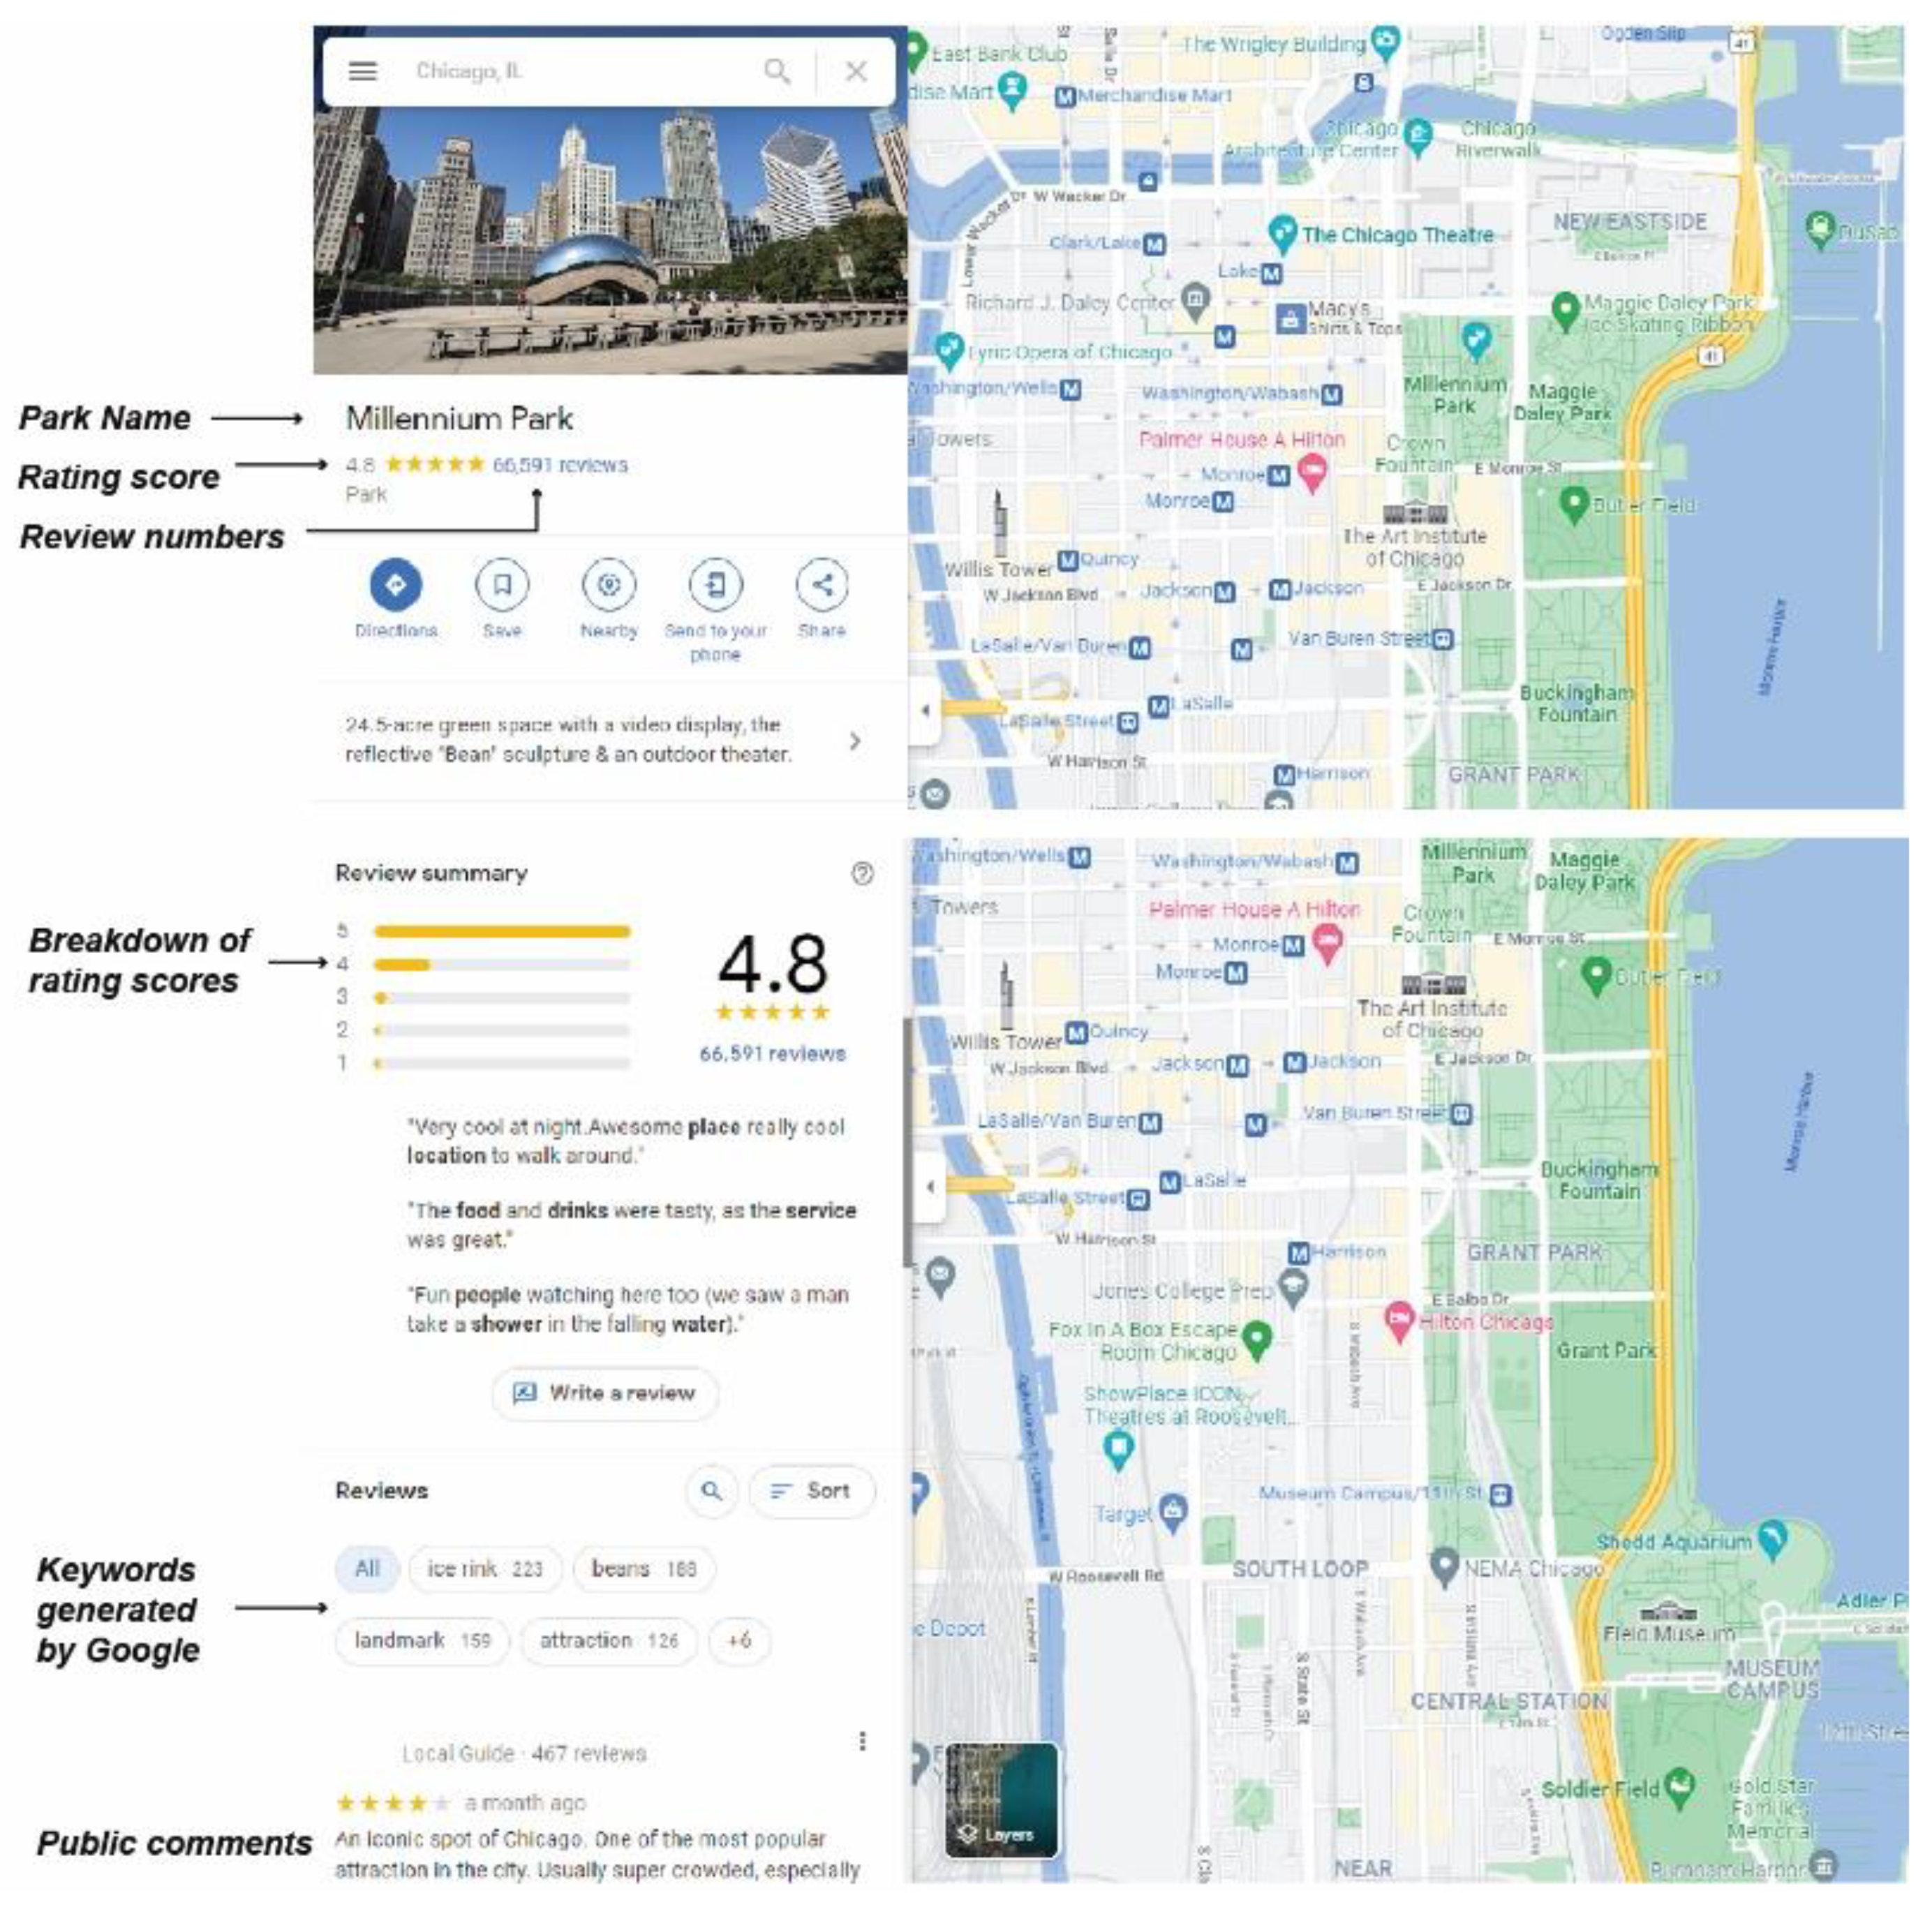
2.3.1. Web Crawler and Web Content Parsing
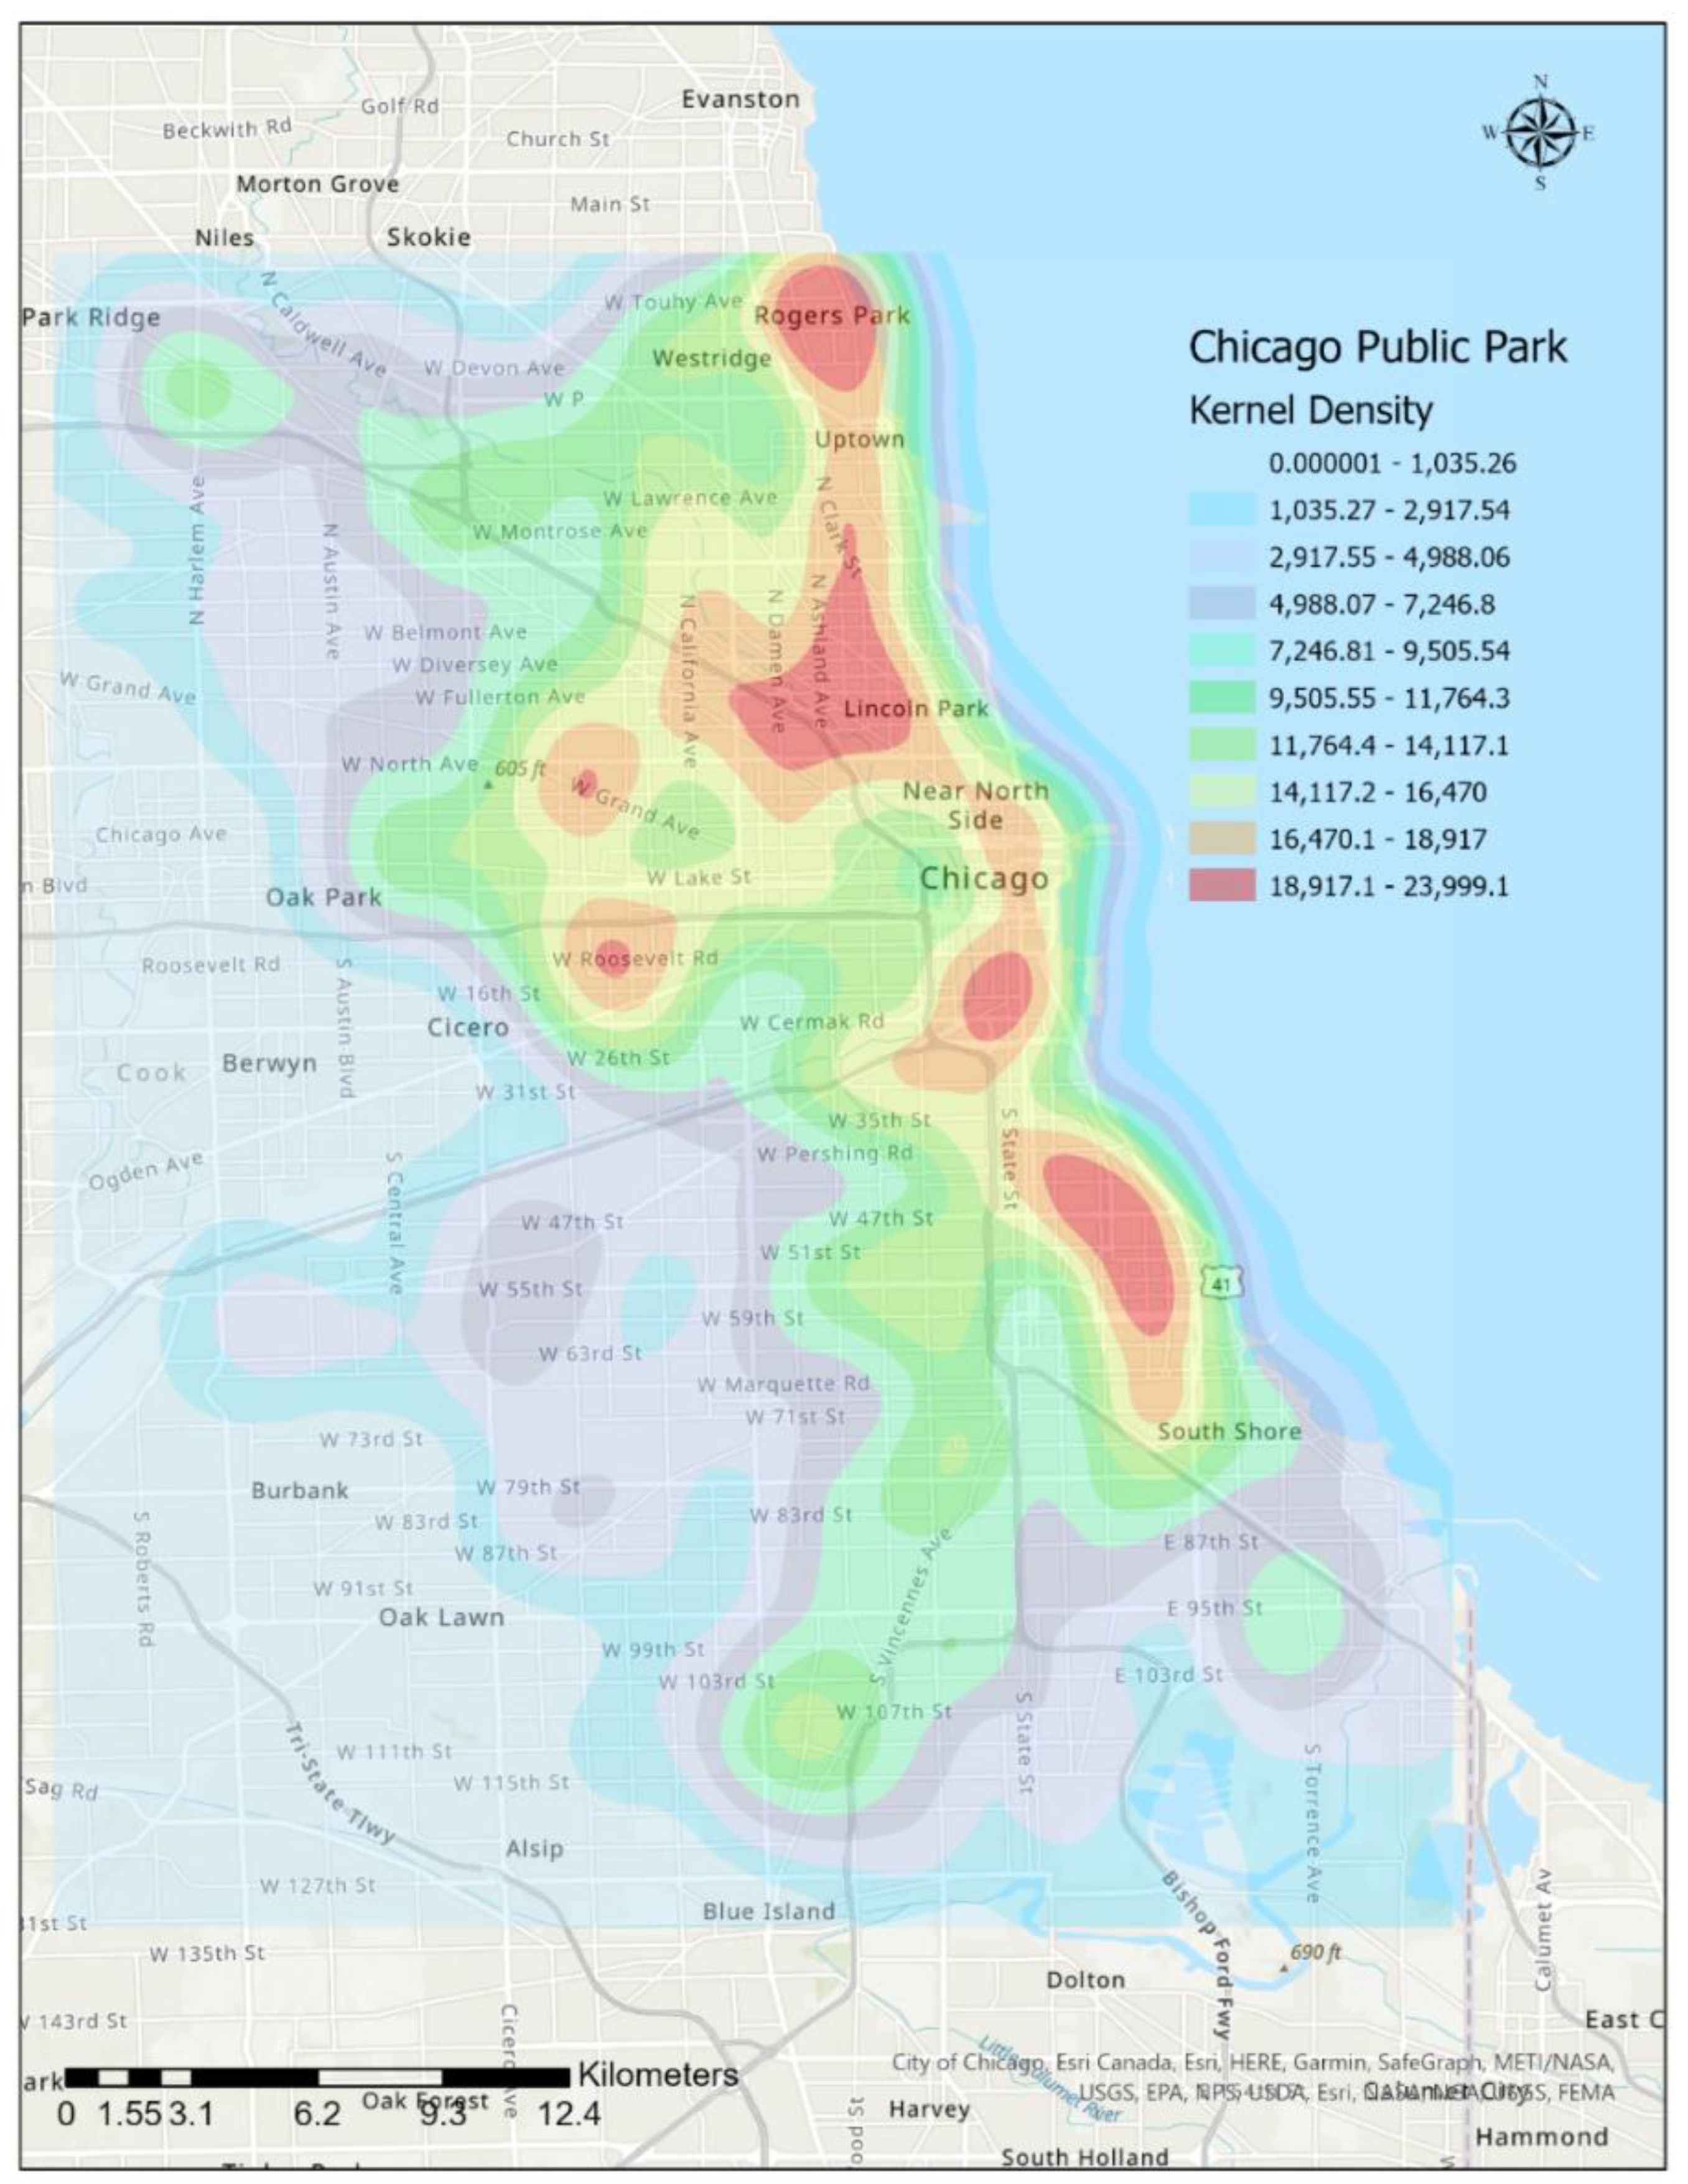
2.3.2. Kernel Density Estimation
2.3.3. Global Moran’s I and Getis–Ord Gi* Statistics
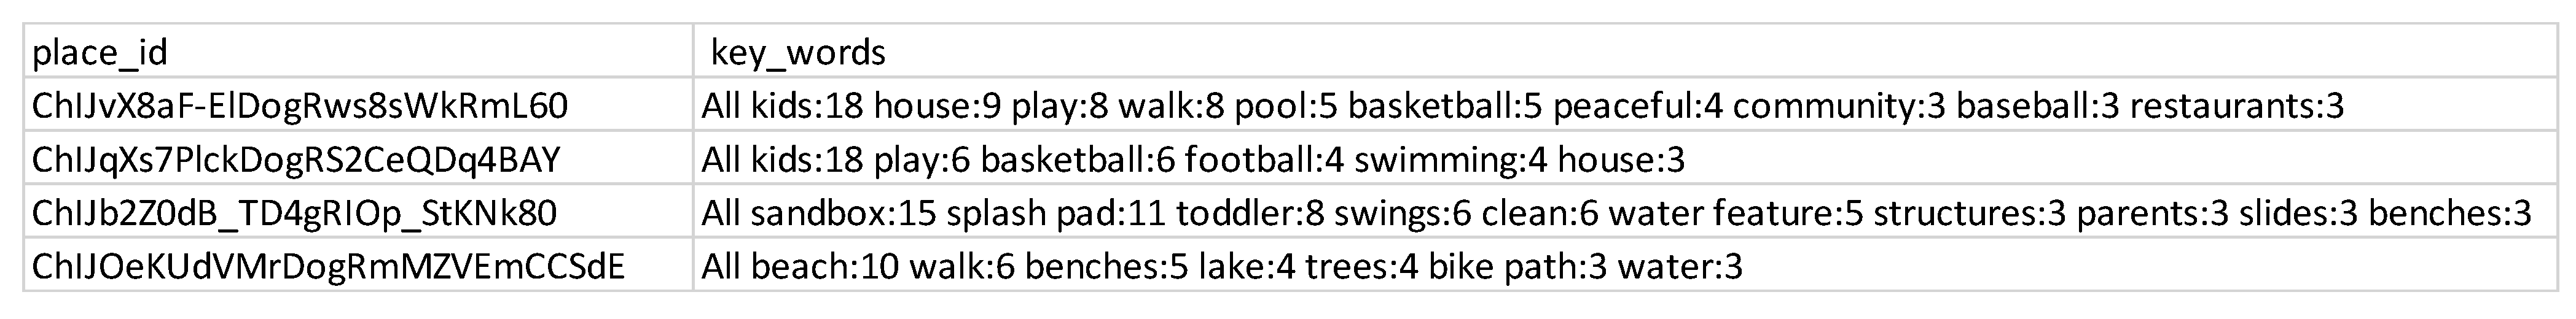
2.3.4. Review Keywords Analysis
3. Results and Conclusions
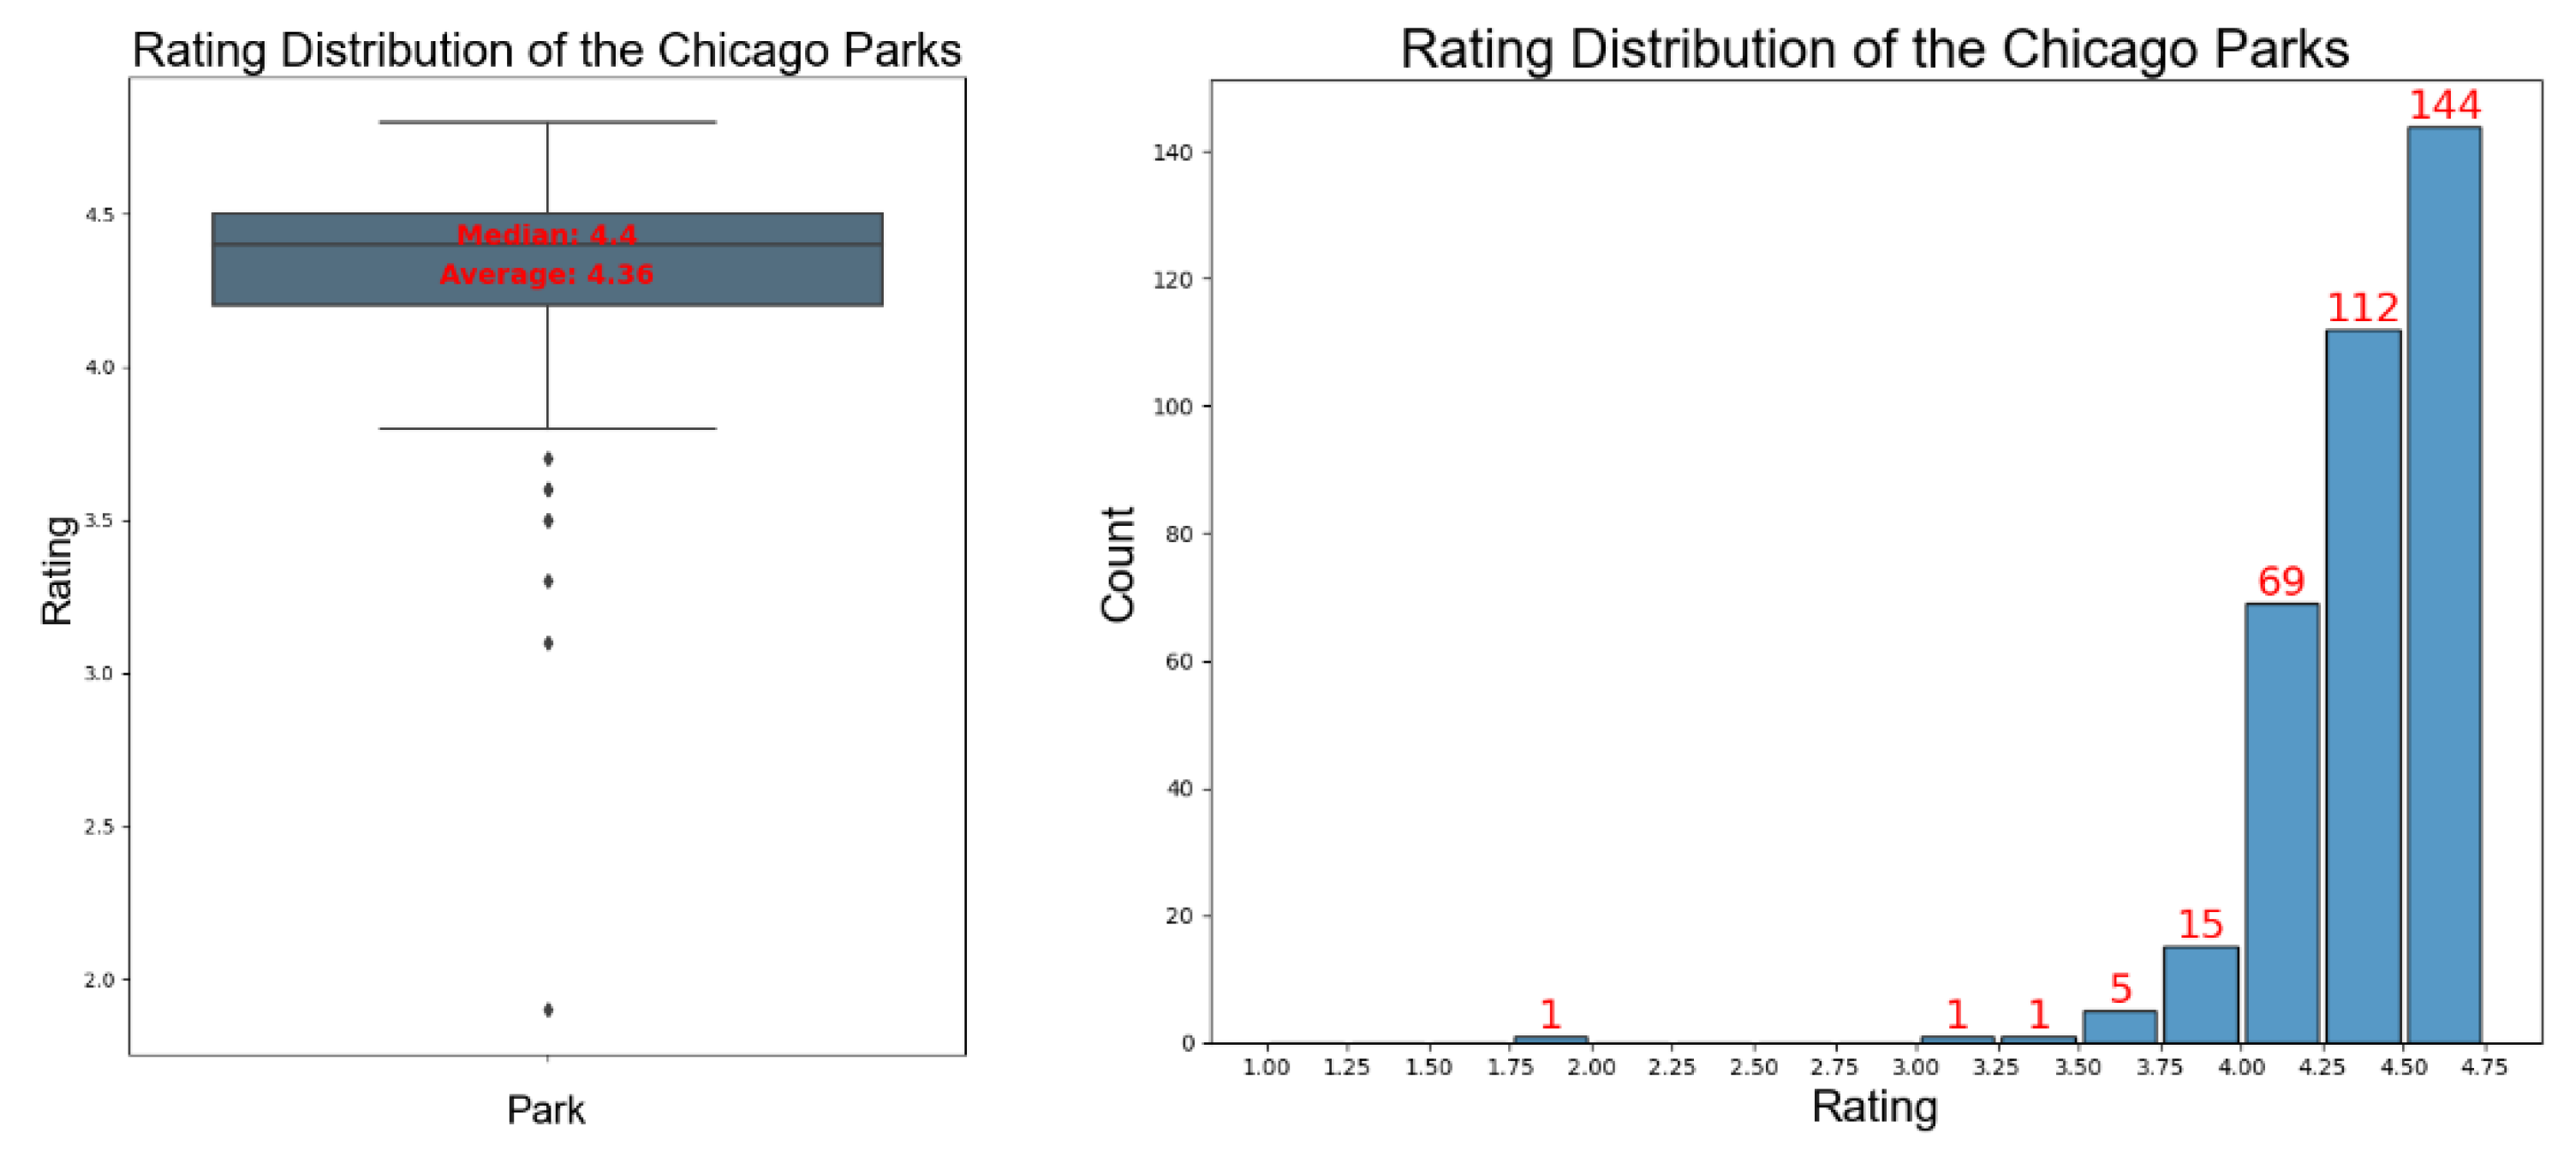
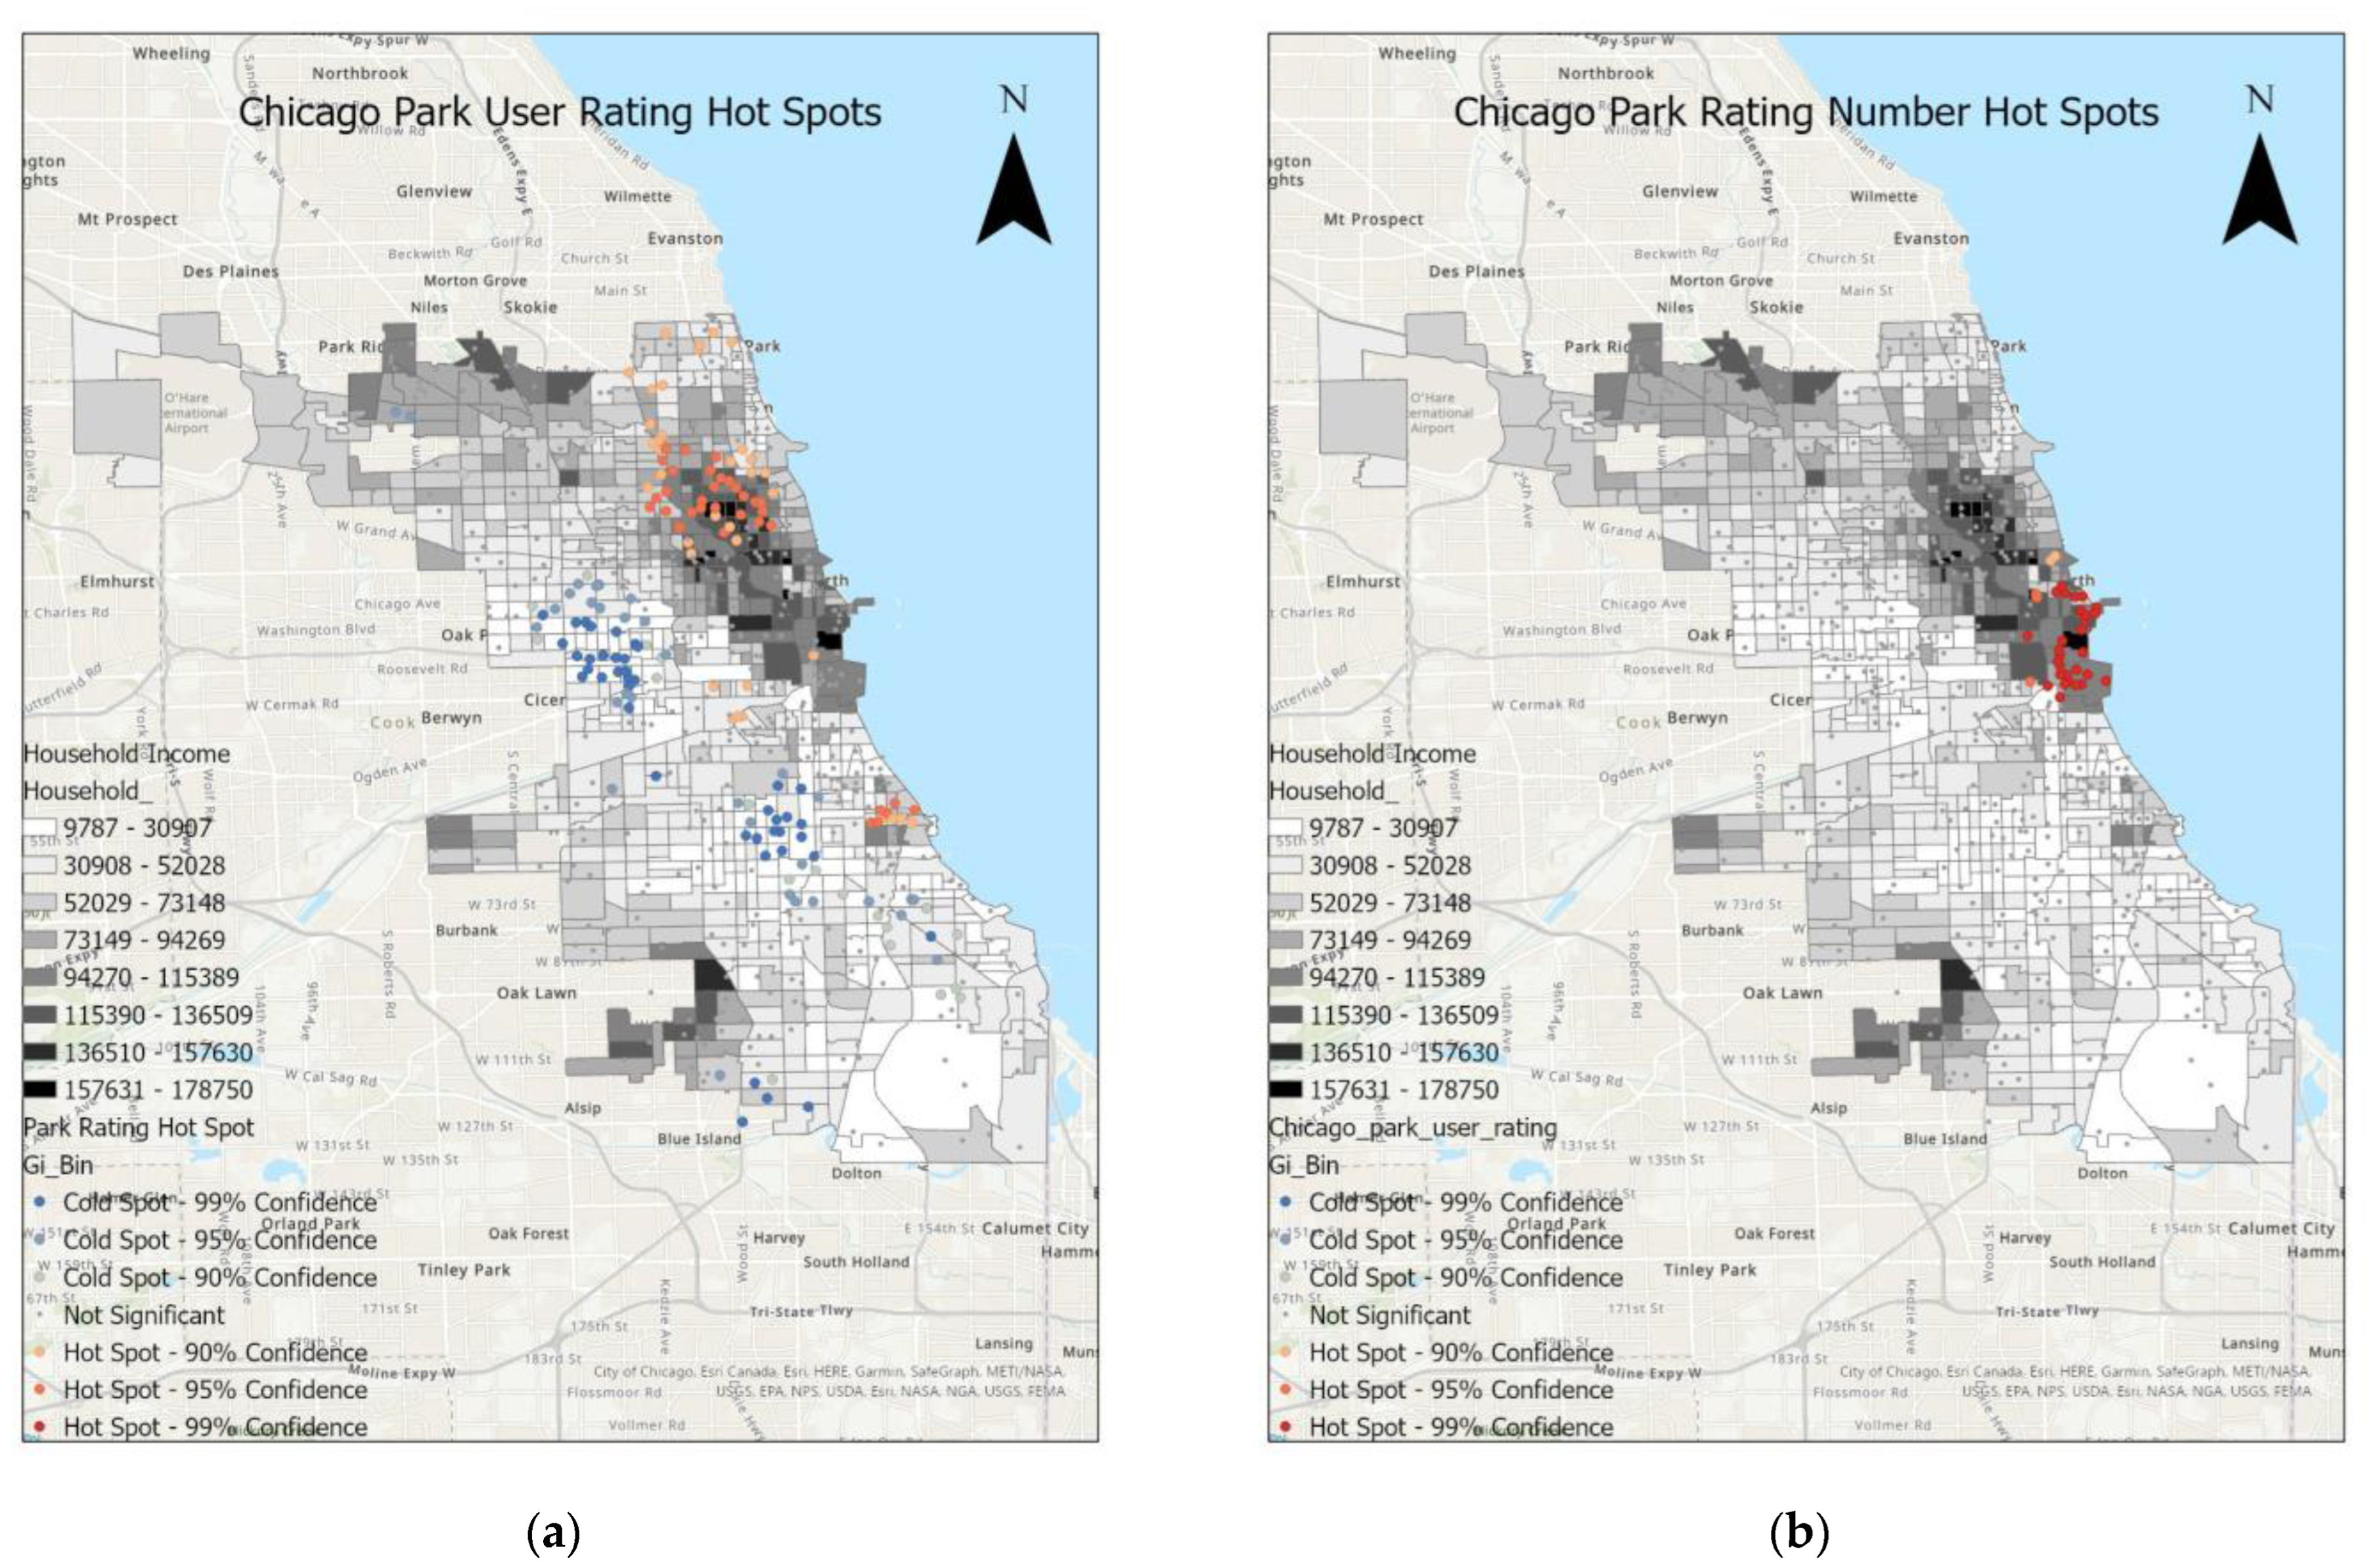
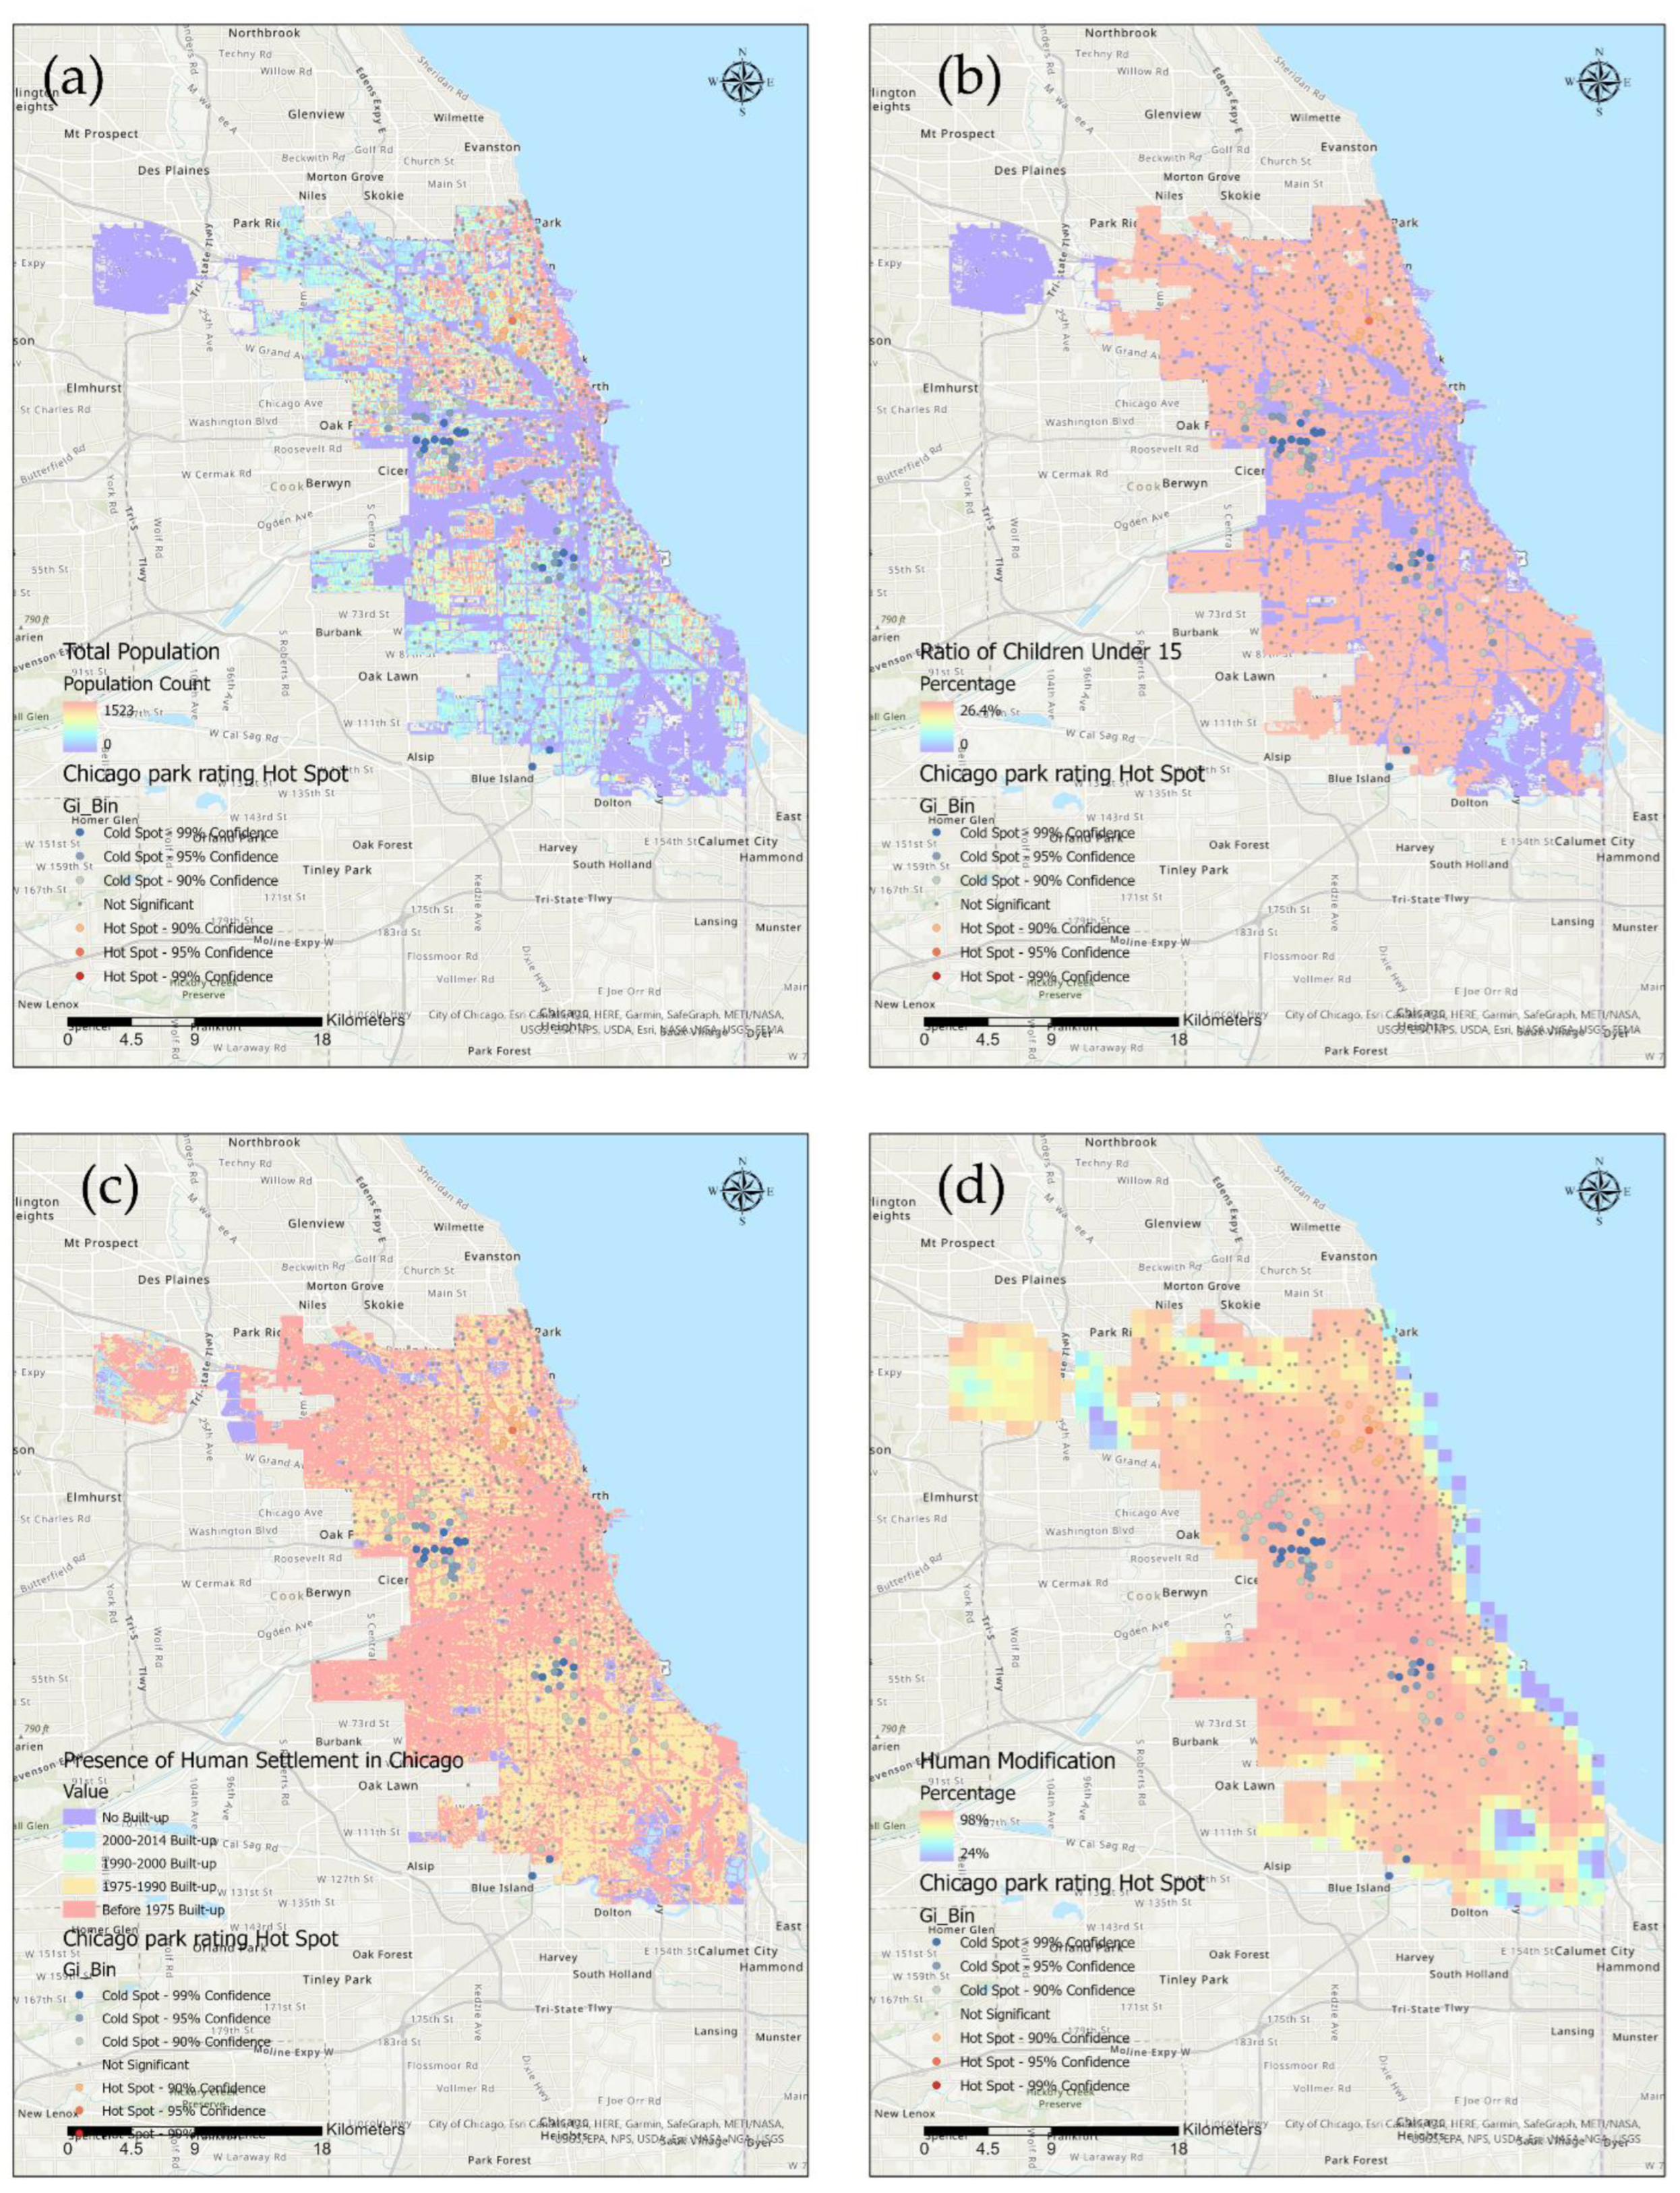
3.1. Spatial Patterns of Public Parks in Chicago
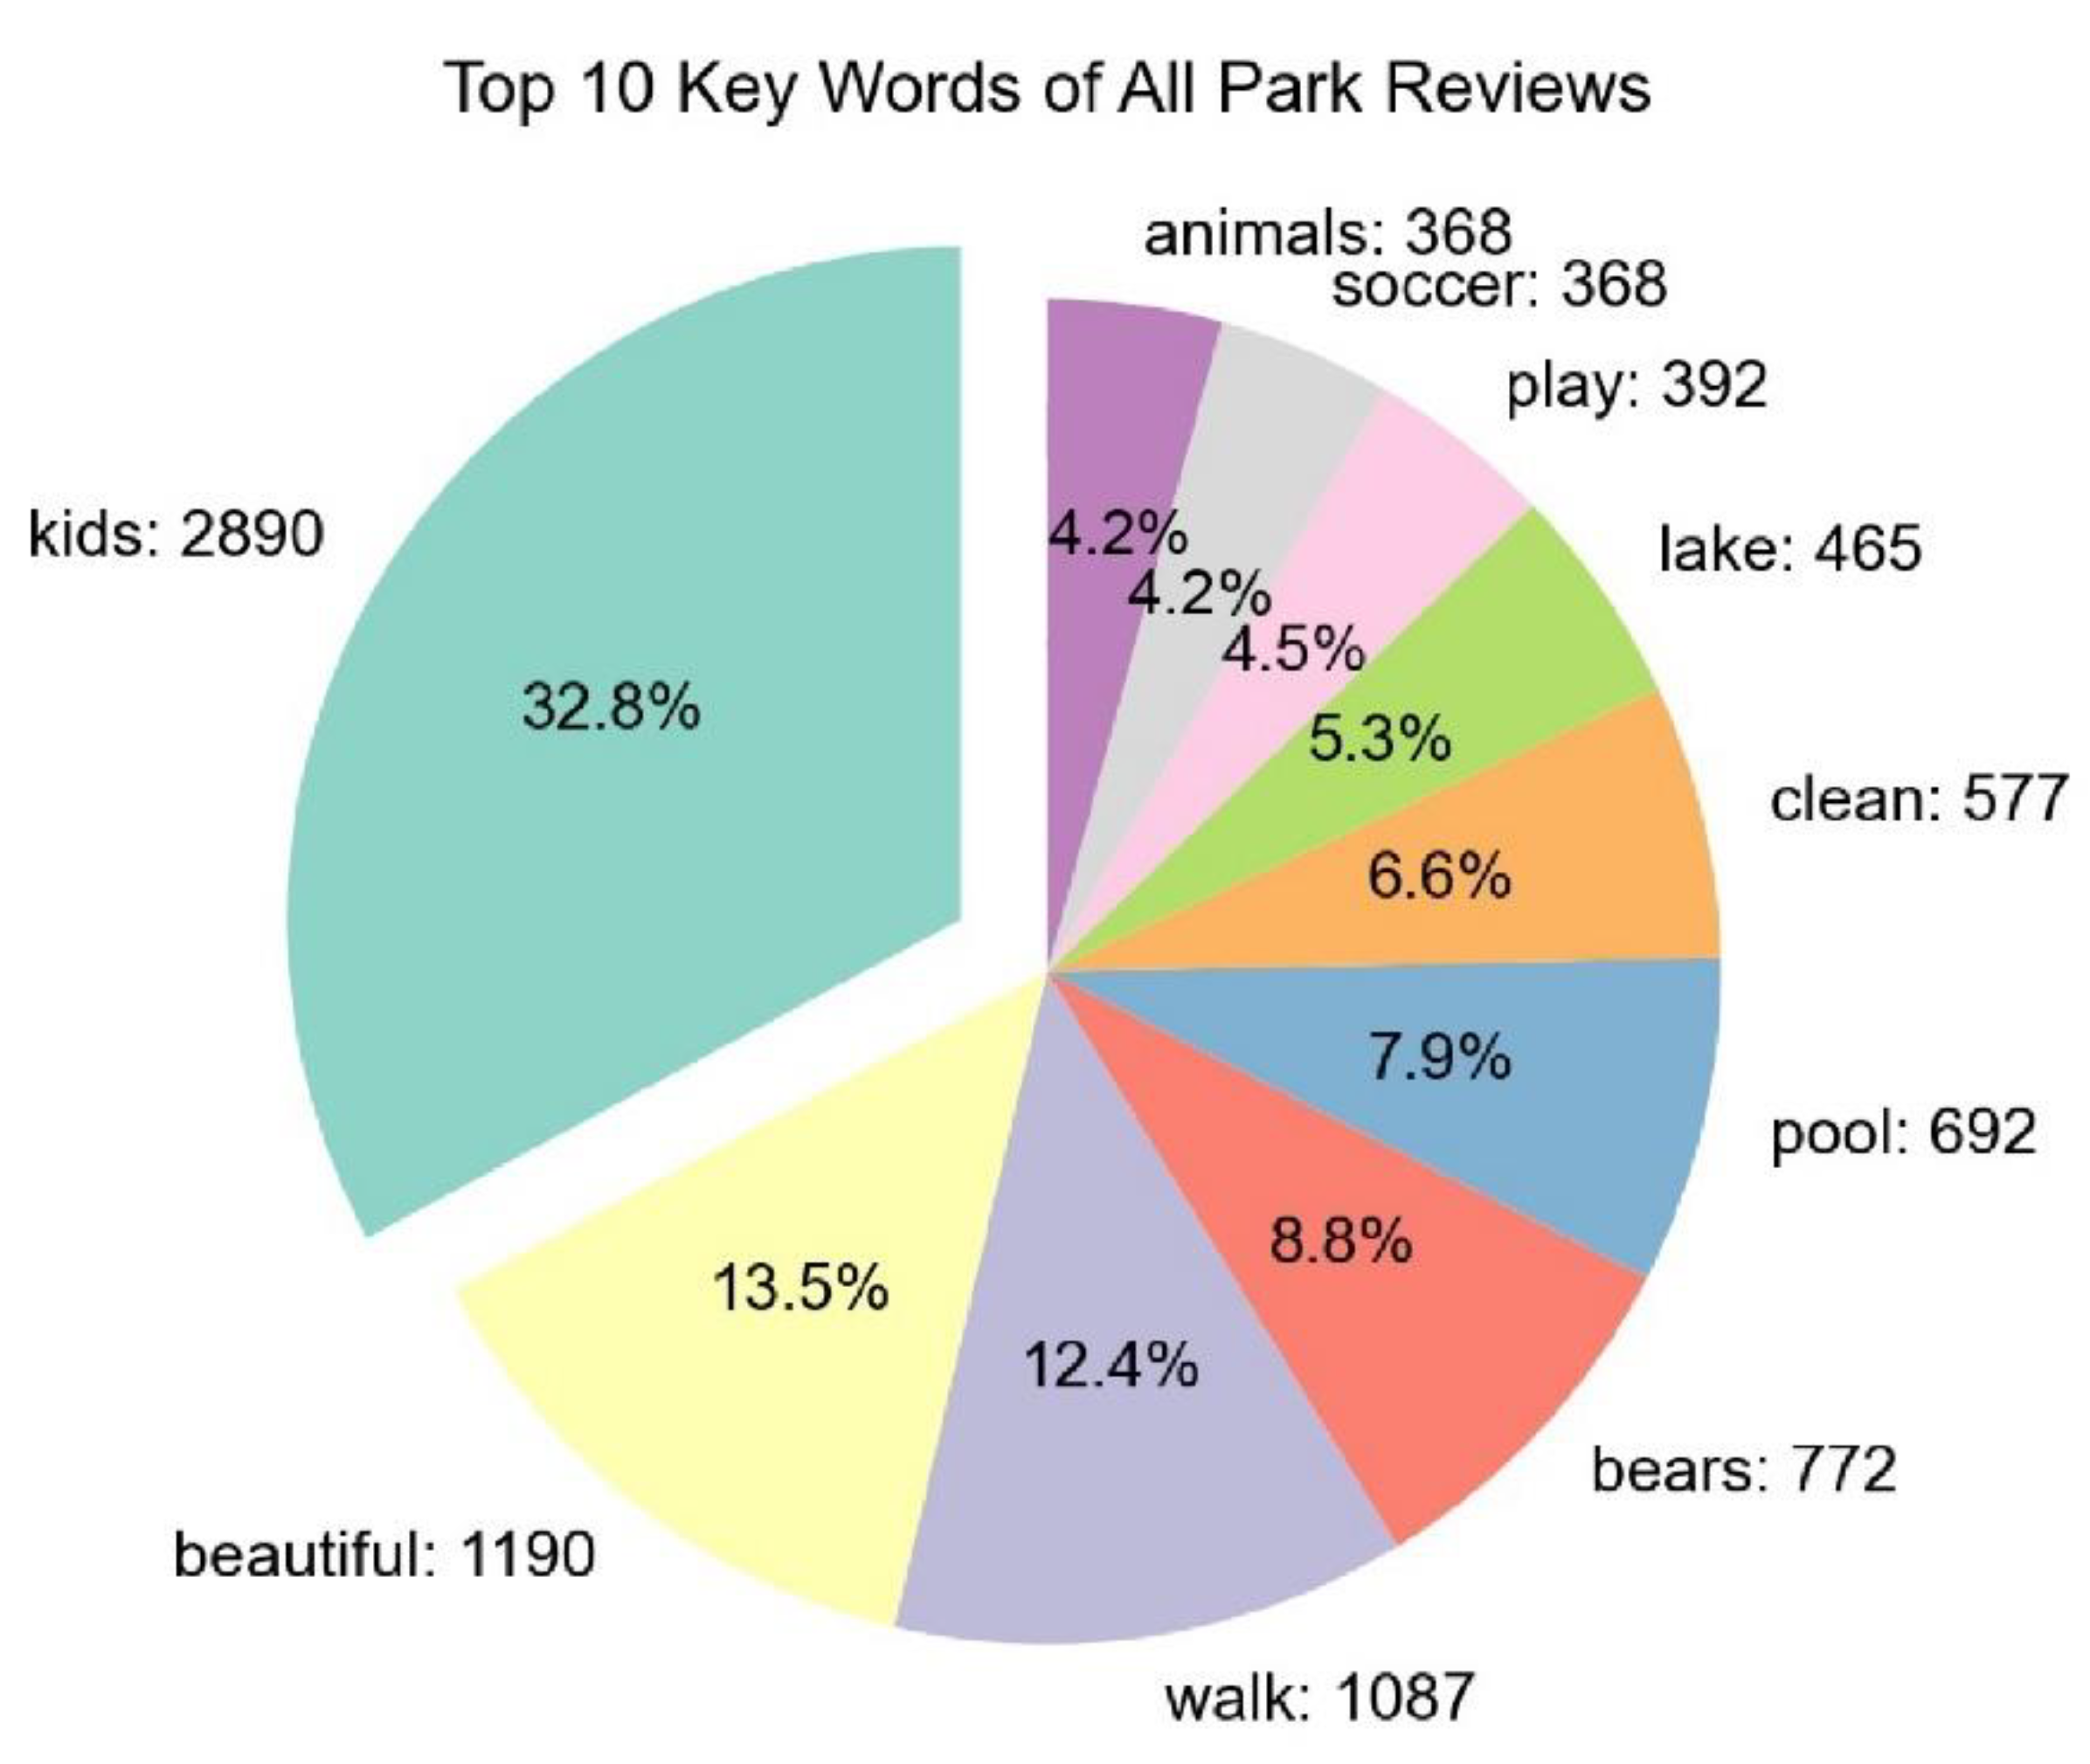
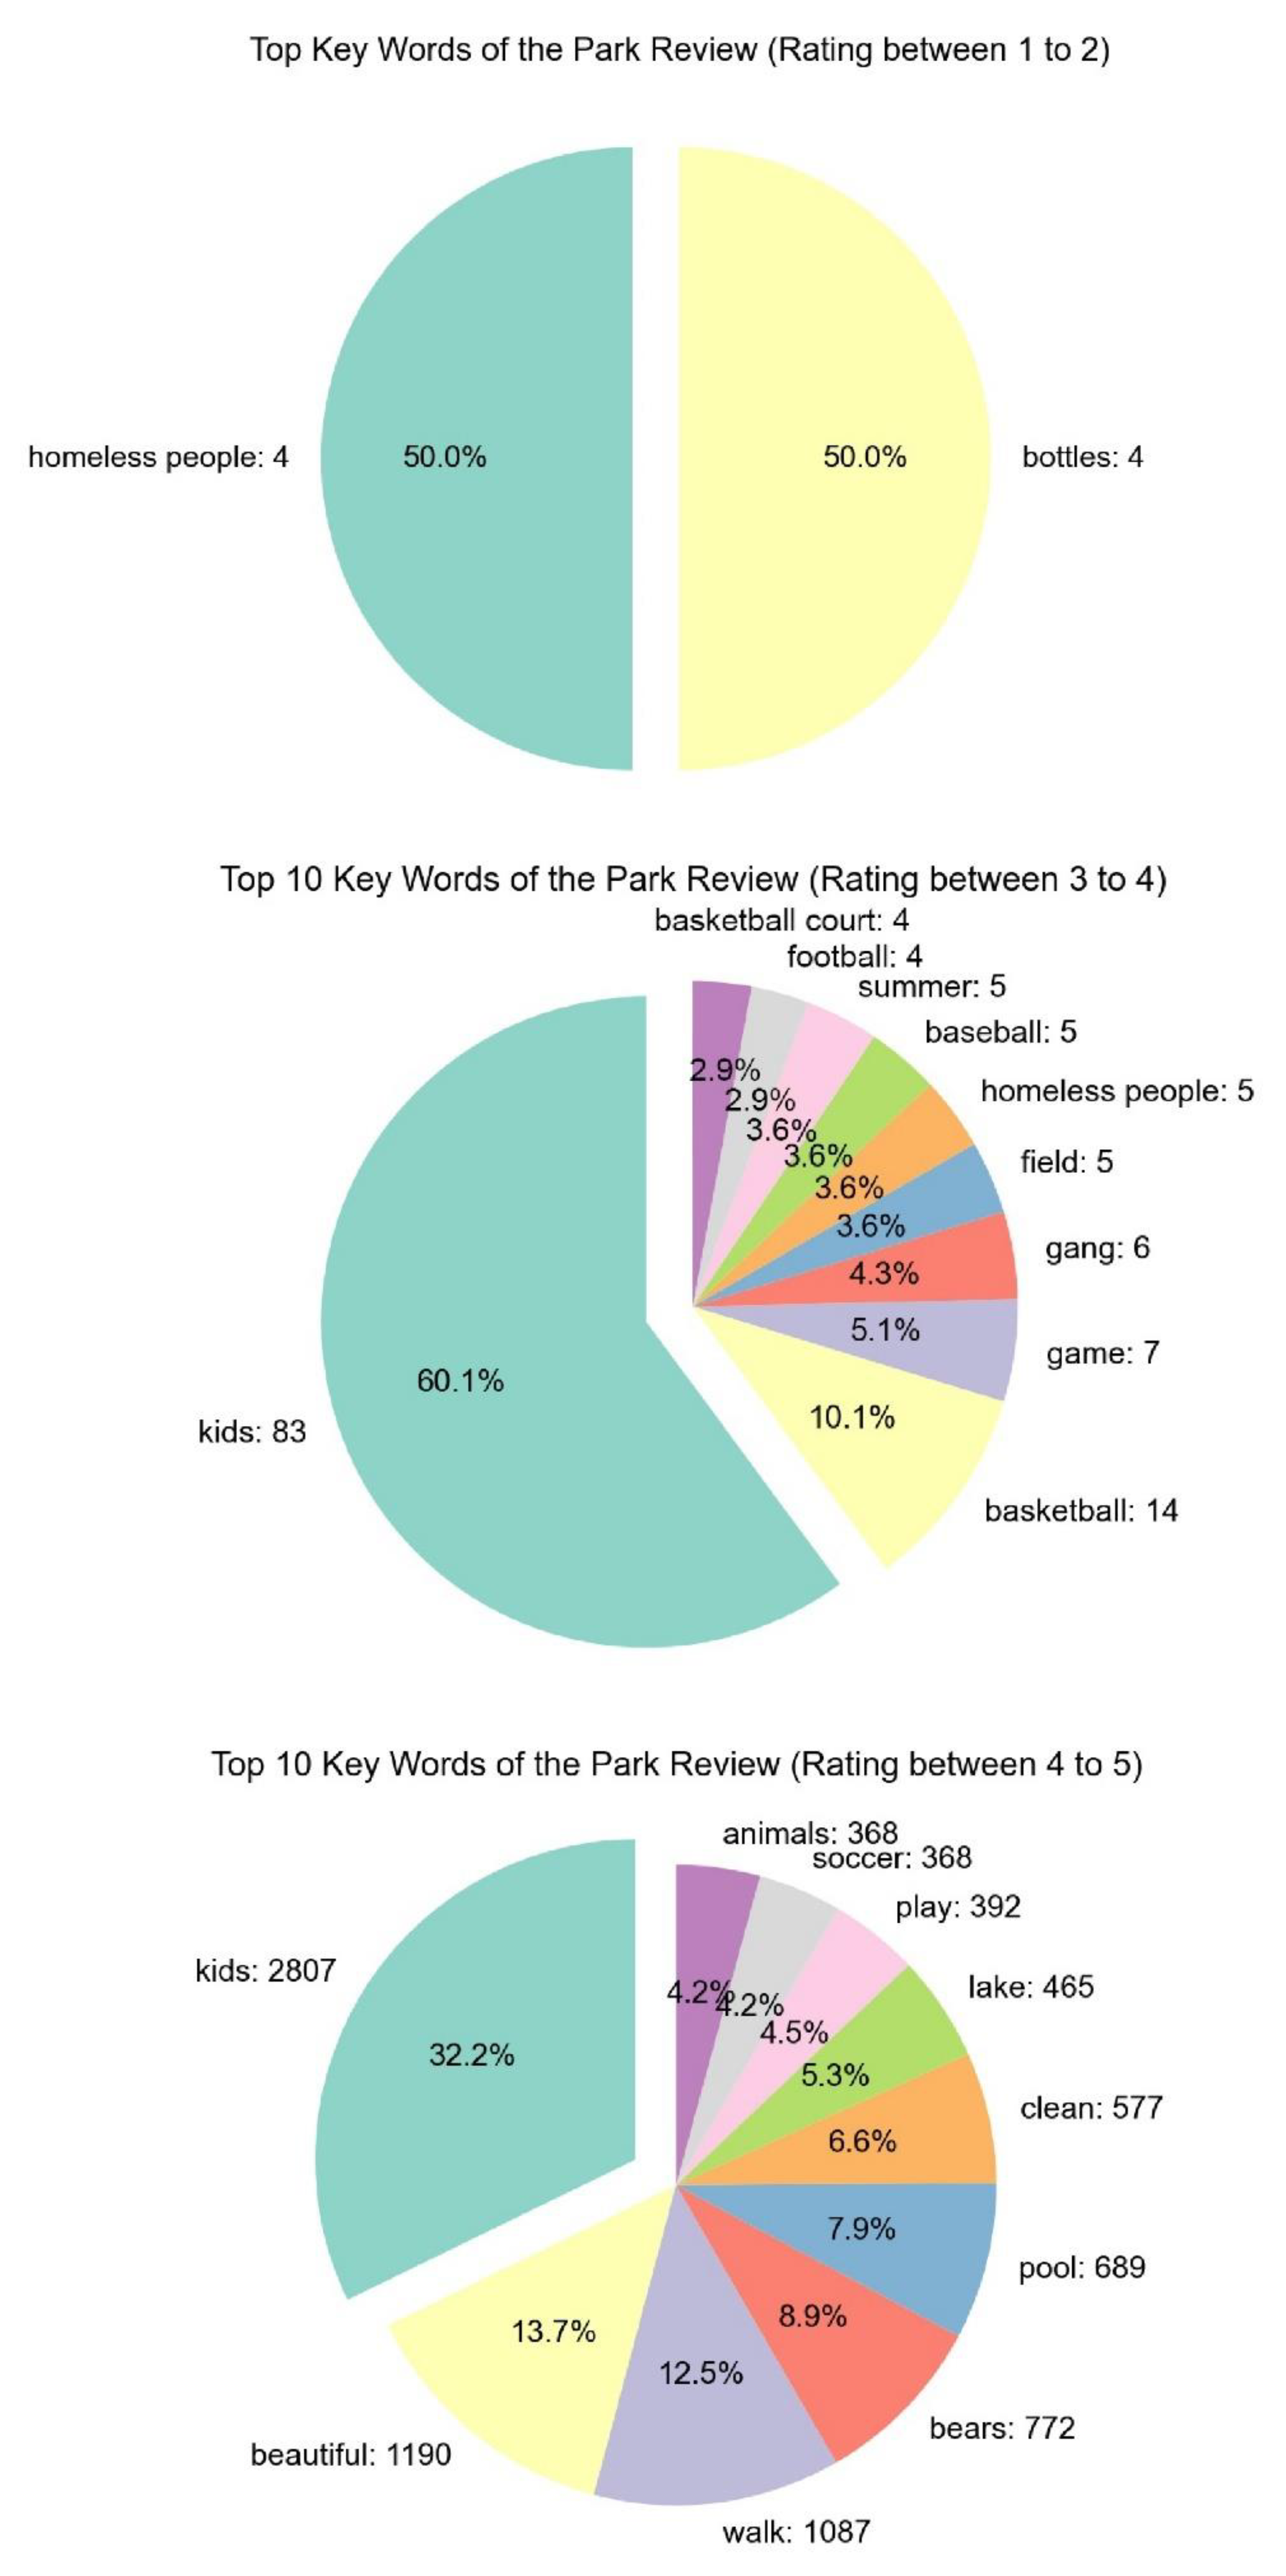
3.2. Keywords of Park Reviews by Different Ratings
4. Discussion and Conclusions
- (a)
- The evaluation and commenting are continuously live; hence, the information is always up to date.
- (b)
- Social media, especially Google Maps, is far-reaching, allowing any community members to contribute.
- (c)
- Social media data reveals and support discoveries of environmental justice issues.
- (d)
- With thorough and professional analysis, social media records and results may even guide a city’s finance and renovation priorities.
- (1)
- Reviews, and sometimes rating scores, tend to be polarized.
- (2)
- Data mining and scaping can be tedious and require professional skills and training.
- (3)
- Review quantities are key to convincing results. For parks with less comments, there is greater potential for biased results.
- (4)
- Reporting bias still exists.
Author Contributions
Funding
Conflicts of Interest
References
- Konijnendijk, C.C.; Annerstedt, M.; Nielsen, A.B.; Maruthaveeran, S. Benefits of urban parks. In A systematic Review. A Report for IFPRA; Alnarp International Federation of Parks and Recreation Administration: Copenhagen, Denmark, 2013. [Google Scholar]
- Hurd, A.R.; Anderson, D.M. The Park and Recreation Professional’s Handbook; Human Kinetics: Champaign, IL, USA, 2011. [Google Scholar]
- Chiesura, A. The role of urban parks for the sustainable city. Landsc. Urban Plan. 2004, 68, 129–138. [Google Scholar] [CrossRef]
- Ulrich, R.S. Natural versus urban scenes: Some psychophysiological effects. Environ. Behav. 1981, 13, 523–556. [Google Scholar] [CrossRef]
- Kaplan, S.; Talbot, J.F. Psychological benefits of a wilderness experience. In Behavior and the Natural Environment; Springer: Boston, MA, USA, 1983; pp. 163–203. [Google Scholar]
- Kuo, F.E.; Bacaicoa, M.; Sullivan, W.C. Transforming inner-city landscapes: Trees, sense of safety, and preference. Environ. Behav. 1998, 30, 28–59. [Google Scholar] [CrossRef]
- Luttik, J. The value of trees, water and open space as reflected by house prices in the Netherlands. Landsc. Urban Plan. 2000, 48, 161–167. [Google Scholar] [CrossRef]
- Błaszczyk, M.; Suchocka, M.; Wojnowska-Heciak, M.; Muszyńska, M. Quality of urban parks in the perception of city residents with mobility difficulties. PeerJ 2020, 8, e10570. [Google Scholar] [CrossRef] [PubMed]
- Boone, C.G.; Buckley, G.L.; Grove, J.M.; Sister, C. Parks and people: An environmental justice inquiry in Baltimore, Maryland. Ann. Assoc. Am. Geogr. 2009, 99, 767–787. [Google Scholar] [CrossRef]
- Cohen, D.A.; Marsh, T.; Williamson, S.; Derose, K.P.; Martinez, H.; Setodji, C.; McKenzie, T.L. Parks and physical activity: Why are some parks used more than others? Prev. Med. 2010, 50, S9–S12. [Google Scholar] [CrossRef] [Green Version]
- Rung, A.L.; Mowen, A.J.; Broyles, S.T.; Gustat, J. The role of park conditions and features on park visitation and physical activity. J. Phys. Act. Health 2011, 8, S178–S187. [Google Scholar] [CrossRef] [Green Version]
- Donahue, M.L.; Keeler, B.L.; Wood, S.A.; Fisher, D.M.; Hamstead, Z.A.; McPhearson, T. Using social media to understand drivers of urban park visitation in the Twin Cities, MN. Landsc. Urban Plan. 2018, 175, 1–10. [Google Scholar] [CrossRef]
- Zhang, S.; Zhou, W. Recreational visits to urban parks and factors affecting park visits: Evidence from geotagged social media data. Landsc. Urban Plan. 2018, 180, 27–35. [Google Scholar] [CrossRef]
- Scott, D.; Munson, W. Perceived constraints to park usage. J. Park Recreat. Adm. 1994, 12, 79–96. [Google Scholar]
- City of Seattle, Seattle Legislative Department. Seattle Parks and Recreation. Recreation Division Evaluation. 2018. Available online: https://www.seattle.gov/documents/Departments/ParksAndRecreation/PoliciesPlanning/Seattle_Legislative_SPR%20Recreation%20Evaluation%208-23-18.pdf (accessed on 23 August 2018).
- Pesavento, L.C. Reorganizing the Chicago Park District: From patronage to professional status. J. Leis. Res. 2000, 32, 116–120. [Google Scholar] [CrossRef]
- Byrne, J.; Wolch, J.; Zhang, J. Planning for environmental justice in an urban national park. J. Environ. Plan. Manag. 2009, 52, 365–392. [Google Scholar] [CrossRef]
- Rigolon, A. A complex landscape of inequity in access to urban parks: A literature review. Landsc. Urban Plan. 2016, 153, 160–169. [Google Scholar] [CrossRef]
- Rigolon, A. Parks and young people: An environmental justice study of park proximity, acreage, and quality in Denver, Colorado. Landsc. Urban Plan. 2017, 165, 73–83. [Google Scholar] [CrossRef]
- Takyi, S.A.; Seidel, A.D. Adaptive management in sustainable park planning and management: Case study of the city of Vancouver Parks. J. Urban Ecol. 2017, 3, juw009. [Google Scholar] [CrossRef]
- Sessoms, H.D. Eight Decades of Leadership Development: A History of Programs of Professional Preparation in Parks and Recreation: 1909–1989; National Recreation and Park Association: Ashburn, VA, USA, 1993. [Google Scholar]
- Wyrwoll, C. Social Media: Fundamentals, Models, and Ranking of User-Generated Content, 1st ed.; Springer: Vieweg, Wiesbaden, 2014; pp. 11–45. [Google Scholar]
- Timoshenko, A.; Hauser, J.R. Identifying customer needs from user-generated content. Mark. Sci. 2019, 38, 1–20. [Google Scholar] [CrossRef]
- O’connor, P. User-generated content and travel: A case study on Tripadvisor. com. In Proceedings of the ENTER, Innsbruck, Austria, 9–12 August 2008; Volume 2008, pp. 47–58. [Google Scholar]
- Purves, R.; Edwardes, A.; Wood, J. Describing place through user generated content. First Monday 2011, 16, 9. [Google Scholar] [CrossRef] [Green Version]
- Hamstead, Z.A.; Fisher, D.; Ilieva, R.T.; Wood, S.A.; McPhearson, T.; Kremer, P. Geolocated social media as a rapid indicator of park visitation and equitable park access. Comput. Environ. Urban Syst. 2018, 72, 38–50. [Google Scholar] [CrossRef]
- Barry, S.J. Using social media to discover public values, interests, and perceptions about cattle grazing on park lands. Environ. Manag. 2014, 53, 454–464. [Google Scholar] [CrossRef] [Green Version]
- Song, Y.; Zhang, B. Using social media data in understanding site-scale landscape architecture design: Taking Seattle Freeway Park as an example. Landsc. Res. 2020, 45, 627–648. [Google Scholar] [CrossRef]
- Lee, K.; Yu, C. Assessment of airport service quality: A complementary approach to measure perceived service quality based on Google reviews. J. Air Transp. Manag. 2018, 71, 28–44. [Google Scholar] [CrossRef]
- Mathayomchan, B.; Taecharungroj, V. “How was your meal?” Examining customer experience using Google maps reviews. Int. J. Hosp. Manag. 2020, 90, 102641. [Google Scholar] [CrossRef]
- Shah, M.; Pabel, A.; Martin-Sardesai, A. Assessing Google reviews to monitor student experience. Int. J. Educ. Manag. 2020, 34, 610–625. [Google Scholar] [CrossRef]
- Koerniawan, M.D.; Dewancker, B.J. Visitor Perceptions and Effectiveness of Place Branding Strategies in Thematic Parks in Bandung City Using Text Mining Based on Google Maps User Reviews. Sustainability 2019, 11, 2123. [Google Scholar] [CrossRef] [Green Version]
- Cronon, W. Nature’s Metropolis: Chicago and the Great West; WW Norton & Company: New York, NY, USA, 2009. [Google Scholar]
- Orsi, J.M.; Margellos-Anast, H.; Whitman, S. Black–white health disparities in the United States and Chicago: A 15-year progress analysis. Am. J. Public Health 2010, 100, 349–356. [Google Scholar] [CrossRef]
- Kolak, M.; Bradley, M.; Block, D.R.; Pool, L.; Garg, G.; Toman, C.K.; Wolf, M. Urban foodscape trends: Disparities in healthy food access in Chicago, 2007–2014. Health Place 2018, 52, 231–239. [Google Scholar] [CrossRef]
- Allen, D.J. Lost in the Transit Desert: Race, Transit Access, and Suburban Form; Routledge: London, UK, 2017. [Google Scholar]
- Chicago Park District. History of Chicago’s Parks. 2021. Available online: https://www.chicagoparkdistrict.com/about-us/history-chicagos-parks (accessed on 6 July 2021).
- Chicago Park District Official Website. Available online: https://www.chicagoparkdistrict.com/ (accessed on 6 July 2021).
- Borrego, Á.; Navarra, M.C. What users say about public libraries: An analysis of Google Maps reviews. Online Inf. Rev. 2020, 45, 84–98. [Google Scholar] [CrossRef]
- Kim, R.I.; Bernard, S. Comparing online reviews of hyper-local restaurants using deductive content analysis. Int. J. Hosp. Manag. 2020, 86, 102445. [Google Scholar] [CrossRef]
- Lestari, T. The language used by Indonesian local guides in Google Maps reviews. In Proceedings of the International Seminar on Language Maintenance and Shift (LAMAS) 7, The Vitality of Local Languages in Global Community, Semarang, Indonesia, 19–20 July 2017. [Google Scholar]
- Pesaresi, M.; Ehrlich, D.; Ferri, S.; Florczyk, A.; Freire, S.; Halkia, M.; Julea, A.; Kemper, T.; Soille, P.; Syrris, V. GHS Built-Up grid, Derived from Landsat, Multitemporal (1975, 1990, 2000, 2014). European Commission, Joint Research Centre (JRC). 2015. Available online: https://data.europa.eu/89h/jrc-ghsl-ghs_built_ldsmt_globe_r2015b (accessed on 16 November 2021).
- Kennedy, C.M.; Oakleaf, J.R.; Theobald, D.M.; Baruch-Mordo, S.; Kiesecker, J. Managing the middle: A shift in conservation priorities based on the global human modification gradient. Glob. Chang. Biol. 2019, 25, 811–826. [Google Scholar] [CrossRef]
- Scott, S. The TkWWW Robot: Beyond Browsing. In Proceedings of the Second World Wide Web Conference ’94: Mosaic and the Web, Chicago, IL, USA,, 17–20 October 1994. [Google Scholar]
- Kobayashi, M.; Takeda, K. Information retrieval on the web. ACM Comput. Surv. 2000, 32, 144–173. [Google Scholar] [CrossRef]
- Goyvaerts, J. Regular Expression Tutorial—Learn How to Use Regular Expressions. Available online: www.regular-expressions.info (accessed on 31 October 2021).
- Yin, P. Kernels and density estimation. In The Geographic Information Science & Technology Body of Knowledge, 1st ed.; Wilson, J.P., Ed.; University Consortium Geographic Information Science: Washington, DC, USA, 2020. [Google Scholar] [CrossRef]
- Taverniers, S.; Bosma, S.B.; Tartakovsky, D.M. Accelerated multilevel Monte Carlo with kernel-based smoothing and latinized stratification. Water Resour. Res. 2020, 56, e2019WR026984. [Google Scholar] [CrossRef]
- Kalinic, M.; Krisp, J.M. Kernel density estimation (KDE) vs. hot-spot analysis–detecting criminal hot spots in the City of San Francisco. In Proceedings of the 21st Conference on Geo-Information Science, Lund, Sweden, 12–15 June 2018. [Google Scholar]
- Hart, T.; Zandbergen, P. Kernel density estimation and hotspot mapping: Examining the influence of interpolation method, grid cell size, and bandwidth on crime forecasting. Polic. Int. J. Police Strateg. Manag. 2014, 37, 305–323. [Google Scholar] [CrossRef]
- Tiefelsdorf, M. Some practical applications of Moran’s I’s exact conditional distribution. Pap. Reg. Sci. 1998, 77, 101–129. [Google Scholar] [CrossRef]
- Manepalli, U.R.; Bham, G.H.; Kandada, S. Evaluation of hotspots identification using kernel density estimation (K) and Getis-Ord (Gi*) on I-630. In Proceedings of the 3rd International Conference on Road Safety and Simulation, Indianapolis, IN, USA, 14–16 September 2011; pp. 14–16. [Google Scholar]
- Boots, B.N.; Getis, A. Point Pattern Analysis; Sage Publications: Thousand Oaks, CA, USA, 1998. [Google Scholar]
- Getis, A.; Ord, J.K. The analysis of spatial association by use of distance statistics. Geogr. Anal. 1992, 24, 189–206. [Google Scholar] [CrossRef]
- Anselin, L. The local indicators of spatial association—LISA. Geogr. Anal. 1995, 27, 93–115. [Google Scholar] [CrossRef]
- Russell, E. Google Maps Platform: 9 Things to Know about Google’s Maps Data: Beyond the Map. 2019. Available online: https://cloud.google.com/blog/products/maps-platform/9-things-know-about-googles-maps-data-beyond-map (accessed on 19 November 2021).
- Perrin, A. Social media usage. Pew Res. Cent. 2015, 125, 52–68. [Google Scholar]
- Tucker, J.A.; Guess, A.; Barberá, P.; Vaccari, C.; Siegel, A.; Sanovich, S.; Nyhan, B. Social media, political polarization, and political disinformation: A review of the scientific literature. 2018. Available online: https://ssrn.com/abstract=3144139 (accessed on 19 March 2018).
- Chan, H.K.; Wang, X.; Lacka, E.; Zhang, M. A mixed-method approach to extracting the value of social media data. Prod. Oper. Manag. 2016, 25, 568–583. [Google Scholar] [CrossRef]
- Tsou, M.H. Research challenges and opportunities in mapping social media and Big Data. Cartogr. Geogr. Inf. Sci. 2015, 42 (Suppl. 1), 70–74. [Google Scholar] [CrossRef]
- Chen, H.; Zheng, Z.; Ceran, Y. De-biasing the reporting bias in social media analytics. Prod. Oper. Manag. 2016, 25, 849–865. [Google Scholar] [CrossRef]


| Attributes | Description |
|---|---|
| name | Park name. |
| formatted_address | A string containing the human-readable address of this park. |
| place_id | A unique identifier of this park, which can be used with other Google APIs. |
| rating | Park rating, from 1.0 to 5.0, based on aggregated user reviews. |
| user_ratings_total | The total number of reviews of this park, with or without text. |
| lat | Latitude of this park in decimal degrees. |
| lng | Longitude of this park in decimal degrees. |
| url | The URL (Uniform Resource Locator) of the official Google page for this park. This is the Google-owned page that contains the best available information about the place. |
| Attributes | Description |
|---|---|
| place_id | A unique identifier of this park, which can be used with other Google APIs. |
| key_words | Key words mentioned by multiple reviews that can label the features of a park. |
| Kw_mentioned | Total number of each keyword for all reviews. |
| Attributes | Moran’s I | z-Score | p-Value |
|---|---|---|---|
| Park rating | 0.089 | 4.40 | 0.000011 |
| Park rating numbers | 0.035 | 2.13 | 0.033 |
Publisher’s Note: MDPI stays neutral with regard to jurisdictional claims in published maps and institutional affiliations. |
© 2022 by the authors. Licensee MDPI, Basel, Switzerland. This article is an open access article distributed under the terms and conditions of the Creative Commons Attribution (CC BY) license (https://creativecommons.org/licenses/by/4.0/).
Share and Cite
Huang, Y.; Li, Z.; Huang, Y. User Perception of Public Parks: A Pilot Study Integrating Spatial Social Media Data with Park Management in the City of Chicago. Land 2022, 11, 211. https://doi.org/10.3390/land11020211
Huang Y, Li Z, Huang Y. User Perception of Public Parks: A Pilot Study Integrating Spatial Social Media Data with Park Management in the City of Chicago. Land. 2022; 11(2):211. https://doi.org/10.3390/land11020211
Chicago/Turabian StyleHuang, Yiwei, Zhixin Li, and Yuhan Huang. 2022. "User Perception of Public Parks: A Pilot Study Integrating Spatial Social Media Data with Park Management in the City of Chicago" Land 11, no. 2: 211. https://doi.org/10.3390/land11020211