Article

Reconstruction of Agriculture-Driven Deforestation in Western Hunan Province of China during the 18th Century

1
Northwest Institute of Historical Environment and Socio-Economic Development, Shaanxi Normal University, Xi’an 710119, China
2
Faculty of Geographical Science, Beijing Normal University, Beijing 100875, China
3
Key Laboratory of Environment Change and Natural Disaster, Ministry of Education, Beijing Normal University (BNU), Beijing 100875, China
4
School of Biological and Environmental Engineering, Xi’an University, Xi’an 710065, China
*
Author to whom correspondence should be addressed.
Land 2022, 11(2), 181; https://doi.org/10.3390/land11020181
Submission received: 7 December 2021 / Revised: 18 January 2022 / Accepted: 21 January 2022 / Published: 24 January 2022
(This article belongs to the Section Land Systems and Global Change)

Abstract

:
Reconstruction of historical deforestation helps to understand the dynamics of forest cover change and provides a basis for the further study of human-nature interactions over the long term. Significant agriculture-driven deforestation occurred in the 18th century in China due to its socio-cultural transformation. To understand this deforestation during the 18th century, we took typical counties in western Hunan as a case study area and reconstructed the settlements’ expansion and densification as indicators of socio-cultural factors. We then reconstructed the agricultural land expansion and agriculture-driven deforestation based on these settlements. The results showed that the agricultural land area increased by 40.4% from the early to the late 18th century, while the proportion of forest area covering the region decreased from 78.0% to 69.1%. Meanwhile, agriculture-driven deforestation mainly unfolded in the eastern and western parts of the region at relatively low elevation in the early 18th century, and this mainly happened in the middle of the region lying at relatively high elevation in the late 18th century. This study’s results provide an improved spatial resolution for the reconstruction of historical land use/cover change, thus enabling insights to be gained from a more detailed spatiotemporal pattern of historical deforestation trends. This study helps to understand the anthropogenic land cover change on a larger spatiotemporal scale through a regional case study.

1. Introduction

Thirty-one percent of the global land area is covered by forest, including tropical, subtropical, temperate, and boreal forest ecosystems [1]. The forest provides critical ecological services for humans and plays an irreplaceable role in maintaining the carbon and water cycles [2,3]. Given that forest is so important, anthropogenic forest clearing has a noticeable impact on environmental change [2,4,5]. As a type of land use/cover change (LUCC or LULC), deforestation is a major source of anthropogenic greenhouse gas emissions and is recognized as a major driver of biodiversity loss [2,4,5]. Forest cover loss is driven by multiple factors, and the paramount cause is the agricultural activity (e.g., land reclamation) in the mid and low latitude areas [6,7]. Hence, studying agriculture-driven deforestation dynamics can help one better understand the environmental changes caused by humans [4,6].
Since the agricultural revolution, a large amount of forest area has disappeared as a result of agricultural land expansion [8,9,10]. Reductions of forest area have occurred because of long term land reclamation in many areas, such as in North America, Europe, East Asia, and South Asia [11,12,13,14,15]. In addition, at the global scale, the percentage of cropland area has increased from less than 1% to occupying more than 12.2% of the global land area over the past 2000 years, and a substantial part of that increase has come at the cost of lost forest area [11,16,17]. Therefore, a reconstruction of historical agriculture-driven deforestation can provide a basis for the further study of long-term changes in forest cover [10,18].
Researchers have paid some attention to agriculture-driven deforestation during historical periods. A spatially explicit reconstruction of historical LUCC (e.g., forestland and cropland) provides an opportunity to better understand its spatiotemporal pattern and helps to lay the foundation for the further quantitative assessment of LUCC impacts on environmental change [19,20,21]. Several global historical LUCC datasets have been developed, such as HYDE (History Database of the Global Environment) [17] and KK10 (Kaplan and Krumhardt) [11,16]. Although these global historical LUCC datasets have been widely applied in many studies on global change, they still have some uncertainties based on evaluation results [19,21,22,23,24]. To improve these LUCC datasets, the PAGES (Past Global Changes) LandCover6k working group has proposed paying closer attention to the socio-cultural factors, putting them on par with the physical environment in terms of importance [19]. In recent studies, researchers have used settlements or settlement relics as indicators of socio-cultural effects to reconstruct the historical LUCC [23,24,25,26,27]. Compared with the global historical LUCC datasets, these studies, using settlements or settlement relics, were able to obtain more accurate and reliable spatiotemporal patterns of historical LUCC [24], especially at regional scales [26,27]. A spatially explicit reconstruction of deforestation based on settlements in more areas can provide needed insight into the socio-cultural effects on historical LUCC.
China is among the countries with the largest amount of forest, equivalent to 5% of the world’s forest area in 2020 [1]. Although the forest area has been increasing in recent years [28], the forest cover has obviously changed in China over the past millennia [29,30,31,32]. To reconstruct the past cropland expansion and agriculture-driven deforestation based on settlements, previous researchers have extracted information about the settlements from the archaeological data [25,26] and the modern toponymic gazetteers and field work materials [27]. Moreover, given that the most serious agriculture-driven deforestation occurred in China during historical periods (for the past 2000 years) [30], historical sources recorded in the past 2000 years (mainly historical documents) are crucial for a better understanding of the detail of the historical LUCC under the socio-cultural effects. Extraction of information on historical settlements from historical sources would be crucial for a better mapping of the historical LUCC. Hence, we would try to use historical settlements from historical sources to carry out the agriculture-driven deforestation reconstruction based on settlements.
A large scale reduction in mountain forest areas occurred after the mid Qing Dynasty (since the 18th century) in the provinces with abundant forest resources (e.g., Hunan, Yunnan and Guizhou) [30,33,34,35], and there was a historic environmental turning point in China during the 18th century [36]. It is estimated that forest cover was reduced by nearly 20% in these provinces (e.g., Hunan, Yunnan and Guizhou) from 1700 to 1800 [15,37]. Meanwhile, the lake sediments display that the lowest values of tree pollen percentages occurred in the 17th and 18th centuries over the past 2000 years [38]. It changed because the croplands in the mountainous areas increased with changes in land use policy (e.g., the policy of administrative incorporation of native chiefdoms) after the mid-18th century; there were once few croplands in this area because land reclamations were restricted for political reasons before the 18th century [33,34,39]. Considering the complexity of the physical environment (e.g., landforms) and socio-cultural specificities (e.g., immigration), deforestation shows significant regional differences among mountainous areas. Hence, reconstructing the agriculture-driven deforestation during the 18th century would provide a case study of the impact of politics upon human-nature interactions in the long term.
Western Hunan is located in the transition zone between the Yunnan-Guizhou Plateau and the Southeast Hills, and the forest on its mountains is strongly influenced by human activities in this area because this area is close to the densely populated Middle-lower Yangtze Plain. Consequently, deforestation in western Hunan was more pronounced than in other areas during the 18th century [33,34]. The present work took three typical counties in western Hunan during the 18th century as the study area. First, the settlements’ expansion and densification were reconstructed. Second, the spatiotemporal patterns of agricultural land were reconstructed, by selecting the land suitable for farming around the settlements. Third, trends in agriculture-driven deforestation were reconstructed in a spatially explicit. This paper thus aims to understand the deforestation caused by humans on a larger spatiotemporal scale through a regional case study.

2. Materials and Methods
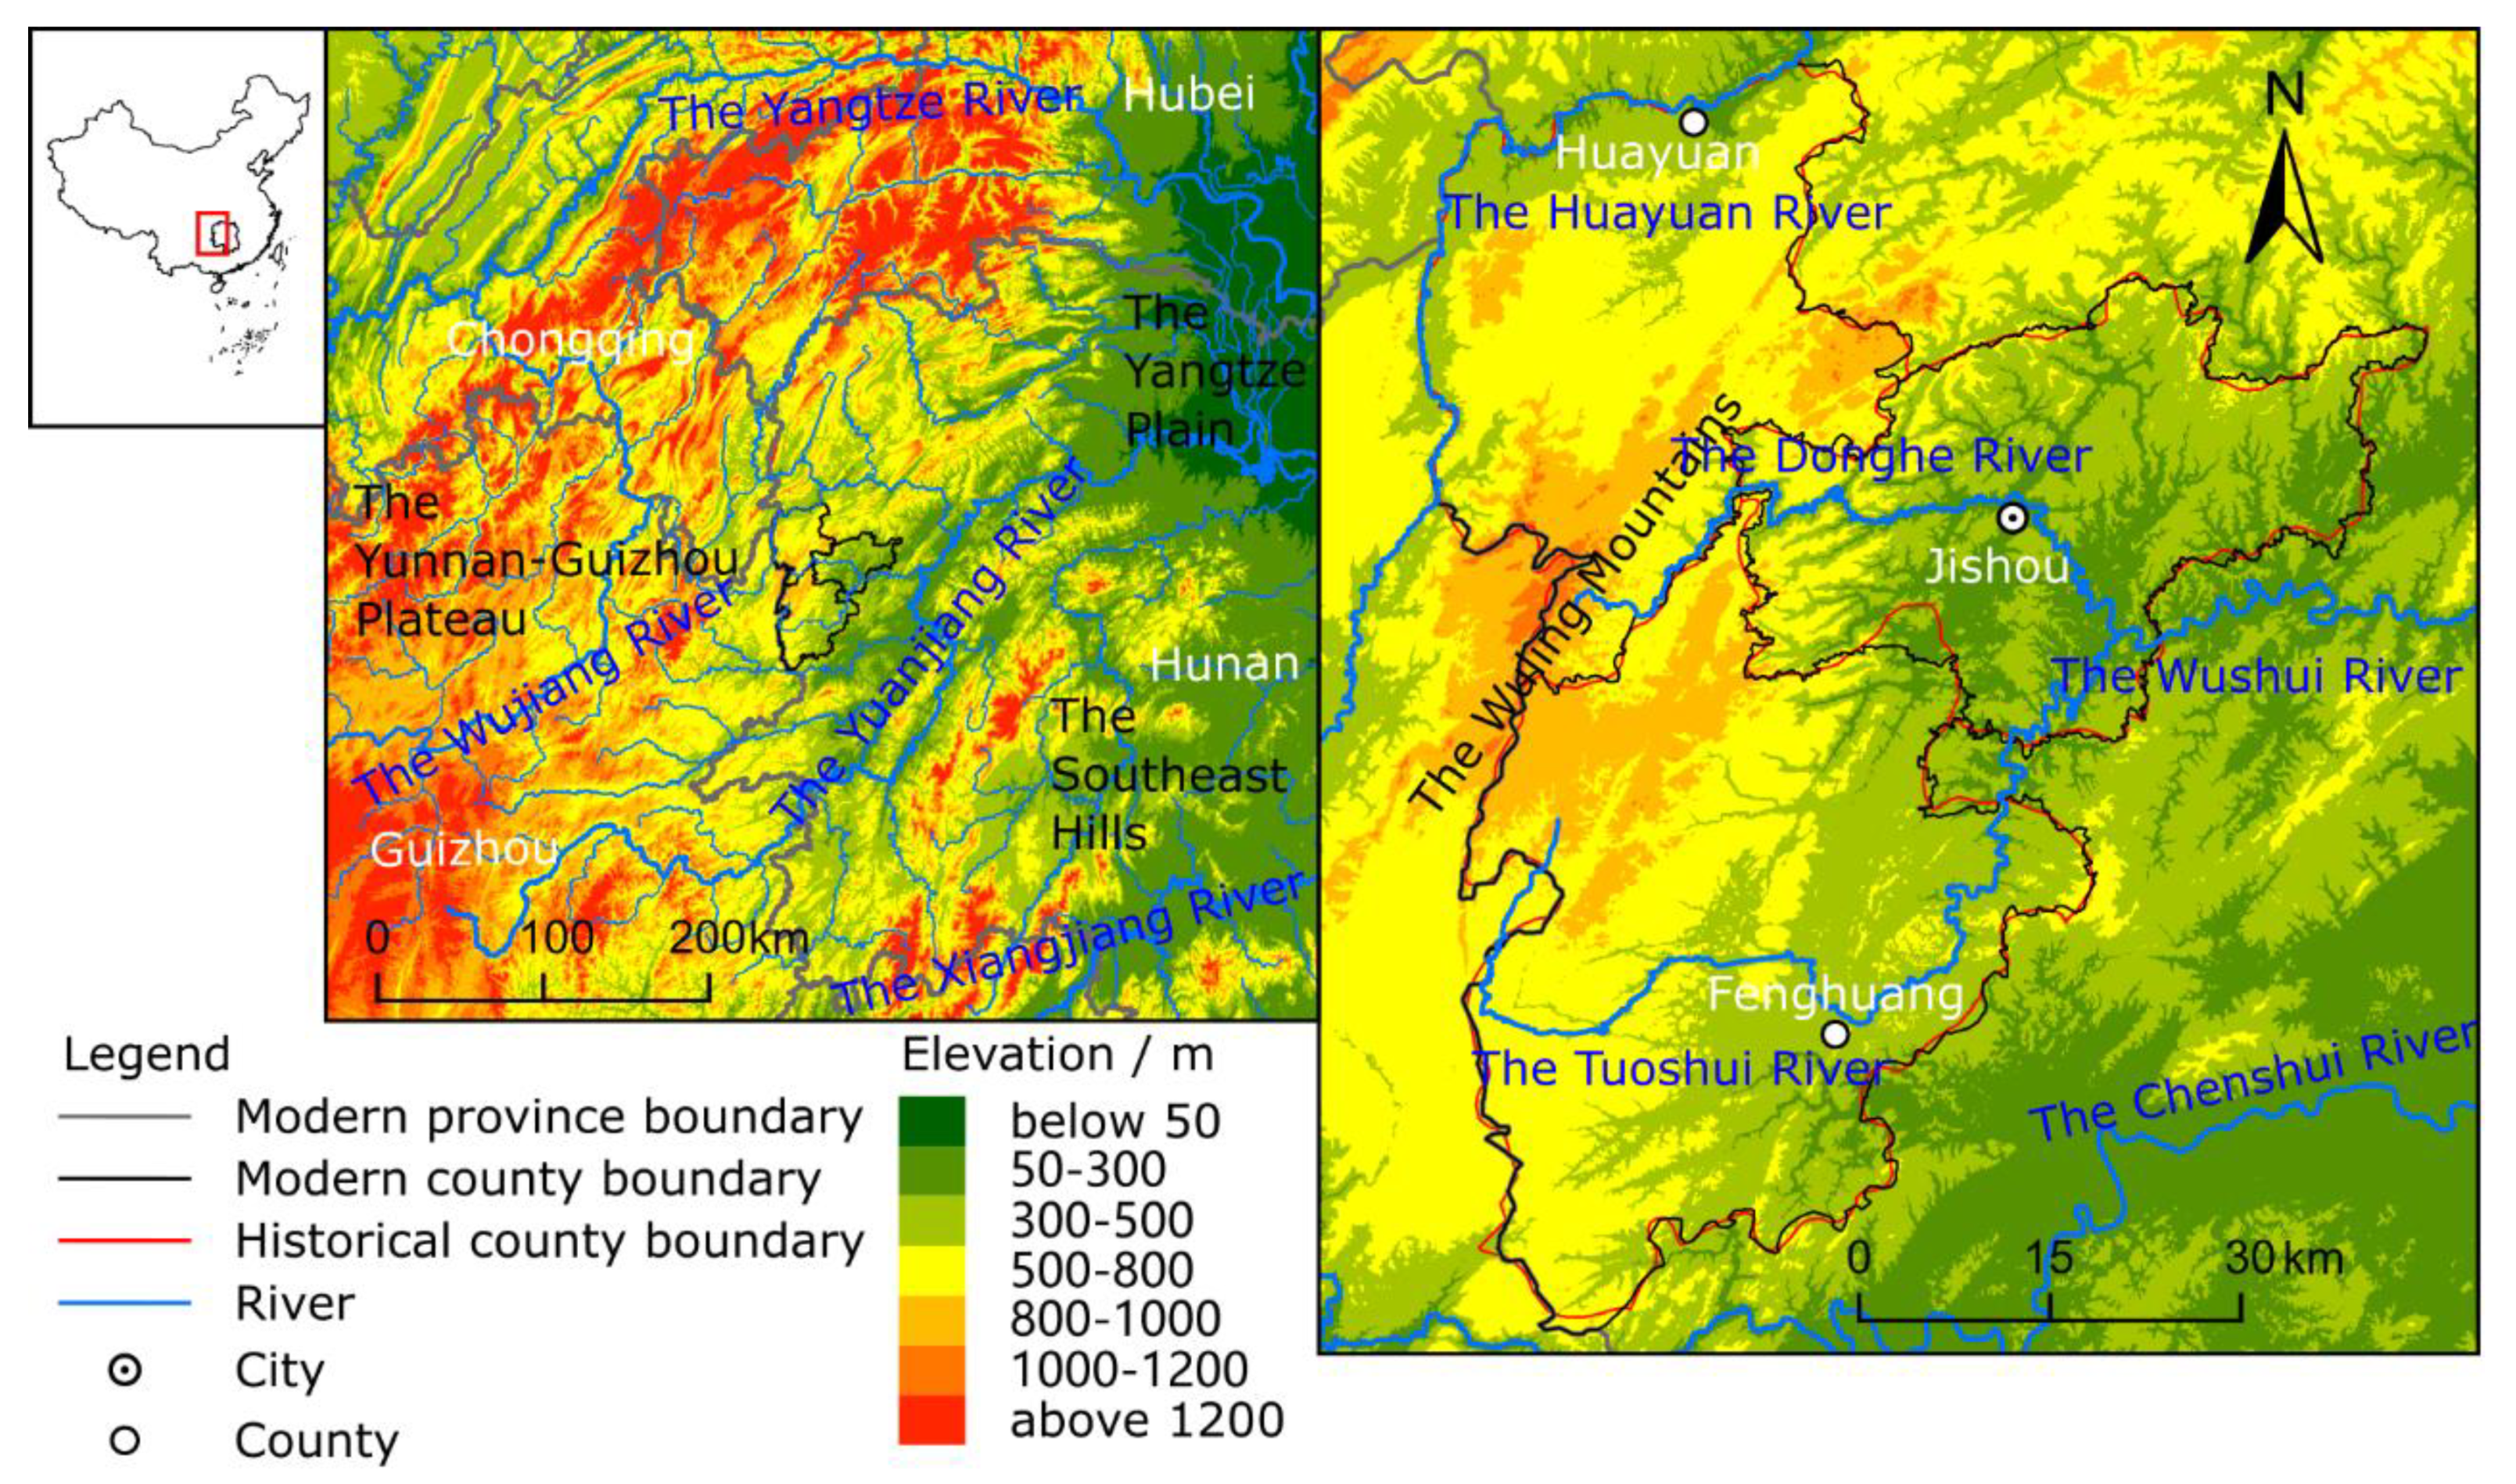
2.1. Study Area

The study area is located in western Hunan Province in southern China (27°40′–28°45′ N; 109°15′–110°4′ E), lying to the east of Guizhou Province and Chongqing Municipality (Figure 1), and covering 3925.47 km2. The study area includes the Jishou county-level City, Fenghuang County, and Huayuan County, which corresponds to Qianzhou Zhiliting, Fenghuang Zhiliting, and Yongsui Zhiliting during the Qing Dynasty (1644–1911). The central part of the study area is the Wuling Mountains, generally at a higher elevation, while the eastern and western parts are at lower elevation. There are multiple terraces in the region, which are below 300 m, from 300 m to 500 m, from 500 m to 800 m, and above 800 m [40]. The region has a humid subtropical climate with an overall suitable temperature (an annual average of 28 °C) and abundant precipitation (an annual amount of 1200–1600 mm), but the climate is significantly different along the vertical gradient (elevation). The rivers in this region (e.g., the Huayuan River, Tuojiang River, and Donghe River) belong to the Yuanjiang River Basin in the Dongting Lake watershed of the Yangtze River Basin. The forest coverage exceeds the grassland area in this region. According to satellite imagery, the percentage of regional cropland, forestland, and grassland respectively totaled 37.46%, 57.52%, and 3.26% in 2000 [41].

2.2. Data Sources

Multiple sources were used to reconstruct the agriculture-driven deforestation in western Hunan during the 18th century. These include historical documents, modern survey and collated materials, and DEM (Digital Elevation Model) data (Table 1).
The historical documents contain valuable information about historical, geographical, and economic aspects of the 18th century in this region, especially the information on its regional agriculture. The first is the local gazetteers of the Qing Dynasty in the study area. Due to the similarity of the natural environment and social culture, the local gazetteers of the Qing Dynasty in the neighboring area were used here as extended materials to resolve the problem of few local gazetteers in the Qing Dynasty in the region. The second is other historical documents related to the study area, including the books of Miaofang Beilan and Chunan Miaozhi. The historical documents were obtained from the Digital Fangzhi Database of the National Digital Library of China (http://read.nlc.cn/thematDataSearch/toGujiIndex, accessed on 15 March 2021).
The modern survey and collation materials included three types of information obtained from libraries and the Hunan Provincial Digital Fangzhi Library (http://dfz.hunan.gov.cn/, accessed on 20 May 2021). First, the modern local gazetteers provided information on the natural environment and socio-cultural characteristics related to the regional agriculture, including the local gazetteers of the Xiangxi Autonomous Prefecture, Jishou City, Fenghuang County, and Huayuan County. These modern local gazetteers entail results of multiple social surveys done during the 20th century. Second, the materials of the agricultural regionalization provided valuable regional agricultural information, especially on plantations and forestry, consisting of a series of survey materials compiled in the 1980s after a systematic investigation by agricultural management departments, including the reports of the agricultural regionalization of Xiangxi Autonomous Prefecture, Jishou City, Fenghuang County, and Huayuan County. Third, the modern toponymic gazetteers recorded socio-cultural characteristics of modern settlements and briefly described the toponym evolution of part settlements. These toponymic gazetteers, including those of Jishou City, Fenghuang County, and Huayuan County, were prepared in the 1980s.
The DEM data was obtained from SRTM (Shuttle Radar Topography Mission) (http://srtm.csi.cgiar.org/, accessed on 15 December 2020), with a spatial resolution of 90 m × 90 m. Then, the data were resampled to 30 m × 30 m by using the nearest neighbor method in ArcGIS. The DEM data provided the information on the elevation, slope, and slope aspect in the study area.

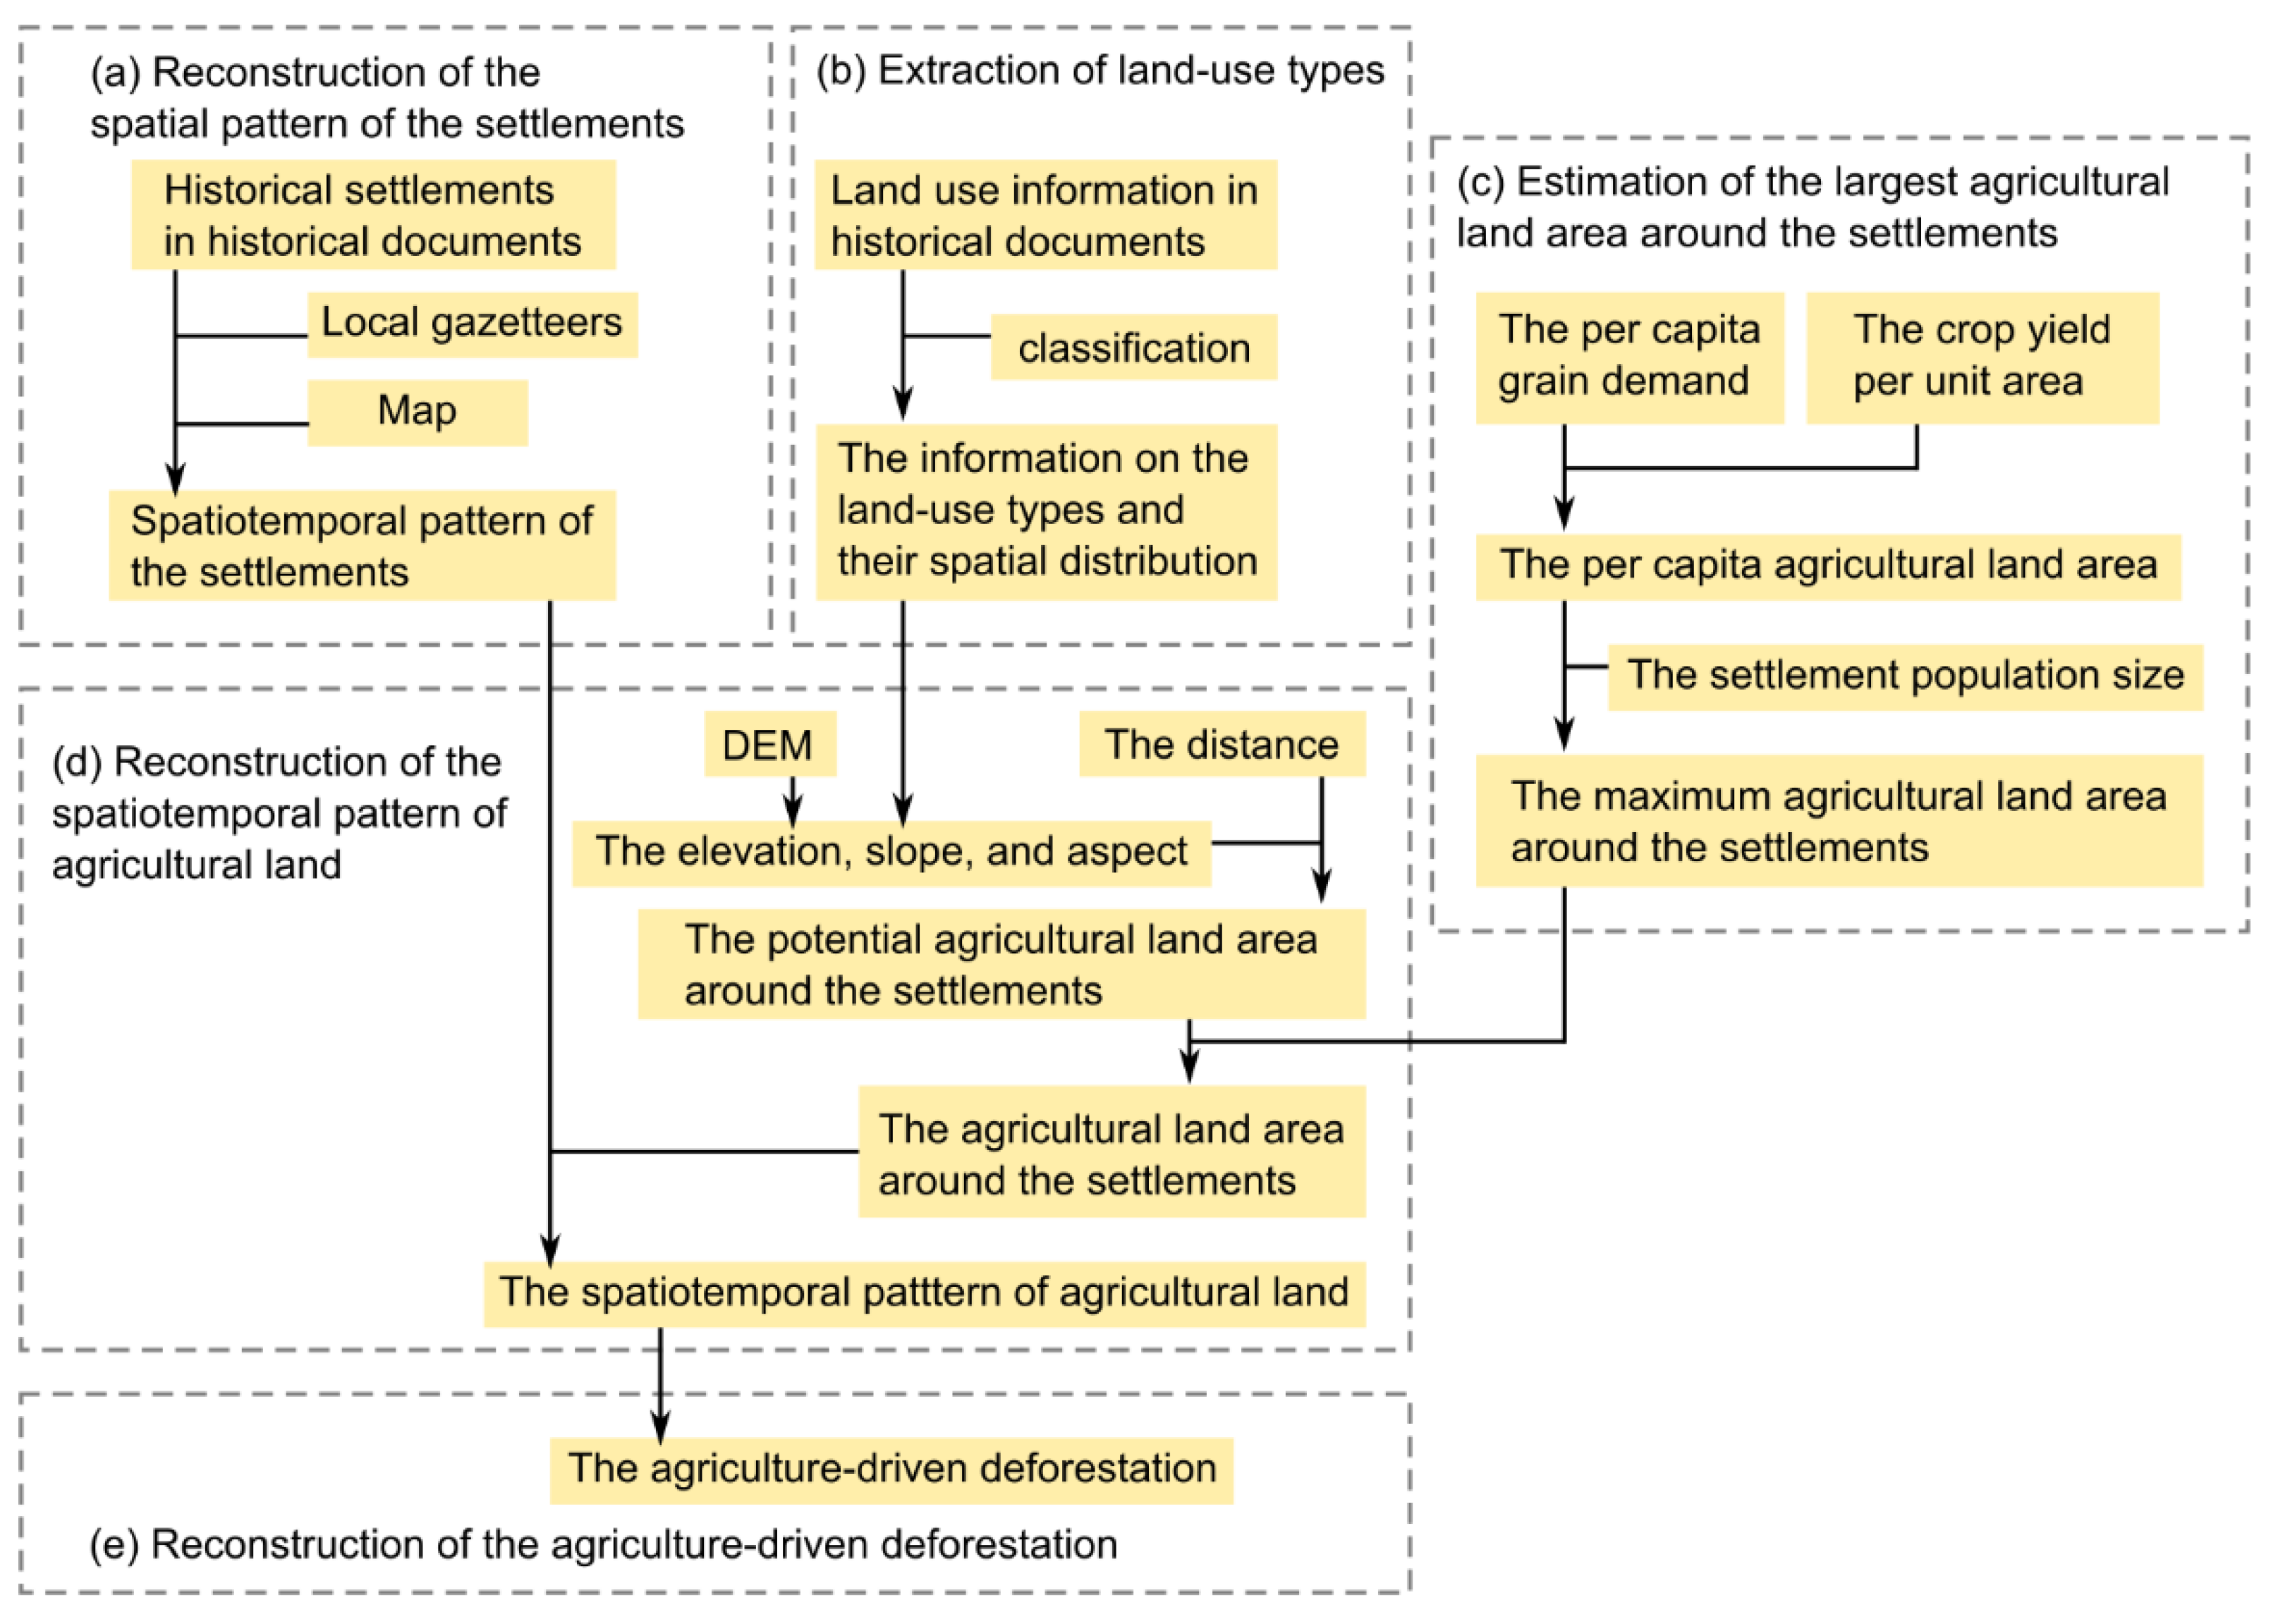
2.3. Reconstruction of the Deforestation in Western Hunan during the 18th Century

To reconstruct the agriculture-driven deforestation in western Hunan during the 18th century, five steps were followed (Figure 2). First, the spatial distributions of the settlements were reconstructed according to a combination of multiple sources (including historical documents, modern local gazetteers and modern toponymic gazetteers). Second, information on land use types was extracted from historical documents. Third, the largest agricultural land area around the settlement was estimated. Fourth, the spatiotemporal pattern of agricultural land was reconstructed by selecting the land suitable for farming around settlements. Fifth, the reconstruction of deforestation was based on agricultural land expansion at a spatial resolution of 30 m × 30 m.

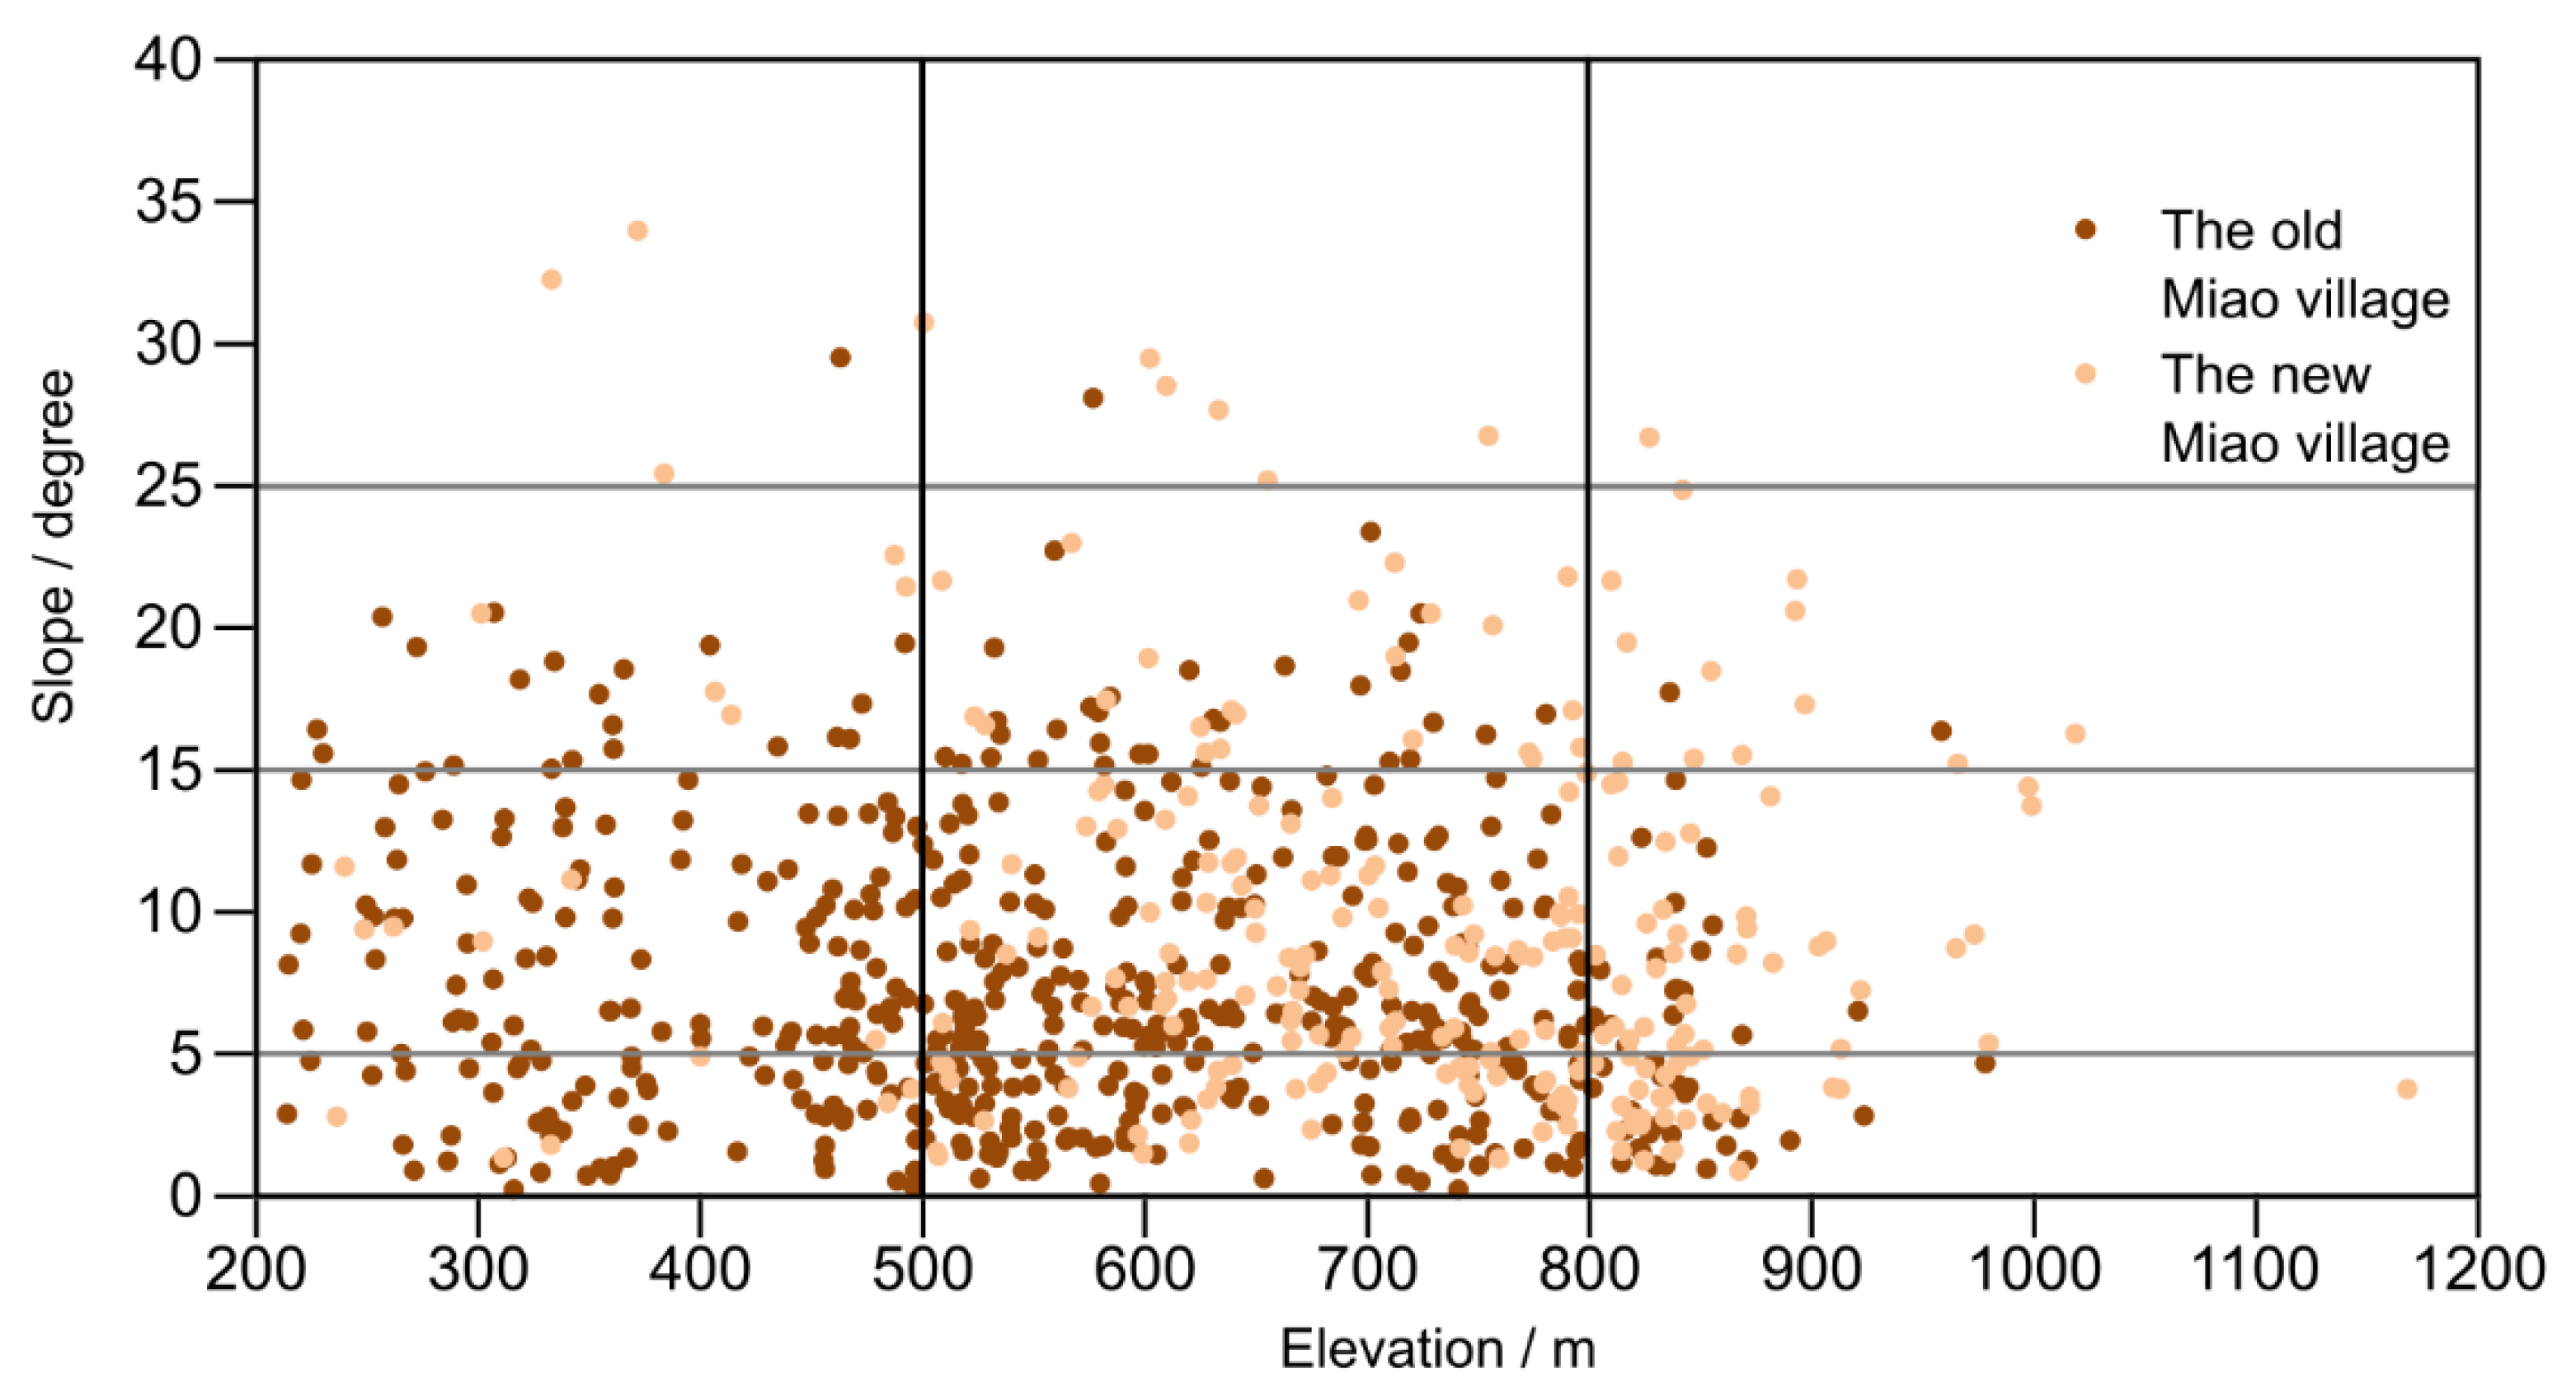
2.3.1. Reconstruction of the Spatial Pattern of the Settlement

Using multiple materials, the settlements were extracted and analyzed with regard to their spatial patterns in western Hunan during the 18th century (Figure 2a). First, the historical settlements and their names were extracted from historical documents and historical maps (Figure A1a). These historical settlements were determined in relation to modern settlements based on the evolution of place names using modern gazetteers. The spatial locations of these historical settlements were determined using maps or local gazetteers in ArcGIS 10.2 (Figure A1b). Second, the elevations and slopes of these settlements were obtained from DEM. Third, the spatiotemporal patterns of these settlements were analyzed on the basis of the time of settlement formation in the early and the late 18th century.

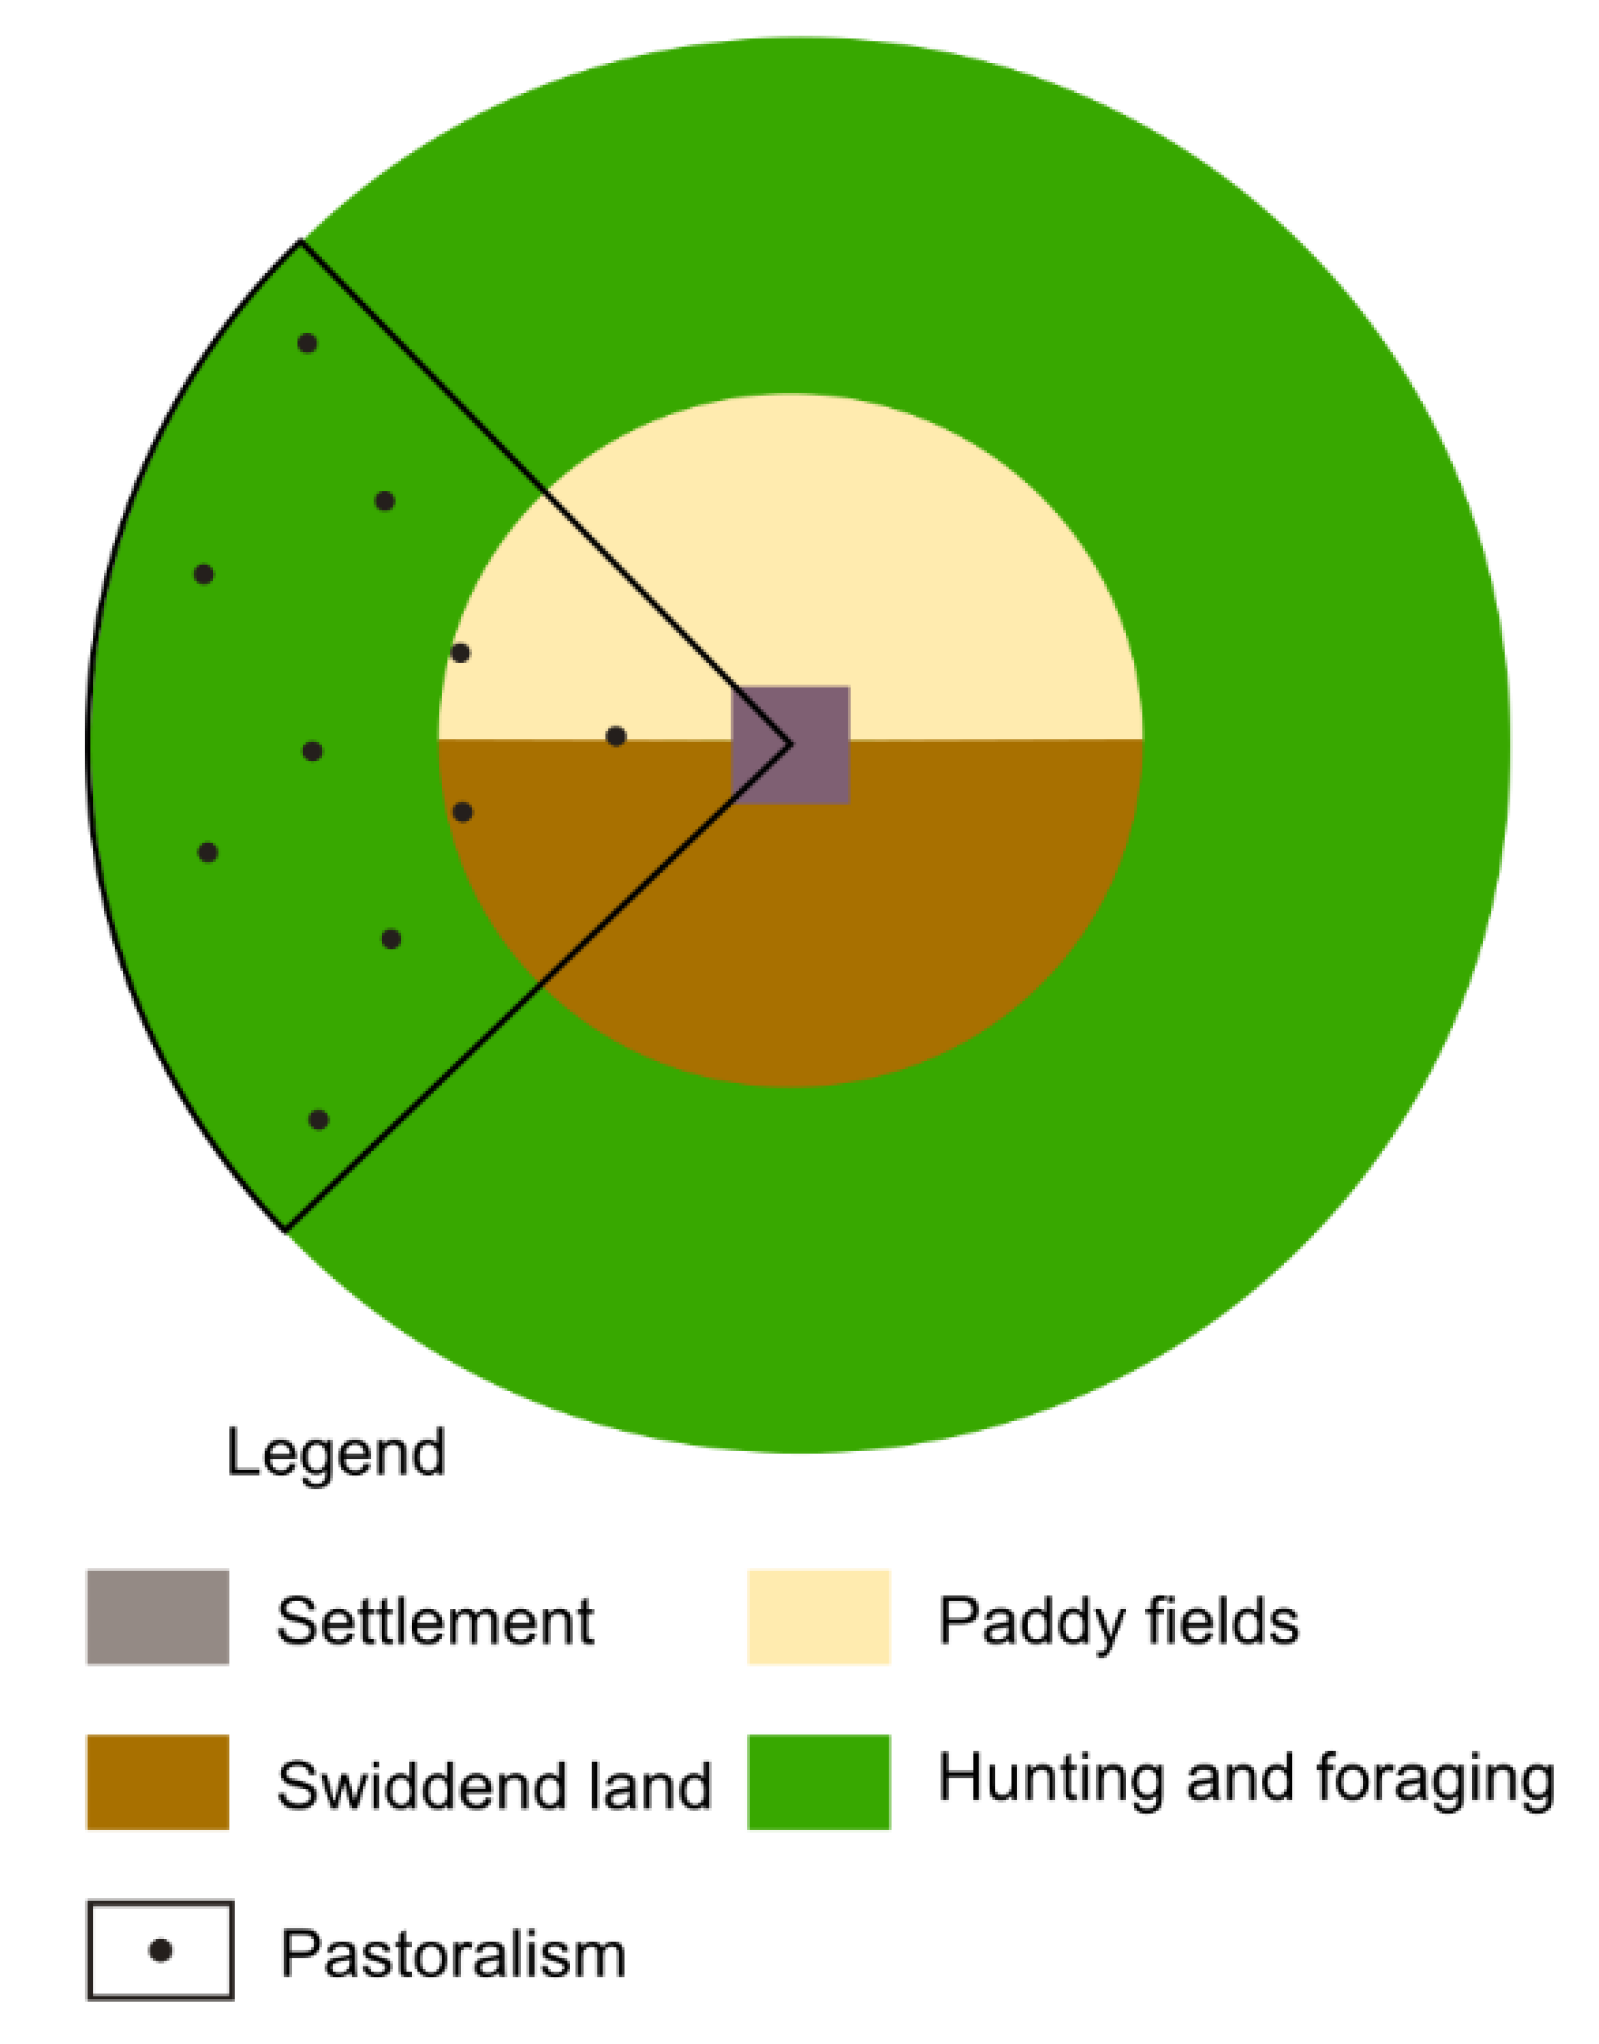
2.3.2. Extraction of Land-Use Types

For the classification of land use types in this area during the 18th century, a classification developed by the LandCover6k group of the PAGES program was used as a reference, because it is specifically oriented towards investigations of historical LUCC [20,42] (Figure 2b). In this classification, the first level of land use is divided into six types: extensive/minimal land use, agriculture, no evidence for land use, hunting-foraging-fishing, pastoralism, and urban/extractive industries. Given that the land use types related to human activities are more easily recorded by historical documents, the land use types in the study area are urban industries, agriculture, hunting-foraging-fishing, and pastoralism (Table 2). That of agriculture includes rice paddies, swidden/shifting cultivation, and agroforestry/arboriculture. However, this study did not include the urban, because it mainly consists of the towns of Qianzhou, Fenghuang, and Yongsui, all of which have definite spatial locations.
According to existing studies, the settlement is the core, and other land use types expand outward in a region [43,44]. This distribution of land use types was similarly prevalent in western Hunan during the 18th century, and this information on land-use types and their spatial distribution can be extracted from historical documents (Table 2).
The distribution of agricultural land (mainly plantations) was more frequently recorded in historical documents relative to other land use types. According to those records, agricultural land and settlements were distributed adjacent to each other, and agricultural land was distributed on the slope facing south in the mountainous areas. There were differences in distribution among the types of agricultural land (Table 2). Paddy fields were distributed on flat land in the mountainous areas, and swidden land, land under slash and burn agriculture, was distributed on hillsides with a less steep slope. The agroforestry was distributed on hillsides with a steeper slope. However, given the difficulty of distinguishing the boundary between agroforestry and virgin forest using historical documents, agroforestry’s coverage and changes were not reconstructed.
Hunting, foraging, and pastoralism were all distributed on hillsides with steeper slopes (Table 2). Hunting and foraging as land use types had little influence upon original land cover types, because they could not change forestland or grassland to cropland. Pastoralism also did not change the original land cover types, thus leaving the land covered by crops, grasses, and forests. This is because grassland and forestland were used by local people to graze their livestock all year and cropland was used to graze during slack season. Therefore, although the land was used for hunting, foraging, and pastoralism, land cover remained predominantly forestland or grassland in this area.
The distribution pattern of land use types in western Hunan during the 18th century was extracted (Figure 3). Evidently, this distribution pattern was centered on settlements, with agriculture (paddy fields and swidden land) in descending order, with forests for hunting and foraging on the periphery, in which pastoralism overlapped.

2.3.3. Estimation of the Maximum Agricultural Land Area around the Settlements

The maximum agricultural land area around the settlement was estimated as a limit to avoid exceeding the maximum population size of a settlement (Figure 2c). This was done because it is difficult to precisely reconstruct the agricultural land area using historical documents in the study area during the 18th century. Therefore, the maximum agricultural land area around the settlement was estimated by combining the settlement population size and the per capita agricultural land area, and the latter was estimated by using the crop yield per unit area and per capita grain demand.
First, the crop yield per unit area was estimated. Given the possible uncertainty in crop yield per unit area recorded in historical documents in the 18th century, it is necessary to refer to relevant information from other periods. According to the mid-20th century survey, rice yield was approximately 140 kg per mu (the mu is a Chinese unit of area, equal to 1/15 of a hectare), and the yields of corn (a crop introduced from America and expanded in the early-middle 18th century in this area) and traditional crops (e.g., wheat, barley, buckwheat, and sorghum) were equivalent to 30% and 20% of rice yield, respectively. The yields of rice and corn in the 19th century amounted to 75% and 50% of those in the early 20th century, respectively, according to historical documents [45]. Based on these changes, crop yield per unit area in the 18th century was approximately 60% of that in the mid-20th century. The yields of rice, corn, and traditional crops were approximately 84 kg per mu, 25.2 kg per mu, and 16.9 kg per mu, respectively.
Second, the per capita agricultural land area was estimated. The survey revealed that the annual per capita grain demand was approximately 182.5 kg in the study area and neighboring areas in the mid-20th century. There were differences in per capita agricultural land area among crops. In the 18th century, the agricultural land area per capita with the rice, corn, and traditional crops as stable foods was 2.2 mu (0.15 ha), 7.2 mu (0.48 ha), and 10.8 mu (0.72 ha), respectively. Notably, a rotational cycle was in use to avoid a decrease in soil fertility after years of continuous shifting cultivation [45]. According to the survey, the total swidden land was approximately 5–10 times the actual cultivation of swidden land in the Yunnan-Guizhou Plateau in the mid-20th century [46].
Third, the maximum agricultural land area around the settlements was estimated. By analyzing the statistical values recorded in historical documents, the median settlement population size was 30 people, and more than 93% of the settlements were home to no more than 60 people in the study area during the 18th century (Figure A2) [47]. Considering the regional natural environment and socio-culture, fewer settlements had both a large population size and were dominated by shifting cultivation during the 18th century. The paddy fields and swidden land areas around the settlements in the study area during the 18th century should not have exceeded 8.8 ha and 200 ha in size, respectively. The area was the maximum agricultural land area around the settlements.

2.3.4. Reconstruction of the Spatiotemporal Pattern of Agricultural Land

Reconstruction of the spatiotemporal pattern of agricultural land was the basis for the reconstruction of deforestation (Figure 2d). The distribution of the land use types was centered on a settlement in the region during the 18th century (Figure 3). Because the people trended to farm near the settlement, the land surrounding the settlement that could be cultivated was more likely to be used for agricultural activity [45]. The reconstructed agricultural land was equivalent to the potential agricultural land around the settlement that was extracted according to the relationship between agriculture and natural factors, such as elevation, slope, and aspect. Moreover, the maximum agricultural land area around the settlements was used as an upper bound.
First, the distance of agricultural land (mainly plantation) relative to settlements was analyzed. This distance indicated the range from their house to agricultural land suitable for farmers at that time. The relative distance between different settlements (mainly Miao villages, also known as Hmong villages) was recorded with simple statistics in historical documents, namely the distance of a Miao village relative to other Miao villages in the vicinity. From the analysis of these statistical values, the relative distance between two Miao villages was generally within 5 li (the li is a Chinese unit of distance equal to 0.5 km) (2.5 km), with more than half within 3 li (1.5 km) (Figure A3). The maximum activity ranges of people living in the Miao village might be within 1.3 km (about half the maximum relative distance) from the settlement, and the average activity range might be within 0.8 km (about half the average relative distance). This could mean that the average distance of agricultural land relative to the settlement was 0.8 km, and the maximum distance was 1.3 km. These values were slightly larger than the modern farming radii.
Second, the slope of agricultural land was analyzed. Generally, the farmers tended to cultivate on land that was both closer to their settlement and rich in agricultural resources. Farmers cultivated on the land near the settlement in the area with a gentle slope, while they had to go further to cultivate when the land near the settlement was less suitable for farming in areas with a steep slope [39,47]. Agricultural land was distributed within 0.8 km around the settlements on the assumption that these settlements had a slope of less than 15°, while the agricultural land was distributed within 1.3 km around the settlements on the assumption that these settlements had a slope of above 15°. These values were used to carry out the buffer zone analysis of the cultivation range.
The slopes of the paddy fields and swidden land areas differed. The paddy fields were usually distributed on flat land, such as that in a valley (Table 2.), thus it is assumed that paddy fields were distributed on land with a slope of less than 5°. Swidden land was distributed on hillsides with fewer steep slopes, and the determination of its distribution was based on the paddy fields (Table 2). Referring to the local experiences of soil and water conservation, the distribution of agricultural land should have been limited to slopes of 25°. It was assumed that swidden land was distributed on land areas with slopes ranging between 5° and 25°.
Third, the slope aspect of agricultural land was analyzed. According to historical documents, agricultural land was distributed on a southward-facing slope in the mountainous areas (Table 2). The aspect affects the natural conditions needed for crop growth, such as sunshine duration, so farmers give priority to aspects favorable for crop growth [45,46]. Thus, the optimal choice is a southern slope, followed by southeastern and southwestern slopes, eastern, western, northeastern and northwestern slopes, and finally a northern slope, used only if necessary.
Fourth, the potential agricultural land area around the settlement was selected according to the positive relationship between agriculture and natural factors. Those grids (square of 30 m × 30 m) suitable for rice cultivation and swidden cultivation around the settlement were selected by using the prerequisite distance, slope, and aspect as conditions. The respective grids for potential paddy fields and swidden land around the settlement were calculated using the following two formulas:
Cr = Dir × Eir × Sir × Air
Cs = Dis × Eis × Sis × Ais
where Cr and Cs are the grids of potential paddy fields and potential swidden land around the settlement, respectively; Dir and Dis are the ranges of paddy fields and swidden land around the settlement, respectively; Eir, Sir and Air are the elevation, slope and aspect suitable for paddy fields around the settlement, respectively; Eis, Sis and Ais are the elevation, slope and aspect suitable for swidden land around the settlement, respectively.
Fifth, the spatial distribution of agricultural land was reconstructed. The agricultural land area was integrated by screening the grids suitable for cultivation around the settlement and using the maximum agricultural land as an upper bound. By integrating the grids of agricultural land over the same period, the spatial distribution of regional agricultural land was obtained, from which the agricultural land area in the region was derived. Furthermore, by comparing the spatial distribution of agricultural land in the two periods, the spatiotemporal pattern of agricultural land during the 18th century was elucidated.
Cir = { Cr ,   Cr   <   Crmax Crmax ,   Cr   Crmax
Cis = { Cs ,   Cs   <   Crmax Csmax ,   Cs   Csmax
Ci = Cir + Cis
Ca = i = i i Ci
where Ci, Cir, and Cis are the area of agricultural land, paddy fields, and swidden land around the settlement, respectively. Crmax and Csmax are the maximum area of paddy fields and swidden land around the settlement, respectively. Ca is the agricultural land area.

2.3.5. Reconstruction of the Agriculture-Driven Deforestation

Based on the reconstruction of agricultural land, trends of the agriculture-driven deforestation were reconstructed (Figure 2e). The available evidence indicates that, except for agricultural land parcels, the land in the study area during the 18th century was originally forest. On the one hand, the pollen evidence suggests that forests used to be the main landscape of the mountainous areas in the absence of anthropogenic disturbance in the south of China [31,48]. On the other hand, using historical documents, researchers have also argued that the formation of grassland and cropland arose following long-term deforestation on the mountainous areas during historical times [49]. Accordingly, the forest area was calculated follows:
Fa = Ra − Ca
where Ra is the land area and Fa is the forest area.

3. Results

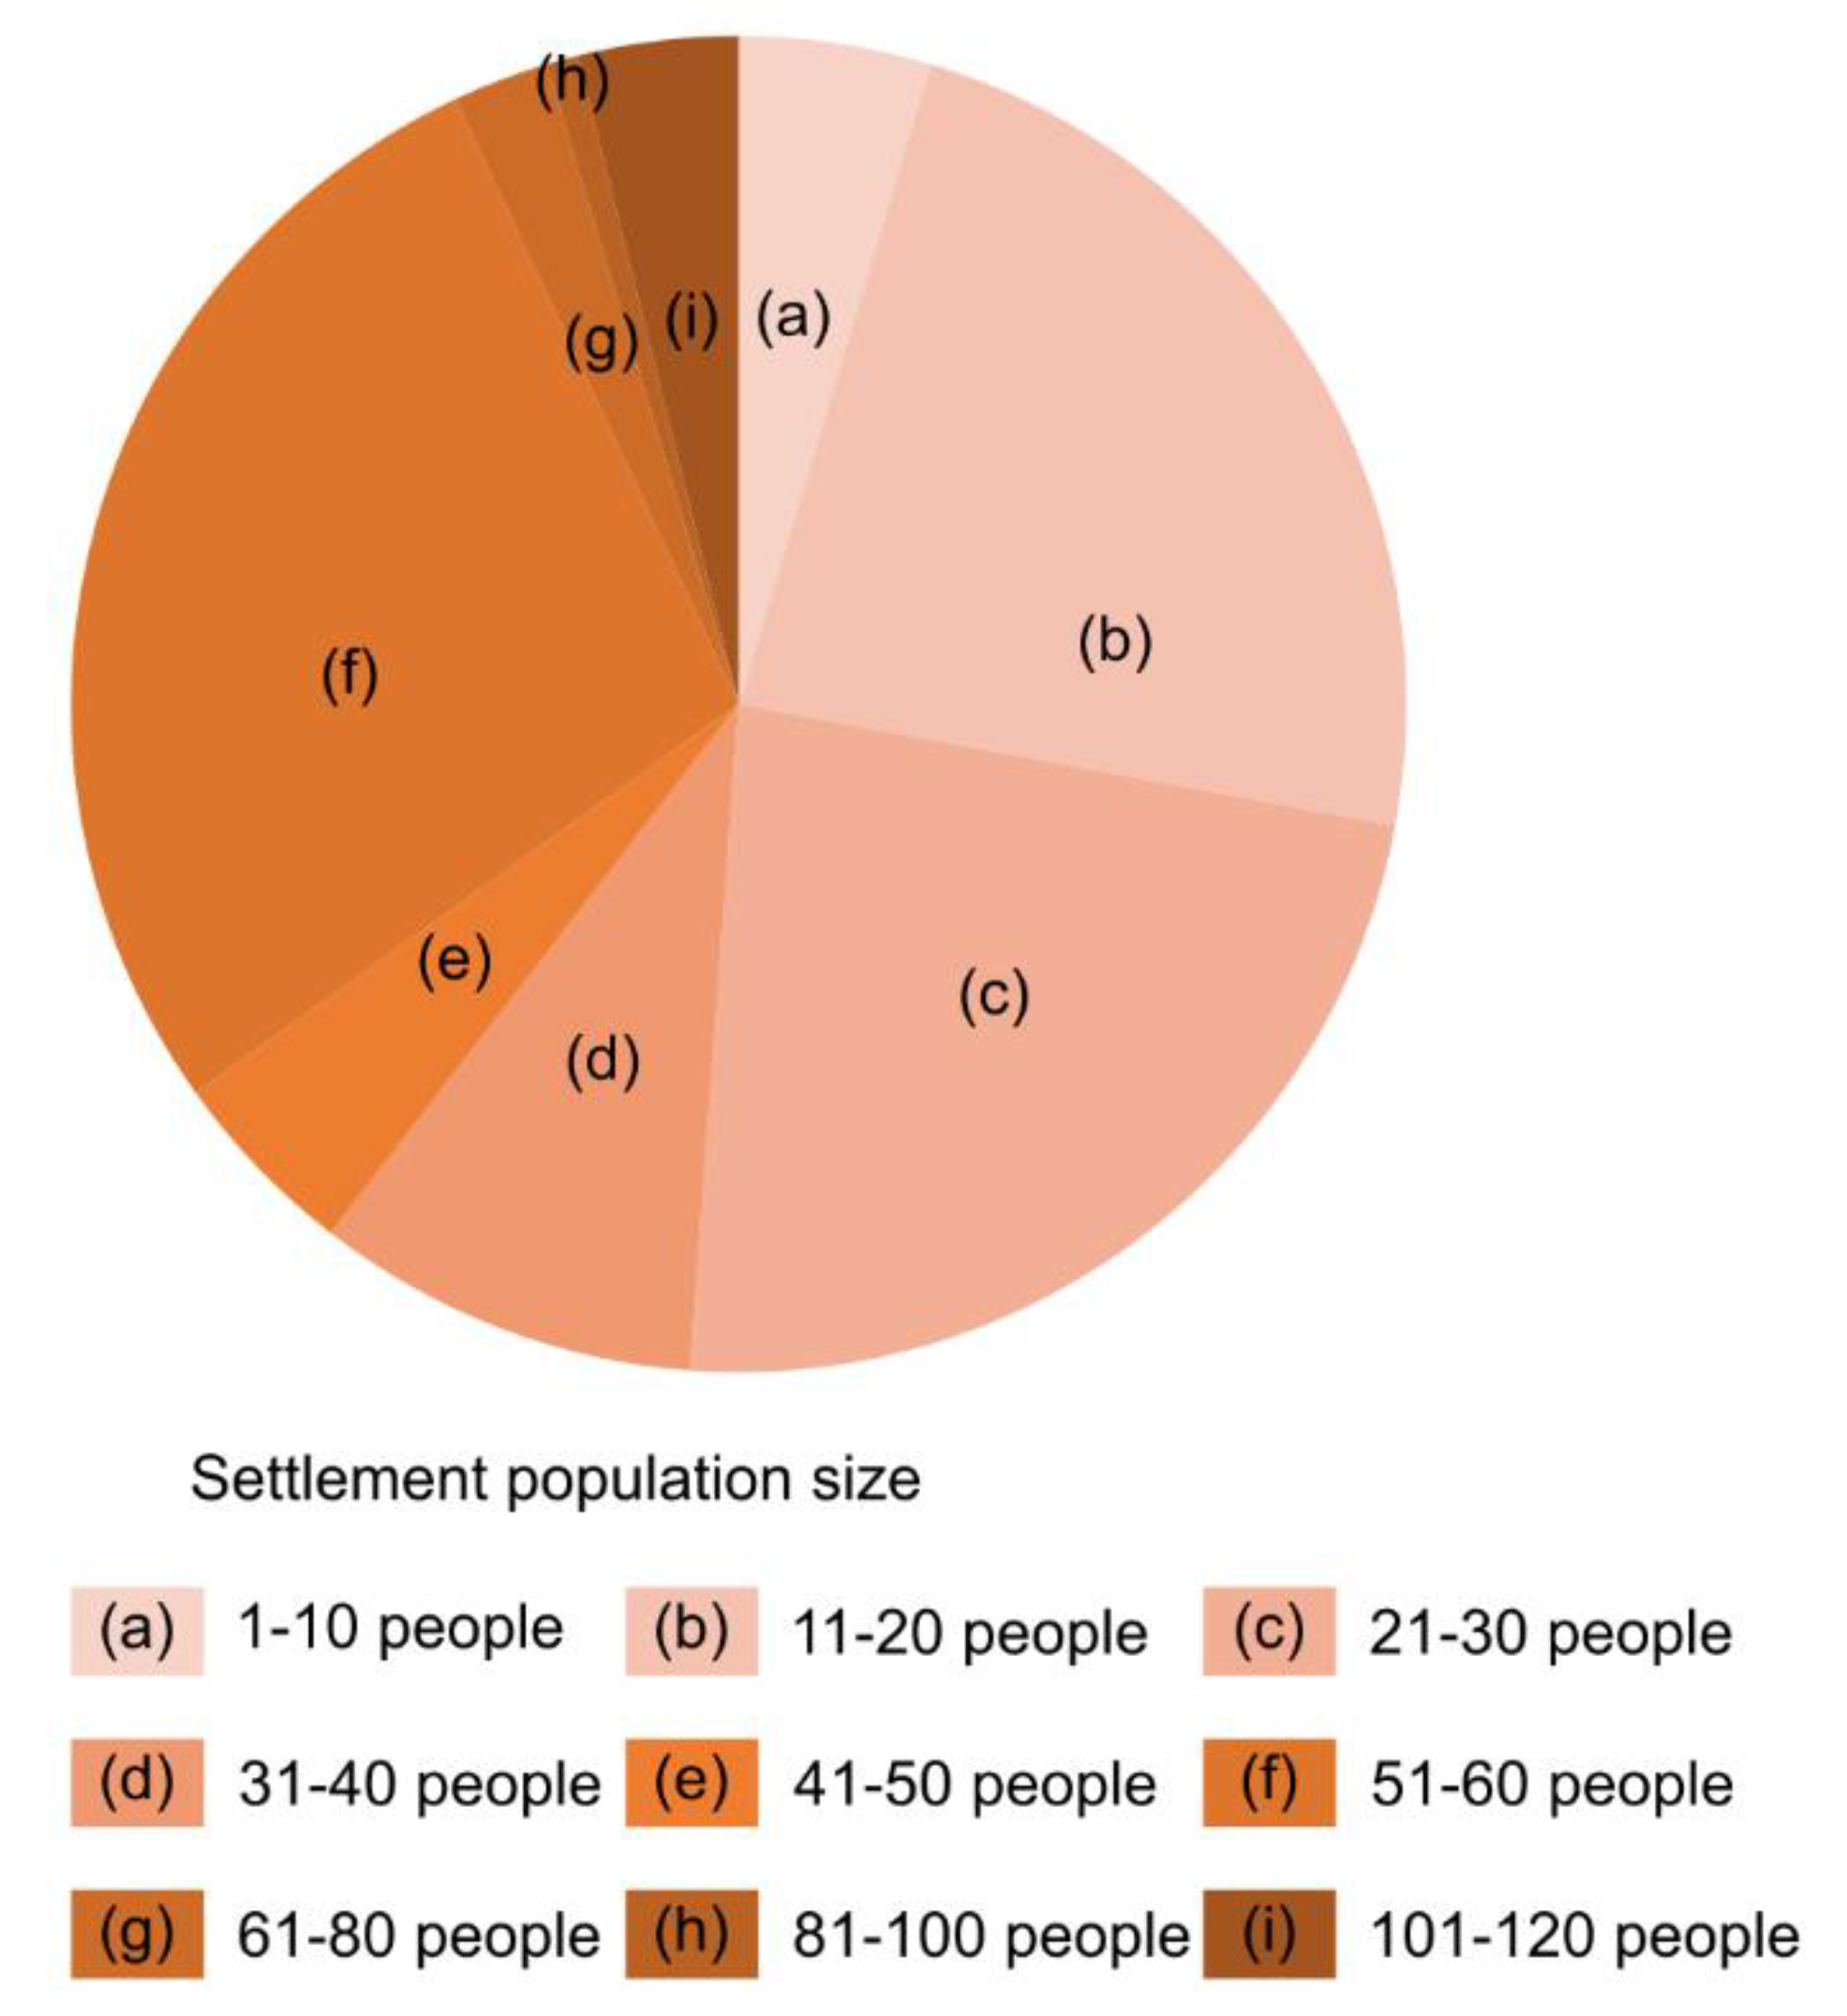
3.1. Changes in the Distribution Pattern of Settlements

There were different types of settlements in western Hunan during the 18th century. These settlements could be reliably divided into Han villages and Miao villages based on the inhabiting ethnic groups, and Miao villages could be further grouped into old or new Miao villages based on their formation time. These settlements also featured distinct spatial patterns. The Han villages were mainly located in the eastern part of the study area at relatively low elevation, while the Miao villages were mainly located in the central and western parts at relatively high elevation. Compared with the old Miao villages, the new Miao villages were more concentrated and distributed on the sloping fields distinguished by higher elevations and steeper slopes. This finding indicates that those new settlements showed characteristics consistent with human expansion into areas of higher elevations and steeper slopes.
The differences between the old and new Miao villages in Fenghuang and Huayuan, counties having a relatively high elevation and large vertical differential, were starker (Figure 4). First, there were differences in the elevation of the settlements. The old Miao villages were numerically dominant below 500 m (the first terrace). The number of old and new Miao villages was similar from 500 to 800 m (the second terrace). The new Miao villages were clearly more abundant above 800 m (the third terrace). Second, settlements differed in their slope position. The number of old and new Miao villages was similar on sloping fields with 0–5° slopes and likewise on slopes of 5–15° (i.e., the flat-sloping fields and small-sloping fields, respectively, in the local language). The number of new Miao villages increased on sloping fields with steeper slopes of 15–25° and above 25° (i.e., the middle-sloping fields and great-sloping fields, respectively, in the local language).

3.2. Agricultural Land Area and Forest Area Change

The changes in land use area were obvious in western Hunan during the 18th century. The regional agricultural land area increased from 869.0 km2 in the early 18th century to 1220.1 km2 in the late 18th century, an increase of 40.4%. Paddy fields accounted for 12.6% and 29.3% of the agricultural land area in the two periods, respectively. The area of paddy fields increased, in part via the reclamation of forestland, and in part through the conversion of swidden land into paddy fields along with the expansion of water facilities. The swidden land occupied a higher proportion (87.4% and 70.7%) of the agricultural land area. Because the main form of farming in this region was shifting cultivation (also known as slash-and-burn cultivation), the actual cultivated land every year was 10% to 20% of the total swidden land area [46]. The agricultural land area under cultivation accounted for 11.5% of the regional area in the late 18th century.
Along with the increased agricultural land area, the regional forest area decreased from 3082.7 km2 to 2731.5 km2, and the percentage of forest area decreased from 78.0% to 69.1%. Specifically, 31.3% and 68.7% of this lost forest area was transformed into paddy fields and swidden land, respectively. It should be noted that secondary vegetation grew on a part portion of swidden land not under cultivation, namely, the fallow land, because of the existence of a rotational cycle of shifting cultivation. Thus, the total area of land without crop cover (including primary and secondary vegetation) made up 95.3% and 88.5% of the regional area in the early and the late 18th century, respectively.

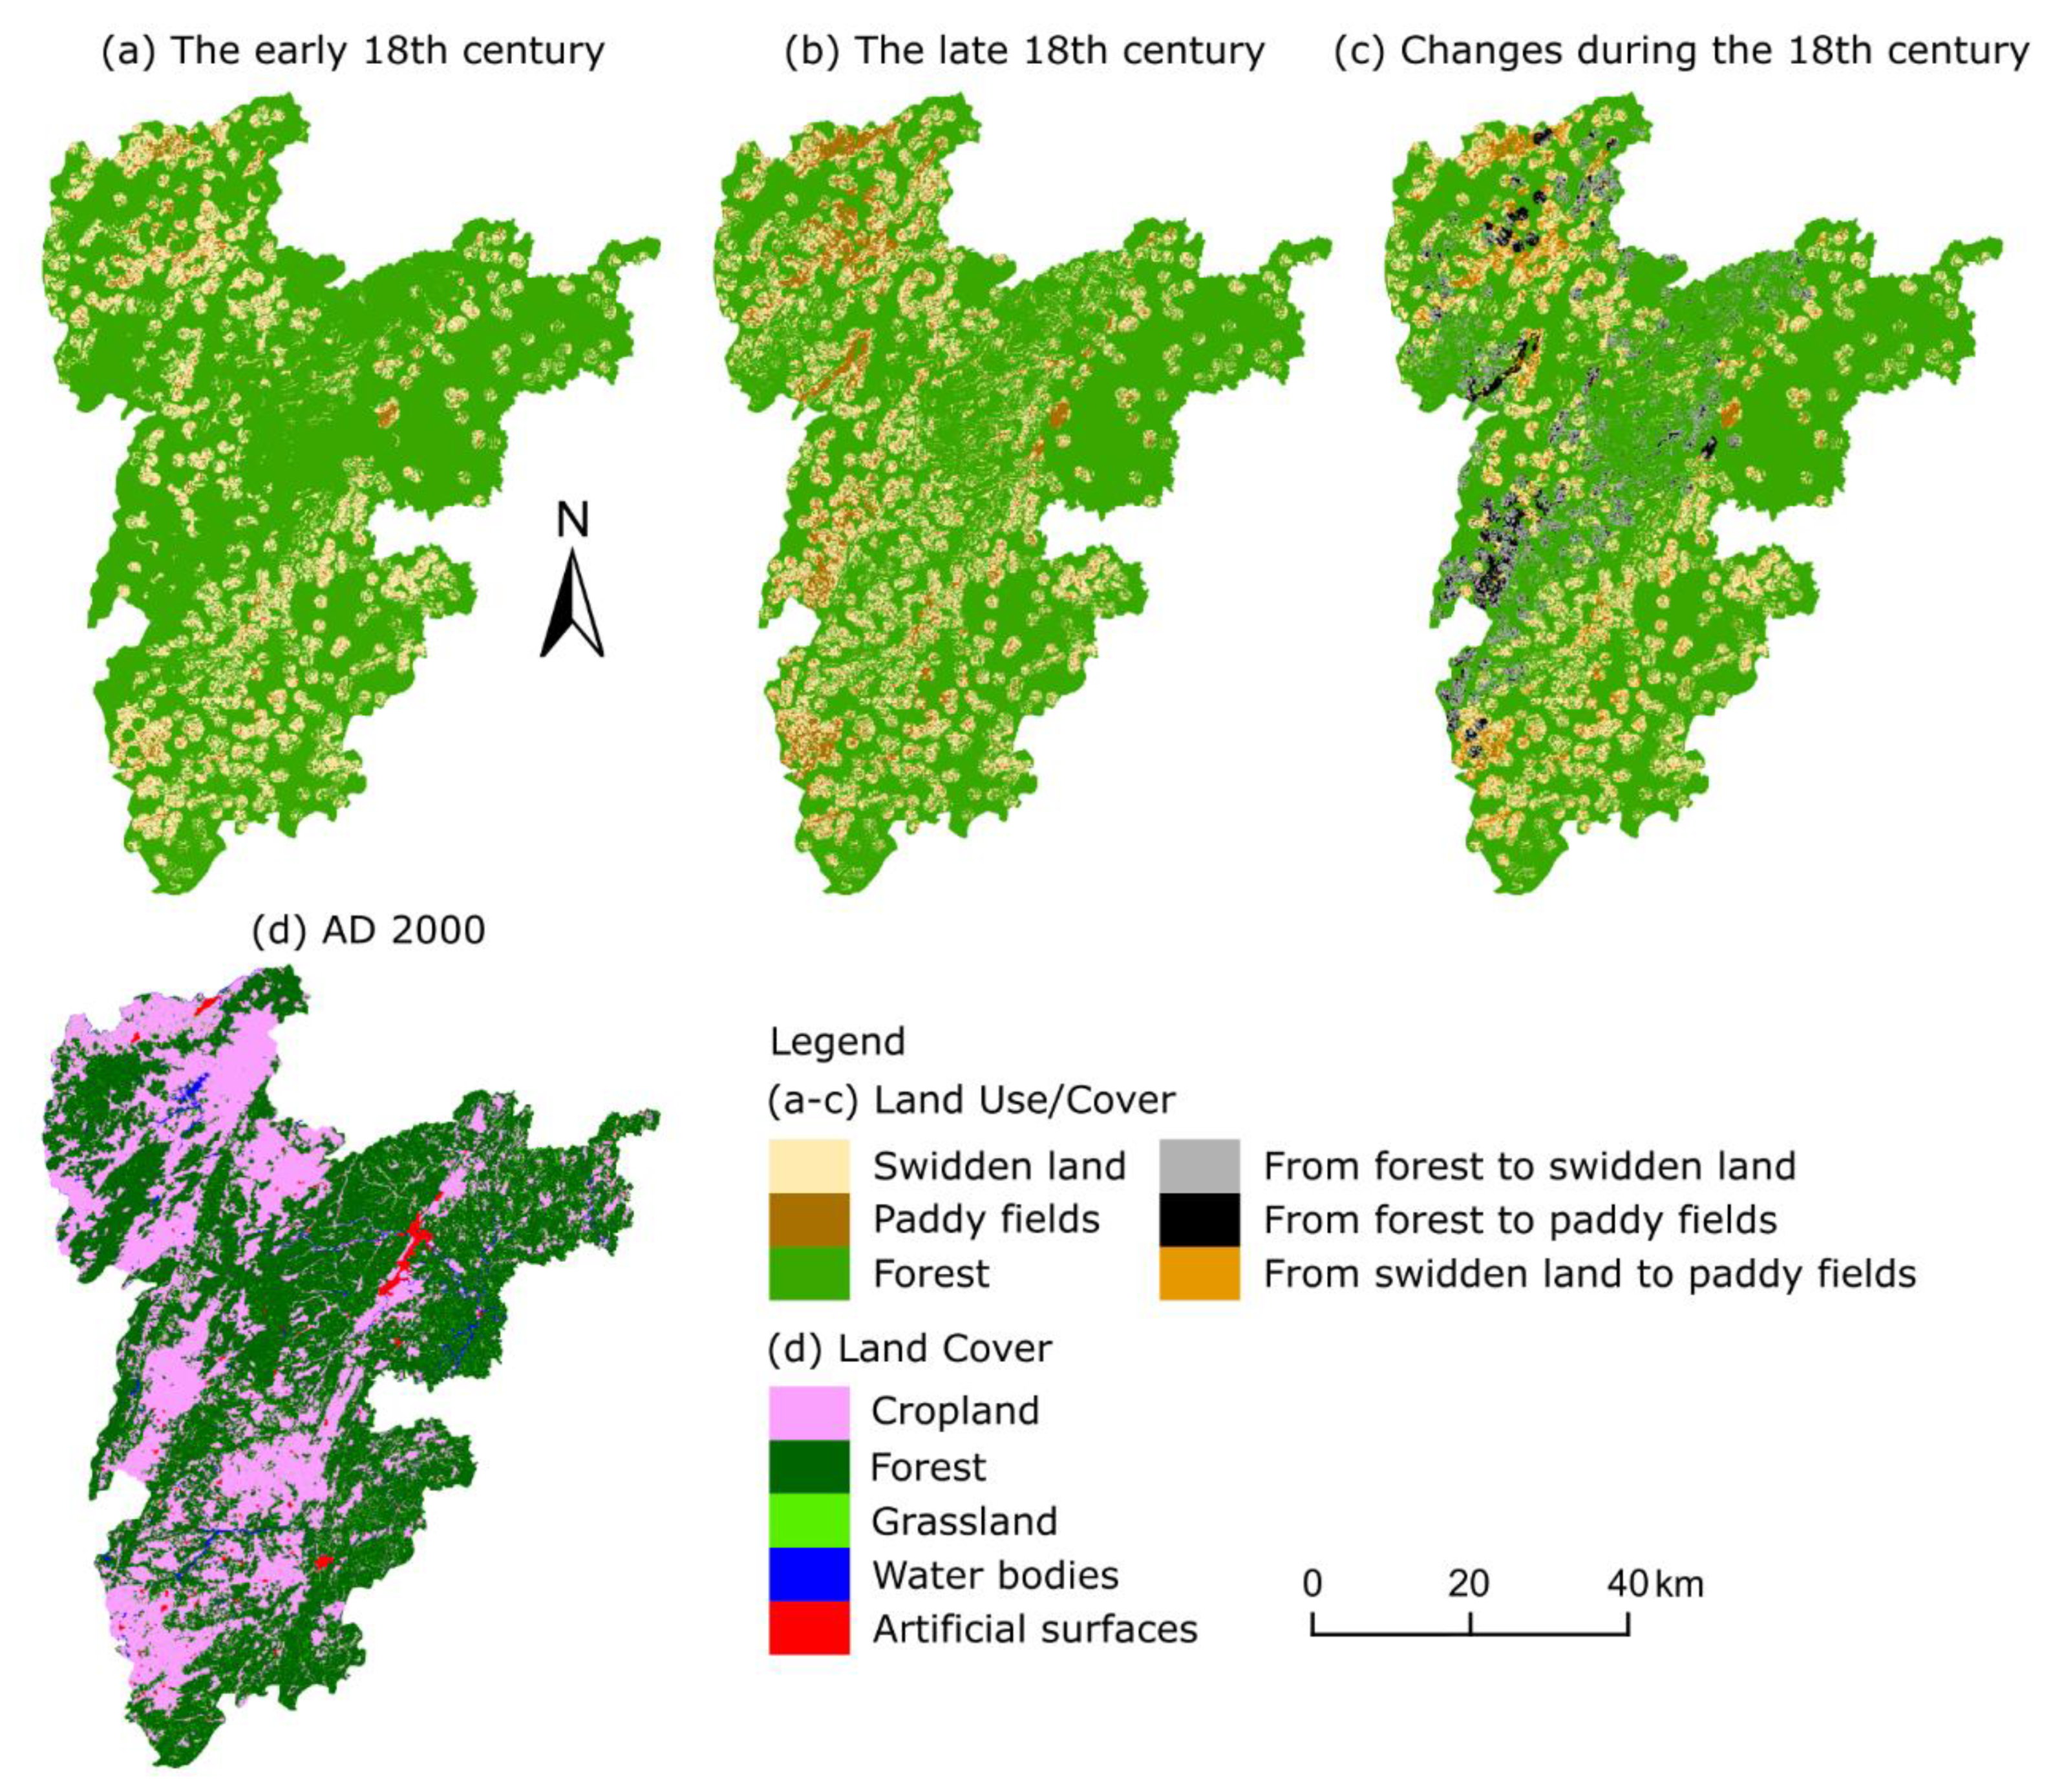
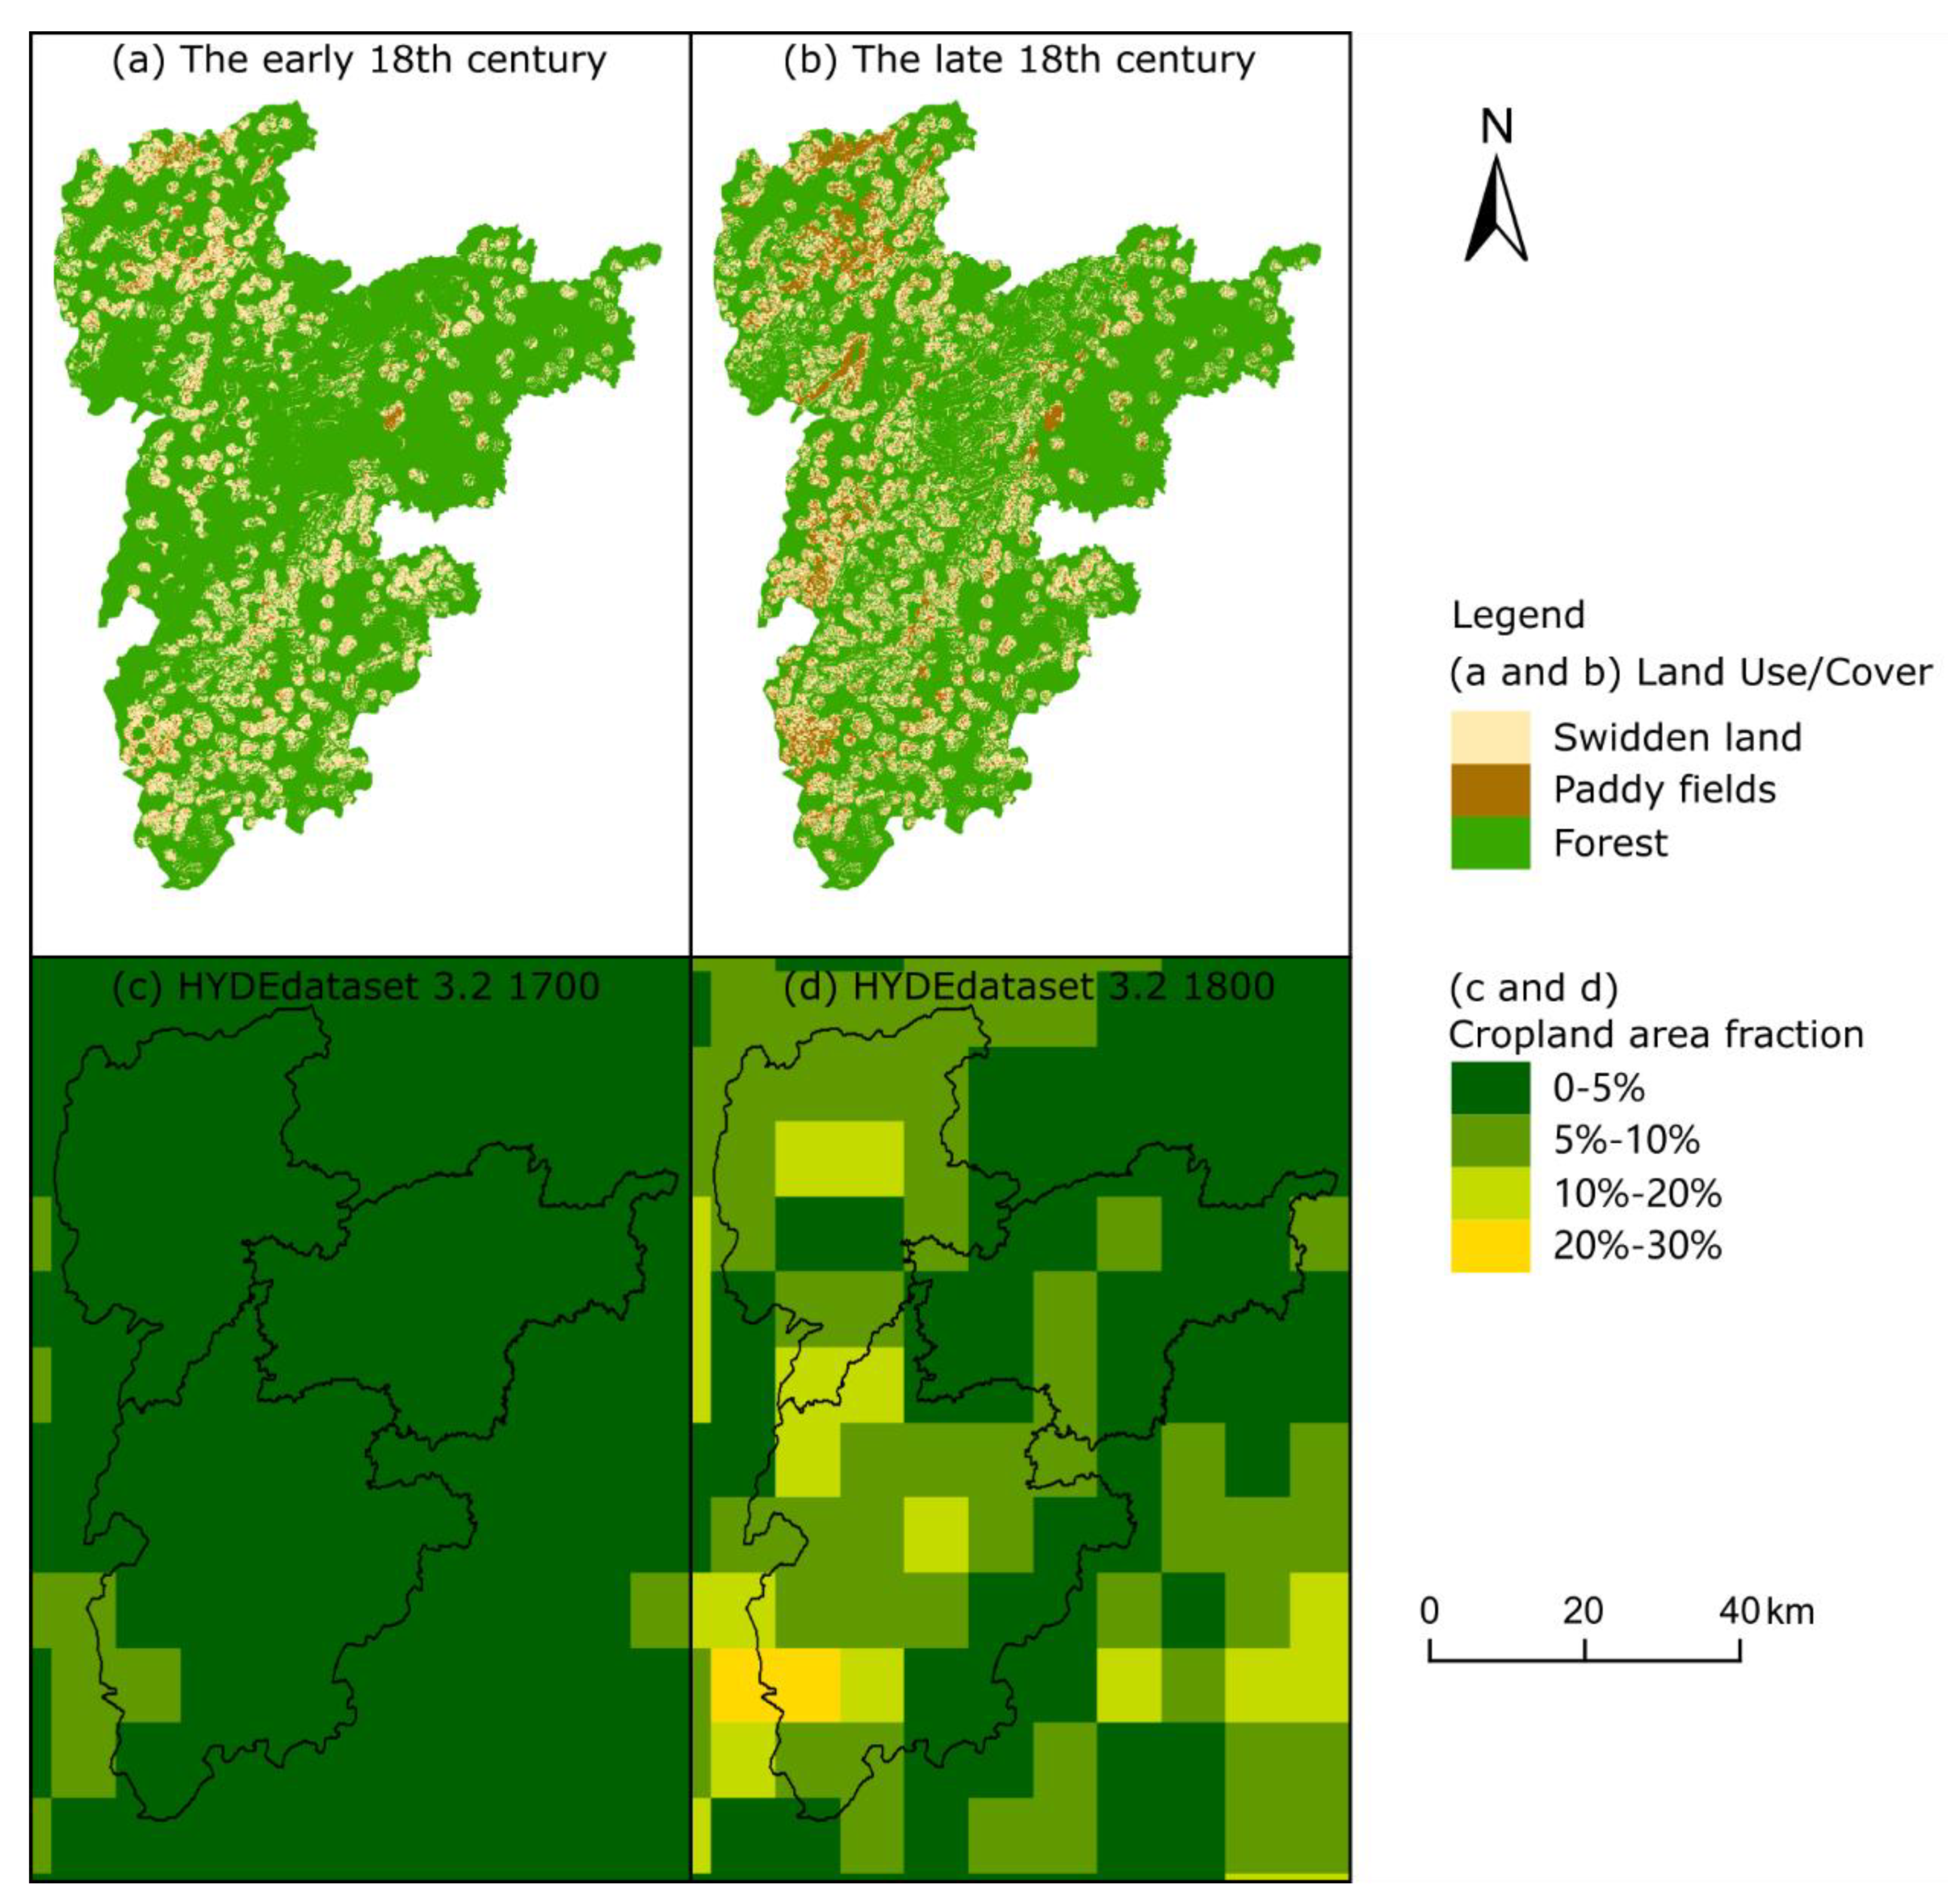
3.3. Changes in Land Use Pattern

The land use pattern changed significantly in western Hunan during the 18th century (Figure 5). According to the agricultural land distribution, agriculture-driven deforestation mainly occurred in the eastern and western parts of the region at relatively low elevations prior to the 18th century (Figure 5a). By the late 18th century, the expansion of agricultural land was accompanied by a retreat in the extent of forested land, and this forest loss was mainly distributed in the central part of the region at relatively high elevations (Figure 5b,c).

4. Discussion

4.1. Assessment of the Agricultural Land Area Reconstruction

Since the deforestation in this study was reconstructed based on agricultural land expansion, an assessment of the agricultural land area can also demonstrate the reliability of the reconstruction of deforestation. However, it is difficult to quantitatively assess the reconstruction of deforestation and agricultural land area because of historical data limitations. Therefore, other materials were used to evaluate these reconstruction results.

4.1.1. Assessment of the Results through the Description of Historical Documents

In the mountainous areas of China, the cropland cover expanded with the increase of people and immigration when the land use policy changed after the mid-18th century [34,39]. According to agricultural historians, for example, the cropland area from 1724 to 1812 had increased by 32.6% in Sichuan (including Chongqing), by 250.6% in Guizhou, by 33.1% in Yunnan, by 63.8% in Hunan, and by 36.4% in Guangxi [50].
Agricultural development as described in historical documents indicates that the land across the entire region had been plowed in the late 18th century [45]. This suggests that the scale of land reclamation was probably near saturation under the prevailing conditions. This description is corroborated by the reconstruction results, which showed that the agricultural land was widely distributed in this area.

4.1.2. Assessment of the Results by Modern LUCC

First, the modern agricultural surveys were used as a reference. Several surveys of regional agriculture were undertaken during the 20th century, among which the agricultural survey of the 1980s is relatively detailed and still easily accessible. Moreover, the agricultural land may have reached its maximum spatial distribution in the region in the 1980s, because the land that could be cultivated was reclaimed as agricultural land (mainly cropland) under the derivation of the policy, culture, and economy. According to this survey, the regional construction land area, cropland (including ridges) area, grassland area, and forestland area were 81.0 km2, 1246.0 km2, 858.1 km2, and 1652.6 km2, respectively. The comparison results indicated that the agricultural land area in the late 18th century was equivalent to 97.9% of the cropland area in the 1980s, and the forestland area in the late 18th century corresponded to 108.8% of the vegetation area (including forestland and grassland) in the 1980s. This would imply that the cropland cover in the 1980s may already have been cultivated in the late 18th century.
Second, the Globeland30 in 2000, an important remote sensing product, was used as a reference with a spatial resolution of 30 m × 30 m, by considering multiple factors, such as the spatial resolution and accessibility [41]. Both agricultural land and forest in the late 18th century displayed a spatial pattern similar to that obtained from the Globeland30 in 2000 (Figure 5b,d). However, a dissimilar spatial pattern was also discernible, probably because some historical settlements were missed. Overall, when combined with the descriptions of agricultural development gleaned from historical documents, it can be seen that the reconstruction results could portray the spatial pattern of agricultural land and forest land in the late 18th century.
Third, to evaluate the method in this study, we used modern settlements and physical environmental factors to estimate the modern agricultural land and forest cover. The percentage of agricultural land and forest estimated in this study were 32.3% and 67.7%, respectively. The agricultural land area and forest area estimated in this study were equivalent to 105.9% of the cropland area and 103.2% of the vegetation area (including forestland and grassland) in the materials of the agricultural regionalization, respectively. Meanwhile, the agricultural land area and forest area estimated in this study corresponded to 86.2% and 117.7% of those in Globeland30 [41], respectively. These differences were all within 20%. This meant that the agricultural land area and forest area estimated in this study were close to the actual land use area.

4.1.3. Assessment of the Results Based on the Population Size

The regional agricultural land area influences grain production, and grain production is inexorably linked to grain demand, which is determined by population size. First, the regional grain production was estimated by using agricultural land area and crop yield per unit area. The crop yield per unit area was decided by the planting structure. It is assumed that the paddy fields were planted only with rice with a shorter rotational cycle during the 18th century, and that swidden land was planted with traditional crops only in the early 18th century and with equal amounts of traditional crops and corn in the late 18th century [45,47]. Regional grain production was 15,757.1 tons and 47,720.9 tons in the early and late 18th century, respectively. Second, regional grain demand was estimated using the population size and per capita grain demand [51]. According to a study by one historian, Cao Shuji, the regional population was 99,000 in 1680, 146,000 in 1776, and 189,000 in 1820 [52]. Accordingly, combining those values with the per capita grain demand, regional grain demand was 18,162.6 tons in 1680, 26,645.0 tons in 1776, and 34,492.5 tons in 1820. It should be noted that the grain demand was considered only for food consumption and thus excluded other needs for it, such as with taxes, animal feed, and the grain trade.
Combining the grain demand and grain production estimates, the reconstruction results of this study were assessed, and the food security level was also observed across the study area. Assuming the population number in the early 18th century was close to that in 1680, grain production only met 86.8% of the demand in this period. Assuming then that the agricultural land area remained stable in the later 18th century, grain production rose to 179.1% and 138.4% of the demand in 1776 and 1820, respectively. This might indicate that regional grain production only met the most basic grain demand during the 18th century. This relationship was consistent with the descriptions in historical documents of a more intense state of regional grain production and demand [45,47]. Obviously, according to the population size reconstruction as a reference, the agricultural land area reconstructed by this study has high reliability.

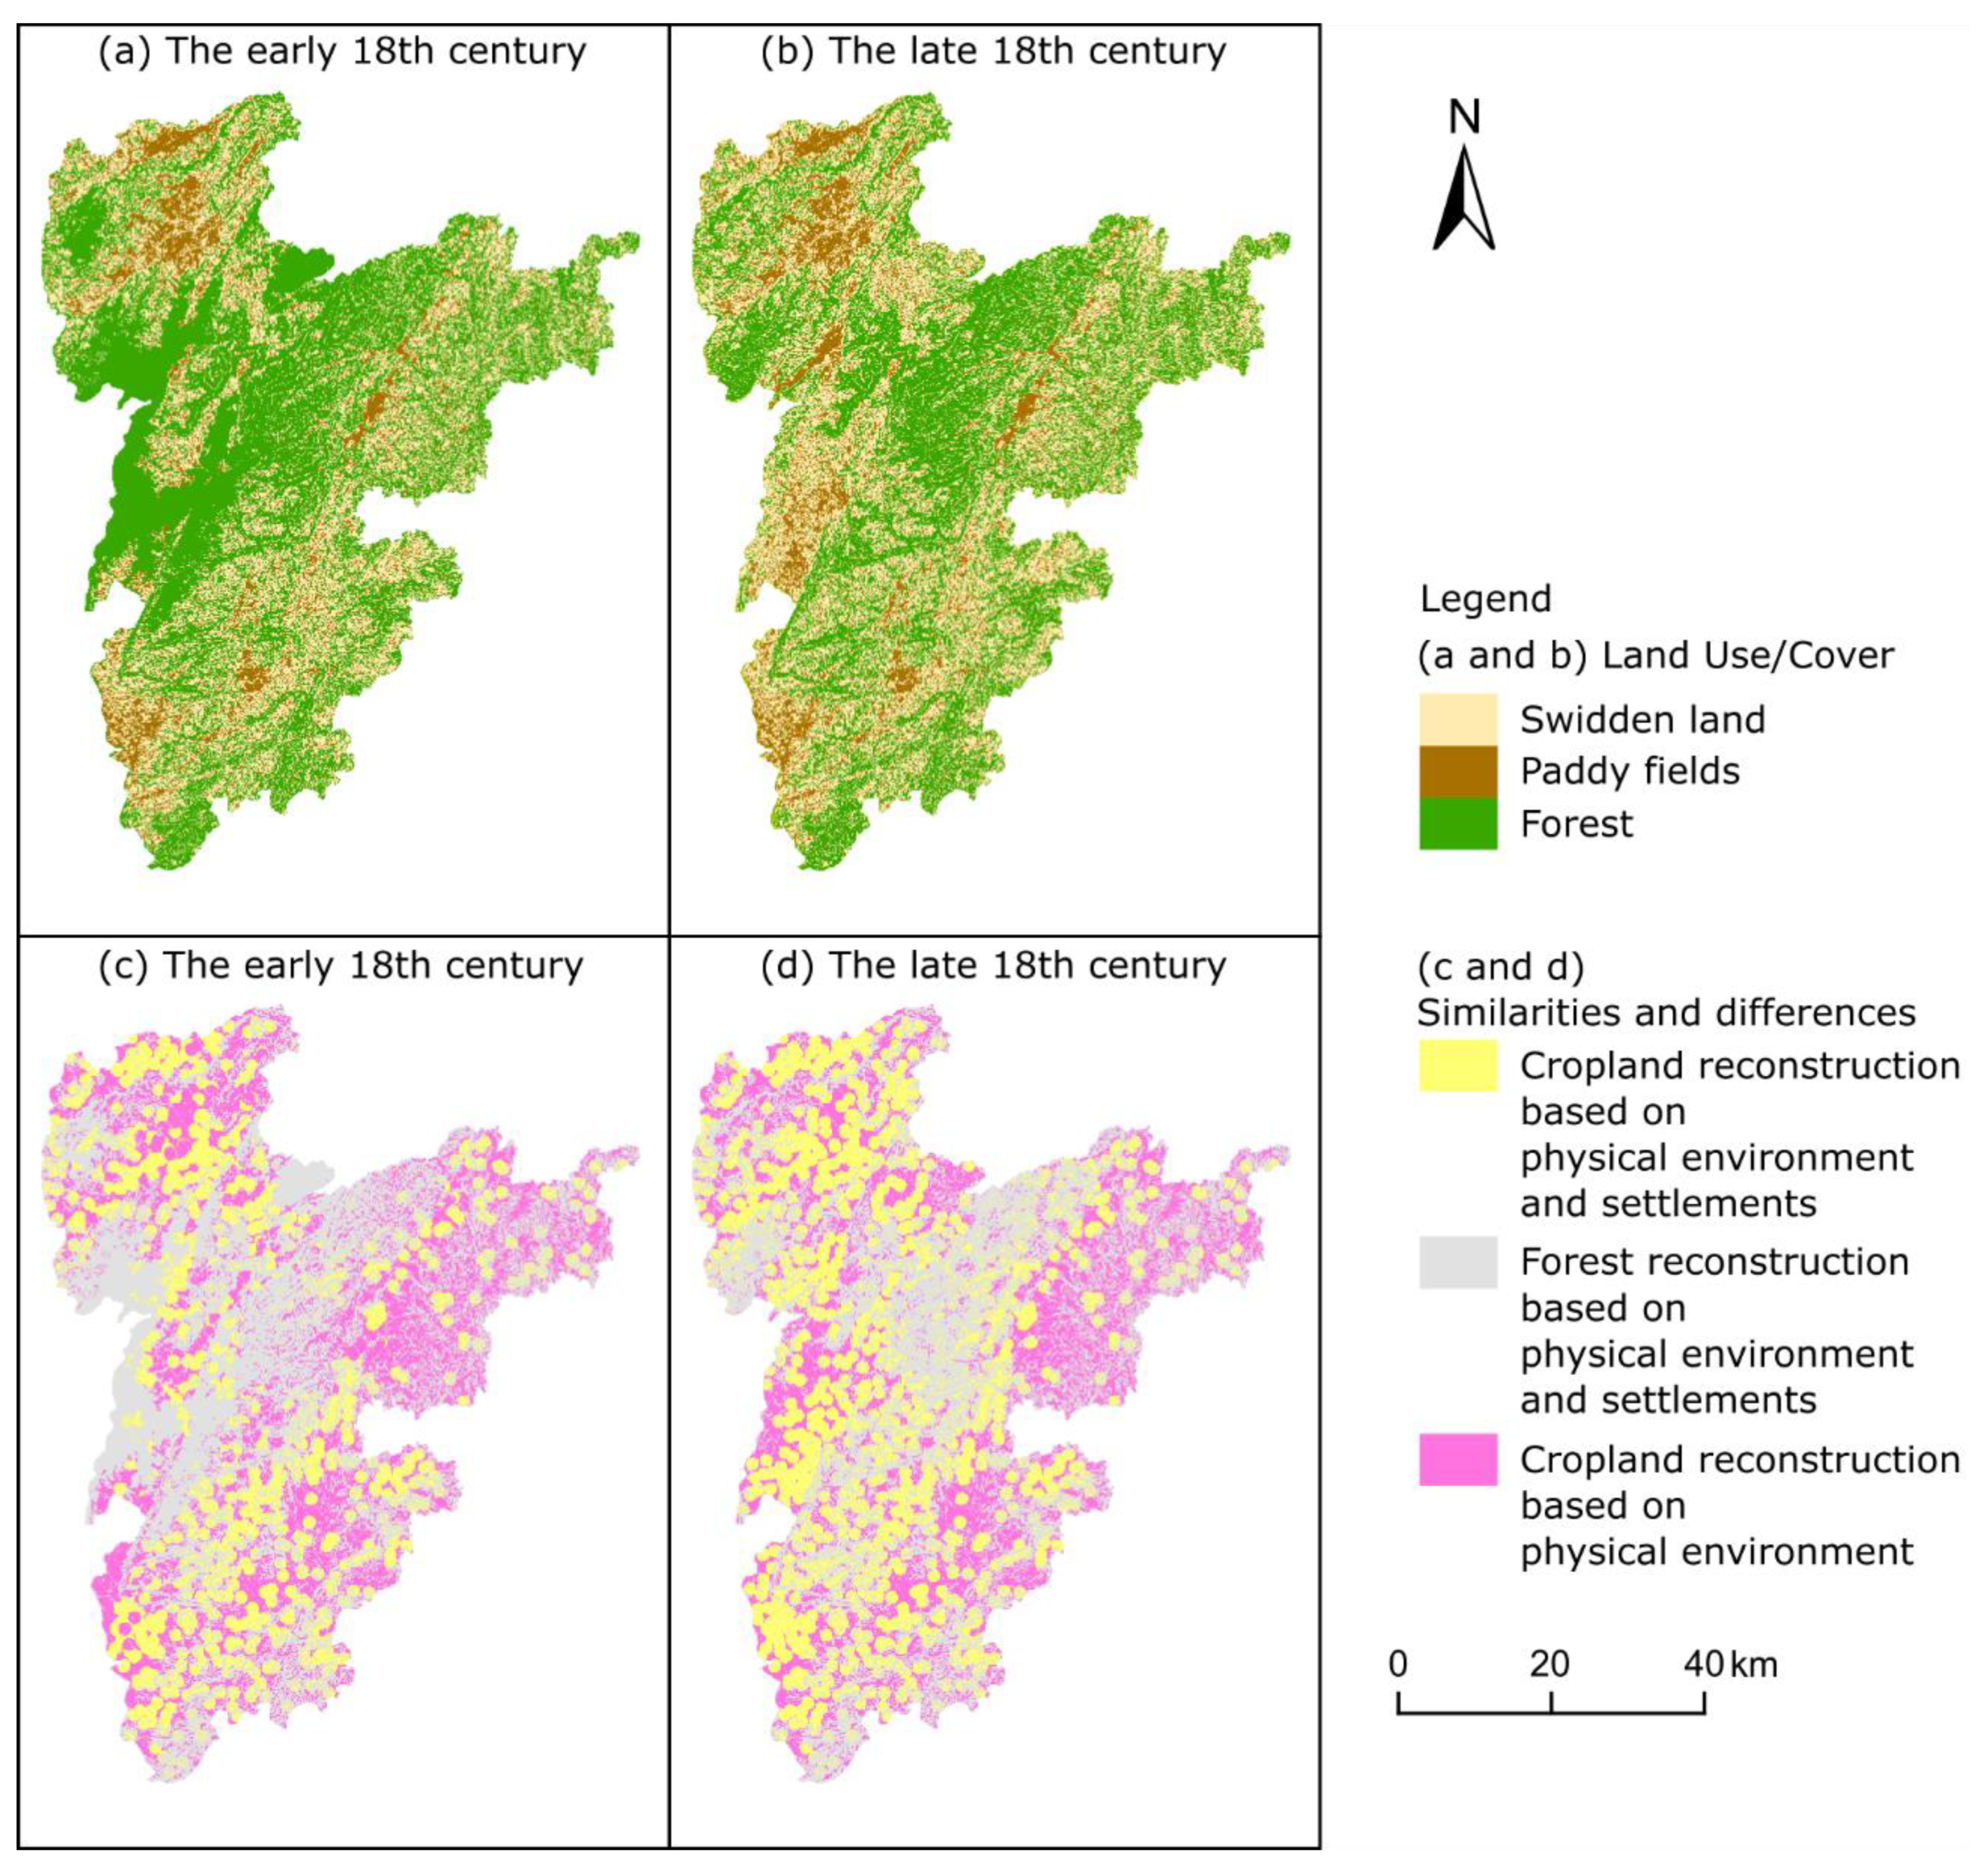
4.2. Comparisons with a Reconstruction Based on the Physical Environment without Settlements

The PAGES LandCover6k working group has proposed paying closer attention to the socio-cultural factors, putting them on par with the physical environment in terms of importance [19]. We used settlements as socio-cultural factors to improve the historical LUCC reconstruction.
In the case of using only physical environmental factors (i.e., elevation, slope, and slope aspect) and not using settlements, the historical LUCC can also be reconstructed. The result showed another potential cropland and forest distribution during the 18th century in this area (Figure 6a,b). Despite the similarities, there were differences between the historical LUCC reconstruction based on settlements, the reconstruction of this study, and the reconstruction without settlements.
According to the reconstruction based on the physical environment without settlements, the cropland and forest accounted for 50.1% and 49.9% of the areal land area in the early 18th century, and the percentage of cropland and forest were 56.7% and 43.3% in the late 18th century, respectively. Compared with reconstruction based on settlements, the result of the reconstruction without settlements is a larger distribution of cropland and a smaller distribution of forest (Figure 6c,d). Among them, the cropland area and forest area reconstruction without settlements were 183.5% and 62.7% of that of this study in the late 18th century, respectively. Given that the cropland distribution has a close relationship with population distribution, it is impossible to have many cropland areas without settlement distribution, especially in historical periods. It is difficult to show the true distribution of historical LUCC when reconstruction only uses the physical environment factors.
The reconstruction of settlements provides an opportunity to obtain more accurate and reliable spatiotemporal patterns of historical LUCC, especially in the mountainous areas.

4.3. Comparisons with Previous Studies

The historical LUCC has been reconstructed by researchers. Historians have usually described the process qualitatively [34,39,49], while natural scientists (e.g., ecologists, geographers, and environmental scientists) have preferred to quantitatively reconstruct the process using long time series [48,53,54,55] or spatial explicit datasets [56,57,58,59]. This study made comparisons with previous studies, including the global and Chinese historical LUCC dataset, the historical LUCC reconstructed based on settlements, and the historical LUCC reconstructed using sediment evidence.

4.3.1. Comparison with the Previous LUCC Dataset

To quantitatively study the impact of land use change on environmental change over long periods, researchers have reconstructed several historical LUCC datasets [19,20]. These datasets allocate the total historical cropland area into grids according to reclamation suitability, calculated using land suitability models that incorporate how natural factors (e.g., temperature, precipitation, elevation, and slope) affecting crop growth and cropland spatial distributions [17]. First, several global historical LUCC datasets, such as HYDE and KK10, have been developed [16,17,22]. The HYDE dataset is developed by the Netherlands Environmental Assessment Agency, and its latest renewed version (HYDE 3.2) is reconstructed croplands and pastures with a spatial resolution of 0.5′ × 0.5′ from 10,000 BC to AD 2015 [17]. The KK10 dataset is developed by Kaplan and Krumhardt, which shows the changes in cropland and deforestation of a grid of 0.5′ × 0.5′ from 8 ka BP to AD 1850 [16,22]. Second, Chinese historical LUCC datasets have also been developed by Chinese researchers, and these datasets include historical cropland and forestland in a spatially explicit. The spatial resolution of the dataset with percentages is usually 10 km × 10 km [56,57] or 5 km × 5 km [21], and the spatial resolution of the Boolean dataset is usually 1 km × 1 km [58,59].
Compared with these global and Chinese historical LUCC datasets, the results of this study show a finer spatial resolution, at 30 m × 30 m (Figure 7). By improving the spatial resolution, it is now possible to investigate and more accurately infer the regional-scale historical LUCC for mountainous areas with complex geomorphic environments [60]. This study could provide a case study on agriculture-driven deforestation on spatially explicit reconstruction based on historical settlements.

4.3.2. Comparison with Historical LUCC Reconstructions Based on Settlements

To improve the global historical LUCC datasets, the PAGES LandCover6k working group has proposed paying closer attention to socio-cultural factors, putting them on par with the physical environment in terms of importance [19]. Settlements or settlement relics have been used as indicators of the socio-cultural effects in recent reconstruction of the historical LUCC [23,24,25,26,27]. Compared with the global historical LUCC datasets, the studies using settlements or settlement relics were able to obtain more accurate and reliable spatiotemporal patterns of historical LUCC [24].
In China, researchers have used settlement information from historical documents, modern toponymic gazetteers, and fieldwork materials to reconstruct the historical LUCC at the regional scale over the past few centuries [27]. In the same vein, the present study extracted settlement information from historical documents and thereby hoped to acquire a closer representation of the historical LUCC at that time. Moreover, this study is consistent with the previous studies of historical LUCC based on settlements in the result, which collectively can be used to convey the agricultural land expansion and forest area losses in the mountainous areas of southern China during the 18th century [27].

4.3.3. Comparison with Historical LUCC Reconstructed Using Sediment Evidence

The study of sediment evidence has advanced the understanding of historical LUCC over a long term, and part of this work also serves to improve the global historical LUCC dataset [48]. For example, researchers have used the REVEALS model of quantitative pollen-based (from lake sediments) land cover reconstruction [48]. In addition, researchers can reconstruct regional environmental changes using data collected from cave sediments [53].
Both the lake sediments and cave sediments revealed changes that indicate that the impact of human activities on land cover change in the mountains of southern China gradually strengthened over the last few centuries [48,53,54,55]. These studies also uncovered important land cover transformations that occurred in the 18th century. Using historical documents, this study corroborates the historical LUCC studies, based on reconstruction from sediment evidence, that the forest was replaced by cropland during the 18th century.
Moreover, compared with the centennial-scale temporal resolution of the sediment evidence, this study presents spatial patterns of agricultural land and forest within the same century (18th century), thus portraying a more detailed spatiotemporal pattern. This is the advantage of historical documents, which can depict in greater detail the processes of historical environmental change associated with human activities.

4.4. Limitations and Prospects of This Study

Although the reconstruction of this study contributes to an understanding of deforestation in a specific period at the regional scale, there are some limitations to this study. Limited by the availability of historical sources, the reconstruction of historical deforestation was carried out for only part of the time. This period is often considered a turning point in China. This is because only significant changes would have been noticed by the people of the time and recorded in historical documents. This recording phenomenon is summarized as “recording unusual rather than common events” by past environmental change researchers [61].
To improve historical LUCC, further research is needed. First, this study mainly reconstructed the agricultural land expansion and the local forest loss, and it is still necessary to comprehensively reconstruct the historical LUCC of the region. Second, this study only took western Hunan as the study area to reconstruct historical deforestation of mountainous areas, and historical deforestation trends on broader regional scales should be shown using more research materials from other regions. Third, this study only reconstructed the agricultural land and deforestation during the 18th century with transformational significance, so it remains necessary to employ more research materials to reconstruct the LUCC over long periods to better understand the human-nature interactions over the long term. Fourth, because the reconstruction of the agricultural land and deforestation was based on a 30 m × 30 m grid in this study, improving upon this spatial resolution could enhance the mapping of the historical LUCC on the mountainous areas in the context of complex geomorphology.

5. Conclusions

A significant agriculture-driven deforestation occurred in the 18th century in China due to its the socio-cultural transformation. We took typical counties in western Hunan (Jishou, Fenghuang, and Huayuan) as the case study area, extracted historical settlement information from historical sources, and reconstructed the settlements’ expansion and densification as indicators of socio-cultural factors. We then reconstructed the agricultural land expansion and agriculture-driven deforestation based on these settlements.
Agriculture-driven deforestation mainly occurred in the eastern and western parts of the region at relatively low elevation in the early 18th century, but was mainly distributed in the central part at relatively high elevation with the settlements expansion and densification in the late 18th century. This study helps to understand the anthropogenic land cover change on a larger spatiotemporal scale through a regional case study.
This study used historical sources to reconstruct historical LUCC on the mountainous areas in the context of complex geomorphology. When compared with the global and Chinese historical LUCC datasets, this study has improved the spatial resolution of the reconstruction results. Meanwhile, this study, using historical documents, corroborates the historical LUCC already reconstructed using sediment evidence and shows a more detailed spatiotemporal pattern of agriculture-driven deforestation. Therefore, using historical settlements from historical sources will be crucial for a better mapping of historical LUCC. Future investigations on historical LUCC reconstruction based on settlements in a typical region would help to improve knowledge of human-nature interactions over the long term.

Author Contributions

Conceptualization, Y.L. (Yikai Li), Y.Y. and X.F.; Methodology, Y.L. (Yikai Li), Y.Y. and X.F.; Writing—original draft, Y.L. (Yikai Li); Writing—review and editing, Y.L. (Yikai Li), Y.Y., X.F. and Y.L. (Yachen Liu). All authors have read and agreed to the published version of the manuscript.

Funding

This work was supported by grants from the National Key R&D Program of China (No. 2017YFA0603304), the China Postdoctoral Science Foundation (No. 2021M702060), the National Natural Science Foundation of China (No. 41807438), the Scientific Research Program Funded by Shaanxi Provincial Education Department (Program No. 20JK0877), the Natural Science Basic Research Program of Shaanxi (No. 2021JQ-793), and the Fundamental Research Funds for the Central Universities.

Institutional Review Board Statement

Not applicable.

Informed Consent Statement

Not applicable.

Data Availability Statement

Data are contained within the article.

Acknowledgments

We are grateful to three anonymous reviewers for their constructive comments and suggestions on the previous version of this manuscript.

Conflicts of Interest

The authors declare that they have no conflicts of interest.

Appendix A

Figure A1. Examples of historical settlement names/modern settlement names on (a) historical maps of the late 18th century and (b) Google Maps in 2019 (http://earth.google.com, accessed on 15 May 2021). RS, RDP, KJP, GZZ, HYZ, BNZ, RLZ, KW, CD, XTX, LBZ, and XXK stand for Ranshao, Randong Ping, Kangjia Ping, Guzhe Zhai, Hongyan Zhai, Bunu Zhai, Ranlao Zhai, Kewa, Chuandong, Xitou Xun, Delong Zhai, and Xiaoxi Kou, respectively.
Land 11 00181 g0a1
Figure A2. The settlement population size of Miao villages in Western Hunan during the 18th century. The colors represent differences in the number of people in the settlement.
Land 11 00181 g0a2
Figure A3. Relative distances between Miao villages in western Hunan during the 18th century. ‘Li’ is a Chinese unit of distance equal to 0.5 km.
Land 11 00181 g0a3

Note

1
Yongshun Fuzhi, Miaofang Beilan, Qianzhou Tingzhi, Chunan Miaozhi, Chenzhou Fuzhi, and Yongshun Xianzhi.

References

  1. FAO. Global Forest Resources Assessment 2020: Main Report; United Nations: Rome, Italy, 2020.
  2. Erb, K.H.; Kastner, T.; Plutzar, C.; Bais, A.L.S.; Carvalhais, N.; Fetzel, T.; Gingrich, S.; Haberl, H.; Lauk, C.; Niedertscheider, M.; et al. Unexpectedly large impact of forest management and grazing on global vegetation biomass. Nature 2018, 553, 73–76. [Google Scholar] [CrossRef]
  3. Harris, N.L.; Gibbs, D.A.; Baccini, A.; Birdsey, R.A.; de Bruin, S.; Farina, M.; Fatoyinbo, L.; Hansen, M.C.; Herold, M.; Houghton, R.A.; et al. Global maps of twenty-first century forest carbon fluxes. Nat. Clim. Chang. 2021, 11, 234–240. [Google Scholar] [CrossRef]
  4. Aleman, J.C.; Jarzyna, M.A.; Staver, A.C. Forest extent and deforestation in tropical Africa since 1900. Nat. Ecol. Evol. 2018, 1, 26–33. [Google Scholar] [CrossRef]
  5. Tilman, D.; Clark, M.; Williams, D.R.; Kimmel, K.; Polasky, S.; Packer, C. Future threats to biodiversity and pathways to their prevention. Nature 2017, 546, 73–81. [Google Scholar] [CrossRef]
  6. Curtis, P.G.; Slay, C.M.; Harris, N.L.; Tyukavina, A.; Hansen, M.C. Classifying drivers of global forest loss. Science 2018, 361, 1108–1111. [Google Scholar] [CrossRef]
  7. Pendrill, F.; Persson, U.M.; Godar, J.; Kastner, T.; Moran, D.; Schmidt, S.; Wood, R. Agricultural and forestry trade drives large share of tropical deforestation emissions. Glob. Environ. Chang. 2019, 56, 1–10. [Google Scholar] [CrossRef]
  8. Mensing, S.; Schoolman, E.M.; Palli, J.; Piovesan, G. A consilience-driven approach to land use history in relation to reconstructing forest land use legacies. Landsc. Ecol. 2020, 35, 2645–2658. [Google Scholar] [CrossRef]
  9. Ellis, E.C.; Beusen, A.H.W.; Klein Goldewijk, K. Anthropogenic biomes: 10,000 BCE to 2015 CE. Land 2020, 5, 129. [Google Scholar] [CrossRef]
  10. Ellis, E.C.; Gauthier, N.; Klein Goldewijk, K.; Bliege Bird, R.; Boivin, N.; Díaz, S.; Fuller, D.Q.; Gill, J.L.; Kaplan, J.O.; Kingston, N.; et al. People have shaped most of terrestrial nature for at least 12,000 years. Proc. Natl. Acad. Sci. USA 2021, 118, e2023483118. [Google Scholar] [CrossRef] [PubMed]
  11. Kaplan, J.O.; Krumhardt, K.M.; Zimmermann, N. The prehistoric and preindustrial deforestation of Europe. Quat. Sci. Rev. 2009, 28, 3016–3034. [Google Scholar] [CrossRef]
  12. Zhou, W.; Huang, G.; Pickett, S.T.; Cadenasso, M.L. 90 years of forest cover change in an urbanizing watershed: Spatial and temporal dynamics. Landsc. Ecol. 2011, 26, 645–659. [Google Scholar] [CrossRef]
  13. Sudhakar Reddy, C.; Jha, C.S.; Dadhwal, V.K.; Krishna, P.H.; Pasha, S.V.; Satish, K.V.; Dutta, K.; Saranya, K.R.L.; Rakesh, F.; Rajashekar, G.; et al. Quantification and monitoring of deforestation in India over eight decades (1930–2013). Biodivers. Conserv. 2016, 25, 93–116. [Google Scholar] [CrossRef]
  14. Bucała-Hrabia, A. Long-term impact of socio-economic changes on agricultural land use in the Polish Carpathians. Land Use Policy 2017, 64, 391–404. [Google Scholar] [CrossRef]
  15. Yang, F.; He, F.N.; Li, M.J.; Li, S.C. Evaluating the reliability of global historical land use scenarios for forest data in China. J. Geogr. Sci. 2020, 30, 1083–1094. [Google Scholar] [CrossRef]
  16. Kaplan, J.O.; Krumhardt, K.M.; Ellis, E.C.; Ruddiman, W.F.; Lemmen, C.; Goldewijk, K.K. Holocene carbon emissions as a result of anthropogenic land cover change. Holocene 2011, 21, 775–791. [Google Scholar] [CrossRef] [Green Version]
  17. Klein Goldewijk, K.; Beusen, A.; Doelman, J.; Stehfest, E. Anthropogenic land use estimates for the Holocene—HYDE 3.2. Earth Syst. Sci. Data 2017, 9, 927–953. [Google Scholar] [CrossRef] [Green Version]
  18. Danneyrolles, V.; Dupuis, S.; Fortin, G.; Leroyer, M.; de Römer, A.; Terrail, R.; Vellend, M.; Boucher, Y.; Laflamme, J.; Bergeron, Y. Stronger influence of anthropogenic disturbance than climate change on century-scale compositional changes in northern forests. Nat. Commun. 2019, 10, 1265. [Google Scholar] [CrossRef]
  19. Gaillard, M.J.; Morrison, K.D.; Madella, M.; Whitehouse, N. Past land-use and land-cover change: The challenge of quantification at the subcontinental to global scales. Pages Mag. 2018, 26, 3. [Google Scholar]
  20. Morrison, K.D.; Hammer, E.; Boles, O.; Madella, M.; Whitehouse, N.; Gaillard, M.-J.; Bates, J.; Linden, M.V.; Merlo, S.; Yao, A.; et al. Mapping past human land use using archaeological data: A new classification for global land use synthesis and data harmonization. PLoS ONE 2021, 16, e0246662. [Google Scholar] [CrossRef]
  21. Yu, Z.; Jin, X.B.; Miao, L.J.; Yang, X.H. A historical reconstruction of cropland in China from 1900 to 2016. Earth Syst. Sci. Data 2021, 13, 3203–3218. [Google Scholar] [CrossRef]
  22. Kaplan, J.O.; Krumhardt, K.; Gaillard, M.-J.; Sugita, S.; Trondman, A.-K.; Fyfe, R.; Marquer, L.; Mazier, F.; Nielsen, A. Constraining the deforestation history of Europe: Evaluation of historical land use scenarios with pollen-based land cover reconstructions. Land 2017, 6, 91. [Google Scholar] [CrossRef] [Green Version]
  23. Weiberg, E.; Hughes, R.E.; Finné, M.; Bonnier, A.; Kaplan, J.O. Mediterranean land use systems from prehistory to antiquity: A case study from Peloponnese (Greece). J. Land Use Sci. 2019, 14, 1–20. [Google Scholar] [CrossRef] [Green Version]
  24. Harrison, S.P.; Gaillard, M.J.; Stocker, B.D.; Vander Linden, M.; Klein Goldewijk, K.; Boles, O.; Braconnot, P.; Dawson, A.; Fluet-Chouinard, E.; Kaplan, J.O.; et al. Development and testing scenarios for implementing land use and land cover changes during the Holocene in earth system model experiments. Geosci. Model Dev. 2020, 13, 805–824. [Google Scholar] [CrossRef] [Green Version]
  25. Yu, Y.Y.; Wu, H.B.; Finke, P.A.; Guo, Z.T. Spatial and temporal changes of prehistoric human land use in the Wei River valley, northern China. Holocene 2016, 26, 1788–1801. [Google Scholar] [CrossRef]
  26. Wu, Z.L.; Fang, X.Q.; Jia, D.; Zhao, W.Y. Reconstruction of cropland cover using historical literature and settlement relics in farming areas of Shangjing Dao during the Liao Dynasty, China, around 1100 AD. Holocene 2020, 11, 1516–1527. [Google Scholar] [CrossRef]
  27. Huo, R.L.; Yang, Y.D.; Man, Z.M. Gridded reconstruction of spatiotemporal evolution of cropland in the Zhangjiu River Basin in Yunnan Province from 1700 to 1978. Acta Geogr. Sin. 2020, 9, 1966–1982, (In Chinese with English Abstract). [Google Scholar]
  28. Ning, J.; Liu, J.Y.; Kuang, W.H.; Xu, X.L.; Zhang, S.W.; Yan, C.Z.; Li, R.D.; Wu, S.X.; Hu, Y.F.; Du, G.M.; et al. Spatiotemporal patterns and characteristics of land-use change in China during 2010–2015. J. Geogr. Sci. 2018, 28, 547–562. [Google Scholar] [CrossRef] [Green Version]
  29. Liu, M.; Tian, H. China’s land cover and land use change from 1700 to 2005: Estimations from high-resolution satellite data and historical archives. Glob. Biogeochem. Cycles 2010, 24, GB3003. [Google Scholar] [CrossRef]
  30. Zou, Y.L.; Zhang, X.G.; Wang, S.C. The Physical Geography in Chinese History; Science Press: Beijing, China, 2013. (In Chinese) [Google Scholar]
  31. Wang, W.; Li, C.; Shu, J.; Chen, W. Changes of vegetation in southern China. Sci. China Earth Sci. 2019, 62, 1316–1328. [Google Scholar] [CrossRef]
  32. Zhang, Y.; Marquer, L.; Cui, Q.; Zheng, Z.; Zhao, Y.; Wan, Q.; Zhou, A. Holocene vegetation changes in the transition zone between subtropical and temperate ecosystems in Eastern Central China. Quat. Sci. Rev. 2021, 253, 106768. [Google Scholar] [CrossRef]
  33. Marks, R.B. China: Its Environment and History; Rowman & Littlefield Publishers: Lanham, MD, USA, 2011. [Google Scholar]
  34. Han, M.L. Chinese Historical Agricultural Geography; Peking University Press: Beijing, China, 2012. (In Chinese) [Google Scholar]
  35. Braun, A.; Rosner, H.J.; Hagensieker, R.; Dieball, S. Multi-method dynamical reconstruction of the ecological impact of copper mining on Chinese historical landscapes. Ecol. Model. 2015, 303, 42–54. [Google Scholar] [CrossRef]
  36. Wang, L.H. The gap between thought and action: An overview of the thought on natural resources and environmental protection in ancient China. Hist. Bimon. 2020, 2, 74–86, (In Chinese with English Abstract). [Google Scholar]
  37. He, F.N.; Ge, Q.S.; Dai, J.H. Quantitative analysis on forest dynamics of China in recent 300 years. Acta Geogr. Sin. 2017, 62, 30–40. (In Chinese) [Google Scholar]
  38. Wu, D.; Zhou, A.; Liu, J.; Chen, X.; Wei, H.; Sun, H.; Yu, J.; Bloemendal, J.; Chen, F. Changing intensity of human activity over the last 2000 years recorded by the magnetic characteristics of sediments from Xingyun Lake, Yunnan, China. J. Paleolimnol. 2015, 53, 47–60. [Google Scholar] [CrossRef]
  39. Yang, W.B. Land use and ecological change in Yunnan-Guizhou Plateau; Shanghai People’s Publishing House: Shanghai, China, 2008. (In Chinese) [Google Scholar]
  40. Zhang, L.S.; Fang, X.Q. Paleogeography of China: The Formation of China’s Natural Environment; Science Press: Beijing, China, 2012. (In Chinese) [Google Scholar]
  41. Chen, J.; Chen, J.; Liao, A.; Cao, X.; Chen, L.; Chen, X.; He, C.; Han, G.; Peng, S.; Lu, M.; et al. Global land cover mapping at 30 m resolution: A POK-based operational approach. ISPRS J. Photogramm. Remote Sens. 2014, 103, 7–27. [Google Scholar] [CrossRef] [Green Version]
  42. Morrison, K.D.; Tello, E.; Hammer, E.; Popova, L.; Madella, M.; Whitehouse, N.; Gaillard, M.J. Global-scale comparisons of human land use: Developing shared terminology for land-use practices for global change. Pages Mag. 2018, 26, 8–9. [Google Scholar]
  43. Kay, A.U.; Kaplan, J.O. Human subsistence and land use in Sub-Saharan Africa, 1000 BC to AD 1500: A review, quantification and classification. Anthropocene 2015, 9, 14–32. [Google Scholar] [CrossRef]
  44. Hughes, R.E.; Weiberg, E.; Bonnier, A.; Finné, M.; Kaplan, J.O. Quantifying land use in past societies from cultural practice and Archaeological Data. Land 2018, 7, 9. [Google Scholar] [CrossRef] [Green Version]
  45. Luo, Y.S. The Socio-Economic Development of the Yuanshui River Basin during the Ming and Qing Dynasties; Social Science Literature Press: Beijing, China, 2016. (In Chinese) [Google Scholar]
  46. Yin, S.T. Disappearing Wildfire: Slash and Burn Cultivation in Anthropological Perspective; Yunnan People’s Publishing House: Kunming, China, 2008. (In Chinese) [Google Scholar]
  47. Tan, B.Y. The Modern Reconstruction of Hunan Miaojiang Multi-National Community in the Qing Dynasty; Nationalities Press: Beijing, China, 2009. (In Chinese) [Google Scholar]
  48. Li, F.; Gaillard, M.-J.; Cao, X.; Herzschuh, U.; Sugita, S.; Tarasov, P.E.; Wagner, M.; Xu, Q.; Ni, J.; Wang, W.; et al. Towards quantification of Holocene anthropogenic land-cover change in temperate China: A review in the light of pollen-based REVEALS reconstructions of regional plant cover. Earth Sci. Rev. 2020, 203, 103119. [Google Scholar] [CrossRef]
  49. Lan, Y. Vegetation succession of the medium and low mountainous areas along the subtropics of the upper Yangtze River in recent 500 years. Geogr. Res. 2010, 29, 1182–1192. (In Chinese) [Google Scholar]
  50. Shi, Z.H. Agricultural Development in Qing China: A Quantitative Study, 1661-1911; Social Science Literature Press: Beijing, China, 2017. (In Chinese) [Google Scholar]
  51. Klein Goldewijk, K.; Dekker, S.C.; van Zanden, J.L. Per-capita estimations of long-term historical land use and the consequences for global change research. J. Land Use Sci. 2017, 12, 313–337. [Google Scholar] [CrossRef] [Green Version]
  52. Cao, S.J. Chinese Population History; Fudan University Press: Shanghai, China, 2005. (In Chinese) [Google Scholar]
  53. Kuo, T.S.; Liu, Z.Q.; Li, H.C.; Wan, N.J.; Shen, C.C.; Ku, T.L. Climate and environmental changes during the past millennium in central western Guizhou, China as recorded by Stalagmite ZJD-21. J. Asian Earth Sci. 2011, 40, 1111–1120. [Google Scholar] [CrossRef]
  54. Xiao, X.; Haberle, S.G.; Shen, J.; Yang, X.; Han, Y.; Zhang, E.; Wang, S. Latest Pleistocene and Holocene vegetation and climate history inferred from an alpine lacustrine record, northwestern Yunnan Province, southwestern China. Quat. Sci. Rev. 2014, 86, 35–48. [Google Scholar] [CrossRef]
  55. Yu, X.S.; Meng, H.W.; Huang, P.L.; Sun, Q.F.; Wang, M.; Zhang, H.C.; Shen, C.M. Environmental changes over the past 1200 years in the catchment of Yangzonghai Lake, Central Yunnan. Chin. J. Ecol. 2020, 39, 1896–1910, (In Chinese with English Abstract). [Google Scholar]
  56. He, F.N.; Li, S.C.; Zhang, X.Z. A spatially explicit reconstruction of forest cover in China over 1700–2000. Glob. Planet. Chang. 2015, 131, 73–81. [Google Scholar] [CrossRef]
  57. Li, S.C.; He, F.N.; Zhang, X.Z. A spatially explicit reconstruction of cropland cover in China from 1661 to 1996. Reg. Environ. Chang. 2016, 16, 417–428. [Google Scholar] [CrossRef] [Green Version]
  58. Yang, X.; Jin, X.; Du, X.; Xiang, X.; Han, J.; Shan, W.; Fan, Y.; Zhou, Y. Multi-agent model-based historical cropland spatial pattern reconstruction for 1661–1952, Shandong Province, China. Glob. Planet. Chang. 2016, 143, 175–188. [Google Scholar] [CrossRef] [Green Version]
  59. Yang, X.H.; Jin, X.B.; Xiang, X.M.; Fan, Y.T.; Shan, W.; Zhou, Y.K. Reconstructing the spatial pattern of historical forest land in China in the past 300 years. Glob. Planet. Chang. 2018, 165, 173–185. [Google Scholar] [CrossRef] [Green Version]
  60. Wang, Q.; Xiong, M.; Li, Q.; Li, H.; Lan, T.; Deng, O.; Huang, R.; Zeng, M.; Gao, X. Spatially explicit reconstruction of cropland using the random forest: A case study of the Tuojiang River Basin, China from 1911 to 2010. Land 2021, 10, 1338. [Google Scholar] [CrossRef]
  61. Zheng, J.Y.; Ge, Q.S.; Hao, Z.H.; Liu, H.L.; Man, Z.M.; Hou, Y.J.; Fang, X.Q. Paleoclimatology proxy recorded in historical documents and method for reconstruction on climate change. Quat. Sci. 2014, 6, 1186–1196, (In Chinese with English Abstract). [Google Scholar]
Figure 1. Location of the study area in western Hunan Province in southern China (27°40′–28°45′ N; 109°15′–110°4′ E), a region associated with the Yunnan-Guizhou Plateau and the Southeast Hills. The elevation were obtained from the Shuttle Radar Topography Mission (http://srtm.csi.cgiar.org/, accessed on 15 December 2020), and historical county boundaries were obtained from the China Historical Geographic Information System (https://dataverse.harvard.edu/dataverse/chgis_v6, accessed on 20 September 2020).
Land 11 00181 g001
Figure 2. Flow chart of the methodology use in this study.
Land 11 00181 g002
Figure 3. Land use types around the settlements in western Hunan in the 18th century.
Land 11 00181 g003
Figure 4. The elevation and slope of Miao villages in Fenghuang and Huayuan during the 18th century. The black lines indicate the terrace at different elevations, and the gray lines indicate sloping fields at different slope positions.
Land 11 00181 g004
Figure 5. (a) Land use/cover in the early 18th century, (b) land use/cover in the late 18th century, and (c) land use/cover change during the 18th century reconstructed in this study. (d) Land cover in AD 2000 from Globeland30 [41].
Land 11 00181 g005
Figure 6. (a,b) Historical LUCC reconstruction based on the physical environment without settlements. (c,d) The similarities and differences between the reconstruction based on settlements and reconstruction without settlements.
Land 11 00181 g006
Figure 7. This study’ findings compared with the HYDE dataset 3.2 regarding western Hunan during the 18th century.
Land 11 00181 g007
Table 1. Data sources for the reconstruction of deforestation.
Data SourcesData Types
Historical documentsLocal gazetteers of the Qing Dynasty
Other historical documents
Modern survey and collation materialsModern local gazetteers
Materials of the agricultural regionalization
Modern toponymic gazetteers
Terrain informationDigital Elevation Model
Table 2. Land-use types and their spatial distribution recorded in historical documents.
Land Use TypesSpatial DistributionRecord Examples in Historical DocumentsSource a
Rice paddyValleyPeople plant the rice in a place with gentle terrain that is easy to irrigate.YSFZ
People plant the rice in the river valley.MFBL
There is a small amount of cropland in the mountain valley.QZTZ
People plant the rice in a place with gentle terrain.CNMZ
The Miao people tend to cultivate on sunny slopes.CNMZ
Shifting cultivationHillside with less steep slopesThe Miao people grow crops using the slash and burn method in the mountainous areas.CNMZ
People burn the weeds and plant the crops on hillsides.MFBL
People carry out slash and burn farming on relatively gentle hillsides.CNMZ
People have to open up forestland for farming in the mountainous areas at higher elevations and on steeper slopes when the gentle land has been reclaimed.CNMZ
AgroforestryHillsidePeople plant Tung trees along the mountain ridge.CZFZ
People plant the dryland crops on the mountainside with a gentle slope, but they plant Tung trees on the mountain with a steeper slope.YSFZ
Hunting-foragingHillsidePeople go to the mountains to pick ferns and pueraria and eat them when their food crops failed.YSXZ
People choose to cut trees, fish, and hunt in winter.CZFZ
PastoralismHillsidePeople graze cattle on the mountain and keep horses near the house from mid-spring to mid-autumn, and they graze cattle and horses on the mountain after the eighth month of the lunar calendar.CNMZ
a The YSFZ, MFBL, QZTZ, CNMZ, CZFZ, and YSXZ denote the books of Yongshun Fuzhi, Miaofang Beilan, Qianzhou Tingzhi, Chunan Miaozhi, Chenzhou Fuzhi, and Yongshun Xianzhi, respectively 1.
Publisher’s Note: MDPI stays neutral with regard to jurisdictional claims in published maps and institutional affiliations.

