
Quantitative Evaluation of Ecological Stress Caused by Land Use Transitions Considering the Location of Incremental Construction Lands: The Case of Southern Jiangsu in Yangtze River Delta Region


Abstract
:1. Introduction
2. Methodology
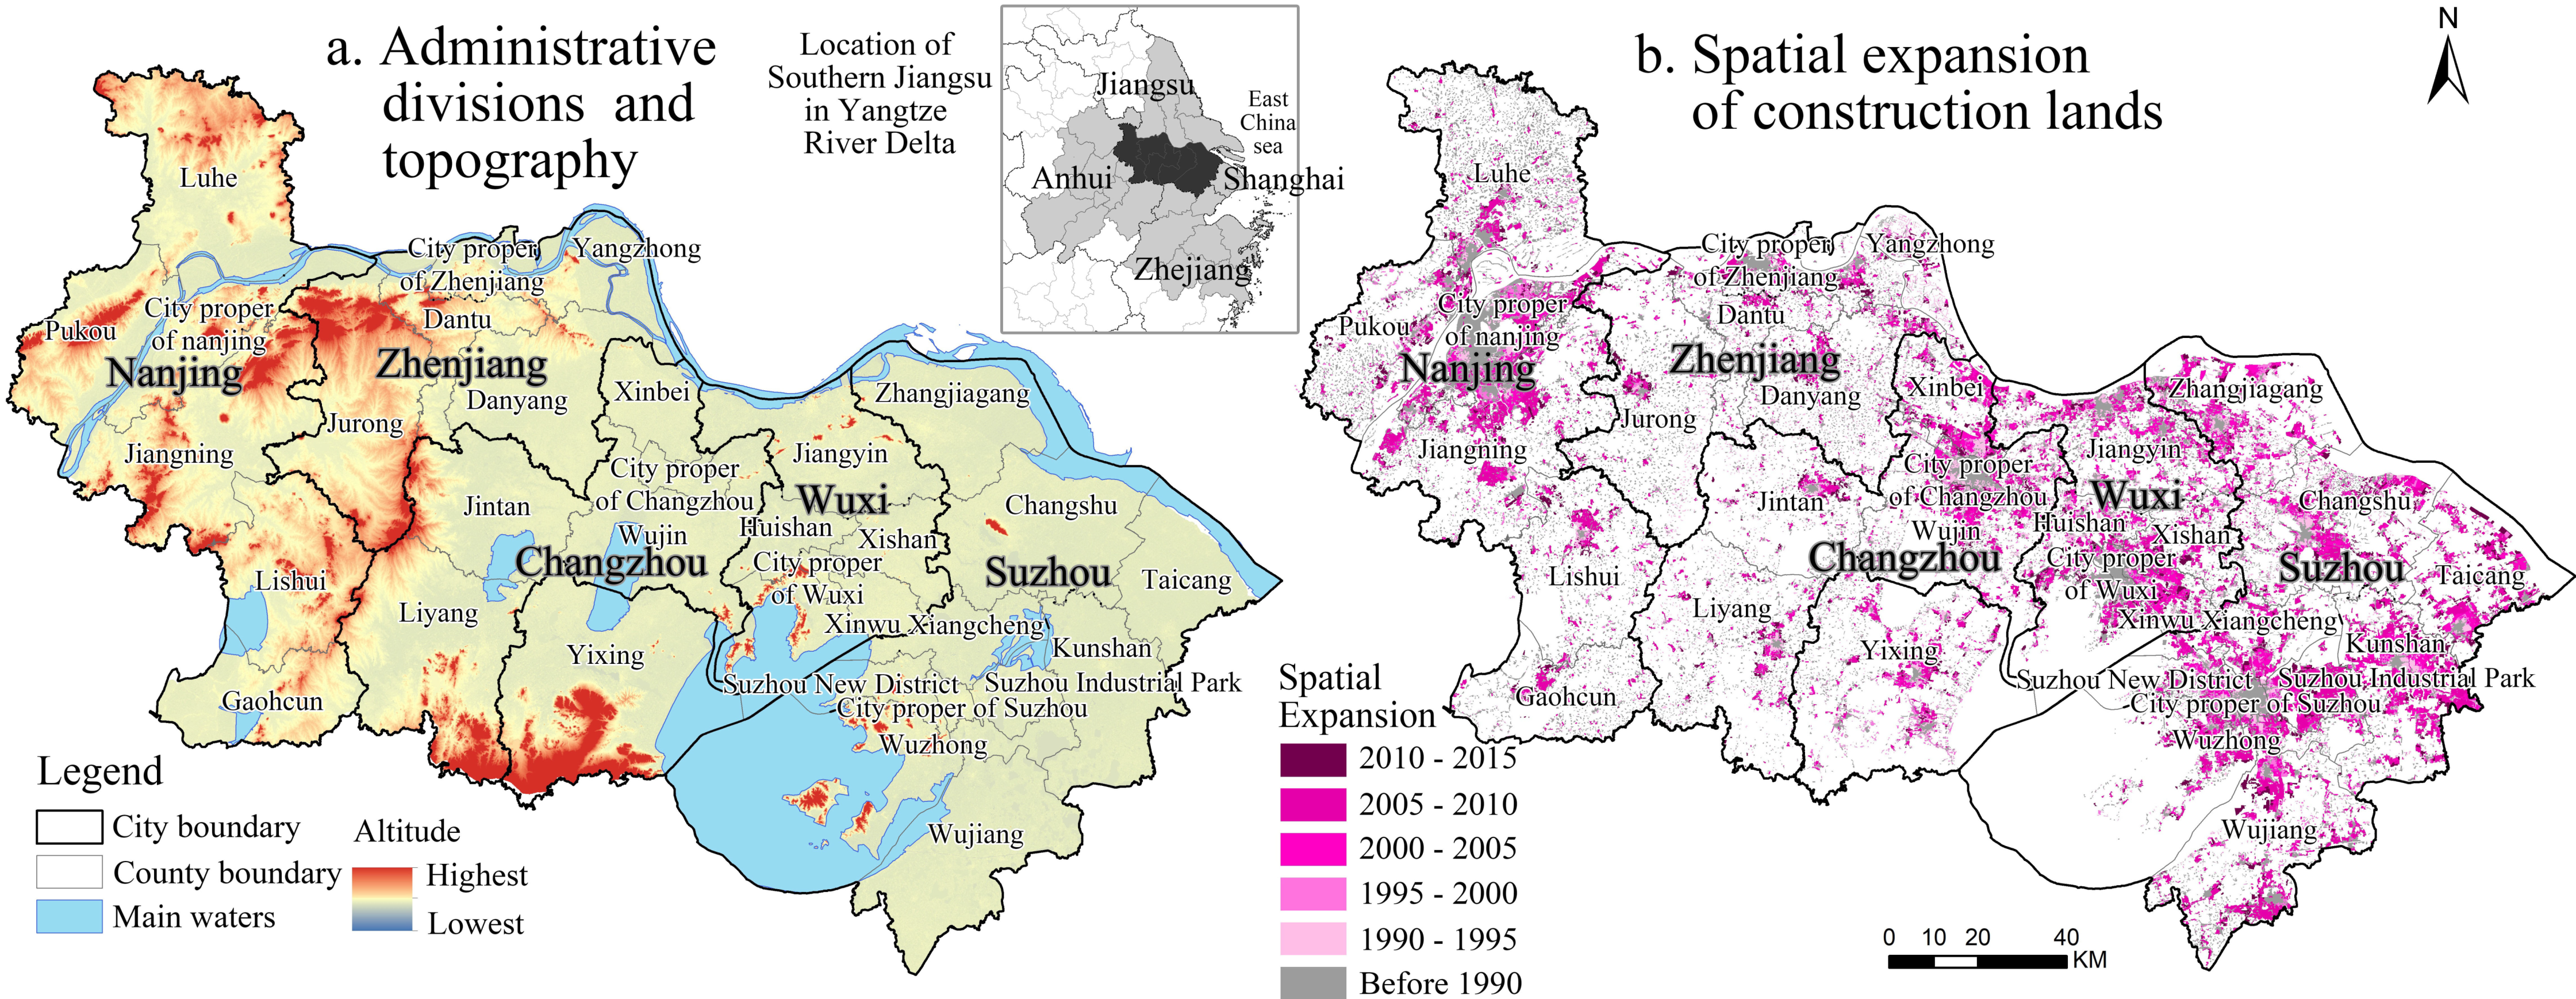
2.1. Study Area
2.2. Methodologies and Data
2.2.1. Model Description for Ecological Process Simulations
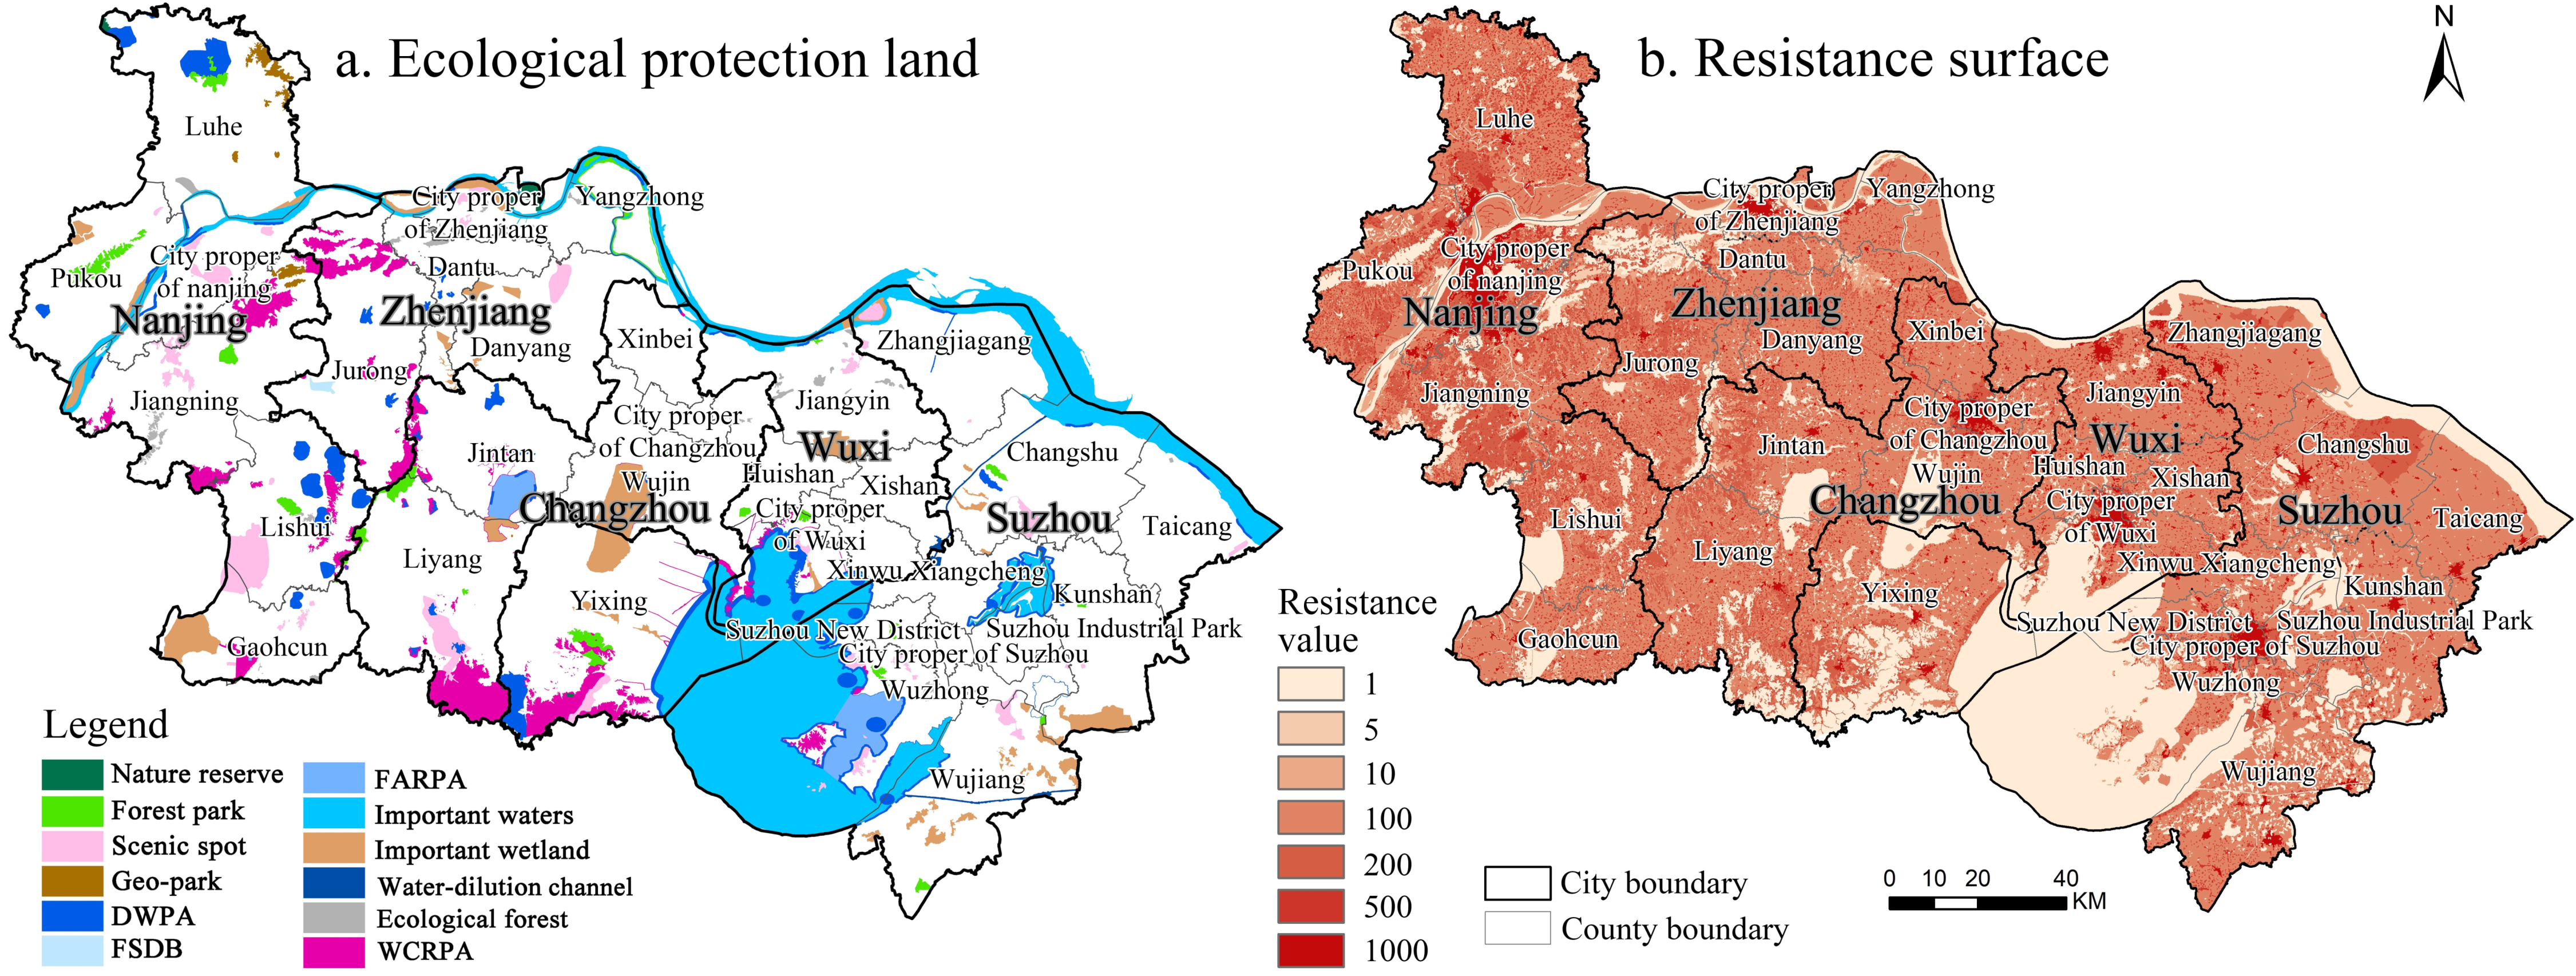
2.2.2. Model Variables
2.2.3. Recognition of Construction Lands with Different Ecological Stress Levels
2.2.4. Calculation of County-Level Ecological Stress
2.2.5. County-Level Zoning Based on Both the Area and Ecological Stress Level of Incremental Construction Lands
2.2.6. Data Source and Processing
3. Results
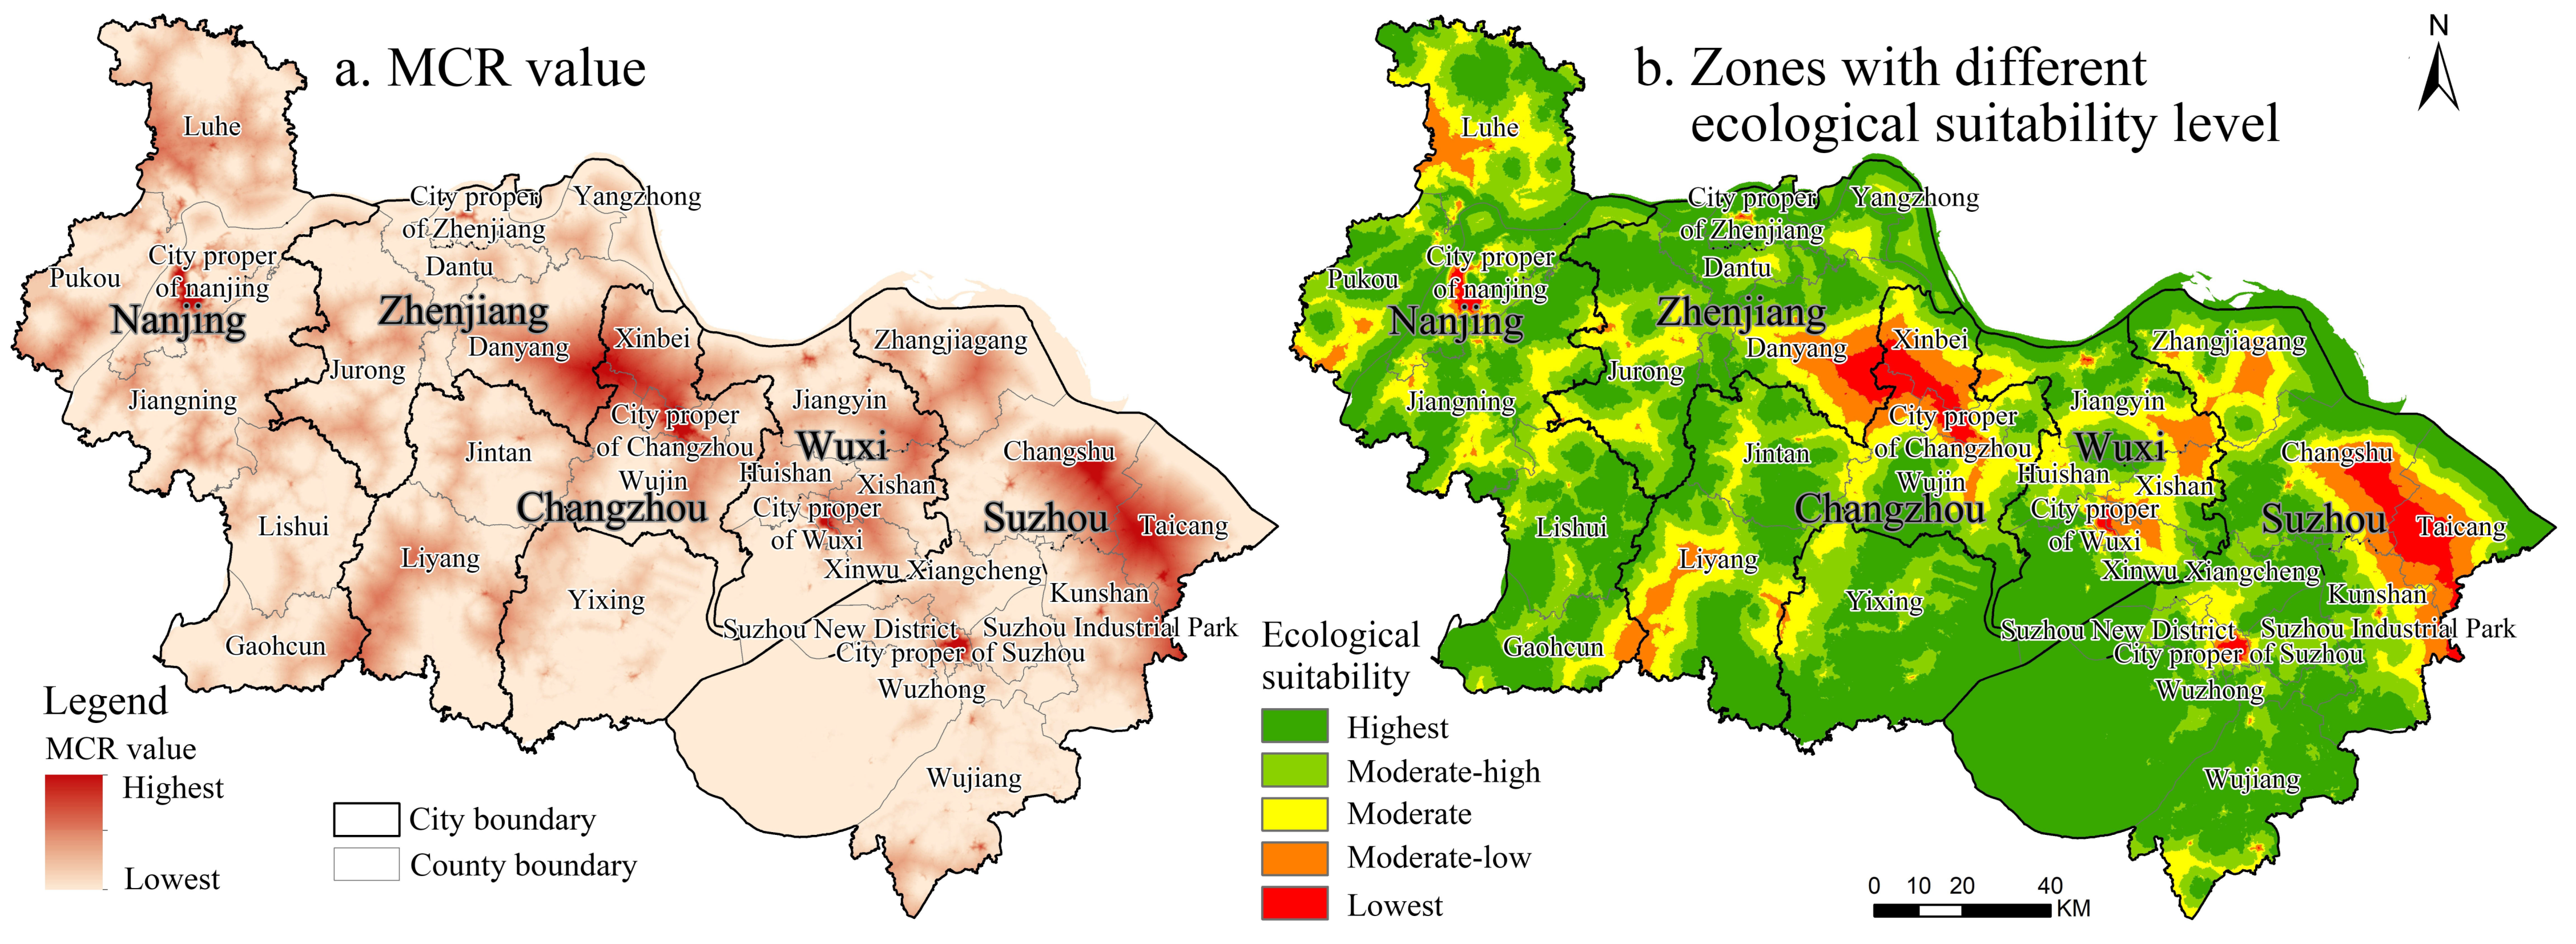
3.1. Spatial Distribution of Zones with Different Ecological Suitability Levels
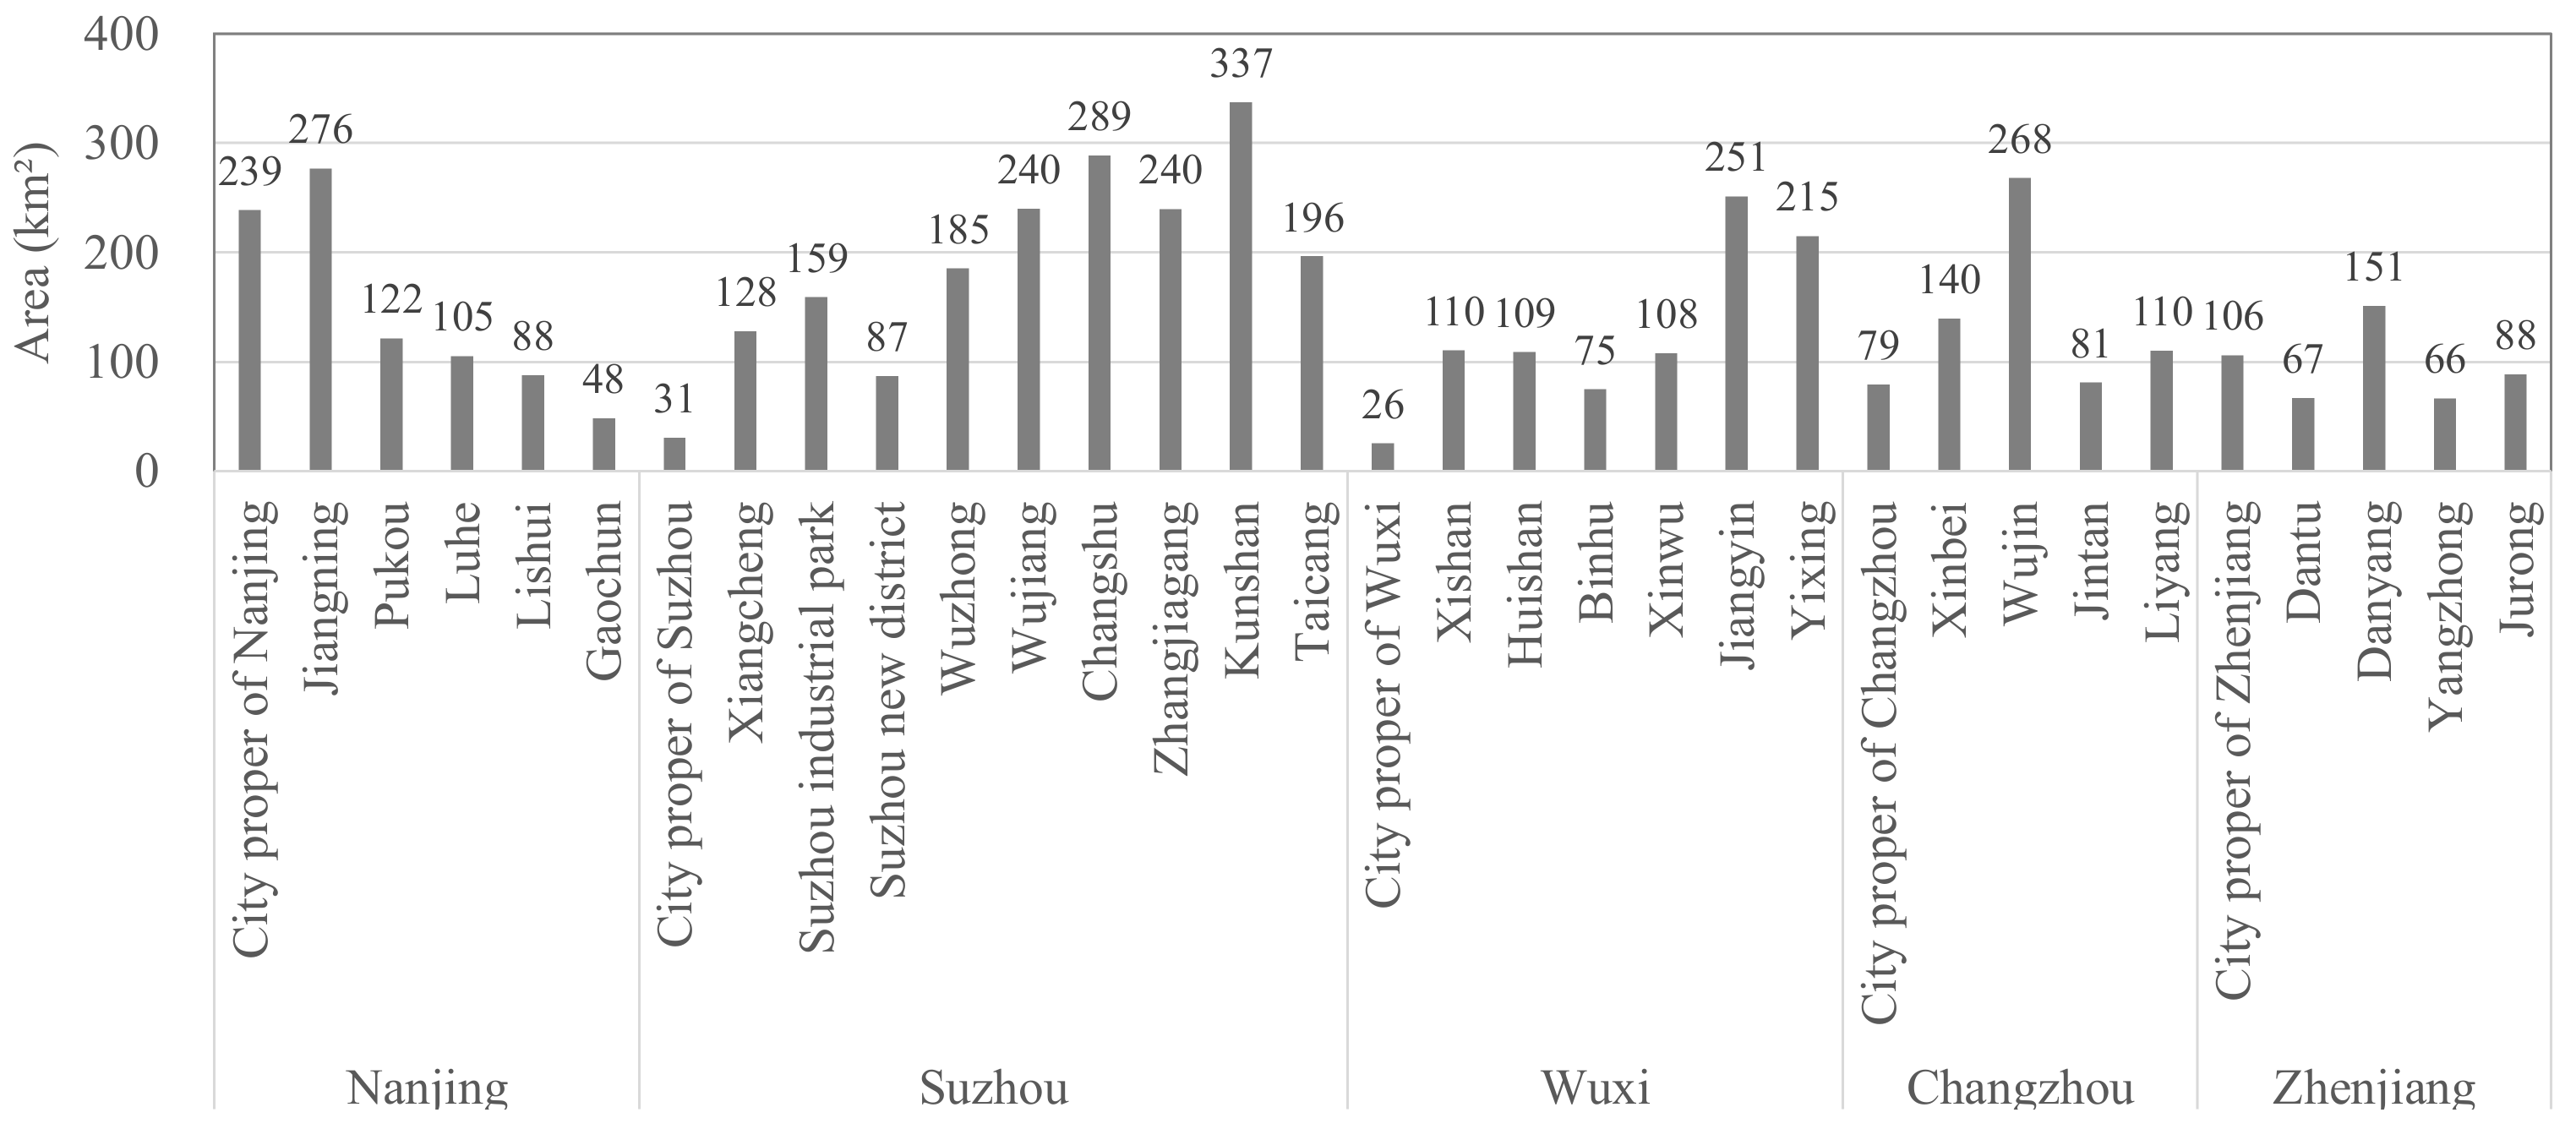
3.2. Spatial Distribution of Incremental Construction Lands
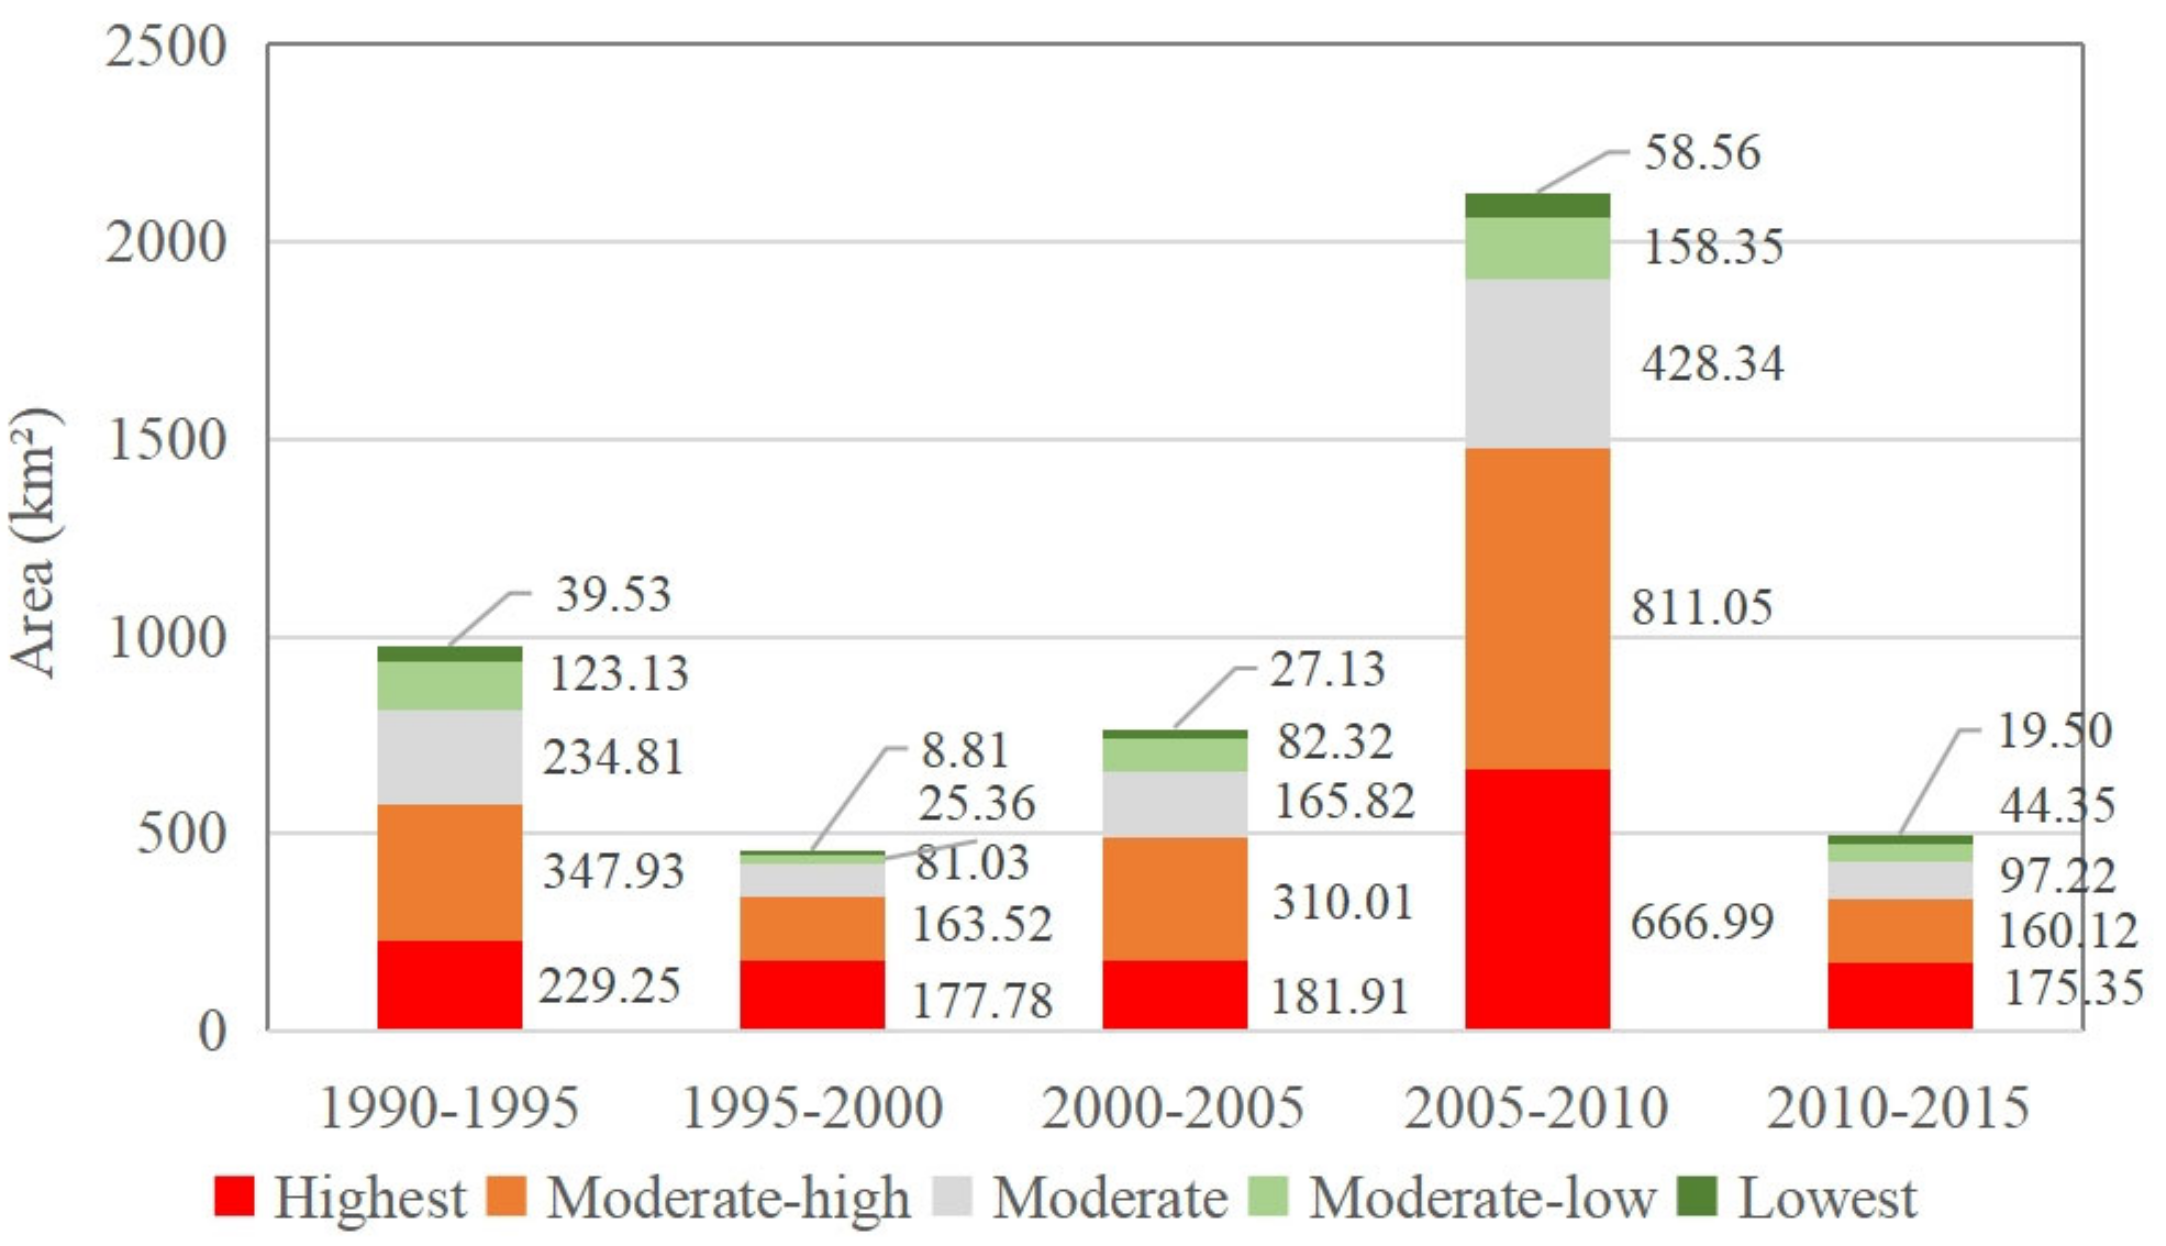
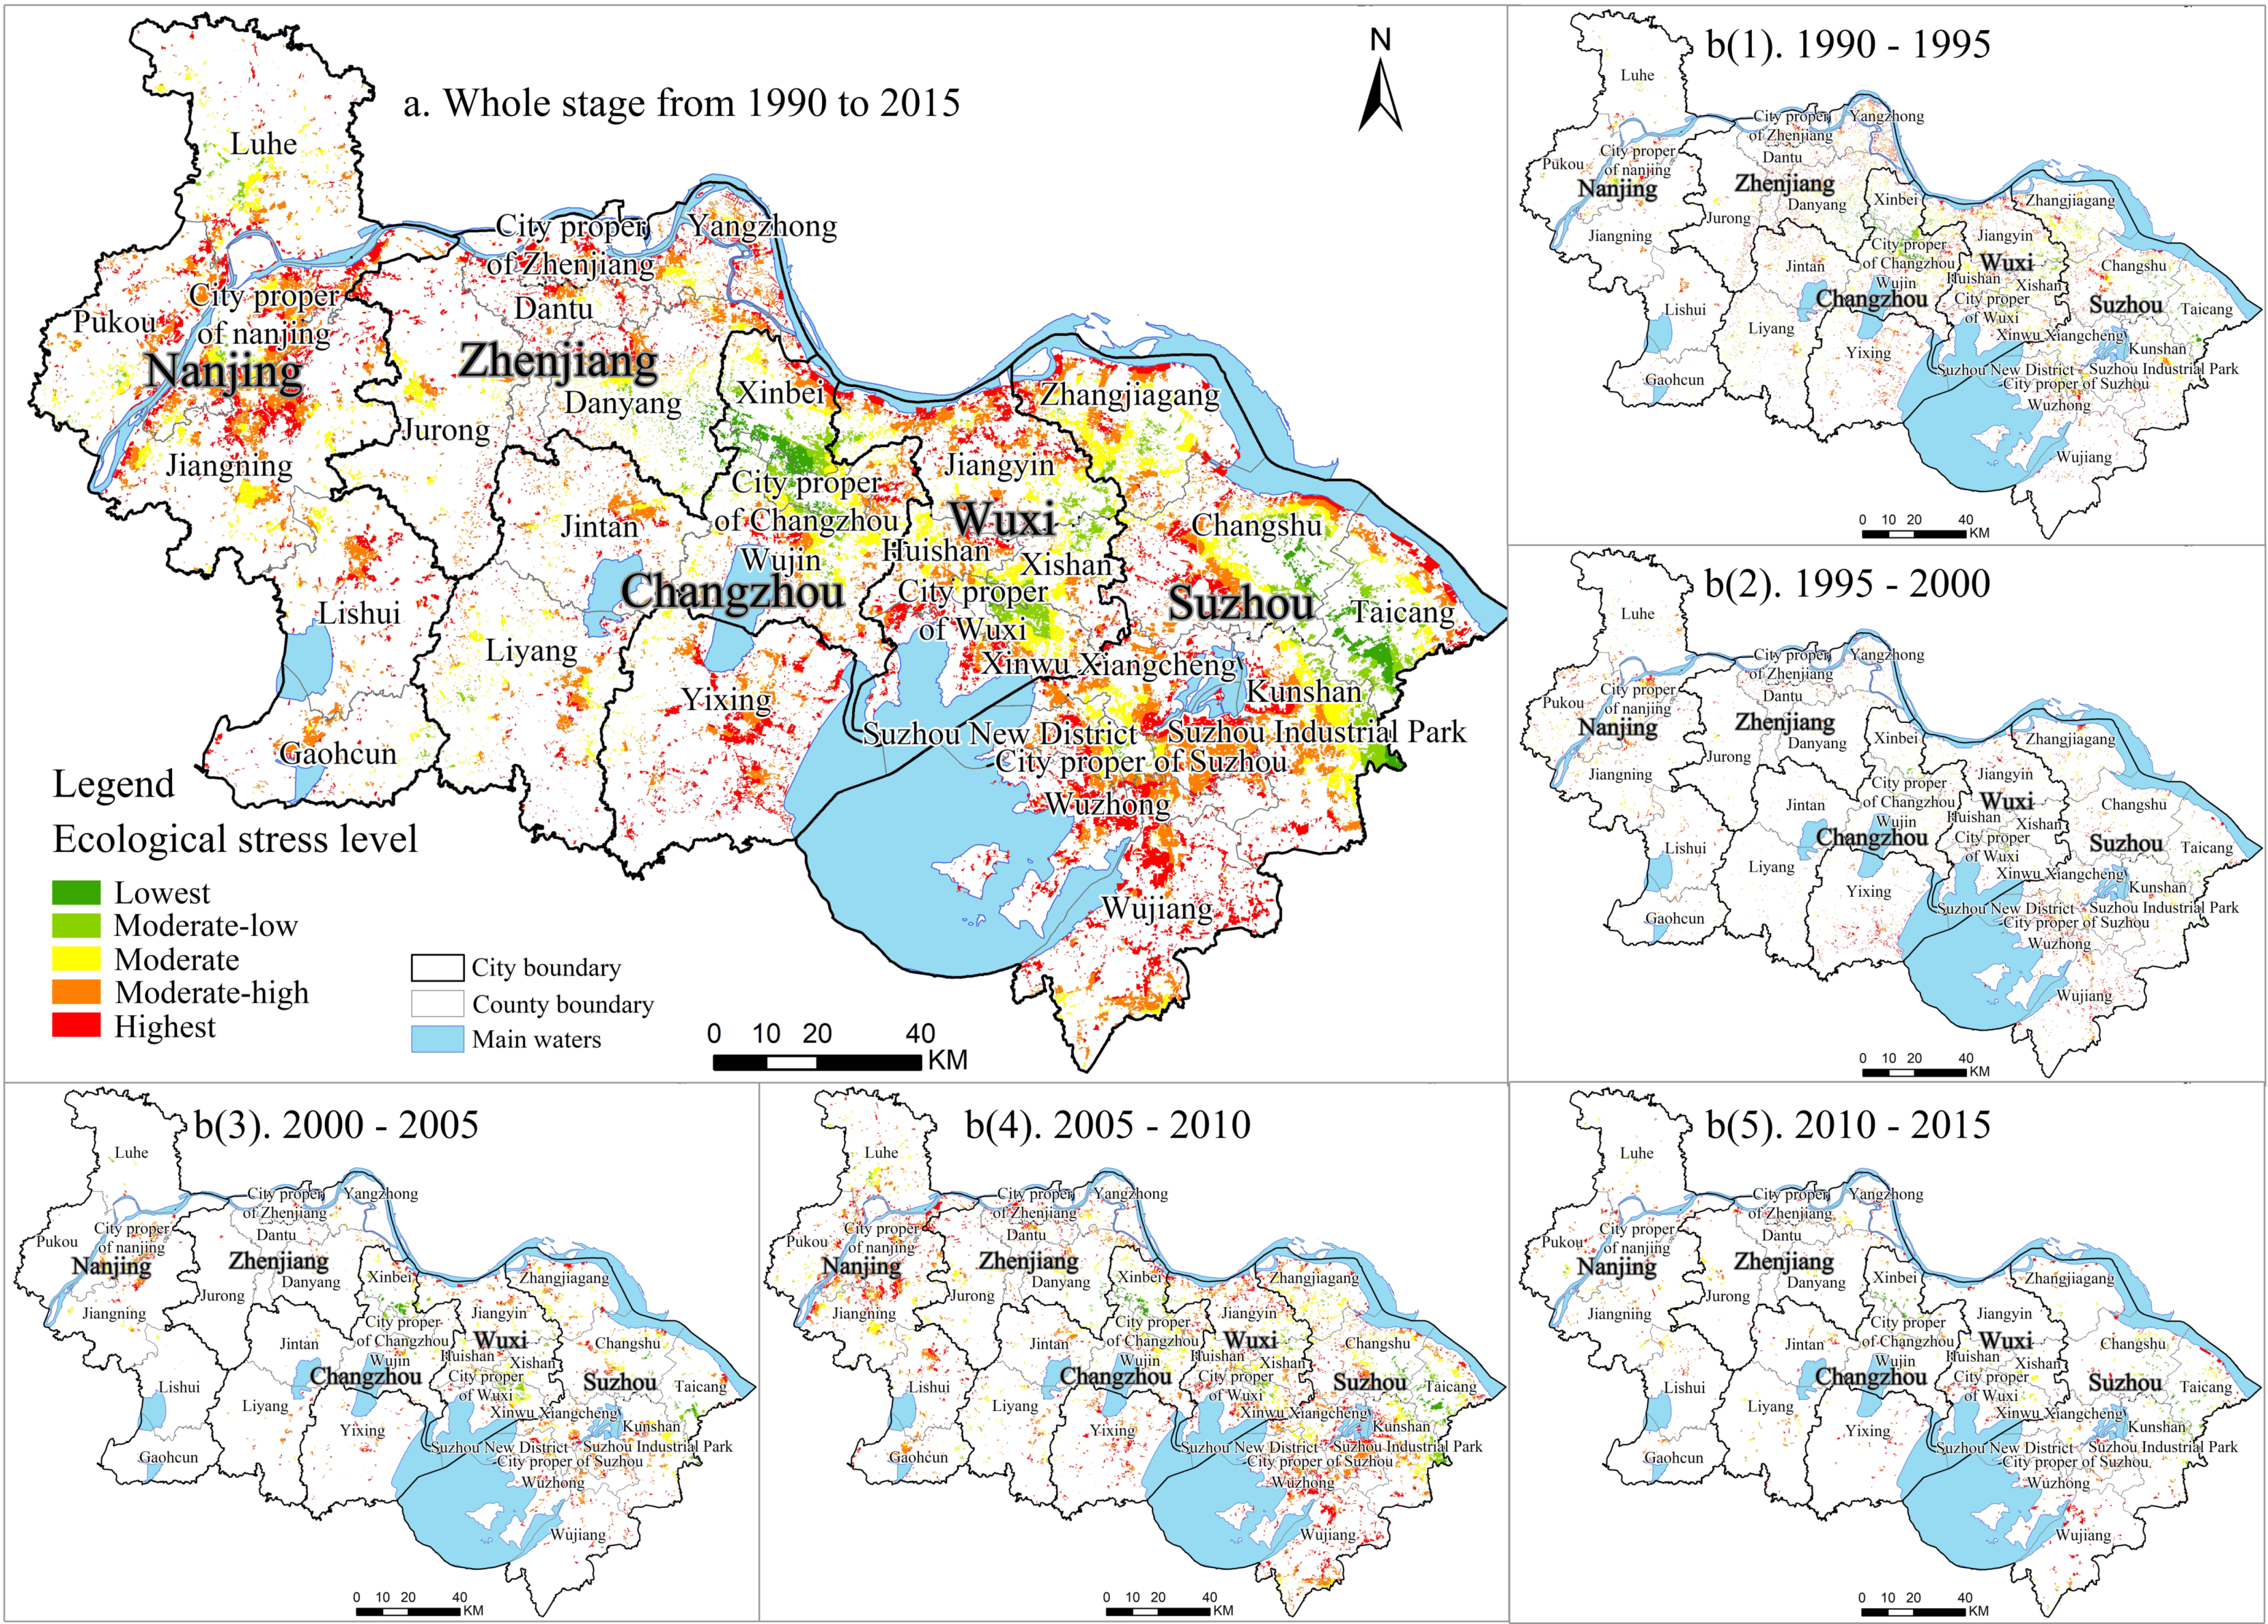
3.3. Spatial Differentiation of Incremental Construction Lands with Different Ecological Stress Levels
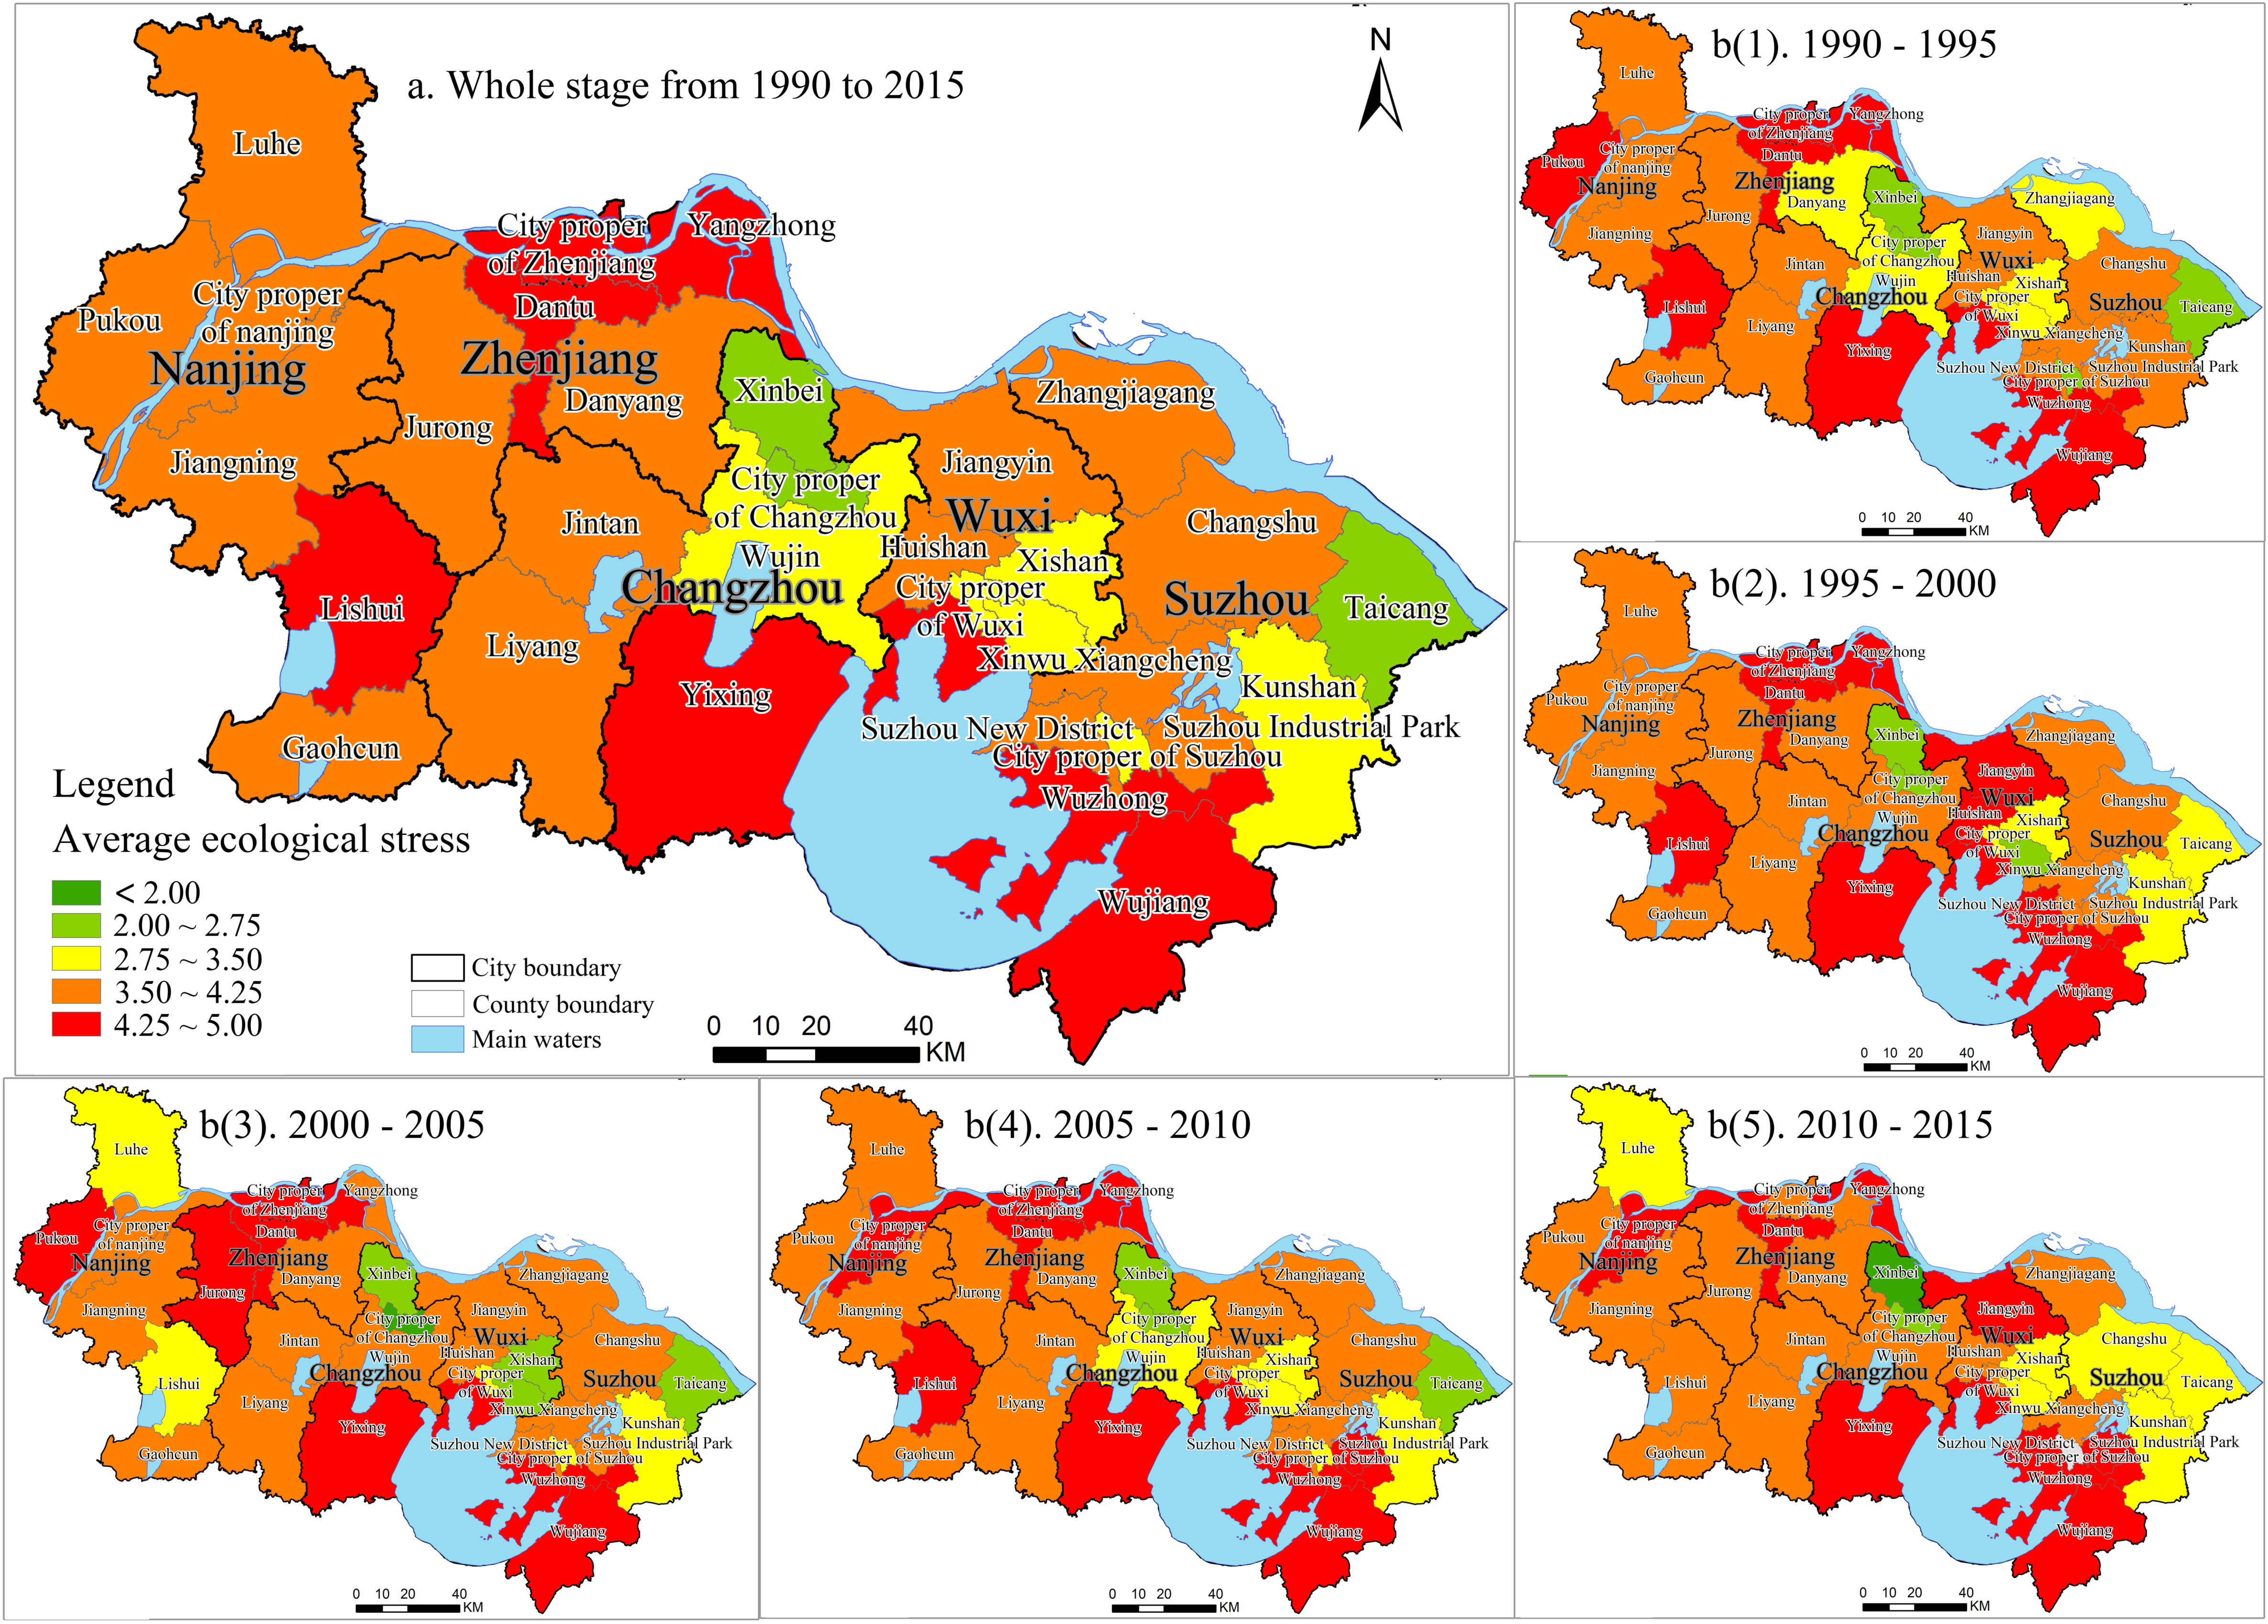
3.4. Patterns of Units with Different Ecological Stress Levels
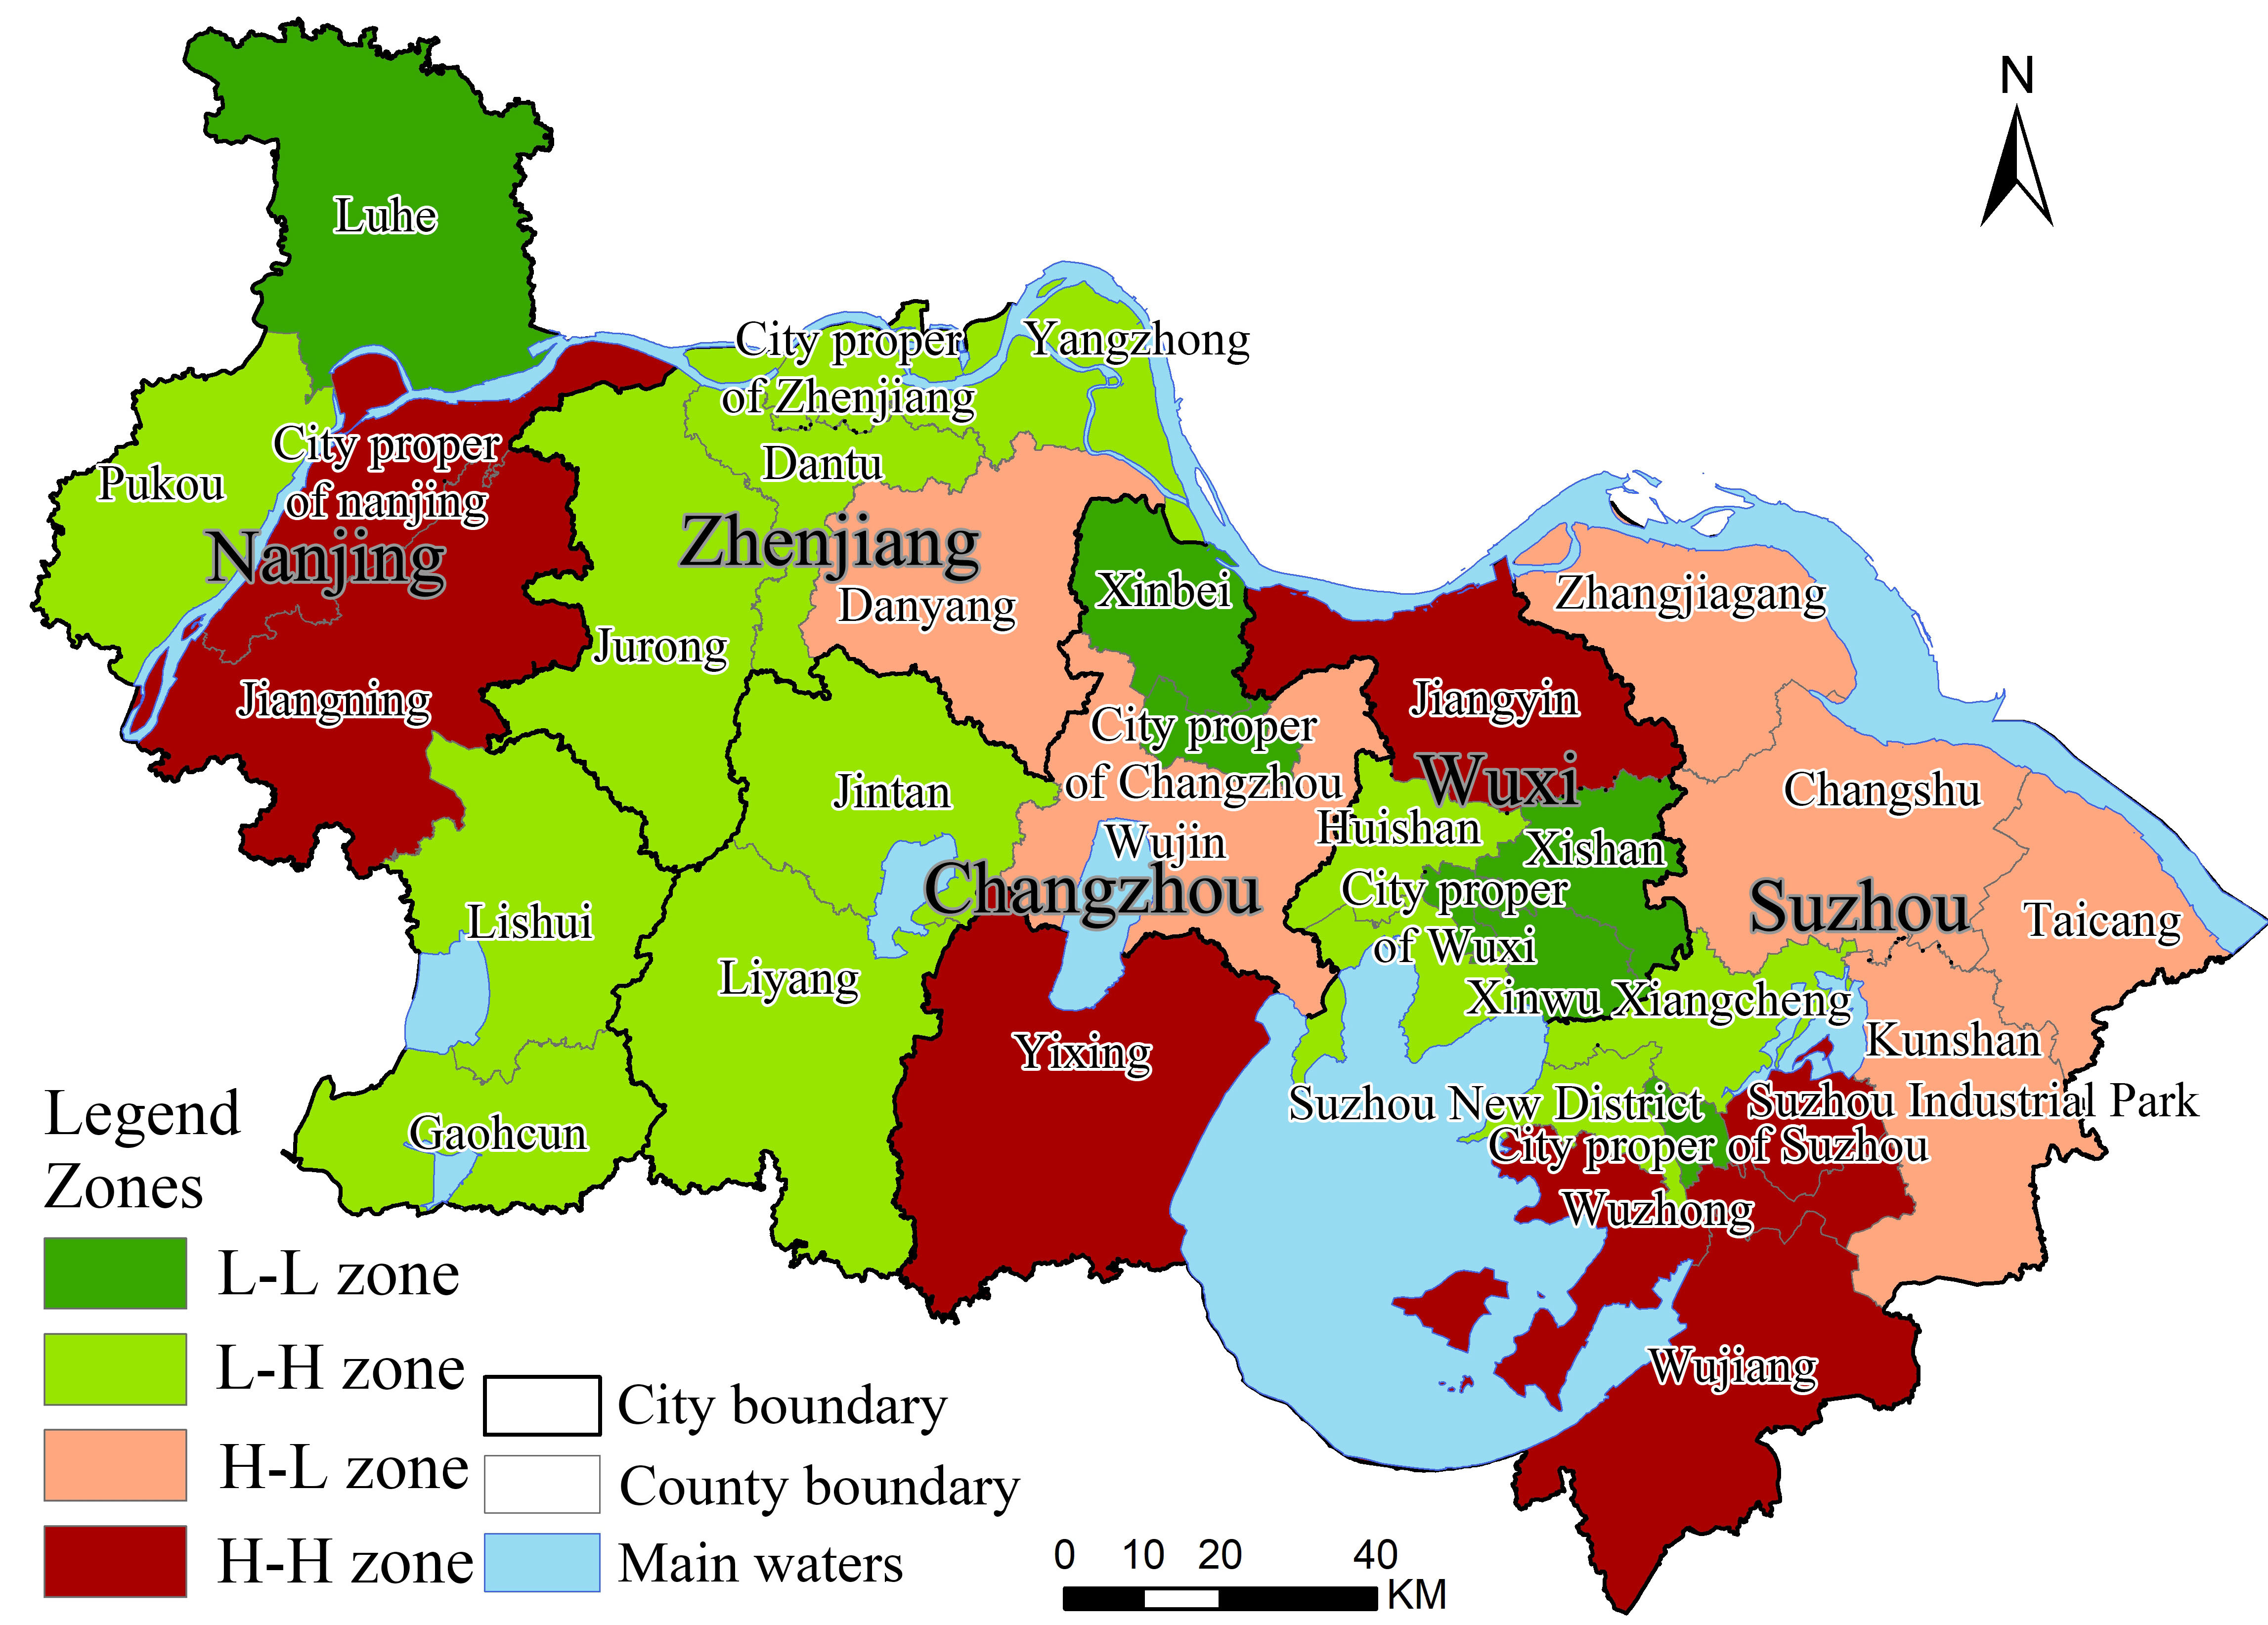
3.5. Zones with Different Amounts of and Ecological Stress Levels Associated with Incremental Construction Lands
4. Discussion
5. Conclusions
Author Contributions
Funding
Institutional Review Board Statement
Informed Consent Statement
Data Availability Statement
Conflicts of Interest
References
- Chen, M.; Gong, Y.; Lu, D.; Ye, C. Build a people-oriented urbanization: China’s new-type urbanization dream and Anhui model. Land Use Policy 2019, 80, 1–9. [Google Scholar] [CrossRef]
- Long, H.; Kong, X.; Hu, S.; Li, Y. Land Use Transitions under Rapid Urbanization: A Perspective from Developing China. Land 2021, 10, 935. [Google Scholar] [CrossRef]
- Ewing, R.; Hamidi, S.; Grace, J.B.; Wei, Y.D. Does urban sprawl hold down upward mobility? Landsc. Urban Plan. 2016, 148, 80–88. [Google Scholar] [CrossRef] [Green Version]
- Wei, Y.D.; Li, H.; Yue, W. Urban land expansion and regional inequality in transitional China. Landsc. Urban Plan. 2017, 163, 17–31. [Google Scholar] [CrossRef]
- Long, H.; Qu, Y. Land use transitions and land management: A mutual feedback perspective. Land Use Policy 2018, 74, 111–120. [Google Scholar] [CrossRef]
- Buttel, F.H. Ecological modernization as social theory. Geoforum 2000, 31, 57–65. [Google Scholar] [CrossRef]
- d’Amour, C.B.; Reitsma, F.; Baiocchi, G.; Barthel, S.; Güneralp, B.; Erb, K.H.; Haberl, H.; Creutzig, F.; Seto, K.C. Future urban land expansion and implications for global croplands. Proc. Natl. Acad. Sci. USA 2017, 114, 8939–8944. [Google Scholar] [CrossRef] [Green Version]
- Zhang, X.; Estoque, R.C.; Murayama, Y. An urban heat island study in Nanchang City, China based on land surface temperature and social-ecological variables. Sustain. Cities Soc. 2017, 32, 557–568. [Google Scholar] [CrossRef]
- Long, H.; Zhang, Y.; Ma, L.; Tu, S. Land Use Transitions: Progress, Challenges and Prospects. Land 2021, 10, 903. [Google Scholar] [CrossRef]
- Liu, Y.; Long, H. Land use transitions and their dynamic mechanism: The case of the Huang-Huai-Hai Plain. J. Geogr. Sci. 2016, 26, 515–530. [Google Scholar] [CrossRef] [Green Version]
- Xie, H.; Wang, W.; Zhang, X. Evolutionary game and simulation of management strategies of fallow cultivated land: A case study in Hunan province, China. Land Use Policy 2018, 71, 86–97. [Google Scholar] [CrossRef]
- Lv, L.; Li, Y.; Sun, Y. The Spatio-temporal Pattern of Regional Land Use Change and Eco-environmental Responses in Jiangsu, China. J. Resour. Ecol. 2017, 8, 268–276. [Google Scholar]
- Qiu, L.; Pan, Y.; Zhu, J.; Amable, G.S.; Xu, B. Integrated analysis of urbanization-triggered land use change trajectory and implications for ecological land management: A case study in Fuyang, China. Sci. Total Environ. 2019, 660, 209–217. [Google Scholar] [CrossRef]
- Chen, J.; Gao, J.; Chen, W. Urban land expansion and the transitional mechanisms in Nanjing, China. Habitat Int. 2016, 53, 274–283. [Google Scholar] [CrossRef]
- Gao, J.; Yuan, F. Economic transition, firm dynamics, and restructuring of manufacturing spaces in urban China: Empirical evidence from Nanjing. Prof. Geogr. 2017, 69, 505–519. [Google Scholar] [CrossRef]
- Dupras, J.; Alam, M. Urban sprawl and ecosystem services: A half century perspective in the Montreal Area (Quebec, Canada). J. Environ. Policy Plan. 2015, 17, 180–200. [Google Scholar] [CrossRef]
- Sakieh, Y.; Amiri, B.J.; Danekar, A.; Feghhi, J.; Dezhkam, S. Scenario-based evaluation of urban development sustainability: An integrative modeling approach to compromise between urbanization suitability index and landscape pattern. Environ. Dev. Sustain. 2015, 17, 1343–1365. [Google Scholar] [CrossRef]
- Estoque, R.C.; Murayama, Y. Quantifying landscape pattern and ecosystem service value changes in four rapidly urbanizing hill stations of Southeast Asia. Landsc. Ecol. 2016, 31, 1481–1507. [Google Scholar] [CrossRef]
- Li, P.; Gao, J.; Chen, J. Quantitative assessment of ecological stress of construction lands by quantity and location: Case study in Southern Jiangsu, Eastern China. Environ. Dev. Sustain. 2020, 22, 1559–1578. [Google Scholar] [CrossRef]
- Song, X. Discussion on land use transition research framework. Acta Geogr. 2017, 72, 471–487. [Google Scholar]
- Long, H.; Qu, Y.; Tu, S.; Zhang, Y.; Jiang, Y. Development of land use transitions research in China. J. Geogr. Sci. 2020, 30, 1195–1214. [Google Scholar] [CrossRef]
- Gong, J.; Chen, W.; Liu, Y.; Wang, J. The intensity change of urban development land: Implications for the city master plan of Guangzhou, China. Land Use Policy 2014, 40, 91–100. [Google Scholar] [CrossRef]
- Lambin, E.F.; Rounsevell, M.D.A.; Geist, H.J. Are agricultural land-use models able to predict changes in land-use intensity? Agric. Ecosyst. Environ. 2000, 82, 321–331. [Google Scholar] [CrossRef]
- Fan, J.; Sun, W.; Zhou, K.; Chen, D. Major function oriented zone: New method of spatial regulation for reshaping regional development pattern in China. Chin. Geogr. Sci. 2012, 22, 196–209. [Google Scholar] [CrossRef]
- Yu, K. Landscape ecological security patterns in biological conservation. Acta Ecol. Sin. 1999, 19, 8–15. [Google Scholar]
- Li, P.; Cao, H. Comprehensive assessment on the ecological stress of rapid land urbanization per proportion, intensity, and location. Ecosyst. Health Sustain. 2019, 5, 242–255. [Google Scholar] [CrossRef] [Green Version]
- Forman, R.T.T. Some general principles of landscape and regional ecology. Landsc. Ecol. 1995, 10, 133–142. [Google Scholar] [CrossRef]
- Brooks, T. Conservation planning and priorities. In Conservation Biology for All; Sodhi, N.S., Ehrlich, P.R., Eds.; Oxford University Press: Oxford, UK, 2010. [Google Scholar]
- Clark, M.R.; Rowden, A.A.; Schlacher, T.A.; Guinotte, J.; Dunstan, P.K.; Williams, A.; O’Hara, T.D.; Watling, L.; Niklitschek, E.; Tsuchida, S. Identifying Ecologically or Biologically Significant Areas (EBSA): A systematic method and its application to seamounts in the South Pacific Ocean. Ocean Coast. Manag. 2014, 91, 65–79. [Google Scholar] [CrossRef]
- del Carmen Sabatini, M.; Verdiell, A.; Iglesias, R.M.R.; Vidal, M. A quantitative method for zoning of protected areas and its spatial ecological implications. J. Environ. Manag. 2007, 83, 198–206. [Google Scholar] [CrossRef]
- Xu, K.; Wang, J.; Wang, J.; Wang, X.; Chi, Y.; Zhang, X. Environmental function zoning for spatially differentiated environmental policies in China. J. Environ. Manag. 2020, 255, 109485. [Google Scholar] [CrossRef]
- Johnson, M.P. Environmental impacts of urban sprawl: A survey of the literature and proposed research agenda. Environ. Plan. A 2001, 33, 717–735. [Google Scholar] [CrossRef] [Green Version]
- Wu, J.; Yang, J. (Eds.) Lectures in Modern Ecology (IV): Theory and Applications; Higher Education Press: Beijing, China, 2009. [Google Scholar]
- Ricklesfs, R.E.; Naveh, Z.; Turner, R.E. Conservation of ecological processes. Environmentalist 1984, 4, 6–16. [Google Scholar] [CrossRef]
- Dronova, I. Environmental heterogeneity as a bridge between ecosystem service and visual quality objectives in management, planning and design. Landsc. Urban Plan. 2017, 163, 90–106. [Google Scholar] [CrossRef]
- Chen, W.; Sun, W.; Duan, X.; Chen, J. Regionalization of regional potential development in Suzhou City. Acta Geogr. Sin. 2006, 6, 839–846. [Google Scholar]
- Ustaoglu, E.; Aydınoglu, A.C. Suitability evaluation of urban construction land in Pendik district of Istanbul, Turkey. Land Use Policy. 2020, 99, 104783. [Google Scholar] [CrossRef]
- Liu, Y.; Chen, B. The study framework of land use/cover change based on sustainable development in China. Geogr. Res. 2002, 21, 324–341. [Google Scholar]
- Li, P.; Chen, D.; Fan, J. Research of Ecological Occupiability Based on Least-cost Distance Model: A Case Study on Xijiang River Economic Belt in Guangxi. J. Nat. Resour. 2011, 26, 227–236. [Google Scholar]
- Zhang, B.; Zhang, Q.; Feng, Q.; Cui, B.; Zhang, S. Simulation of the spatial stresses due to territorial land development on Yellow River Delta Nature Reserve using a GIS-based assessment model. Environ. Monit. Assess. 2017, 189, 331. [Google Scholar] [CrossRef] [PubMed]
- Boori, M.S.; Amaro, V.E. Natural and eco-environmental vulnerability assessment through multi-temporal satellite data sets in Apodi valley region, Northeast Brazil. J. Geogr. Regional Plan. 2011, 4, 216–230. [Google Scholar]
- Liao, X.; Li, W.; Hou, J. Application of GIS based ecological vulnerability evaluation in environmental impact assessment of master plan of Coal Mining Area. Procedia Environ. Sci. 2013, 18, 271–276. [Google Scholar] [CrossRef] [Green Version]
- Xiang, Y.; Meng, J. Research into ecological suitability zoning and expansion patterns in agricultural oases based on the landscape process: A case study in the middle reaches of the Heihe River. Environ. Earth Sci. 2016, 75, 1355. [Google Scholar] [CrossRef]
- Bélisle, M. Measuring landscape connectivity: The challenge of behavioral landscape ecology. Ecology 2005, 86, 1988–1995. [Google Scholar] [CrossRef] [Green Version]
- Lechner, A.M.; Sprod, D.; Carter, O.; Lefroy, E.C. Characterising landscape connectivity for conservation planning using a dispersal guild approach. Landsc. Ecol. 2017, 32, 99–113. [Google Scholar] [CrossRef]
- Jongman, R.H.G. Nature conservation planning in Europe: Developing ecological networks. Landsc. Urban Plan. 1995, 32, 169–183. [Google Scholar] [CrossRef]
- Li, X.; Yeh, A.G.-O. Modelling sustainable urban development by the integration of constrained cellular automata and GIS. Int. J. Geogr. Inf. Sci. 2000, 14, 131–152. [Google Scholar] [CrossRef]
- Adriaensen, F.; Chardon, J.P.; De Blust, G.; Swinnen, E.; Villalba, S.; Gulinck, H.; Matthysen, E. The application of “least-cost” modelling as a functional landscape model. Landsc. Urban Plan. 2003, 64, 233–247. [Google Scholar] [CrossRef]
- Gurrutxaga, M.; Lozano, P.G.; Barrio, G.D. GIS-based approach for incorporating the connectivity of ecological networks into regional planning. J. Nat. Conserv. 2010, 18, 318–326. [Google Scholar] [CrossRef]
- Schadt, S.; Knauer, F.; Kaczensky, P.; Revilla, E.; Wiegand, T.; Trepl, L. Rule-based assessment of suitable habitat and patch connectivity for Eurasian Lynx in Germany. Ecol. Appl. 2002, 12, 1469–1483. [Google Scholar] [CrossRef]
- Ye, Y.; Su, Y.; Zhang, H.; Liu, K.; Wu, Q. Construction of an ecological resistance surface model and its application in urban expansion simulations. J. Geogr. Sci. 2015, 25, 211–224. [Google Scholar] [CrossRef]
- Su, Y.; Chen, X.; Liao, J.; Zhang, H.; Wang, C.; Ye, Y.; Wang, Y. Modeling the optimal ecological security pattern for guiding the urban constructed land expansions. Urban For. Urban Green. 2016, 19, 35–46. [Google Scholar] [CrossRef]
- Liu, X.; Shu, J.; Zhang, L. Research on applying minimal cumulative resistance model in urban land ecological suitability assessment: As an example of Xiamen City. Acta Ecol. Sin. 2010, 30, 421–428. [Google Scholar]
- Chen, L.; Fu, B.; Xu, J.; Gong, J. Location-weighted landscape contrast index: A scale independent approach for landscape pattern evaluation based on “source-sink” ecological processes. Acta Ecol. Sin. 2003, 23, 2406–2413. [Google Scholar]
- Zank, B.; Bagstad, K.J.; Voig, B.; Villa, F. Modeling the effects of urban expansion on natural capital stocks and ecosystem service flows: A case study in the Puget Sound, Washington, USA. Landsc. Urban Plan. 2016, 149, 31–42. [Google Scholar] [CrossRef]
- Wei, Y.D. Beyond New Regionalism, Beyond Global Production Networks: Remaking the Sunan Model, China. Environ. Plan. C 2010, 28, 72–96. [Google Scholar] [CrossRef] [Green Version]
- Li, P.; Sun, W. Pattern and driving mechanisms of urban expansion of Southern Jiangsu province since Reform and Opening-up. Resour. Environ. Yangtze Val. 2013, 22, 1529–1536. [Google Scholar]
- Wu, C.; Chen, B.; Huang, X.; Dennis Wei, Y.H. Effect of land-use change and optimization on the ecosystem service values of Jiangsu province, China. Ecol. Indic. 2020, 117, 106507. [Google Scholar] [CrossRef]
- Li, F.; Ye, Y.; Song, B.; Wang, R. Evaluation of urban suitable ecological land based on the minimum cumulative resistance model: A case study from Changzhou, China. Ecol. Model. 2015, 318, 194–203. [Google Scholar] [CrossRef]
- Knaapen, J.P.; Scheffer, M.; Harms, B. Estimating habitat isolation in landscape planning. Landsc. Urban Plan. 1992, 23, 1–16. [Google Scholar] [CrossRef]
- Yu, K. Security patterns and surface model in landscape ecological planning. Landsc. Urban Plan. 1996, 36, 1–17. [Google Scholar] [CrossRef]
- Fan, J. The Strategy of Major Function Oriented Zoning (MFOZ) and the Optimization of Territorial Development Patterns. Bull. Chin. Acad. Sci. 2013, 33, 193–206. [Google Scholar]
- Villalba, S.; Gulinck, H.; Verbeylen, G.; Matthysen, E. Relationship between patch connectivity and the occurrence of the European red squirrel, Sciurus vulgaris, in forest fragments within heterogeneous landscapes. In Key Concepts in Landscape Ecology; Dover, J.W., Bunce, R.G.H., Eds.; International Association for Landscape Ecology: Preston, UK, 1998. [Google Scholar]
- Long, H.; Liu, Y.; Hou, X.; Li, T.; Li, Y. Effects of land use transitions due to rapid urbanization on ecosystem services: Implications for urban planning in the new developing area of China. Habitat Int. 2014, 44, 536–544. [Google Scholar] [CrossRef]
- Peng, J.; Tian, L.; Liu, Y.; Zhao, M.; Hu, Y.; Wu, J. Ecosystem services response to urbanization in metropolitan areas: Thresholds identification. Sci. Total Environ. 2017, 607–608, 706–714. [Google Scholar] [CrossRef]
- Foley, J.A.; DeFries, R.; Asner, G.P.; Barford, C.; Bonan, G.; Carpenter, S.R.; Chapin, F.S.; Coe, M.T.; Daily, G.C.; Gibbs, H.K.; et al. Global consequences of land use. Science 2005, 309, 570–574. [Google Scholar] [CrossRef] [PubMed] [Green Version]
- Dadashpoor, H.; Azizi, P.; Moghadasi, M. Land use change, urbanization, and change in landscape pattern in a metropolitan area. Sci. Total Environ. 2019, 655, 707–719. [Google Scholar] [CrossRef]
- He, C.; Tian, J.; Shi, P.; Hu, D. Simulation of the spatial stress due to urban expansion on the wetlands in Beijing, China using a GIS-based assessment model. Landsc. Urban Plan. 2011, 101, 269–277. [Google Scholar] [CrossRef]
- Pascual-Hortal, L.; Saura, S. Comparison and development of new graph-based landscape connectivity indices: Towards the priorization of habitat patches and corridors for conservation. Landsc. Ecol. 2006, 21, 959–967. [Google Scholar] [CrossRef]
- Brost, B.M.; Beier, P. Comparing linkage designs based on land facets to linkage designs based on focal species. PLoS ONE 2012, 7, e48965. [Google Scholar] [CrossRef] [PubMed] [Green Version]
- Zhang, L.; Wu, C.; Yao, S. The Characters of Urban Land Expansion in Southern Jiangsu Province and Its Problems. Prog. Geogr. 2003, 22, 639–645. [Google Scholar]
- Qin, X.H. Scoping and planning of the limited development zone in southern Jiangsu developed areas: An case study of southern Jiangyin no developing zone planning. Geogr. Res. 2014, 33, 1728–1735. [Google Scholar]
- Sun, X.; Xiong, S.; Zhu, X.; Zhu, X.; Li, Y.; Li, B.L. A new indices system for evaluating ecological-economic-social performances of wetland restorations and its application to Taihu Lake Basin, China. Ecol. Model. 2015, 295, 216–226. [Google Scholar] [CrossRef]
- Li, P.; Chen, C. Ecological vulnerability assessment of economic developed region based on VSD model: The case of Taihu basin. Ecol. Environ. Sci. 2014, 23, 237–243. [Google Scholar]
- Shi, Y.; Cao, X.; Fu, D.; Wang, Y. Comprehensive value discovery of Land Consolidation Projects: An empirical analysis of Shanghai, China. Sustainability 2018, 10, 2039. [Google Scholar] [CrossRef] [Green Version]
- Liu, Y.; Fang, F.; Li, Y. Key issues of land use in China and implications for policy making. Land Use Policy 2014, 40, 6–12. [Google Scholar] [CrossRef]

| Stage | Lowest <2.00 | Moderate-Low 2.00~2.75 | Moderate 2.75~3.50 | Moderate-High 3.50~4.25 | Highest 4.25~5.00 |
|---|---|---|---|---|---|
| 1990–1995 | 0 | 4 | 6 | 14 | 9 |
| 1995–2000 | 0 | 3 | 4 | 15 | 11 |
| 2000–2005 | 1 | 4 | 5 | 15 | 8 |
| 2005–2010 | 0 | 3 | 6 | 14 | 10 |
| 2010–2015 | 2 | 1 | 6 | 14 | 10 |
| Total | 0 | 3 | 6 | 16 | 8 |
Publisher’s Note: MDPI stays neutral with regard to jurisdictional claims in published maps and institutional affiliations. |
© 2022 by the authors. Licensee MDPI, Basel, Switzerland. This article is an open access article distributed under the terms and conditions of the Creative Commons Attribution (CC BY) license (https://creativecommons.org/licenses/by/4.0/).
Share and Cite
Li, P.; Liu, C.; Cao, H. Quantitative Evaluation of Ecological Stress Caused by Land Use Transitions Considering the Location of Incremental Construction Lands: The Case of Southern Jiangsu in Yangtze River Delta Region. Land 2022, 11, 175. https://doi.org/10.3390/land11020175
Li P, Liu C, Cao H. Quantitative Evaluation of Ecological Stress Caused by Land Use Transitions Considering the Location of Incremental Construction Lands: The Case of Southern Jiangsu in Yangtze River Delta Region. Land. 2022; 11(2):175. https://doi.org/10.3390/land11020175
Chicago/Turabian StyleLi, Pingxing, Chonggang Liu, and Hui Cao. 2022. "Quantitative Evaluation of Ecological Stress Caused by Land Use Transitions Considering the Location of Incremental Construction Lands: The Case of Southern Jiangsu in Yangtze River Delta Region" Land 11, no. 2: 175. https://doi.org/10.3390/land11020175
APA StyleLi, P., Liu, C., & Cao, H. (2022). Quantitative Evaluation of Ecological Stress Caused by Land Use Transitions Considering the Location of Incremental Construction Lands: The Case of Southern Jiangsu in Yangtze River Delta Region. Land, 11(2), 175. https://doi.org/10.3390/land11020175